Putting children first: Tackling lead in water at child care facilities - Environmental Defense ...
←
→
Page content transcription
If your browser does not render page correctly, please read the page content below

Putting children first: Tackling lead in water at child care facilities
Putting children first:
Tackling lead in water at
child care facilities
Authors

Lindsay A. McCormick
Chemicals and Health Project Manager

Sam C. Lovell
Health Project Specialist

Environmental Defense Fund is dedicated to protecting the environmental rights of all people,
    including the right to clean air, clean water, healthy food, and flourishing ecosystems. Guided
    by science, we work to create practical solutions that win lasting political, economic, and social
    support because they are nonpartisan, cost-effective, and fair.

    Design and production: Christina Baute

    © 2018 Environmental Defense Fund

4                 PUTTING CHILDREN FIRST: TACKLING LEAD IN WATER AT CHILD CARE FACILITIES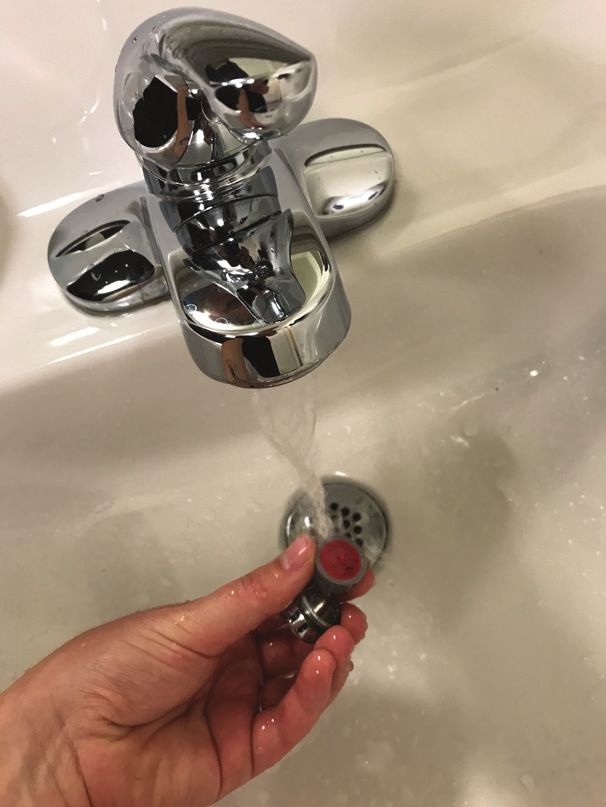
Table of contents
Executive summary                                            6

Introduction                                                  9
A critical opportunity to reduce lead exposure from water     9
How lead can get into water at child care facilities         10
Existing requirements and guidelines                         11

About EDF's pilot                                            12

Results                                                      17
What interventions were effective?                           21
Case studies on lead service line replacement                25

Novel aspects of our protocol: Lessons learned               28
Investigated and, if found, removed lead service lines       28
Used a health-based benchmark to trigger remediation         28
Used portable lead meters to screen lead levels at the tap   29
Tested hot water at tap and water heaters                    32

Recommendations                                              35

Conclusion                                                   38

Key resources                                                39

                                                             5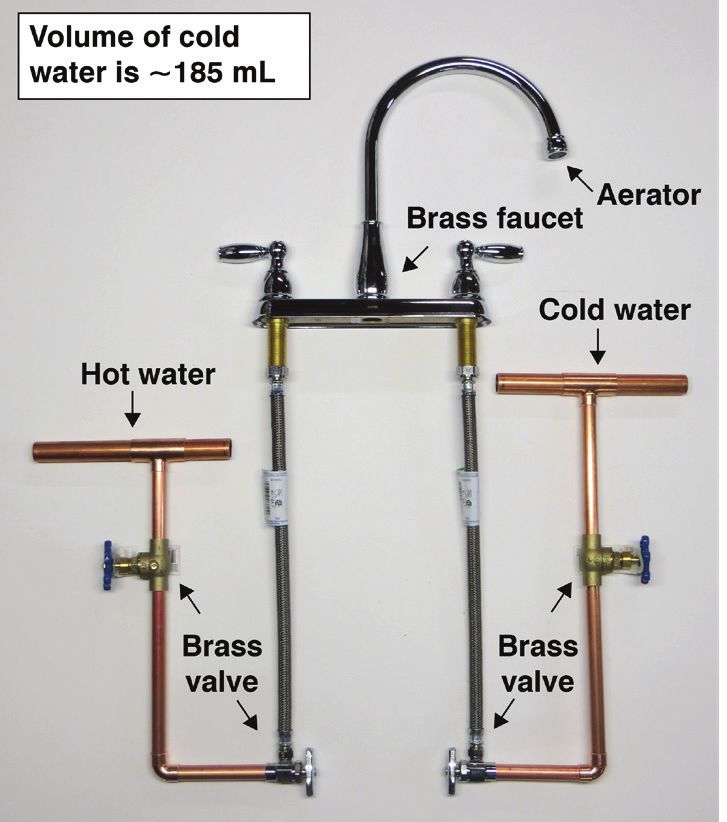
Executive summary
    There is no safe level of lead exposure.
    Lead exposure is likely to impair
    children’s normal brain development,
    contributing to learning and behavioral
    problems as well as lower IQs. Despite
    decades of progress in reducing
    children’s exposure, America continues
    to have a toxic legacy of lead. The crisis
    in Flint, Michigan, has drawn renewed
    attention to the widespread health risks
    posed by lead in water.

    Children under the age of six are most
    vulnerable to harm from lead because
    of their developing brains, and infants
    who rely on formula mixed with
    drinking water are most exposed. While
                                                    Graphic illustrates the highest lead level detected at each of 11
    reducing all exposure to lead is                child care facilities, excluding samples from non-drinking
    important, priority should be given to          sources such as utility sinks and hose bibs. Our pilot used a
                                                    health-based action level of 3.8 ppb to trigger remediation.
    child care facilities, where many young
    children spend a large portion of their days.

    However, few states require child care facilities to test for lead in their water, and the
    Environmental Protection Agency’s (EPA) voluntary “3Ts for Reducing Lead in Drinking Water”
    guidance has significant gaps in the child care setting—including an outdated action level of 20
    parts per billion (ppb). Given the critical need for more investigation in this area, Environmental
    Defense Fund (EDF) conducted a pilot project to evaluate new approaches to testing and
    remediating lead in water at child care facilities. This report provides a summary of this work
    and recommendations for best practices.

    Collaborating with local partners, we identified sources of lead in drinking water—including
    lead service lines and brass fixtures—and removed sources that posed a significant risk of
    exposure in 11 child care facilities (nine facilities in commercial buildings and two in converted
    homes). These facilities:

      • Serve a total of over 1,000 children.
      • Care primarily for children from low-income families.
      • Are located in four states: Illinois, Michigan, Mississippi, and Ohio.

6                 PUTTING CHILDREN FIRST: TACKLING LEAD IN WATER AT CHILD CARE FACILITIES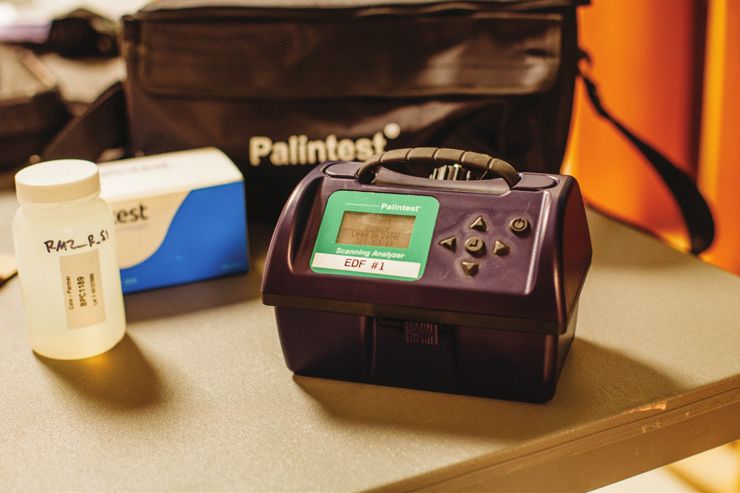
Key results
     • Flushing fixtures such as faucets and drinking fountains for just five seconds reduces
       lead levels. Flushing for 30 seconds is even more effective.
     • Cleaning the aerator at the end of the faucet is important, but may increase lead
       levels. More investigation is needed.
     • Replacing fixtures is effective when initial lead levels are high. However, it is not
       always sufficient to meet lead levels below 3.8 ppb. This is most likely because NSF
       International’s current standards allow new brass fixtures to have added lead and
       leach up to 5 ppb into water. More investigation is needed.
     • Portable lead meters that provide results in the field tend to underestimate lead levels
       compared to laboratory results.
     • Water heaters may function as “lead traps” for upstream sources of lead, but more
       investigation is needed to identify the source of this lead and whether it could result in
       elevated levels at the hot water tap.

Lead testing:

 • Collection of over 1,500 water samples (including 172 hot water samples) at 294 fixtures and
   14 water heaters. Samples were collected before and after remediation to evaluate the
   impact of such measures.
 • Analysis of all samples at a certified laboratory and 65% of samples with a portable meter.

Permanent removal of lead sources:

 • Identification and replacement of two lead service lines—lead pipes connecting the water
   main under the street to the building. One replacement took place in Chicago, the other in
   a Cincinnati suburb.
 • Replacement of 26 fixtures, including kitchen, classroom, and bathroom sinks, which had
   lead concentrations above our action level of of 3.8 ppb (or >2 ppb in Chicago).

Routine practices to reduce exposure:

 • Flushing fixtures by allowing the water to run for five or 30 seconds.
 • Removing and rinsing aerator screens at the end of faucets.
 • Draining and flushing 10 water heaters to remove lead particulate that may have
   accumulated in the tank.

 Our partners
 •   Elevate Energy (Chicago)
 •   Greater Cincinnati Water Works (Cincinnati)
 •   Healthy Homes Coalition of West Michigan (Grand Rapids)
 •   Mississippi State University Extension (Starkville and Tunica)
 •   People Working Cooperatively (Cincinnati)

                                                                                                    7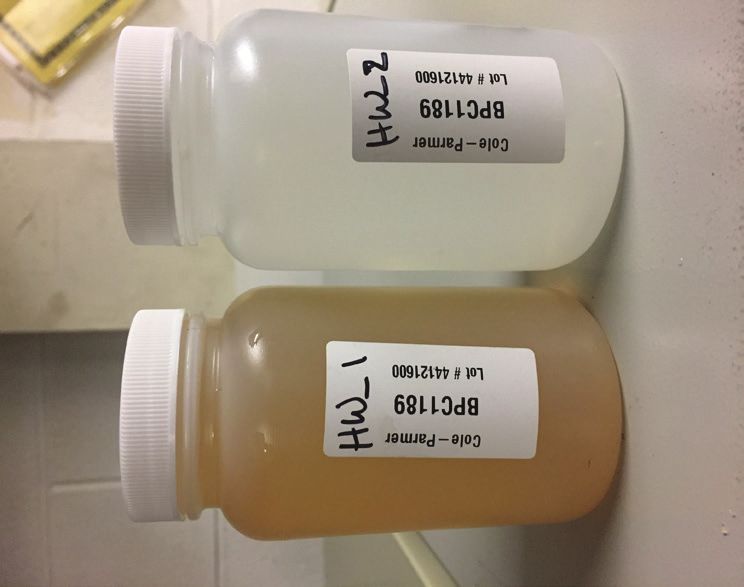
While more than three out of four samples
    collected had non-detectible lead levels (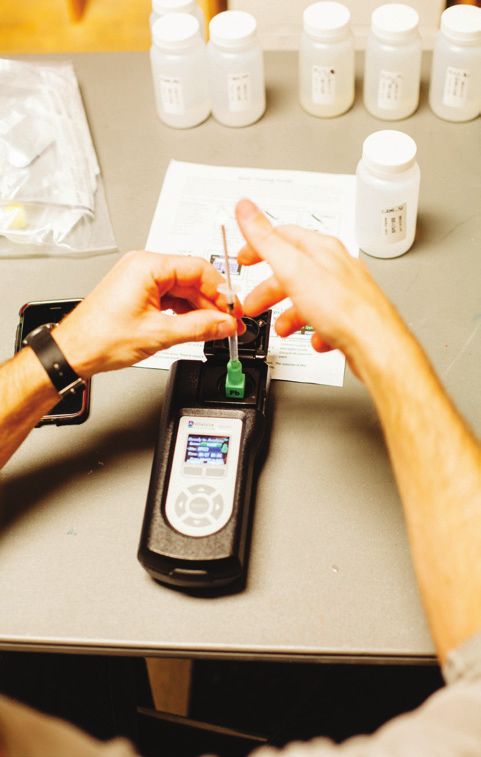
Introduction
There is no safe level of lead exposure. Even at low levels, lead exposure is likely to impair
children’s normal brain development, contributing to learning and behavioral problems as well
as lower IQ. Despite decades of progress in reducing children’s exposure, America continues to
have a toxic legacy of lead.

Children under the age of six are most vulnerable to harm from lead, and formula-fed infants
are most at risk of harm from lead in drinking water. While reducing lead in water everywhere is
important, child care facilities should be prioritized over schools given that they serve children
at a more vulnerable life stage, have less public accountability, and are more likely to have lead
service lines (LSLs).

Water testing—in addition to inspection for LSLs and review of building age and plumbing
materials—can help identify sources of lead in water for remediation and enable strategic
interventions to reduce lead levels.

A critical opportunity to reduce lead exposure from water
Children spend a large portion of their days either in schools or child care facilities, the majority
of which are not required to test their drinking water for lead under federal requirements
because they obtain their water from a public water system. Much of the recent attention has
focused on lead in schools—despite the fact that children under the age of six are most
vulnerable to the detrimental impacts of lead. A recent EPA analysis demonstrates that for
children less than six months of age, water is a major source of exposure. In fact, because infants
consume more liquid per body weight than any other age group, formula-fed infants can receive
up to 60 percent of their lead exposure from the tap water used to mix powered formula.

  Other sources of lead

  Child care facilities may have other sources of lead, primarily lead-based paint. EPA’s Lead-
  Safe Renovation, Repair, and Painting (RRP) rule, which requires renovations of buildings
  to be carried out by certified renovators trained in lead-safe work practices, applies to
  child care facilities that are built before 1978.

                                                                                                  9
Over 4 million children under the age of five are served annually by center- or home-based child
     care providers. Because child care facilities are often small and privately-owned, they may lack
     the facility support and public accountability found at public schools (e.g., through a school
     board)—and therefore are less likely to tackle the problem of lead in water on their own. See the
     box below for definitions of types of child care settings.

       Definitions vary among states. For this report, we use:
          • Child care facility: A building or structure used for educational, supervision or
            personal care services of children under six years of age.
          • Center-based: Child care facility based in a commercial space.
          • Home-based: Child care facility run out of a residential space.

     How lead can get into water at child care facilities
     Lead contamination rarely occurs naturally in water sources. It ends up in tap water due to
     corrosion of lead—containing pipes, solder, or brass fixtures—such as faucets and drinking
     fountains. The corrosion leaches (or dissolves) the lead from the metal into the water. The
     longer the water is in contact with the metal, the more lead leaches into the water until it
     reaches equilibrium. Temperature impacts leaching as well, such that more lead leaches into
     hot water.

     Most water utilities treat water to reduce its corrosivity and limit leaching of lead from LSLs or
     interior plumbing. Over time, corrosion control treatments build up a protective coating on the
     inside of the plumbing. However, even with corrosion control, LSLs can unpredictably release
     lead into the water. When the pipe is disturbed, small pieces of lead (“lead particulate”) can be
     released from the coating and end up in the water people drink or be caught in screens or other
     connections to be released later. Further, the on-off water use pattern of child care facilities (e.g.,
     no water use at night) may promote leaching of lead plumbing material into water.

     Lead pipes were banned by Congress in 1986 through the Safe Drinking Water Act. Yet there are
     still an estimated 6-10 million LSLs in use in the U.S. today, largely in the Midwest and
     Northeast. When present, LSLs contribute an estimated 50-75% of the lead in drinking water.

     Congress also limited the use of lead in interior plumbing in 1986 to 0.2% lead (weighted
     average) in solder and 8% lead in brass fixtures. It wasn’t until 2011 that Congress passed the
     Reduction of Lead in Drinking Water Act, which went into effect in 2014 and strengthened limits
     for lead in brass fixtures and fittings to 0.25%.

     All facilities may have some lead in their drinking water. The older the building the more likely
     there will be leaded plumbing. In addition, smaller child care facilities (often home-based) built
     before 1986 are more likely to have an LSL than larger center-based facilities (or schools)
     because they are serviced by smaller pipes; lead pipes above 2 inches in diameter are rare. But
     these larger facilities may still have leaded brass fixtures.

10                 PUTTING CHILDREN FIRST: TACKLING LEAD IN WATER AT CHILD CARE FACILITIES
Existing requirements and guidelines
Child care facilities tend to our most vulnerable kids, yet they present a critical gap for
regulation and well-established guidance regarding lead in drinking water. Currently, only seven
states (Connecticut, Illinois, New Hampshire, New Jersey, Oregon, Rhode Island,
and Washington) and one city (New York City) require licensed child care facilities served by
community water systems to test their drinking water for lead.1 Importantly, none of these
requirements reaches child care facilities that do not have a license from the state or
community.
The existing requirements vary widely in terms of testing protocol, lead standard, corrective
action, and communication to parents and staff. The requirements often call for action when
lead levels in water samples are over 15 ppb (EPA’s Lead and Copper Rule action level) or 20 ppb
(EPA’s recommended trigger for action at schools and child care facilities). Neither of these levels
are sufficient to protect children, and a lower limit is needed. We used a health-based
benchmark action level of 3.8 ppb based on an increased probability that a child will have a
blood lead level (BLL) greater than 3.5 micrograms per deciliter of blood (see page 28 for detail).
Illinois recently set an action level of 2 ppb, based on the lowest level at which the state expects
all approved laboratories to be able to quantify lead in a sample.
EPA has developed voluntary guidance—the 3Ts for Reducing Lead in Drinking Water—to help
schools reduce lead in drinking water. EPA also has a shorter version for child care facilities. The
3Ts of this guidance are:
• Training officials about the risks of lead and potential sources of exposure.
• Testing drinking water for identification of issues and remediation if necessary.
• Telling staff and the larger community about the program and results.
The guidance for child care facilities references the guidance for schools, which provides various
methods for reducing lead, including routine control measures, short-term measures, and
permanent remedies. While the guidance provides a helpful framework, it was last updated in
2006 and uses 20 ppb to trigger remediation. This level was not selected based on health risks,
nor has it been updated based on the latest science showing adverse health effects from low
levels of lead exposure. The guidance was also originally designed for schools, which are less
likely to have LSLs than smaller child care facilities. It therefore places little emphasis on
identifying and replacing LSLs.
1There are additional federal requirements and some state requirements for child care facilities that
operate their own public water system. Some states also have school testing requirements that
apply to child care facilities on school property.
11About EDF’s pilot
To investigate new approaches and provide concrete recommendations for action, EDF
developed and piloted a protocol to test for and remediate sources of lead in drinking water in
child care facilities.
We worked in four states with a mix of local partners, including: Elevate Energy, an energy
efficiency and healthy housing non-profit based in Chicago; Greater Cincinnati Water Works, a
water utility; Healthy Homes Coalition of West Michigan, a lead poisoning prevention program;
Mississippi State University Extension, a university extension offering external research,
programs, and technology services; and People Working Cooperatively, a home repairs non-
profit in Cincinnati. This diversity of partners allowed us to explore opportunities and
challenges of implementing lead in water testing and remediation through a variety of
institutions.
FIGURE 1
Lead in water at child care facilities: Existing requirements and
EDF partners
12 PUTTING CHILDREN FIRST: TACKLING LEAD IN WATER AT CHILD CARE FACILITIESEDF offered to pay for lead testing and remediation, which was conducted at 11 child care
facilities serving over 1,000 children from primarily low-income families (see Figure 1 above).
Our criterion for selecting child care facilities were that they serve as many children under six
years of age from low-income families as possible in order to provide support to facilities that
may not have the resources to tackle the issue on their own. Our local partners used their own
networks and processes to recruit child care facilities into the pilot. They found it difficult to
recruit both when they lacked a prior relationship with the child care facility and, for all but
Chicago, when the facility did not anticipate a testing mandate in the future.
FIGURE 2
Water distribution system at typical center-based child care facility
circulating pump
Service line
water
heater
curb stop expansion tank kitchen classroom 4 bathroom
valve
hose bib utility
closet
staff
room
water main drinking fountain
underneath street
classroom 1 classroom 2 classroom 3
Interior plumbing
bathroom
hot water
cold water
The layout of the water distribution system in a FIGURE 3
typical center-based child care facility is Typical fixture and
illustrated in Figure 2. Water enters the building associated plumbing
through the service line and is connected
through interior plumbing. The service line
usually enters the building near the water heater,
which produces hot water for the facility (red).
Large centers may have an expansion tank
connected to the water heater, which manages
pressure changes due to temperature
fluctuations. Classrooms often have sinks and
bathrooms, and most center-based facilities also
have at least one kitchen, staff room, and utility
closet.
A typical brass faucet and associated plumbing is
shown in Figure 3. In this example, the cold water
volume—including the faucet through the
plumbing shown—is about 185 mL. Therefore, a
13250 mL sample (as recommended by EPA’s 3Ts guidance) would include the faucet and
associated plumbing beyond that pictured here.
Our protocol, largely based on EPA’s 3Ts guidance (see page 23 for important differences), was
designed to identify and remove sources of lead in drinking water through stepwise assessment
of records, visual inspection, and water testing, as well as to demonstrate the reduction in lead
levels following remediation, including fixture replacement, aerator cleaning, and flushing.
Our general sampling and remediation protocol is outlined in Figure 4. Our local partners
conducted all lead sampling and coordinated remediation methods with the facilities. We
adapted our protocol to local circumstances.
At each facility, our local partner(s) first
investigated whether there was an LSL by
reviewing historical records, contacting the
local water utility, and conducting a visual
inspection. LSLs can unpredictably release
particulate lead that either passes into the
water immediately or gets caught in the
aerators, connections, or pipe scales to be
released later. As recommended by the Lead
Service Line Replacement Collaborative, the Image of a lead service line. Source: Associated Press.
best long-term solution to addressing LSLs is
to remove them. Therefore, if an LSL was found, without regard to lead levels detected in the
water, we worked with partners to arrange for its removal and to ensure appropriate flushing
was completed before conducting regular fixture sampling, described below.
FIGURE 4
Lead in water testing protocol for EDF’s pilot
See here for the full protocol.
Based on EPA’s 3Ts guidance, our partners collected 250 mL water samples after allowing the
water to sit in the pipes overnight (8-18 hour stagnation) at all water fixtures, including kitchen,
classroom, bathroom, staff room, and utility closet sinks; drinking water fountains; and outdoor
hose bibs (see Figure 2 above).
14 PUTTING CHILDREN FIRST: TACKLING LEAD IN WATER AT CHILD CARE FACILITIESWater stagnation allows lead, if present, to leach FIGURE 5
from the pipes, fixtures, or other sources. Diagram of faucet aerator
Sampling stagnated water is expected to yield
dissolved lead levels that are higher than those
children are likely to be exposed to over the
course of a day. Samples collected after flushing
enable measurement of potential sources of lead
upstream of the fixture and evaluation of the
effectiveness of flushing as a remediation
method.
On the first day of sampling (“baseline”), our
partners collected two samples sequentially at
each fixture:
• First draw sample: Water collected
immediately after stagnation.
• 30-second flush sample: Water collected
after 30 seconds of letting the water run.
Image courtesy of Philadelphia Water Department.
Where present, we cleaned the aerator—a screen
often found at the end of a faucet—between the first and second day of sampling to remove lead
particulates potentially caught in the screen. We removed the screens and washed them
thoroughly in the tap water. See Figure 5.
On the second day of sampling (“post-aerator cleaning”), our partners collected four samples
sequentially at all fixtures that could be reasonably used for drinking:
• First draw: Water collected immediately after stagnation.
• 5-second flush: Water collected after five seconds of letting the water run.
• 30-second flush: Water collected after total of 30 seconds of letting the water run.
• Hot water sample: Water collected with cold water faucet turned off and hot water turned
on (represents first draw of water sitting in
hot water pipes). FIGURE 6
Water heater with drain valve
At fixtures not used for drinking (e.g., utility
closet sink), we collected a single first draw
sample on the second day of sampling.
We collected two 250 mL samples directly from the
drain of the hot water heater (Figure 6) on either
the first or second day of sampling.
When we replaced an LSL, we supplemented our
testing protocol with additional baseline and post-
remediation sampling, including 10 consecutive
1-liter samples collected from a single fixture
before and after the replacement to provide a
profile of the lead levels in the water.
15We sent all samples to EHS Laboratory for inductive coupled plasma mass spectrometry
(ICP-MS) analysis. ICP-MS is the gold standard analytical technique to detect lead in water and
is an approved method under the Safe Drinking Water Act. Two-thirds of the samples were also
analyzed using a portable lead meter.2
Based on lead testing results, we replaced fixtures where samples exceeded our 3.8 ppb health-
based benchmark on the second day of sampling (after aerator cleaning). In Chicago, our action
level was >2 ppb in an effort to conform to an anticipated state standard. See discussion of
health-based benchmarks on page 28 for more detail. Where possible we also flushed water
heater tanks to remove lead-contaminated water. Following such remediation, we collected
follow-up samples both at fixtures and water heaters.
Our partners communicated the results back to the child care facilities’ management and staff
through a letter, detailed report, and verbal conversations. The child care facility staff
communicated the results to parents.
Types of lead remediation used and evaluated
• Lead service line replacement: Replacing the lead pipe connecting the water main
under the street to the child care facility followed by a robust flushing protocol to
reduce lead levels. Without replacing the LSL, testing at fixtures may miss the
unpredictable releases of lead particulate from LSLs and give a false sense of security.
• Flushing fixtures: Allowing water to run for a given amount of time before using a
fixture.
• Aerator cleaning: Removing and rinsing the aerator screen at the end of a faucet.
• Fixture replacement: Removing an existing fixture and replacing it with a new, NSF/
ANSI 61 certified fixture.
• Flushing water heater tanks: Draining the water heater tank and running cold water
through for 10 minutes.
• Filtering: Installing an NSF/ANSI 53 certified point-of-use filter on a fixture.
2 The limit of quantification of our laboratory analysis was 1 ppb. The limit of quantification of the
two portable lead meters used was 2 ppb.
16 PUTTING CHILDREN FIRST: TACKLING LEAD IN WATER AT CHILD CARE FACILITIESResults
Overall, we collected nearly 1,500 water samples at 294 fixtures, including 172 hot water
samples. We also sampled from the drain of 14 water heaters. We sent all samples to a certified
laboratory for ICP-MS analysis and analyzed 65% of the samples with a portable meter.
Table 1 provides a description of the 11 child care facilities and the results for each. The 11
facilities served a total of 1,096 children, with the majority from low-income families. The size of
the facilities ranged from the two smallest, both in Mississippi, serving 25 and 27 children, to the
two largest, both in Chicago, serving 178 and 213 children. Nine of the facilities were in
commercial buildings while the other two were converted homes. The number of fixtures tested
at each facility ranged from a low of seven in Mississippi to a high of 66 in Cincinnati but was
not closely associated with the number of children served or the age of the building.
Based on historical records and visual inspections, we identified two child care facilities with
LSLs—a center in Chicago and a converted home in the suburbs of Cincinnati—and removed
them both prior to baseline fixture testing.
We found that four of the 11 child care facilities had no drinking water fixtures exceeding our
action level of 3.8 ppb while seven had at least one drinking water fixture that triggered our
action level on either day one or two of sampling—and therefore could be source of lead
exposure to children in the facility. Of these, three were above the EPA 3Ts action level of 20 ppb
with two facilities, in Chicago and Cincinnati, with highs greater than 80 ppb. The highest
drinking water samples at the remaining four facilities were between our action level and EPA’s
current 3Ts action level. See Figure 7.
17FIGURE 7
Highest lead levels in drinking water at 11 child care facilities
Results of water testing (excluding samples from utility sinks and hose bibs) at 11 child care facilities: two facilities had at
least one tap water sample above 80 ppb level of lead; one facility had at least one sample above EPA's 3Ts action level of
20 ppb, but below 80 ppb; four facilities had at least one sample above our health-based action level of 3.8 ppb, but below
20 ppb; and 4 facilities had all samples below EDF’s action level of 3.8 ppb.
Figure 8 provides the results for the first draw
baseline samples—samples modeled after FIGURE 8
EPA’s 3Ts guidance—for the 291 fixtures we
Lead levels in baseline first
tested.3 More than three out of four of the
baseline first draw samples had levels below draw samples (ppb)
1 ppb. Seventeen of 291 (6%) exceeded our
action level of 3.8 ppb and only two (1%)
exceeded EPA’s 3Ts trigger of 20 ppb. On
average, lead levels were higher on the
second day of testing, following aerator
cleaning (see page 21).
We conducted remediation at all seven
facilities pictured above, including fixture
replacements at six facilities and LSL
replacements at two. Using >2 ppb as our
action level in Chicago and 3.8 ppb
elsewhere, we replaced 26 kitchen,
classroom, and bathroom fixtures in six
facilities.
3 While we tested a total of 294 fixtures, three baseline first draw samples were lost before
laboratory analysis.
18 PUTTING CHILDREN FIRST: TACKLING LEAD IN WATER AT CHILD CARE FACILITIESTABLE 1
Summary results for all 11 child care facilities
All fixtures Replaced fixtures
# children Low-income
Location Building age Child care type enrolled children Presence of LSL? # tested Lead levels † (ppb) # fixtures replaced Lead levels ‡ (ppb)
Chicago, IL 1956 Center 145 95% No 29 3.6 (Samples also varied by fixture type. Figure 9 illustrates the mean lead level by fixture type.
Drinking water fountains (bubblers and water coolers) had the lowest lead levels, with nearly all
non-detectible lead levels (non-detects reported as 0.5 ppb in Figure 9). Kitchen sinks had an
average lead level of 1.4 ppb (rangeWhat interventions were effective? Flushing We evaluated the impact of flushing fixtures and found that flushing for 30 seconds—and even as short as five seconds—reduced lead levels. When excluding results below the limit of quantification, flushing fixtures for 30 seconds reduced levels on average by 3.7 ppb. Flushing for just five seconds, which may be a more practical, everyday solution, reduced lead levels on average by 3 ppb. Flushing for five seconds decreased the percentage of samples with lead levels above 3.8 ppb from 6% to 1% and increased the percentage of samples below 1 ppb (our limit of quantification) from 76% to 88%. However, if an LSL is present, then a longer flush will be needed to ensure that the water sitting in the service line is flushed out of the system. The time would need to be sufficient to replace the amount of water in the interior plumbing and the LSL, accounting for the flow rate. Flushing is a cost effective solution to reduce lead in drinking water at the tap. We did not use flushing of fixtures as a primary remediation strategy, as it relies on consistency and patience from all users, including child care staff and children. It also raises concerns in areas with water shortages. However, given that most of the water children consume at child care facilities is unlikely to be the first water collected following an overnight stagnation, 3.8 ppb may be an achievable benchmark when accounting for the water that children are actually drinking. We found that flushing water heater tanks was generally effective in reducing lead levels, but difficult to carry out in some settings (e.g., where there is no floor drain). For all but one of the water heaters, flushing through the tank drain significantly reduced the lead levels. See page 32 for additional detail. Aerator cleaning Routine aerator cleaning is commonly recommended as an important practice to reduce lead in water. However, our results indicate that under certain situations it may increase lead levels. While lead levels decreased at some fixtures following aerator cleaning, overall, aerator cleaning did not have a strong effect on the percentage of water samples with lead concentrations above 3.8 ppb or above detection levels. Furthermore, when lead was detected, aerator cleaning increased lead levels by 4.5 ppb, on average. This was driven largely by results from two of the 11 facilities, where lead levels jumped dramatically following aerator cleaning. For example, at one facility in Chicago, lead levels at 15 fixtures were non-detect (
cleaning protocols already include soaking in vinegar (e.g., Philadelphia Water Department,
     Michigan Department of Health and Human Services).

     Another possibility is that the process of removing the aerator screen may disrupt the protective
     scale inside the fixture developed through corrosion control, thus releasing lead. The act of
     removing and reinstalling the aerator could also have resulted in minute pieces of brass getting
     into the water sample. At a facility in Cincinnati, samples from a sink in an infant room
     increased from 37 ppb to 88 ppb lead following aerator cleaning. In this case, the aerator broke
     during cleaning and was not put back on the faucet; therefore, the increased lead level could not
     have come from particulate dislodged from the screen during cleaning.

     Additional research is needed to confirm our findings and develop an evidence-based protocol
     for routine cleaning of aerators.

     Fixture replacement
     We replaced 26 of 294 fixtures (9%) based on our 3.8 ppb action level (>2 ppb in Chicago) on the
     second day of sampling (post-aerator cleaning). Three of these fixtures were replaced based on
     our lower action level of >2 ppb in Chicago. We conducted follow-up testing at all replaced
     fixtures.

     Figure 10 illustrates lead levels before and after fixture replacement. We found that fixture
     replacement was effective when initial lead levels were high. When levels post-aerator cleaning
     were >5 ppb, fixture replacement led to an average reduction of 19.9 ppb (± 6.3 ppb) in lead
     levels.

     FIGURE 10
     Lead levels before and after fixture replacement (all samples)

     This chart illustrates lead levels at fixtures for first draw post-aerator cleaning and post-fixture replacement. Lines connect
     data for a single fixture.

22                     PUTTING CHILDREN FIRST: TACKLING LEAD IN WATER AT CHILD CARE FACILITIES
However, where lead levels were initially close to our action level, replacement was not consistently effective (see Figure 11). In fact, when levels post-aerator cleaning were
Cincinnati, follow-up first draw samples collected two days after replacement of six fixtures still
     showed elevated lead levels—one as high as 18 ppb.4 However, when additional follow-up
     samples were taken three weeks later, the first draw levels were
Case studies on lead service line replacement
We replaced LSLs at two child care facilities: one in a commercial building in Chicago and
one in a converted home in the suburbs of Cincinnati in the City of Mount Healthy. As
described in the case studies, each provides insights into the challenges of replacement
and the benefits provided when the water utility supports the effort.
Cincinnati suburb
Greater Cincinnati Water Works (GCWW) has a proactive LSL replacement program, with
a plan to replace the remaining 27,000 LSLs within the City of Cincinnati’s limits over a 15
year period. As part of this program, customers in the city are required to replace LSLs
within the next 15 years.
In December 2017, GCWW established a cost sharing grant, where any customers can
receive 40-50% off, up to $1,500, of the cost of replacement on private property. Along
with the cost sharing grant, customers can elect to have the remaining balance added to
their property taxes as an assessment, interest free, to pay off within 10 years. However,
the property tax assessment only applies to customers within the city limits. For
communities outside of the city, within GCWW’s service area, local or state legislation
needs to be established for these communities to participate in property assessments.
While there is interest from community leaders, GWCC is actively collaborating to develop
ways to offer property assessments to all of its custumers.
Under city ordinances, GCWW, has the flexibility to prioritize LSL replacement based on
the public health risk and economic consideration. The utility anticipates making any
school, child care provider, or other business frequented by children a high priority for
replacement.
We worked with GCWW and People Working Cooperatively, a community non-profit
helping residents of the Cincinnati metro area with critical home repairs, to remove an
LSL in a child care facility based in a converted home. GCWW relied on their internal
records to determine that the facility likely had an LSL, and confirmed it by conducting a
visual inspection. Due to complications restricting the city from working on private
property, we coordinated a full LSL replacement by hiring an independent contractor to
remove the portion of the LSL from the property line to the child care facility on the same
day that GCWW replaced the portion from the property line to the water main.
The full line replacement was seamlessly coordinated between both parties, replacing the
lead line with copper piping. The City of Mount Healthy did not charge any street opening
permitting fees.
Following replacement, GCWW flushed the line immediately to remove any lead
particulates from the system. GCWW provided the child care facility management with
additional instructions to flush interior plumbing based on the American Water Works
Association’s (AWWA) C810-17 Replacement and Flushing of Lead Service Lines standard
(“AWWA’s flushing standard”), as well as a pitcher filter, replacement filter, and other
educational literature.
25City of Chicago
The City of Chicago mandated the use of LSLs up to 2 inches in diameter until 1986—
when Congress banned them and other lead components in plumbing. Because of this,
Chicago has a large number of LSLs with an estimated 78% of water accounts in the city
serviced by an LSL. Unlike many communities across the country, Chicago does not have
a proactive replacement program.
One of the child care facilities in Chicago was in a building constructed in the 1950s-1960s
and adjoined to two other buildings. Elevate Energy, a Chicago based non-profit that
partners with child care centers to cut utility and maintenance costs, determined that the
service line material was likely lead based on reviewing the age and size of the piping
through the City of Chicago’s Sewer and Water Atlas. A licensed plumber confirmed the
presence of an LSL through visual inspection. Because the City of Chicago’s Department
of Water Management does not have a program to assist property owners with
replacement, we hired a licensed plumbing contractor to conduct all of the work.
One of the buildings adjoined to the child care facility had a newer, ductile iron service
line on the property. As the pipe was up to code and could handle the flow, we only
needed to disconnect the LSL at the facility and connect the internal water distribution
system with 8 feet of interior copper piping to the ductile iron line in the adjacent
building. It was a straightforward, relatively low-cost solution. However, the city required
that the LSL be disconnected from the main under the street at the property owner’s cost.
As part of our arrangement with the child care facility, EDF paid for the work.
The City of Chicago charged $1,728 in permits and fees to cover costs such as street
closure and lost parking meter revenue. Furthermore, city records had inaccurately
identified the location of the water main under the street, leading to additional
complications and work hours. After digging and having no success locating the main, the
contractors reached back out to the city—but the city was unable to provide any
additional help. The contractor returned on a second day along with companies using
ground radar and sonar detection technologies, and, together, they were ultimately able to
locate the water main (which was 10 feet below grade) to disconnect the LSL.
We developed flushing protocols for the contractor and for the child care facility’s
maintenance staff, based on AWWA’s flushing standard. The contractor flushed from an
outside connection at full velocity, followed by an initial full-facility flush. Elevate Energy
provided facility staff with instructions to flush interior plumbing.
26 PUTTING CHILDREN FIRST: TACKLING LEAD IN WATER AT CHILD CARE FACILITIESWater sampling pre-and post-LSL replacement In both locations, we collected a water profile (i.e., 10 sequential 1 liter samples from the fixture closest to the service line entry point) before and after replacement to provide a snapshot of water samples from further upstream of the fixture. At the Chicago facility, the sampling profile before replacement showed lead levels fairly consistently at 2 ppb for each liter sample; after replacement we saw similar results. At the Mount Healthy facility, we observed a peak at liter two (5.6 ppb), followed by levels hovering at 2-3 ppb in the 10 liter profile. After replacement, the levels went down: all liters were
Novel aspects of our protocol:
     Lessons learned
     Our pilot project built on EPA’s voluntary 3Ts guidance for schools and child care facilities, and
     used new approaches not considered in the guidance. We expanded on EPA’s current guidance
     in four main ways:
        1. Investigated and, if found, removed lead service lines.
        2. Used a health-based benchmark to trigger remediation.
        3. Used portable lead meters to screen lead levels at the tap.
        4. Tested hot water at tap and at water heaters.

     See below for details on lessons learned from each of these four approaches.

     Investigated and, if found, removed lead service lines
     Attempting to reduce lead levels by replacing fixtures is unlikely to be of much value when there
     is an LSL that can unpredictably release large amounts of lead. Thus, before initial testing to
     identify sources of lead in internal plumbing, we think it is essential to investigate for the
     presence of LSLs through review of city, water utility, and child care records and conduct a visual
     inspection to confirm the LSL’s presence. If an LSL is found, it should be replaced, as it
     represents the largest source of lead in the building. Factors such as cost and logistics of
     replacement differ by locality. See the case studies from Cincinnati and Chicago (page 25) for
     details.

     Used a health-based benchmark to trigger remediation
     Instead of EPA’s 3Ts action level of 20 ppb, we used a health-based benchmark of 3.8 ppb to
     trigger lead remediation. While there is no safe level of lead, this benchmark is based on the
     increased probability that a child will have a blood lead level (BLL) greater than 3.5 micrograms
     per deciliter of blood (µg/dL). We derived 3.8 ppb from a 2017 EPA report, “Proposed Modeling
     Approaches for Health-Based Benchmark for Lead in Drinking Water,” which provided a range
     of potential values. We conducted an analysis of the EPA report and concluded that a
     conservative health-based benchmark for individual action on lead in drinking water should be
     3.8 ppb—reflecting a 1% increase in the probability of a formula-fed infant living in pre-1950
     housing of having a BLL of 3.5 µg/dL.

     We used an action level of >2 ppb in Chicago in an effort to conform to new lead in water testing
     requirements under Illinois Public Act 099-0922, enacted in January 2017. Illinois recently set
     an action level of 2 ppb, based on the lowest level at which the state expects all approved
     laboratories to be able to quantify lead in a sample. Our pilot began well before Illinois
     established its action level.

28                 PUTTING CHILDREN FIRST: TACKLING LEAD IN WATER AT CHILD CARE FACILITIES
We replaced 15 fixtures where sampled water tested between 3.8 ppb (or >2ppb in Chicago) and 20 ppb, six fixtures that sampled above 20 ppb, and an additional five fixtures below our action level out of caution. Under 3Ts trigger of 20 ppb, only six of these fixtures would have been replaced. While 3.8 ppb may be difficult to achieve (see page 23), clearly EPA’s 3Ts action level of 20 ppb is insufficient. We recommend an interim action level of 5 ppb, until NSF International’s leachability standard is strengthened. Used portable lead meters to screen lead levels at the tap We piloted two portable lead meters—Palintest and ANDalyze—to investigate whether such tools could be reliably used in lieu of laboratory testing with ICP-MS, the gold-standard, to identify problematic fixtures. We analyzed 758 samples with the Palintest meter and 242 samples with the ANDalyze meter. The Palintest is an EPA-approved meter to detect low levels of lead in drinking water. ANDalyze is a newer tool that relies on DNA-based fluorescence technology; it has not been approved by EPA for drinking water use. Both tools are handheld and provide lead results within minutes. We evaluated whether these portable meters could be used as reliable and accurate screening tools to identify problematic fixtures. We compared results from the portable lead meters to the ICP-MS laboratory analysis. If the portable meter proved to be a reliable screening tool, it would allow for immediate replacement and remediation of lead-reducing delays in replacement and, potentially, overall costs. Palintest Palintest portable lead meter tended to underestimate lead in water levels compared to the laboratory analysis (Figure 12), likely because the Palintest protocol does not include a full acid digestion to solubilize any particulate lead. Of 116 samples, 55% (64) with a positive reading (≥2 ppb) from laboratory analysis had a negative reading (
FIGURE 12
Comparing Palintest and ICP-MS lab results
This chart compares sample results from the Palintest meter to the ICP-MS laboratory analysis. When the reading was
below the limit of quantification (2 ppb for Palintest and 1 ppb for ICP-MS), we plotted the value at half the limit of
quantification. The dotted line represents the observed correlation between the ICP-MS and Palintest measurements,
while the solid line represents what the trendline would be if the two tests were perfectly correlated.
Because it was apparent that the Palintest was unreliable for our purposes at low lead levels, we
generally did not feel comfortable making decisions based on the Palintest results. Instead, we
waited until we had laboratory results in hand to make remediation decisions. See case study
from Chicago (page 31) for the one exception to this approach.
While the Palintest meter tended to underestimate lead levels, in every instance where
laboratory results indicated levels above 20 ppb and we also had Palintest results (27 samples,
data not shown5), the Palintest meter produced a positive reading—even if much lower than the
lab result. This suggests that the Palintest may be effective in flagging levels over the EPA’s
current 3Ts action level of 20 ppb. Further, modifying the test procedure by allowing for a longer
acidification period may increase the accuracy of the Palintest tool.
5 These data include eight results from fixtures as well as 19 results from water heater drains.
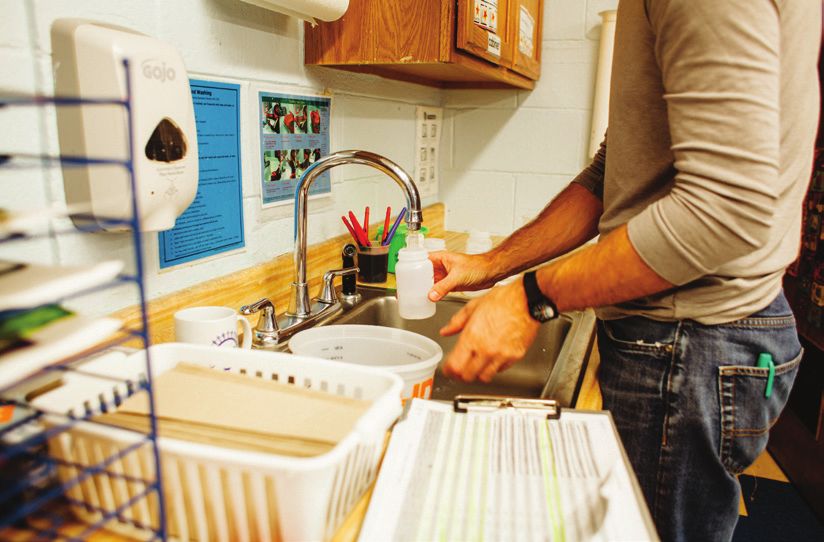
30 PUTTING CHILDREN FIRST: TACKLING LEAD IN WATER AT CHILD CARE FACILITIESCase study from Chicago
At one child care facility in Chicago, we used the Palintest meter and found it to be an
effective way to screen for highly problematic fixtures—quickly flagging them for
replacement.
We sampled at 29 fixtures, including 27 drinking water sources, using the Palintest meter
the same day we collected the sample. Six drinking water fixtures were flagged by the
Palintest—with readings of 8, 9, 12, 16, 25, and 27 ppb. Based on these results, our Chicago-
based partner, Elevate Energy, contracted with a licensed plumber who replaced these six
fixtures just five days after the samples were collected.
We received the laboratory results 18
days after fixture replacement. The
lab results demonstrated that 10
drinking water fixtures had lead
levels above the action level we used
in Chicago (>2 ppb). The five with
the highest ICP-MS levels (27-91
ppb) had been flagged by the
Palintest meter and had already
been replaced (Figure 13). The sixth
fixture we had replaced based on the
Partner at Elevate Energy collects water from a
Palintest meter (#17 on Figure 13), had classroom sink. Photo credit: Danielle Scruggs.
a lead level of just 2 ppb based on the
ICP-MS analysis. We would not have replaced this fixture based on the ICP-MS results.
We then conducted five additional fixture replacements (for a total of 11 replacements) to
address the fixtures with lower lead levels but still above our action level (3-15 ppb).
Eight weeks after initial sampling, we resampled every fixture at the center. All follow-up
samples demonstrated either non-detectible levels of lead or 1 ppb.
FIGURE 13
ICP-MS results for 27 drinking water fixtures
31ANDalyze
We did not collect sufficient data with the ANDalyze meter
to draw conclusions on its accuracy. The vast majority of
samples analyzed with the ANDalyze meter resulted in a
non-detect finding, and results were generally inconsistent
with the laboratory analysis. Our experience was that it
was less user friendly than the Palintest tool, potentially
leading to user error and likely inaccurate results. While it
may be used effectively by trained personnel, we do not
anticipate that child care staff or a plumber could
routinely use such a tool.
Conclusions on portable lead meters
For the reasons described above, our original goal of
identifying problem fixtures with portable lead meters and
immediately replacing the lead source was generally not Image of partner using
successful. In addition to accuracy issues, conducting same ANDalyze meter. Photo credit:
day fixture replacement was impractical due to the need to Danielle Scruggs.
coordinate with plumbers and locate the type of new fixture
needed.
A cost-effective field meter that What did we pay?
could provide immediate,
accurate lead results would be Laboratory testing (ICP-MS): $8-10/sample. Samples
helpful. While the opportunity for came with pre-paid return envelopes for shipping.
immediate results from portable
screening tools such as Palintest Palintest: $7/sample; $1,581 for portable meter.
and ANDalyze is appealing, our
results suggest that they are not ANDalyze: $6/sample; we received and returned two
yet ready to be used in lieu of lab portable units on loan (normal cost is $1,995 each).
testing.
There may, however, be other
important uses of such tools. For example, Chicago Public Schools is using portable meters to
allow for field evaluation of automatic flushing techniques where there is a fixture with
previously identified high lead levels. In other words, Chicago is using these tools not to identify
a high level but rather to determine how much automatic flushing is needed to get levels below
2 ppb. More work is needed in this area.
Tested hot water at tap and water heaters
Hot water is more likely to leach lead from plumbing than cold water. Despite this risk, current
testing protocols do not include sampling hot water. Rather, EPA recommends drinking only
cold water. However, we are concerned that child care facilities may use hot water for drinking
purposes, such as when mixing infant formula or other powdered drinks with water.
In addition, we anecdotally learned of concerns that lead particulate from an LSL or other lead
sources could settle and accumulate at the bottom of the hot water tank where high
temperatures from the flame or electric heater coil may dissolve the lead into the water.
Theoretically, settled particulate could also be re-suspended when the hot water flow is high.
32 PUTTING CHILDREN FIRST: TACKLING LEAD IN WATER AT CHILD CARE FACILITIESTo explore these two issues, we incorporated sampling of hot water at the tap, as well as directly
from the water heater drain, into our protocol.
We found alarmingly high lead levels from the samples
collected from the drains of hot water heaters, which we
think likely accumulated over time from upstream sources
of lead. Half (seven of 14) of water heater tanks tested in
child care facilities had levels over 50 ppb, with one as
high as 2,680 ppb. The initial samples from the water
heater often were discolored—some even like a sludge.
Our partners performed sustained flushes through the
drain on 10 water heater tanks to remove accumulated
sludge and particulate (Figure 14). The flushing helped
significantly in all but one case. Among water heaters
where initial samples tested above 50 ppb, flushing
dropped the lead levels on average from 456 ppb to 20
ppb. When initial water heater samples tested below 50 Water samples collected directly from
ppb, the drop was less evident (from 17 ppb pre-flush to 13 water heater drain. Initial draw
ppb post-flush, on average). In two cases, our partners pictured on the left.
performed second flushes in an attempt to further reduce
the lead levels (with mixed results). Flushing the water heater can be challenging, however, if
there is not a floor drain nearby. Some facilities may need a plumber’s assistance to perform a
sustained flush of the water heater.
FIGURE 14
Lead results for 10 water heaters: Before and after flushing
Measured lead levels in 250 mL of water collected from 10 hot water heaters in 9 child care facilities. Pictured: Highest lead
level detected during each sampling phase—the initial sampling (pre-flush), following a full flush of the water heater
(post-flush), and following a second flush of the water heater (second post-flush). Lines connect data for a single water
heater.
33Hot water samples at the taps, fortunately, did not have considerably different lead levels than
cold water samples. At the hot water tap, only 4 of 172 (2%) samples were above our action level
of 3.8 ppb. The vast majority of hot water samples (83%) had non-detectible lead
concentrations.
However, our first draw samples of hot water may not adequately reflect actual exposure. For
example, using large amounts of hot water prior to sampling could change the pressure in the
tank and allow lead particulates to be suspended into the distribution system. Additional
research is needed to determine the exposure impact of high lead levels in water heaters.
Despite these unknowns, it is clear that hot water heaters can act as a large reservoir for lead.
See our blog for more details.
Key results
• Flushing fixtures such as faucets and drinking fountains for just five seconds reduces
lead levels. Flushing for 30 seconds is even more effective.
• Cleaning the aerator at the end of the faucet is important, but may increase lead
levels. More investigation is needed.
• Replacing fixtures is effective when initial lead levels are high. However, it is not
always sufficient to meet lead levels below 3.8 ppb.. This is most likely because NSF
International’s current standards allow new brass fixtures to have added lead and
leach up to 5 ppb into water. More investigation is needed.
• Portable lead meters that provide results in the field tend to underestimate lead levels
compared to laboratory results.
• Water heaters may function as “lead traps” for upstream sources of lead, but more
investigation is needed to identify the source of this lead and whether it could result in
elevated levels at the hot water tap.
34 PUTTING CHILDREN FIRST: TACKLING LEAD IN WATER AT CHILD CARE FACILITIESRecommendations
As a result of the legacy of lead, child care facility operators, state licensing agencies, and health
departments need to evaluate all locations where many young children, especially infants,
spend significant time. Therefore, child care facilities must address the issue even if they did not
have a role in creating the problem. To succeed, they need support from EPA, local water
utilities, and NSF International, as well as the families they serve. We make the following
recommendations to address lead in water based on our experience from this pilot project.
Recommendations to child care facility operators
Child care facility operators should:
• Evaluate their drinking water for lead. This evaluation should include:
Determining if the facility has lead pipes, including an LSL, by evaluating the age of the
building (built pre-1986 may have an LSL), contacting the utility, and having a licensed
plumber conduct a physical inspection.
Testing each water fixture, with the samples analyzed by an approved laboratory
method. There currently is no effective method to predict which fixtures will have
significant levels of lead without testing the water.
• If an LSL is found, work with the drinking water provider (utility) both to remove the lead
pipe and flush the system after replacement to minimize lead exposure. Follow AWWA’s
flushing standard.
• Add to the standard operating procedures for staff and children:
Avoid using hot water for cooking or drinking.
Avoid using hose bibs (outdoor or at utility sinks) for drinking.
Flush fixtures (minimum five seconds) before drinking to reduce lead levels. After long
periods of non-use (e.g., vacations), a longer flush may be needed.
When cleaning aerators, soak in vinegar for several minutes to dissolve any lead
present.
Follow the manufacturer’s instructions for routine flushing of the hot water heater to
reduce accumulated sediment (including lead), extend the life of the water heater, and
improve its overall energy efficiency.
• Where lead levels from a fixture exceed 5 ppb, facilities managers should replace fixtures
and, until replaced, consider taking the fixture out of service or using NSF 53 certified filters
to remove lead.
• Resample fixtures after remediation steps are employed.
• Participate in the Eco-Healthy Child Care Program®, which includes addressing lead in
water and other sources.
35Recommendations to EPA
EPA’s 3Ts guidance for child care facilities is a helpful framework, but there are several ways that
it could be improved to better protect children at child care facilities. Because LSLs are more
common in child care facilities than schools, we recommend that EPA’s 3Ts guidance place a
greater emphasis on LSL identification and replacement. Further, because lead releases from an
LSL are unpredictable, we recommend starting any investigation by searching historical records,
such as those from the local water utility, and conducting a physical inspection to identify if an
LSL is present. If possible, it is always best to replace the LSL because it can significantly
contribute to lead in the water throughout the entire distribution system.
Furthermore, we recommend that EPA lower its 3Ts action level from 20 ppb to 5 ppb as an
interim measure—further lowering it once NSF International’s leachability standard is updated.
20 ppb is not health-based nor is it based on corrosion control feasibility (such as the Lead and
Copper Rule Action Level of 15 ppb). Compared to schools, a lower action level at child care
facilities may be even more prudent because they serve children at a more vulnerable stage of
their lives. Our results suggest that a lower action level is attainable.
Finally, the protocol detailed in EPA’s 3Ts guidance for both child care facilities and schools
should be updated to include a robust protocol for aerator cleaning and to address hot water
and water heaters as potential sources of lead in child care facilities.
Recommendations to NSF International on its standards for new
plumbing
NSF International’s NSF/ANSI 61 standard is required in every state in the U.S. except for
Hawaii. It should review its standard to reduce the leaching limit for brass fixtures from 5 ppb to
1 ppb, especially for fixtures in child care facilities and schools.
Recommendations to state child care facility regulatory agencies
More states and localities should require testing and remediation for lead in water at child care
facilities. This should include developing a reasonable and protective protocol for testing water,
Key areas for additional research
• Aerator cleaning: Confirm finding that aerator cleaning can increase lead levels and
develop an evidence-based protocol for routine cleaning of aerators.
• Water heaters: Identify the source(s) of high lead levels in water heaters. Conduct
more rigorous sampling of the hot water distribution system to determine if high
levels at water heaters may influence levels at the tap.
• Fixture replacement: Confirm the amount of time/flushing needed to remove lead
from new fixtures that meet NSF/ANSI 61 standard. Research whether washing
fixtures at the manufacturing. Research whether washing fixtures at the
manufacturing facilities (e.g., vinegar wash) would result in reduced lead levels
immediately after they are installed.
36 PUTTING CHILDREN FIRST: TACKLING LEAD IN WATER AT CHILD CARE FACILITIESYou can also read