Full Length Research Paper
←
→
Page content transcription
If your browser does not render page correctly, please read the page content below
Nippon Journal of Environmental Science
                                                           ISSN: 2435-6786
                                                               1(2): 1004
                                                  https://doi.org/10.46266/njes.1004

Full Length Research Paper

    Study of the fluctuation of the NDVI in the Casamance River Basin upstream of
                Kolda using remote sensing data: what impact on flow?
                                        Cheikh Faye1*, Boubacar Solly2, Sidy Dièye3
1
  Department of Geography, U.F.R. Sciences and Technologies, Assane Seck University of Ziguinchor, Geomatics and
Environment Laboratory, BP 523 Ziguinchor (Senegal). cheikh.faye@univ-zig.sn
2
  Department of Geography, U.F.R. Sciences and Technologies, Assane Seck University of Ziguinchor, Geomatics and
Environment Laboratory, BP 523 Ziguinchor (Senegal). b.solly1087@zig.univ.sn
3
  Department of Geography, Faculty of Letters and Human Sciences, Cheikh Anta Diop University of Dakar, BP 5005 Dakar-
Fann, Senegal. dieyesidy@gmail.com

                                       *Corresponding Author: cheikh.faye@univ-zig.sn

                                        Received 20 April 2020; Accepted 16 May 2020

Abstract. Changes in land use and land cover have attracted considerable scientific interest in recent years because of their
marked influence on hydrological cycles. In the tropics, widespread vegetation degradation and changes in land use that occurred
from the 1970s onwards have affected the hydrological dynamics of catchments. In this study, land cover changes in the
Casamance catchment upstream of Kolda in recent years were analysed and their role in hydrological evolution was estimated.
These changes had occurred in environmental conditions between 1987 and 2018. Remote sensing and geographic information
system (GIS) techniques were used to monitor changes in the basin as well as changes in NDVI values. Landsat 5 and 8 satellite
images were used respectively. The extraction of land cover in the basin was carried out through the application of unsupervised
nesting classification processes. The results indicated that a regression of forest cover in the Casamance River Basin upstream
of Kolda and the classification of the area into seven main land categories (forest, savannah, slash-and-burn, cultivated areas,
habitat, plantations and water) was significant. Like rainfall, the flow rates, which declined during the 1980s, increased from the
2000s onwards, although the trend was not significant. This increase in runoff is the result of vegetation degradation and
increased rainfall. The results highlight the importance of integrating land use information into assessments of water availability
in a region where water is a strategic resource.

Keywords: Casamance Basin Basin, GIS, NDVI, Remote Sensing, Supervised Classification

1. INTRODUCTION

    Climate change indicates the trend towards a global and multi-year increase in the average temperature of the
oceans and the atmosphere, a decrease in the amount and duration of rainfall in some regions, and an increase in
natural disasters and extreme events (droughts, floods, etc.) (IPCC, 2007; IPCC, 2013). Global warming combined
with increased variability in rainfall is leading to an increase in extreme events, particularly floods and low water
levels, which will increase in frequency and intensity across the African continent. Various studies highlight the
evolution of river flows and the impacts on natural and human systems in the territories during the recent period. The
extent and reality of this evolution depends on the regions and hydro-climatic conditions (Faye et al., 2015).
    Africa is at the forefront of the issue of the impact of climate fluctuations on water resources (Kanohin et al.,
2009). Several studies carried out in West and Central Africa have highlighted, from the 1970s onwards, a decrease
in surface and underground runoff following the drop in rainfall (Faye, 2013; Faye et al.. 2015), and, from the 1990s,
an increase in runoff (Hountondji et al., 2009; Ouoba, 2013), which augurs well for an improvement in the
hydrological regime in this area,
    Drought, which is characterized by a reduction or poor distribution, or even absence of rainfall in a given area for
a period of time (Bootsma et al., 1996), is primarily meteorological. It is then hydrological and agricultural. Drought
is a natural phenomenon that poses many problems throughout the world insofar as it requires enormous demands on
natural resources, particularly water resources (Barua et al., 2009). While in the past, drought was associated only
                                                                1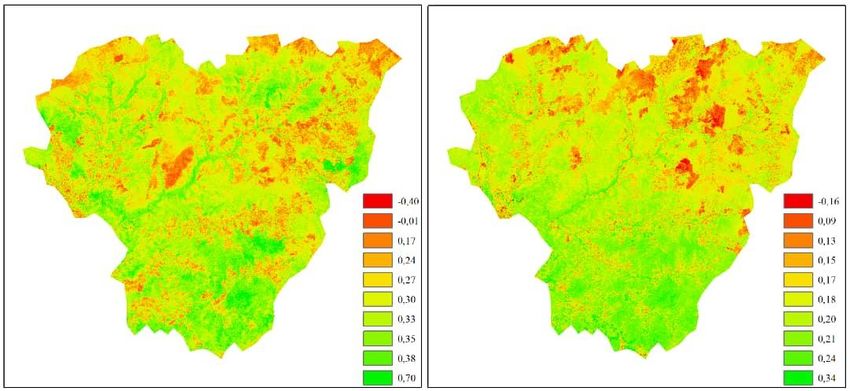
Faye et al.
   Study of the fluctuation of the NDVI in the Casamance basin upstream of Kolda using remote sensing data: what
                                                   impact on flow?

with arid, semi-arid and desert fringes when the definition was based solely on absolute amounts of precipitation
(Omonijo and Okogbue, 2014), today it occurs in areas of high and low precipitation and in virtually all climatic
regions. Drought is now associated with the onset and cessation dates of rainfall and the length of the rainy season.
Thus, it is better defined as the inefficiency of rainfall.
    In addition to interest in climatic factors, there has been particular interest in recent decades in land use and land
cover changes, because of their potential to alter the hydrological cycle (Kundzewicz et al., 2007). Although the
physical properties of River Basins, including topography and lithology, can control the process of water infiltration,
they are stationary at the temporal scale over which hydrological analyses are conducted (Mora'n-Tejeda et al., 2012).
Nevertheless, vegetation cover and land use evolve on the same temporal scale as human activity and therefore affect
the availability of water resources for populations through their influence on runoff. The relationship between
vegetation cover and hydrology has been the subject of scientific research since ancient times (Andre'assian, 2004).
    In recent years, studies of experimental River Basins have shown that land and forest cover affect the water cycle
and water balance by participating in processes associated with infiltration and precipitation distribution (Llorens
and Domingo, 2007). At local and global scales, vegetation cover is involved in infiltration, interception and
evapotranspiration processes (Zhang et al., 2001; Cosandey et al., 2005), and land use changes that increase
vegetation cover generally result in decreased runoff, while vegetation removal tends to increase river flow in basins
(Bent, 2001; Gallart and Llorens, 2003). Both natural and anthropogenic land use changes in the Sahel (reduction in
vegetation cover, increase in cultivated areas and densification of the drainage network) have led to a faster
concentration of water, increased flooding and reduced base flow, despite the decrease in rainfall in the Sahel: this is
the "Sahel hydrology paradox" (Descroix et al., 2009).
    Prolonged conditions of rainfall and hydrometric deficits since the 1970s have been highlighted throughout the
Casamance catchment area (Dacosta, 1989; Faye, 2019). The lands of Casamance are described as rich soils with
high productivity due to their physical and chemical conditions and high fertility (Mballo, 2016). This is due to the
availability of suitable water for agricultural production. This agricultural land in Casamance is considered one of
the most important natural and economic resources. However, the deterioration of agricultural land due to climate
change and anthropogenic effects (amendment of agricultural land and fragmentation of plots) is one of the most
serious problems noted there (Mballo et al., 2019). The Casamance River Basin upstream of Kolda was chosen in
this study because of its agricultural character with rich water bodies. The different land-use units identified on the
landscape were monitored and changes in the areas over the last 30 years were interpreted using satellite image
processing.
    With the development of remote sensing technology, it is possible to monitor changes in land cover. Therefore, it
is possible to apply some of the techniques of remote sensing and geographic information systems to monitor the
effect of certain climatic factors on land cover deterioration (Al-Obaidy and Al-Baldawi, 2019). This study, which
focuses on the Casamance River Basin upstream of Kolda, aims to: identify the changes that have occurred in the
landscape, by analysing the results of processing satellite images from the years (1987 and 2018). The process here
consists of a multi-temporal analysis of the normalized difference vegetation index (NDVI), which makes it possible
to interpret vegetation dynamics and the effect of climatic factors on the environment, particularly the study area
(Casamance basin upstream of Kolda). The results of satellite image processing were combined with statistical
analysis of hydrological and climatic series using a set of stations located in the Casamance basin.

2. MATERIALS AND METHODS

2.1. Study Area
   The Casamance basin, which extends over three administrative regions (Ziguinchor, Sédhiou and Kolda), in the
south of Senegal, is situated in latitude between 12°20' and 13°21' North and in longitude between 14°17 1 and 16°47'
West. i It covers an area of approximately 20150 km2, stretching from West to East over 270 km, and from North to
South over 100 km (Dacosta, 1989). It has an Atlantic Sudanian and South Sudanian climate (Sané et al., 2011) and
is strongly influenced by geographical and atmospheric factors (Sagna, 2005). The Casamance basin can be
subdivided into three parts: the upper basin (Upper Casamance), the middle basin (Middle Casamance) and the lower
basin (Lower Casamance). From a topographical point of view, the Casamance River Basin is characterized by its
low relief. Indeed, all the rivers originate from the plateau of the terminal Continental and the weakness of the slopes
explains the deep invasion of the sea inside the Casamance basin causing the salinization of agricultural land
(PADERCA, 2008).

                                                            2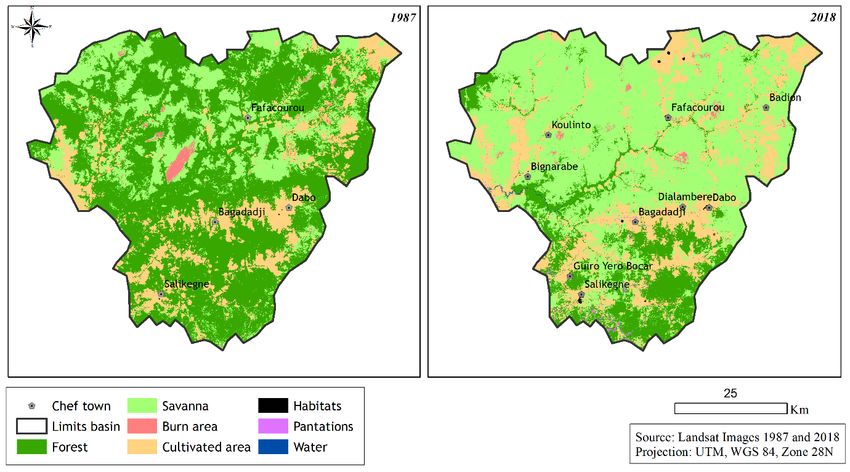
Nipp. J. Environ. Sci., 1(2): 1004

                Figure 1. Location of the Casamance River Basin upstream of Kolda and the study stations

    The Casamance River Basin upstream of Kolda has a surface area of 3650 km2 with a maximum altitude of 80 m
and a minimum altitude of 10 m. An analysis of the data in Table 1 shows that the Casamance basin upstream of
Kolda has a relatively elongated shape (KG: 2) with gentle slopes (Ig: 0.36 m/km)). In this basin, rainfall is highly
variable and its evolution in Kolda makes it possible to distinguish three periods: a relatively wet 1930-1971 period,
a relatively dry 1972-2002 period and a third decade characterized by a return to wet conditions (Bodian et al., 2015).

2.2. Data
2.2.1. Satellite data
   In order to study land use dynamics in the Casamance catchment upstream of Kolda, two dates of Landsat image
capture are used (Table 1). The first date dates back to the dry period (late 1980s), and the second corresponds to the
current period considered as relatively wet (2018). Two scenes are required to cover the entire basin (P204r051 and
P203r051) with the advantage of covering the entire study area. In addition to their resolution, which is quite
sufficient, the images are available for free download on http://earthexplorer.usgs.gov/.
Data processing was carried out using Idrisi TerrSet software for satellite image processing, and ArcGIS 10.5 for
area calculation and map layout. A GPS is used to take geographical coordinates in the field.

                                        Table 1. Landsat satellite images used
                Year               Date         Path     Row        Satellite      Sensor          Spatial
                                                                                                  resolution
                1987           20 Nov 1987        204     051      Landsat 5         TM             30 m
                               15 Dec 1987        203
                2018            09 Jan 2018       204     051      Landsat 8      OLI_TIRS          30 m
                                18 Jan 2018       203

                                                           3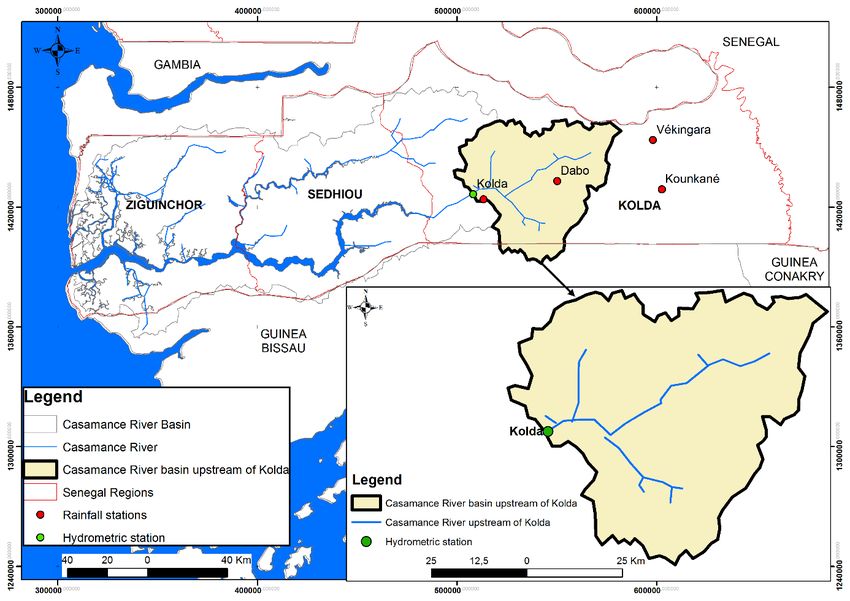
Faye et al.
Study of the fluctuation of the NDVI in the Casamance basin upstream of Kolda using remote sensing data: what
impact on flow?
2.2.2. Rainfall and hydrological data
For this study, analysis of rainfall data from Kolda, Velingara, Dabo and Kounkané stations from 1960 to 2016
are used to characterize climate variability in the Casamance basin upstream of Kolda (Table 2). As for the
temperature data, they concern only the Kolda Station. All these climatic data come from the National Agency of
Civil Aviation and Meteorology (ANACIM). For the impacts of climate variability on water resources in the basin,
the hydrological station of Kolda from 1965 to 2008 is used. However, the hydrological data come from the
Directorate of Water Resources Management and Planning (DGPRE).
Table 2. Rainfall stations in Senegal selected for the study and their characteristics
Rainfall stations Latitude Longitude Altitude Study period
Kolda 12°53’ 14°58’ 35 1980-2016
Velingara 13°09’ 14°06’ 38 1980-2016
Dabo 12°52’ 14°08’ 40 1980-2016
Kounkané 12°56’ 14°05’ 33 1980-2016
Hydrometric station Latitude Longitude Altitude Study period
Kolda 12°53’ 14°56’ 1,62 1980-81 - 2007-08
For the study of the spatial variability of drought, a number of indices, usually used by forecasting
services, have been selected.
2.3. Methods
2.3.1. Methods of processing geospatial data
Land use is a physical description of the space covering the ground (vegetation, bare soil, hard surfaces, wet
surfaces and water bodies). The functional dimension refers to the description of areas according to their socio-
economic purpose (residential, industrial or commercial, agricultural or forestry, recreational or conservation areas,
etc.). ); the sequential approach, developed for agricultural statistics, which encompasses a series of human operations
aimed at deriving products and/or benefits from soil resources (European Commission, 2001). Image processing
started with geometric correction. It consisted in bringing the images back to the same geometry. This step is
necessary in order to jointly use images taken by different sensors at different dates (Andrieu, 2008; Solly et al.,
2018). Next, georeferencing, with the choice of four bitter points on the 2018 image, is used as a reference. After
reducing the images to the same geometry, the bands of the two scenes of each reference date were mosaiced. Finally,
the colour composition and the calculation of the Normalized Vegetation Index (NDVI) were carried out.
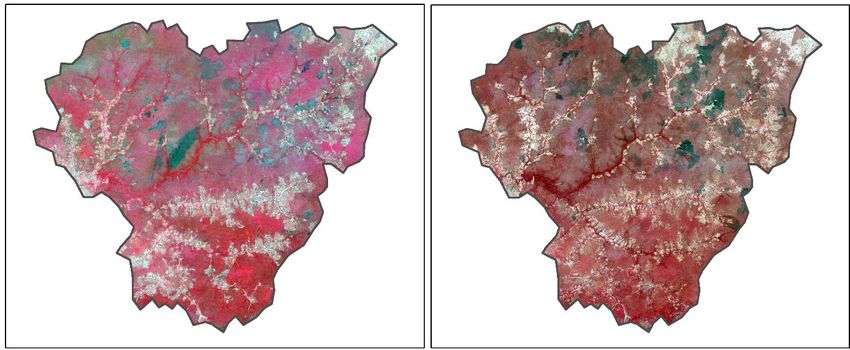
2.3.1.1. Coloured composition
The color composition of an image is the result of the overlapping bands in the Red, Green, and Blue (RGB)
channels. The one used in this study is called false-colour infrared (Figure 2). It combines the bands corresponding
to the PIR, R and V wavelengths respectively in the R-G-B channels. It is based on the properties of vegetation that
reflect near-infrared radiation very strongly (Girard and Girard, 2010).
2.3.1.2. Classification of land use units
This operation allows the identification of land use classes by photo-interpretation. These are forest, savannah,
burnt areas, cultivated areas, habitat, plantations and water. These classes have been coded from 1 to 7.
After identifying the different land use classes, the unsupervised nesting classification was adopted with reference
to the work of Andrieu (2008) and Solly et al. (2020). The choice of this method was justified by the lack of suitable
reference samples for the 1987 image (Masse, 2013). This classification allows the pixels of an image to be grouped
into spectral classes according to their signatures and depends on the spectral signature of the thematic classes
composing the surface to be mapped. Validation of the results was based on GPS points taken in the field for each
class over the entire basin. This work is supplemented by documentation relating to the topic addressed (Stancioff et
al., 1986; Tappan et al., 2004; ANAT, 2018) and associated with the classification of plant formations adopted at the
Yangambi conference in 1956 (Aubreville, 1957).
2.3.1.3. Determination of NDVI
NDVI is calculated by the reflectivity of the band channel of Landsat imagery which is red (red) light (0.64-0.67
μm) and near infrared (nir) light (0.85-0.88 μm) (Rouse et al., 1974; Griffith et al., 2002; Kundu et al., 2002). The
standard index of vegetation variation was calculated using the following equation (1) (Rouse et al., 1974):
4
Nipp. J. Environ. Sci., 1(2): 1004

          (Rnir − Rred )
NDVI =                                                 (1)
          (Rnir + Rred )
   The NDVI varies mainly from - 1 to + 1. Generally, areas with no vegetation give a negative value or a value
close to zero (meaning no vegetation) and a value close to + 1 (0.8-0.7) represents healthy vegetation (Griffith et al.,
2002). In general, values below 0.1 provide information on water, cultivated areas, areas affected by fire and areas
with very little vegetation, while values above 0.1 provide information on vegetation cover (Dessay, 2006; Djoufack-
Manetsa, 2011; Solly et al., 2020). The closer the value is to 1, the greater the chlorophyll activity and the denser the
vegetation.

   a                                                             b
Figure 2. False infrared colour composition of Landsat images from 1987 (a) and 2018 (b) in the Casamance basin upstream of
                                                           Kolda

2.3.2. Hydroclimatic approach
To characterize hydroclimatic variability and drought in the Casamance River catchment upstream of Kolda, the
Standardized Precipitation Index (SPI) and the Standardized Flow Index (SFI) are used as probability distributions
of long-term precipitation time series (Forootan et al., 2016). The SPI and SFI were calculated on 12-month scales.
Estimated SPI values above -3 are considered extreme drought events, while values between -1 and -2 are considered
moderate extreme events.

3. RESULTS AND DISCUSSION

3.1. Land use dynamics in 1987 and 2018
   Generally speaking, the results indicate deforestation, either through savannah or agricultural land development
(Figure 3). Indeed, the forest that was the dominant cover in 1987 with 215,271.9 ha or 58.6% of the basin's surface
area has strongly decreased in favour of savannah and agricultural areas in 2018 (Table 2). These increased by
88,376.5 ha and 59,802.1 ha respectively.
   In 2018, the forest represents only 16.5% of the basin's surface area. The increase in agricultural areas has been
accompanied by an increase in habitats, which rose from 28.3 ha in 1987 to 461 ha in 2018. There are also plantations,
consisting mainly of Anacardium Occidentale, especially in the southern part of the basin located in Guinea Bissau.
As for the surface water area, it increased from 13.2 ha in 1987 to 231.7 ha in 2018. However, it should be pointed
out that despite this increase in the surface area occupied by surface waters, a large part of the river in the basin is
now dry and rainwater inputs are no longer sufficient to supply the basin's hydrographic network all year round.

3.2. Dynamics of the Normalized Vegetation Index (NDVI)
NDVI values generally indicate higher chlorophyll activity in 1987 and 2018 (Figure 4). The hue and colour of NDVI
are dependent on the average signal level in the red, yellow, green range (Gond et al., 1997). Here, green indicates
high intensity (abundant phytomass) and red indicates low intensity (little or no vegetation). For example, in 1987,

                                                             5
Faye et al.
   Study of the fluctuation of the NDVI in the Casamance basin upstream of Kolda using remote sensing data: what
                                                   impact on flow?

the maximum value of NDVI was 0.70; the minimum value was -0.40. The positive values (those above 0.1) occupy
most of the basin, indicating the importance of vegetation during this period.

          a                                                        b

       Figure 3. Mapping of land use in the basin in 1987 (a) and 2018 (b) in the Casamance basin upstream of Kolda

  Table 2. Evolution and balance of land use in the basin between 1987 and 2018 in the Casamance basin upstream of Kolda
           Class                               1987                           2018                 1987-2018
                                         Ha               %               Ha              %        Balance sheet
                                                                                                       in ha
              Forest                  215271.9          58.6            60520.5          16.5       -154751.4
              Savanna                  88376.5          24.1           216159.8          58.8       127783.2
              Burn area                 3837.2            1              2151.4           0.6        -1685.8
              Cultivated area          59802.1          16.3            86342.8          23.5        26540.7
              Habitats                   28.3            0.0              461             0.1          432.7
              Plantations                 8.1            0.0             1470.1           0.4         1461.9
              Water                      13.2            0.0             231.7            0.1          218.6
              Total                   367337.3          100            367337.3          100             0

    In contrast to 1987, chlorophyll activity is relatively low in 2018. The maximum value of NDVI is +0.34. The
decrease of the maximum value in 2018 is partly explained by the degradation of vegetation (decrease in density)
although an increase in precipitation is noted in the recent period. In fact, it is noted that the year 1987 is in the middle
of drought (Sagna, 2005). However, it should be noted that the maximum value of chlorophyll activity (+0.70) during
the year 1987 could be influenced by the date of the image. Indeed, it should be noted that the vegetation index may
be at its maximum at the time of lowest precipitation, although there is a strong correlation between NDVI and
rainfall (Dessay, 2006; Solly et al., 2020).
    In addition, the significant role of anthropogenic factors in the dynamics of the environment through land clearing,
bush fires, habitat, etc. must be stressed. The latter are expressed here by a significant increase in the areas occupied
by habitats, plantations and burned areas (Figure 5). Thus, although a return to normal rainfall has been noted since
the end of the 1990s, the maximum value of NDVI in 2018 barely reaches +0.34, especially in the southern part of
the basin.

                                                               6
Nipp. J. Environ. Sci., 1(2): 1004
a b
Figure 4. Status of NDVI in 1987 (a) and 2018 (b) in the Casamance basin upstream of Kolda
200 20000
150
100 15000
Percentage
Percentage
50
10000
0
-50 5000
-100
Forest Savanna Burn area Cultivated 0
area Habitats Plantations Water
Figure 5. Percentage change in different land use units between 1987 and 2018
3.3. Rainfall and hydrological dynamics
The analysis of the rainfall (Pmm) series (Figure 6) of the four stations studied in the Casamance basin upstream
of Kolda clearly shows the interannual variability of rainfall, in addition to an increasing dispersion over time, which
has its origin in the great irregularity of surplus and deficit episodes. In the Casamance basin upstream of Kolda,
droughts are generally light with frequencies of occurrence of 34.3% in Kolda, 36.1% in Velingara, 45.7% in Dabo
and 47.2% in Kounkané. They are followed by sequences of moderate droughts (5.71% in Dabo, 8.33% in Kounkané,
11.11% in Vélingara and 11.43% in Kolda). On the other hand, sequences of severe droughts (only one case in Dabo
and Kounkané and 2 in Vélingara in Kolda) and especially extreme droughts (only one case in Dabo) have the lowest
frequency of occurrence in the basin.
4 Velingara 4 Dabo 4 Kounkané 4 Kolda
2 2 2
2
SPI
SPI
SPI
SPI
0 0 0
0
-2 -2 -2
-2 -4 -4 -4
1980
1984
1988
1992
1996
2000
2004
2008
2012
2016
1980
1984
1988
1992
1996
2000
2004
2008
2012
2016
1980
1983
1986
1989
1992
1995
1998
2001
2004
2007
2010
2013
2016
1980
1983
1986
1989
1992
1995
1998
2001
2004
2007
2010
2013
Years Years Years Years
Figure 6. Evolution of standardized rainfall indices in the Casamance basin upstream of Kolda from 1980 to 2016
The years 1980, 1992, 2001, 2012 and 2013 are identified as severe drought years. The 1980s in Kolda (with a
SPI of -1.89) and 2012 in Dabo (with a SPI of -2) are characterized by extreme drought (Figure 7). However,
regardless of its degree of severity in the basin, the drought that occurred frequently in the past (1980s), has
increasingly subsided since the 2000s, despite its persistence in some years such as 2012 and 2013. For several years
now, work carried out in Senegal by various researchers has been confirming this upward trend (Dione, 1996; Sow,
7Faye et al.
Study of the fluctuation of the NDVI in the Casamance basin upstream of Kolda using remote sensing data: what
impact on flow?
2007; Bodian, 2011; Faye, 2013; Faye et al., 2015; Faye et al., 2017). Rainfall analyses carried out by the various
authors on this zone show the progressive nature of the rainfall towards the end of this period. Indices such as the
arithmetic mean and the comparison with the drought years of the period 1980-1999 (average of 936 mm) show a
slight increase in rainfall between 2000-2016 (average of 977 mm). This indicates a relatively wet climate context
and a trend towards a clear excess of rainfall (41 mm increase). However, the amount of water precipitated during
this 2000-2016 period, although wet, does not equal that of the very wet 1950-1970 period.
180 0 4.00
160 3.50
500
140 3.00
1000 2.50
120
2.00
1500
SPI
Pmm
100
Qmm
Qmm in Kolda Pmm in Kolda 1.50
80 2000 1.00
Pmm at Velingara Pmm to Dabo 0.50
60 2500
40 Pmm in Kounkané 0.00
3000 -0.50
20
3500 -1.00
0
1980-81
1981-82
1982-83
1983-84
1984-85
1985-86
1986-87
1987-88
1988-89
1989-90
1990-91
1991-92
1992-93
1993-94
1998-99
1999-00
2000-01
2001-02
2002-03
2003-04
2004-05
2005-06
2006-07
2007-08
Years Years
Figure 7. Precipitation and runoff in the Casamance basin upstream of Kolda from 1964-65 to 2007-08
Thus, as a consequence of the meteorological drought, the hydrological drought has resulted in the reduction of
surface runoff in rivers. It manifested itself in the Casamance basin upstream of Kolda over the period from 1980 to
1999 and is manifested in the basin by a decrease in the volumes of fresh water flowing, the upward movement of
salt water along the river and the drop in the level of water tables. In addition, the flows (Qmm) used make it possible
to identify and characterize the recurrence and severity of drought in terms of period of occurrence, deficit and
intensity. Thus, the analysis of the water flow and the standardised index of flow from 1970-71 to 2007-08), shows
that 70.8% (i.e. 17 years out of 24) of the years were dry at the Kolda hydrometric station (with a standardised index
of flow below 0). Only seven (07) years were considered wet (Figure 7). A long drought sequence from 1980-81 to
1999-00 is also noted. The lowest value was recorded in the year 1983-84 (lowest index year), corresponding to a
flow of 0.24 m3/s) and the highest value in the year 1967-68 with a flow of 7.84 m3/s). However, in the mid-2000s,
there was an increasing increase in flow in the basin, as evidenced by the indices generally above 1 from 1999-00
(0.23) to 2007-08 (3.41).
In the Casamance basin upstream of Kolda, the least rainy years generally correspond to the lowest flows (Figure
7). Thus, the year 1983-84, which has the lowest hydraulicity with a flow of 0.24 m3/s, coincides with the rainfall
deficit with reference to the average of -6.44% at Dabo, -25.8% at Kounkané and -30.2% at Kolda. As for the year
2007-08 (year of highest hydraulicity) with a flow of 7.84 m3/s, it coincides with a rainfall surplus of about 5.25% in
Kolda, 18.9% in Dabo and 25% in Kounkané. Parallel to the rainfall, the flow has experienced the same evolution
with an upward trend. The high variability (deficits and surpluses) of annual rainfall was reflected in the flows of the
Casamance basin upstream of Kolda and the deficits and surpluses of flow seem to have increased.
3.4. Discussion
Comparing the 1987 and 2018 land use maps (Figure 3 and Table 2), significant changes in the distribution of
land use are noted, in particular the increase in degraded land. Beyond the classification of the Casamance catchment
area upstream of Kolda into seven main land categories (forest, savannah, burnt land, cultivated areas, habitat,
plantations and water), the results of the analyses show a significant regression of forest cover in the basin. This study
confirms that of Solly et al. (2020) who mentioned the combination of several factors such as clearings for agricultural
needs, bush fires, population increase, uncontrolled wood cutting, changes in rainfall conditions, among others, as
factors responsible for the regression of vegetation cover. Like rainfall, runoff flows alternately decreased during the
1980s and increased from the 2000s onwards, although the trend is not significant. These results confirm those of Ali
et al (2008), Hountondji et al. (2009), Faye (2013). Faye (2019), Faye et al. (2015) and Ouoba (2013) which predict
an improvement in the hydrological regime in Africa from the 1990s onwards. However, the rainfall surplus of the
2000s does not fully explain the increasing trend of runoff, as between 2000-01 and 2007-08, inflows (referring to
the years 1970-71 and 1989-90) increased sharply by 108% while rainfall only slightly increased by 7.93%. These
changes led to significant modifications in surface characteristics and soil hydrodynamic behaviour (Amogu et al.,
2015).
Based on previous field experiments worldwide on the hydrological effect of vegetation decline (Albergel, 1987;
Karambiri et al., 2003; Descroix et al., 2009; Amogu et al., 2015), it is reasonable to attribute part of the increase in
8Nipp. J. Environ. Sci., 1(2): 1004
river flows in the Casamance basin upstream of Kolda to land cover decline. While many studies have investigated
the relationship between land cover and hydrological yield in River Basins, most of them indicate that a reduction
(increase) in land cover increases (reduces) runoff yield (Brown et al., 2005; Moran-Tejeda et al., 2012). This is a
consequence of changes in evapotranspiration and infiltration processes in affected River Basins (Moran-Tejeda et
al., 2012). Studies conducted in an experimental catchment south of the Duero River basin confirmed the role of the
forest as a regulator of runoff yield, through interception and evapotranspiration (Martinez-Fernandez et al., 2005;
Hernandez-Santana et al., 2008). These studies have highlighted the seasonal variability of forest hydrological
activity as a function of soil water availability and plant water requirements.
This impact of vegetation cover modification on flow noted in the Casamance basin upstream of Kolda is similar
to the studies by Zhang et al. (2001) and Cosandey et al. (2005) according to which, at local and global scales,
vegetation cover is involved in the processes of infiltration, interception and evapotranspiration. Indeed, according
to Bent (2001) and Gallart and Llorens (2003), any change in land use leading to an increase in vegetation cover
generally causes a decrease in runoff, while the removal of vegetation tends to increase river flow in basins. This
leads Descroix et al. (2009) to refer to the "Sahel hydrological paradox" to characterize the very strong modification
(natural or anthropogenic) of land use in the Sahel with the decrease in vegetation cover, the increase in cultivated
areas and the densification of the drainage network) having led to a more rapid concentration of water, aggravating
floods and reducing base flow, despite the decrease in rainfall in the Sahel. This is attributed to soil crusting leading
to an increase in the flow coefficients in the Sahelian zone from the onset of drought (Descroix et al., 2012). This
"hydrological paradox of the Sahel" is attributed to an anthropogenic signal (changes in land use) much more
important than the climatic signal (the decrease in rainfall) (Mahé et al., 2003; Seguis et al., 2003; Descroix et al.,
2013).
However, several studies have pointed out the difficulty of establishing the hydrological effect of changes in
vegetation cover. For example, Cosandey et al. (2005) found that the effects of forest thinning/reforestation or fire
on river flooding and mean runoff in experimental basins in southeastern France were evident in some cases but not
in others. Andréassian et al (1999) studied a set of 14 catchments in the French Massif Central and showed that
expansion of the forest area had minimal effects on the evolution of annual runoff, and that if an effect was present
it was completely masked by climate variability. Ashagrie et al. (2006) concluded that uncertainty in the data sets
made it very difficult to detect the impact of land use changes on the floodplain of the Meuse River. Guo et al. (2008)
showed that climate variability was the dominant factor in the evolution of annual runoff in a catchment in south-
eastern China, and that land-use changes had little effect outside of seasonal trends. To explain the heterogeneity of
results obtained at different locations, various authors (Andréassian 2004; Cosandey et al. 2005) have suggested the
importance of differences between study sites in characteristics, including surface area, soils and lithology, climate
and vegetation type or forest structure. It is also important to consider the scale of analysis and methodology used
(Moran-Tejeda et al., 2012). For this reason, the analysis of hydrological and climate series did not provide clear
evidence of the role of vegetation degradation in increasing flows in the basin. Although the hypothesis of forest
decline that could affect runoff was well noted during the analysis of the series, uncertainties emerged in determining
its actual impact on the evolution of runoff in the basin.
4. CONCLUSION
Land use and land-use change are dynamic phenomena that take place on fairly complex spatial and temporal
scales. Environmental studies have repeatedly revealed the role of natural factors and human activities in ecosystem
dynamics. This is the case of this study, which has shown the capacity of remote sensing technologies and GIS in the
study of natural and anthropogenic phenomena by demonstrating the valuable contribution of information acquired
through satellite images at increasingly precise and constantly improved resolutions between 1986 and 2018. The use
of NDVI has provided quality information that has been of great use in determining trends in land cover dynamics,
while the analysis of land cover data reinforces the indicators provided by rainfall data. Moreover, this paper also
enabled an assessment of water resources in the Casamance catchment upstream of Kolda based on rainfall and flow
indices in a context of climate change, while highlighting the complexity of the relations between climate and the
water cycle. Indeed, it is demonstrated, among other things, that any climate change simultaneously affects different
components of the hydrological systems: the quantity of rainfall, its intensity and frequency, runoffs, etc. This
coupled evolution of land use and the hydrological cycle is common in the Sahel, and the increase in runoff, in
particular, has also been observed at point, meso and regional scales.
Land use/land cover in the Casamance catchment upstream of Kolda underwent a radical change during the period
1987-2018. The results showed that there is a decrease in the area of vegetation cover, especially forests (-61.37%).
The forest area in the Casamance River Basin upstream of Kolda has shrunk due to clearing for agricultural needs,
9Faye et al.
Study of the fluctuation of the NDVI in the Casamance basin upstream of Kolda using remote sensing data: what
impact on flow?
bush fires, population increase, uncontrolled wood cutting, and changes in rainfall conditions.... This situation is
undoubtedly dependent on the climatic context, the exploitation of both water resources (hydro-agricultural
development) and wood cutting (economy of extraction), etc. within the Casamance River Basin upstream of Kolda.
Indeed, these already fragile and unpredictable resources could be even more so in a context of climate change due
to its unpredictable nature, which would lead either to a decrease in rainfall or an increase in temperature. Also,
serious threats could seriously affect the life of a population that is growing in number and strongly dependent on the
exploitation of the environment.
From a hydrological point of view, the trend in recent years has been characterized by an excess of rainfall, even
if the overall pattern of flows does not necessarily indicate the trend of increasing runoff. In the Sahel, this increase
in flows could be partly explained by the decrease in vegetation cover, which leads to a faster concentration of water,
an increase in floods and a reduction in base flow, despite the decrease in rainfall. On the other hand, there are
uncertainties regarding the specific role of land cover decline on the evolution of runoff at the basin scale. This
deforestation calls for the implementation of sustainable, integrated and participatory natural resource management
strategies at the level of the Casamance catchment upstream of Kolda, with the involvement of various stakeholders
(State, NGOs, local populations, etc.). It will therefore be a question of anticipating possible crises that could result
from the misuse of an environment that is both fragile and presenting multiple stakes.
Conflict of Interest: We declare that there is no conflict of interest.
REFERENCES
Albergel, J. (1987). Genèse et prédétermination des crues au Burkina Faso; du m2 au km2, étude des paramètres
hydrologiques et de leur évolution. Thesis (PhD) Université Paris 6, Editions de l’Orstom.
Ali, A., Lebel, T., Amami, A. (2008). Signification et usage de l'indice pluviométrique au Sahel. Sécheresse, 19 (4),
227-235.
Al-Obaidy, E., Al-Baldawi, S.N. (2019). The Study of NDVI Fluctuation in Southern Iraq (Hor Ibn Najim) Using
Remote Sensing Data. Al-Mustansiriyah Journal of Science, 30 (1), 1-6.
https://doi.org/10.23851/mjs.v30i1.556
Amogu, O., Esteves, M., Vandervaere, J-P., Malam Abdou, M., Panthou, G., Rajot, J-L., Souley Yéro, K.,
Boubkraoui, S., Lapetite, J.-M., Dessay, N., Zin, I., Bachir, A., Bouzou Moussa, I., Faran Maïga, O., Gautier
E., Mamadou I., Descroix L. (2015). Runoff evolution due to land-use change in a small Sahelian catchment,
Hydrological Sciences Journal, 60(1), 78-95. https://doi.org/10.1080/02626667.2014.885654
ANAT (2018). Plan national d'aménagement et de développement territorial (PNADT) horizon 2035. Version
Provisoire. Édit. Agence Nationale d'Aménagement du Territoire, Dakar, Senegal.
Andréassian, V. (2004). Waters and forests: from historical controversy to scientific debate. J Hydrol., 291, 1–27.
https://doi.org/10.1016/j.jhydrol.2003.12.015
Andréassian, V.C., Tangara, M., Muraz, J., Caugant, C., Cosandey, C., Derioz, P., Laques, A.E., Bourreau, J.G.,
Didon, E., Durrieu, S., Hamza, N. (1999). Indicateur d’impact de l’évolution du couvert forestier sur la
ressource en eau a` l’échelle des bassins versants des Cévennes et de la Montagne noire. Vie et Sociétés du
CNRS.
Andrieu, J. (2008). Dynamique des paysages dans les régions septentrionales des Rivières-du-Sud (Sénégal, Gambie,
Guinée-Bissau). Thèse de l'Université Paris Diderot - Paris 7, France.
Ashagrie, A.G., de Laat, P.J.M., de Wit, M.J.M., Tu, M., Uhlenbrook, S. (2006). Detecting the influence of land use
changes on discharges and floods in the Meuse River Basin—the predictive power of a ninety-year rainfall-
runoff relation? Hydrol Earth Syst Sci, 10:691–701. https://doi.org/10.5194/hess-10-691-2006
Aubreville, A. (1957). Accord de Yangambi sur la nomenclature des types africains de végétation. Revue Bois et
Forêts des Tropiques, 51, 23-27.
Barua, S., Perera, B.J.C., Ng, A.W.M. (2009). A comparative drought assessment of Yarra River Catchment in
Victoria, Australia. 18th World IMACS / MODSIM Congress, Cairns, Australia 13-17 July, 3245-3251.
Bent, G.C. (2001). Effects of forest-management activities on runoff components and ground-water recharge to
Quabbin Reservoir, central Massachusetts. For Ecol Manag, 143, 115–129.
Bodian, A. (2011). Approche par modélisation pluie-débit de la connaissance régionale de la ressource en eau:
Application au haut bassin du fleuve Sénégal. Thèse de doctorat, UCAD, Sénégal.
Bodian, A., Bacii, M., Diop, M. (2015). Fleuve Casamance impact potentiels du changement climatique sur les
ressources en eau de surface du bassin de la Casamance à partir des scenarios du CMIP5. PAPPSEN, Rapport
n° 16 Octobre 2015, Sénégal.
10Nipp. J. Environ. Sci., 1(2): 1004
Bootsma, A., Boisvert, J.B., De Jong, R., Baier W. (1996). Drought La sécheresse et l’agriculture canadienne.
Sécheresse, 7: 277-285.
Commission Européenne (2001). Manuel des concepts relatifs aux systèmes d’information sur l’occupation et
l’utilisation des sols. Luxembourg, Office des publications officielles des Communautés européennes,
Luxembourg.
Cosandey, C, Andreassian, V., Martin, C., Didon-Lescot, J.F., Lavabre, J., Folton, N., Mathys, N., Richard, D. (2005).
The hydrological impact of the mediterranean forest: a review of French research. J Hydrol., 301, 235–249.
Dacosta, H. (1989). Précipitations et écoulements sur le bassin de la Casamance. Dakar: ORSTOM, multigr. Thèse
3e cycle, Université Cheikh Anta Diop, Dakar, Sénégal.
Descroix, L., Bouzou Moussa, I., Genthon, P., Sighomnou, D., Mahé, G., Mamadou, I., Vandervaere, J-P., Gautier,
E., Faran Maiga, O., Rajot, J-L., Malam Abdou, M., Dessay, N., Ingatan, A., Noma, M., Souley Yéro, K.,
Karambiri, H., Fensholt, R., Albergel, J., and Olivry, J-C. (2013). Impact of Drought and Land – Use Changes
on Surface –Water Quality and Quantity: The Sahelian Paradox. Hydrology, In Tech, Zagreb, Croatie.
http://dx.doi.org/10.5772/54536.
Descroix, L., Genthon, P., Amogu, O., Rajot, J-L., Sighomnou, D., Vauclin, M. (2012). Change in Sahelian Rivers
hydrograph: the case of recent red floods of the Niger River in the Niamey region. Global Planetary Change,
98–99, 18–30. https://doi.org/10.1016/j.gloplacha.2012.07.009
Descroix, I., Mahé, G., Lebel, T., Favreau, G., Galle, S., Gautier, E., Olivry, J.C., Albergel, J., Amogu, O.,
Cappelaere, B., Dessouassi, R., Diedhiou, A., Le Breton, E., Mamadou, I., Sighomnou, D. (2009). Spatio-
temporal variability of hydrological regimes around the boundaries between Sahelian and Sudanian areas of
West Africa: A synthesis. Journal of Hydrology, 375, 90- 102. https://doi.org/10.1016/j.jhydrol.2008.12.012
Dessay, N. (2006). Dynamique de la végétation et du climat: étude par télédétection de cinq biomes brésiliens, forêt
ombrophile dense et ouverte, Cerrados, Caatinga et Campanha Gaúcha. Thèse de l'Université Paris X -
Nanterre, France.
Dione O. (1996). Evolution climatique récente et dynamique fluviale dans les hauts bassins des fleuves Sénégal et
Gambie. Thèse de doctorat, Université Lyon 3 Jean Moulin, France.
Djoufack-Manetsa, V. (2011). Étude multi-échelles des précipitations et du couvert végétal au Cameroun: Analyses
spatiales, tendances temporelles, facteurs climatiques et anthropiques de variabilité du NDVI. Thèse de
doctorat, Université de Bourgogne et Université de Yaoundé I, Cameroon.
Ducrot, D. (2005). Méthodes d'analyse et d'interprétation d'images de télédétection multi-sources, extraction de
caractéristiques du paysage. Mémoire d'HDR, INP Toulouse, France.
Faye, C. (2013). Evaluation et gestion intégrée des ressources en eau dans un contexte de variabilité hydroclimatique :
cas du bassin versant de la Falémé. Thèse (PhD). Université Cheikh Anta Diop de Dakar, Sénégal.
Faye, C. (2019). Les territoires de l'eau au Sénégal: " les faits de géographie physique et humaine à travers l'élément
eau " Les éditions Chapitre.com, France.
Faye, C., Ndiaye, A. et Mbaye, I. (2017). Une évaluation comparative des séquences de sècheresse météorologique
par indices, par échelles de temps et par domaines climatiques au Sénégal. Journal. Wat. Env. Sci, 1(1), 11-
28.
Faye, C., Sow, A.A. and Ndong, J.B. (2015). Étude des sècheresses pluviométriques et hydrologiques en Afrique
tropicale : caractérisation et cartographie de la sècheresse par indices dans le haut bassin du fleuve Sénégal.
Physio-Géo, 9, 17-35. https://doi.org/10.4000/physio-geo.4388
Forootan, E., Schumacher, M., Awange, J. L., & Schmied, H. M. (2016). Exploring the influence of precipitation
extremes and human water use on total water storage (TWS) changes in the Ganges–Brahmaputra–Meghna
River Basin. Water Resources Research, 52(3), 2240–2258. https://doi.org/10.1002/2015WR018113
Gallart, F., Llorens, P. (2003). Catchment management under environmental change: impact of land cover change on
water resources. Water Int., 28, 334–340. https://doi.org/10.1080/02508060308691707
IPCC (2007). Summary for Policymakers. In: Climate Change 2007). The Science, Contribution of Working Group
I to the Fourth Assessment Report of the Intergovernmental Panel on Climate Change, [Solomon S., A. Quin,
M. Manning, Z. Chen, M. Marquis, K.B. Averyt, M. Tignor and H.L. Miller (eds.)], Cambridge University
Press, Cambridge, UK and New York, NY, USA.
IPCC (2013). Climate Change 2013). The science. Summary for policy makers. WMO, UNEP.
Gilabert, M.A., Gonzalez, J. P., Melia, J. (2002). A generalized soil-adjusted vegetation index. Remote Sensing of
Environment, 82, 303-310. https://doi.org/S0034-4257(02)00048-2
Girard, M.C., Girard, C.M. (2010). Traitement des données de télédétection: environnement et ressources naturelles.
Édit. Dunod, Paris, 2ème édition, France.
11Faye et al.
Study of the fluctuation of the NDVI in the Casamance basin upstream of Kolda using remote sensing data: what
impact on flow?
Gond, V., Fontes, J., Loudjani, P. (1997). Dynamique des biomes africains par l’analyse de séries temporelles
satellitales. C.R. Acad. Sci. Paris, Sciences de la vie, 179-188. https://doi.org/10.1016/S0764-4469(97)85010-
X
Griffith, J. A., Martinko, E. A., Whistler, J. L., Price, K.P. (2002). Interrelationships among landscapes, NDVI, and
stream water quality in the US Central Plains. Ecological Applications, 12 (6), 1702–1718.
Guo, H., Hu, Q., Jiang, T. (2008). Annual and seasonal streamflow responses to climate and land-cover changes in
the Poyang Lake basin, China. J Hydrol, 355:106–122. https://doi.org/10.1016/j.jhydrol.2008.03.020
Hernandez-Santana, V., Martı´nez-Ferna´ndez, J, Mora´n, C, Cano, A. (2008). Response of Quercus pyrenaica
(melojo oak) to soil water deficit: a case study in Spain. Eur J For Res, 127:369–378.
https://doi.org/10.1007/s10342-008-0214-x
Hountondji, Y.C., Sokpon, N, Nicolas, J. et Ozer, P. (2009). Ongoing desertification processes in the sahelian belt of
West Africa: an evidence from the rain-use efficiency. In: Recent advances in remote sensing and
geoinformation processing for land degradation assessment, A. RÖDER et J. HILL édit., Édit. CRC Press,
série ISPRS, 8, 173-186.
Kanohin, F., M.B. Saley, Savané, I. (2009). Impacts de la variabilité climatique sur les ressources en eau et les
activités humaines en zones tropicale humide: Cas de la région de Daoukro en Côte d’Ivoire. European Journal
of Scientific Research, 26(2): 209-222.
Karambiri, H., Ribolzi, O., Delhoume, J-P., Ducloux, J., Coudrain, R. A., Casenave, A. (2003). Importance of soil
surface characteristics on water erosion in a small grazed Sahelian catchment. Hydrological Processes, 17,
1495–1507. https://doi.org/10.1002/hyp.1195
Kundu, A., Denis, D.M., Patel, N.R., Dutta, D. (2018). A geospatial study for analysing temporal responses of NDVI
to rainfall. Singapore Journal of Tropical Geography, 39(1), 107–116. https://doi.org/10.1111/sjtg.12217
Kundzewicz, Z.W., Mata, L.J., Arnell, N.W., Do¨ll, P., Kabat, P., Jime´nez, B., Miller, K.A., Oki, T., Sen, Z.,
Shiklomanov, I.A. (2007). Freshwater resources and their management. In: Parry ML, Canziani OF, Palutikof
JP, van der Linden PJ, Hanson CE (eds) Climate change 2007 impacts, adaptation and vulnerability.
Contribution of working group II to the fourth assessment report of the intergovernmental panel on climate
change. Cambridge University, Englang.
Llorens, P., Domingo, F. (2007). Rainfall partitioning by vegetation under Mediterranean conditions. A Rev Stud
Eur J Hydrol, 335, 37–54. https://doi.org/10.1016/j.jhydrol.2006.10.032
Mahé, G., Paturel, J. E., Servat, E., Conway, D., Dezetter, A. (2005). The impact of land use change on soil water
holding capacity and river flow modelling in the Nakambe River, Burkina-Faso. Journal of Hydrology, 300(1),
33-43. https://doi.org/10.1016/j.jhydrol.2004.04.028
Martinez-Fernandez, J., Ceballos, A., Casado, S., Moran, C., Hernandez, V. (2005). Runoff and soil moisture
relationships in a small forested basin in the Sistema Central ranges (Spain). Geomorpholog Process Human
Impacts River Basins, 299:31–36.
Masse, A. (2013). Développement et automatisation de méthodes de classification à partir de séries temporelles
d'images de télédétection-Application aux changements d'occupation des sols et à l'estimation du bilan
carbone. Thèse de l'Université Toulouse III - Paul Sabatier, France.
Mballo, I. (2016). Projet d’autosuffisance en riz et développement des aménagements hydroagricoles dans le bassin
de l’Anambé (Kolda), Mémoire de Master, UASZ, Ziginchor, Sénégal.
Mballo, I., Sy, O., Faye, C. (2016). Variabilité climatique et productions vivrières en Haute Casamance (SUD-
SENEGAL). Espace Géographique et Société Marocaine, 28/29, 161-178.
Moran-Tejeda, E. Ceballos-Barbancho, A., Llorente-Pinto, J. M., Lopez-Moreno, J., I. (2012). Land-cover changes
and recent hydrological evolution in the Duero Basin (Spain). Reg Environ Change, 12, 17–33.
Omonijo, T.O. Okogbue, E.C. (2014). Trend Analysis of Drought in the Guinea and Sudano- Sahelian Climatic Zones
of Northern Nigeria (1907-2006). Atmospheric and Climate Sciences, 4, 483-507.
https://doi.org/10.4236/acs.2014.44045
Ouoba, A.P. (2013). Changements climatiques, dynamique de la végétation et perception paysanne dans le Sahel
burkinabè. Thèse de Doctorat Unique, Université de Ouagadougou, Burkina Faso.
Projet d'Appui au Développement Rural en Casamance (PADERCA) (2008). Etablissement de la situation de
référence du milieu naturel en basse et moyenne Casamance. République du Sénégal Ministère de l’Agriculture
Rapport final, Sénégal.
Rouse, J.W., Haas, R.W., Schell, J.A., Deering, D.W., Harlem, J.C. (1974). Monitoring the vernal advancement and
retrogradation (Greenwave effect) of natural vegetation. Édit. NASA/GSFC, rapport final, Greenbelt, USA.
Sagna, P. (2005). Dynamique du climat et de son évolution récente dans la partie ouest de l’Afrique occidentale.
Thèse de Doctorat d’Etat, Université Cheikh Anta Diop de Dakar, Sénégal.
12Nipp. J. Environ. Sci., 1(2): 1004
Sané, T., Sy, O. and Dieye, E. H. B. (2011). Changement climatique et vulnérabilité de la ville de Ziguinchor. Actes
du colloque "Renforcer la résilience au changement climatique des villes: du diagnostic spatialisé aux mesures
d'adaptation" (2R2CV) 07 et 08 juillet 2011, Université Paul Verlaine - Metz, France.
Séguis, L., Cappelaere, B., Peugeot, C., Leduc, C., Milesi, G. (2003). Influences de la sécheresse et du défrichement
sur les écoulements d'un petit bassin sahélien. IAHS PUBLICATION, 429-434.
Solly, B., Dieye, E.B., Mballo, I., Sy, O., Sané, T., Thior, M. (2020). Dynamique spatio-temporelle des paysages
forestiers dans le Sud du Sénégal: cas du département de Vélingara. Physio-Géo, 15. URL:
http://journals.openedition.org/physio-geo/10058. https://doi.org/10.4000/physio-geo.10634
Solly, B., Dieye, E.H.B., Sy, O., Barry, B. (2018). Suivi de la déforestation par télédétection Haute-résolution dans
le département de Médina Yoro Foulah (Haute-Casamance, Sénégal). Journal International en Sciences et
Techniques de l'Eau et de l'Environnement, 3, 2, 38-41.
Sow, A.A. (2007). L’hydrologie du Sud-est du Sénégal et de ses Confins guinéo-maliens: les bassins de la Gambie
et de la Falémé. Thèse (PhD). Université Cheikh Anta Diop de Dakar, Sénégal.
Stancioff, A., Staljanssens, M., Tappan, G. (1986). Cartographie et télédétection des ressources de la République du
Sénégal. Étude de la géologie, de l'hydrogéologie, des sols, de la végétation et des potentiels d'utilisation des
sols. Édit. République du Sénégal/Agence des USA pour le développement, projet de cartographie et de
télédétection SDSU-RSI-86-01, XVII, Sénégal.
Tappan G.G., Sall M., Wood E.C. (2004) Ecoregions and land cover trends in Senegal. Journal of Arid Environments,
59, 3, 427-462. https://doi.org/10.1016/j.jaridenv.2004.03.018
USGS agency (2020). “Science for changing world”, sole science agency for the Department of the Interior,
http://earthexplorer.usgs.gov/
Zhang, L, Dawes, W.R., Walker, G.R. (2001). Response of mean annual evapotranspiration to vegetation changes at
catchment scale. Water Resour Res., 37, 701–708. https://doi.org/10.1029/2000WR900325
13You can also read