Uncertainties in projections of sandy beach erosion due to sea level rise: an analysis at the european scale - Nature
←
→
Page content transcription
If your browser does not render page correctly, please read the page content below
www.nature.com/scientificreports
OPEN Uncertainties in projections
of sandy beach erosion due
to sea level rise: an analysis
at the European scale
Panagiotis Athanasiou1,2*, Ap van Dongeren1,4, Alessio Giardino1, Michalis I. Vousdoukas3,
Roshanka Ranasinghe1,2,4 & Jaap Kwadijk1,2
Sea level rise (SLR) will cause shoreline retreat of sandy coasts in the absence of sand supply
mechanisms. These coasts have high touristic and ecological value and provide protection of valuable
infrastructures and buildings to storm impacts. So far, large-scale assessments of shoreline retreat use
specific datasets or assumptions for the geophysical representation of the coastal system, without any
quantification of the effect that these choices might have on the assessment. Here we quantify SLR
driven potential shoreline retreat and consequent coastal land loss in Europe during the twenty-first
century using different combinations of geophysical datasets for (a) the location and spatial extent
of sandy beaches and (b) their nearshore slopes. Using data-based spatially-varying nearshore slope
data, a European averaged SLR driven median shoreline retreat of 97 m (54 m) is projected under RCP
8.5 (4.5) by year 2100, relative to the baseline year 2010. This retreat would translate to 2,500 km2
(1,400 km2) of coastal land loss (in the absence of ambient shoreline changes). A variance-based global
sensitivity analysis indicates that the uncertainty associated with the choice of geophysical datasets
can contribute up to 45% (26%) of the variance in coastal land loss projections for Europe by 2050
(2100). This contribution can be as high as that associated with future mitigation scenarios and SLR
projections.
The global society’s response to impending climate change impacts will be one of the great challenges in the
coming decades1. With future projections indicating accelerating rates of sea level r ise2,3, increasing intensity
and frequency of extreme sea levels4–6 and increases in the exposed population and capital7, low elevation coastal
zones will be particularly vulnerable to climate change. About 10% of the world’s population resides in these low
elevation coastal zones, defined as the area with an elevation less than 10 m above mean sea l evel8.
Coastal zones with sandy beaches, which comprise almost one third of the world’s coastline9, are geomor-
phologically highly dynamic, responding to hydro-morphological processes acting at different time-scales, such
as waves, tides, storms and long-term changes of water levels. In particular, sea level rise (SLR) is expected to
contribute significantly to future shoreline r etreat10,11. Shoreline retreat can diminish the touristic and recreational
value of beaches and/or cause direct impacts to infrastructure by structural failure. Additionally, since sandy
beaches act as the first buffer against storm surges and wave attack, shoreline retreat can increase the vulnerability
of the hinterland to flooding12–15.
Many studies have taken up the challenge of quantifying shoreline retreat at the local or sub-regional
(~ < 500 km of coastline) scale, mostly at locations where high resolution and high accuracy data are
available16–20. The availability of such data enables the use of higher complexity process m odels21,22, probabilis-
tic assessments19,23,24 and uncertainty decomposition25. On the other hand, when shoreline retreat is assessed at
the regional26–28 (~ > 500 km of coastline), continental29 or global scale30,31, a high number of constraints emerge
related to data availability, data resolution, data accuracy, and computational demands32,33. This necessitates the
1
Deltares, PO Box 177, 2600 MH Delft, The Netherlands. 2Water Engineering and Management, Faculty of
Engineering Technology, University of Twente, PO Box 217, 7500 AE Enschede, the Netherlands. 3European
Commission, Joint Research Centre (JRC), Via Enrico Fermi 2749, 21027 Ispra, Italy. 4Department of Water Science
and Engineering, IHE Delft Institute for Water Education, PO Box 3015, 2610 DA Delft, The Netherlands. *email:
panos.athanasiou@deltares.nl
Scientific Reports | (2020) 10:11895 | https://doi.org/10.1038/s41598-020-68576-0 1
Vol.:(0123456789)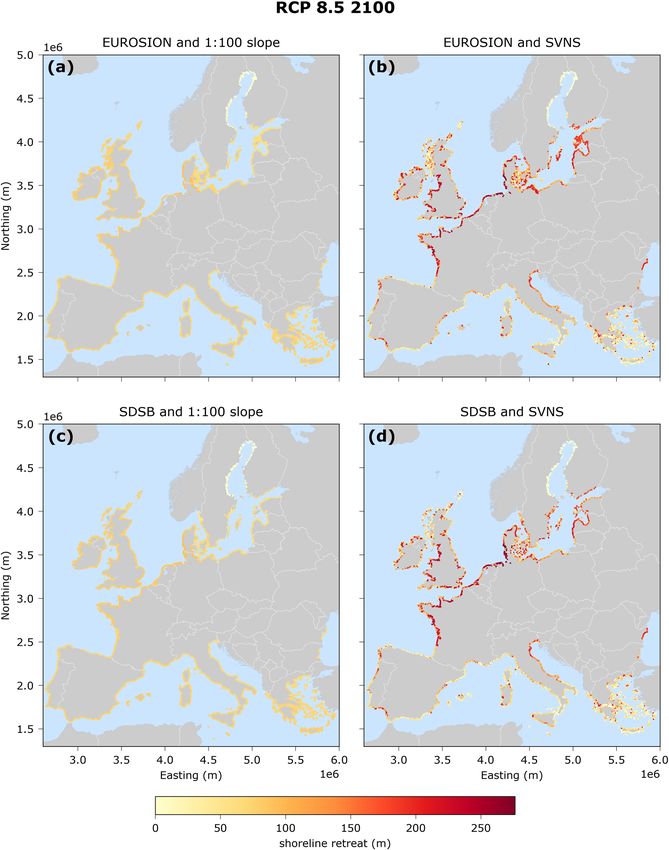
www.nature.com/scientificreports/
use of simpler behavioural models to predict the response of sandy coastlines to SLR at these larger scales. The
Bruun Rule34 currently offers the only computationally viable method to assess the retreat of sandy shorelines
due to SLR at the global, continental or regional scale, even though so far it has received a lot of criticism on
its assumptions and widespread use (see Discussion section). This simple two-dimensional mass conservation
principle predicts a landward retreat of the shoreline in response to SLR assuming that the beach will maintain
an equilibrium profile. It requires as input the SLR amplitude and the nearshore bed slope of the sandy beach.
The Bruun Rule has been widely used to derive shoreline retreat projections at the r egional27,28,35, global30,31 and
local scale.
Hinkel et al.30 assessed the global impacts of SLR using the Bruun Rule in an—at that time—state of the art
global framework. They described the spatial distribution of sandy coastlines qualitatively for coastal segments
of varying length based on an aggregation of various coastal typology datasets. Additionally, they assumed the
same nearshore slope (1:100) across all the sandy beaches globally, neglecting the inherent spatial variability of
coastal profile slopes, an assumption that can be quite crucial, since shoreline retreat is linearly dependent on
the nearshore slope under the Bruun rule.
In our study, we focus only in SLR driven future shoreline retreat and land loss at sandy beaches, not taking
into account other processes driving long-term shoreline change such as natural gradients in alongshore sedi-
ment transport, changes in sediment transport due to human interventions (e.g. port construction)22, fluvial
sediment supply36,37, marine feeding38 or sand nourishments/land reclamations9. These long-term shoreline
change patterns are defined herein as ambient shoreline changes31,39. Since these patterns might be affected by
non-monotonic signals, in our analysis we do not consider these, but rather focus on the effects of SLR alone as
an indicator of climate change erosion impact which allows studying uncertainties related to input geophysical
datasets. In order to estimate SLR driven shoreline retreat and land loss at sandy beaches (hereafter referred to
as coastal land loss for convenience), we also employ the Bruun Rule, due to the scale of the study (i.e. Europe).
However, we improve the representation of the geophysical information by computing the shoreline retreat
due to SLR at the European scale and its uncertainties using: (a) two different datasets that describe the spatial
distribution of sandy beaches, and (b) two different approaches to describe the nearshore slope. For the former,
a reclassification from the EUROSION p roject40 and a dataset of satellite derived sandy b eaches9 (SDSB) are
used. For the latter, we apply a newly produced global dataset with spatially varying nearshore slopes41 (SVNS)
and for comparison purposes, the commonly-used constant slope assumption of 1:100, given that it has been
used before in large-scale coastal studies in absence of any other i nformation29,30 (see “Methods”, subsection 2).
Regional SLR projections associated with the moderate-emission-mitigation-policy scenario (RCP 4.5) and a
high-end, business-as-usual scenario (RCP 8.5) assuming also an increased contribution from ice-sheets (as used
in Vousdoukas et al.31) are applied as boundary conditions42. These projections include a glacial isostatic adjust-
ment (GIA) model43 and are probabilistic, taking into account uncertainties related to SLR physical processes
and climate modelling (see “Methods”, subsection 3).
Our analysis is performed at an alongshore spacing of 1 km using the Open Street Maps coastline which allows
us to produce an ensemble of coastal land loss projections per region and subsequently aggregate to EU Member
State level. The regions used in this study are the 3 rd level of the Nomenclature of Territorial Units for Statistics
(NUTS 3), as defined by EUROSTAT44. Four different geophysical data (i.e., sandy beach location and nearshore
slope) combinations are generated: (a) EUROSION and 1:100 slope, (b) EUROSION and SVNS, c) SDSB and
1:100 slope and d) SDSB and SVNS. For each of these combinations the SLR driven potential shoreline retreat
and coastal land loss, relative to the baseline year 2010, are estimated under RCP 4.5 and 8.5 making in total 8
different assessments. These are compared at a European and regional level. We estimate the potential shoreline
retreat due to SLR using the Bruun rule and then aggregate it to coastal land loss as:
n
SLRi
LL = • Li , (1)
tan(βi )
i=1
where SLRi is the regional SLR at the time of interest, tan(βi ) is the nearshore slope41 (see “Methods”, sub-
section 1 for definition) and Li is the length of each segment represented by grid point i (here 1 km), while n
is the total number of grid points in the area of interest. The term tan(β SLRi
i)
is essentially the Bruun rule, which
gives the potential shoreline retreat R at each grid point i , and it is set to zero if the point is not sandy or SLR is
negative. We use coastal land loss as we believe that a metric of eroded area per NUTS3 region is much more
descriptive than shoreline retreat because it takes the fraction of sandy beach length over the entire cell and thus
the uncertainties with respect to the sandy beach location datasets into account. Additionally, area metrics can
relate to beach capacity (e.g. for tourism) and needed quantity of beach nourishment material, so overall coastal
land loss can be quite relevant for stakeholders. An overview of the framework followed in the analysis herein
is presented in Fig. 1.
A variance-based sensitivity analysis25 (see “Methods”, subsection 4) was applied to quantify the contribution
of each source of uncertainty in Eq. (1) to the total uncertainty of the coastal land loss projections. These sources
are (a) the dataset choice for the location of sandy beaches, (b) spatially-varying or uniform nearshore slopes, (c)
the RCP scenario and d) the SLR projections uncertainty within each RCP. By assigning a probability distribution
(see “Methods”, subsection 4) to each of the four aforementioned input parameters, we propagate the uncertain-
ties of the input parameters to the coastal land loss projections, using a Monte-Carlo approach comprising 50,000
simulations per region and per decade (Supplementary Fig. S14). Uncertainty indices, describing the relative
uncertainty contribution of each source defined above, are calculated for each NUTS3 region for different time
horizons in the twenty-first century.
Scientific Reports | (2020) 10:11895 | https://doi.org/10.1038/s41598-020-68576-0 2
Vol:.(1234567890)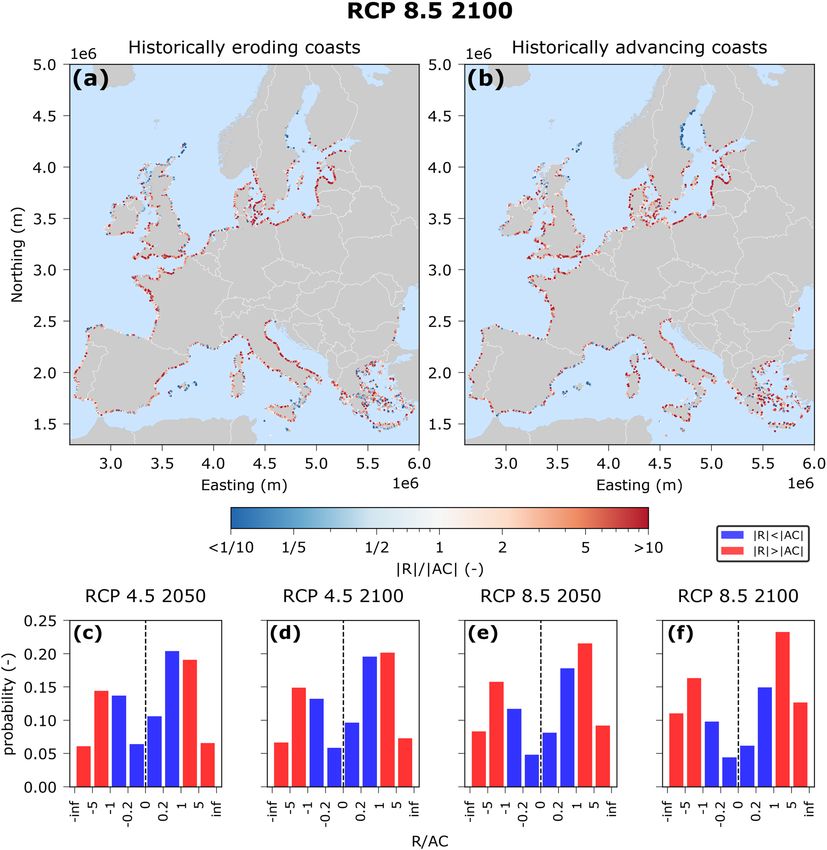
www.nature.com/scientificreports/
Figure 1. Schematization of the framework used herein to compute future European coastal land loss under
the four different uncertain sources: (1) sandy beach location data, (2) nearshore slope data, (3) climate change
scenario, and (4) sea level rise projections.
The projections thus obtained indicate the spatial variability in SLR driven potential shoreline retreat and
coastal land loss and how the choice of input geophysical data (i.e., sandy beach location and nearshore slopes)
can influence these projections. Additionally, the novel uncertainty analysis allows quantifying and comparing
the uncertainties related to the choice of input geophysical datasets versus the inherent uncertainty associated
with RCPs and SLR projections. The choice of the geophysical datasets is a type of epistemic uncertainty, mean-
ing that it is connected with limitations in the current scientific knowledge and methods to accurately describe
these characteristics of the coast at the considered spatial scale.
Results
Sandy beach erosion. Using the SDSB and SVNS data, by 2050 we project a European average SLR driven
potential shoreline retreat (in the absence of ambient shoreline changes) of between 18.1 and 53.9 m (5%—95%
confidence interval) under RCP 8.5, relative to the baseline year 2010 (Fig. 2). At the end of the century, these
projections reach values between 51 and 241.5 m. For RCP 4.5, the potential shoreline retreat by 2050 is pro-
jected to be between 10.7 and 33.9 m (5%—95% confidence interval), i.e. almost 35% smaller than that for RCP
8.5. At the end of the century, mitigation could play an even more important role with a reduction of almost 55%
in average shoreline retreat under RCP 4.5 compared to that projected for RCP 8.5. The use of the EUROSION
versus the SDSB dataset has a minor effect on the European average shoreline retreat, with absolute differences
of less than 3.5% (Fig. 2). On the other hand, the European average shoreline retreat values computed with the
SVNS data are almost 36% larger compared to that calculated with the 1:100 uniform slope assumption.
With respect to the total coastal land loss, we project 473–1,410 km2 (5–95% confidence interval) being lost
across Europe under RCP 8.5 by 2050, using the SDSB and SVNS data (Fig. 2). By 2100 this range is projected
to be between 1,334 and 6,316 k m2. Under RCP 4.5, these values are almost 35% and 55% smaller by 2050 and
2100, respectively. The use of the EUROSION dataset instead of SDSB results in a reduction of almost 9% in
the coastal land loss projections. On the other hand, when the 1:100 uniform slope assumption is used, the dif-
ferences between the projections using the two different sandy beach location datasets increase, with the SDSB
projecting 30% more coastal land loss.
The confidence intervals of the projections of the European average shoreline retreat and total coastal land loss
(Fig. 2) per data combination are directly connected to the uncertainty in the SLR projections (Supplementary
Fig. S13). These uncertainties are related to the contribution of steric SLR, ice sheets, glaciers and land–water
storage42. At the end of the century, the uncertainty related to the dynamic behaviour of the Antarctic ice sheet
dominates the total uncertainty of the SLR projections42, which consequently introduces a large uncertainty to
the end of century shoreline retreat and coastal land loss values.
For each individual data combination, the shoreline retreat projections differ spatially across Europe (Fig. 3).
As expected, when using the 1:100 uniform nearshore slope assumption, the European coastal retreat map is quite
uniform with modest spatial variability which arises only due to regional SLR differences. On the other hand,
when the SVNS data are used, coastal retreat across Europe is more spatially variable (Fig. 3 and Supplementary
Scientific Reports | (2020) 10:11895 | https://doi.org/10.1038/s41598-020-68576-0 3
Vol.:(0123456789)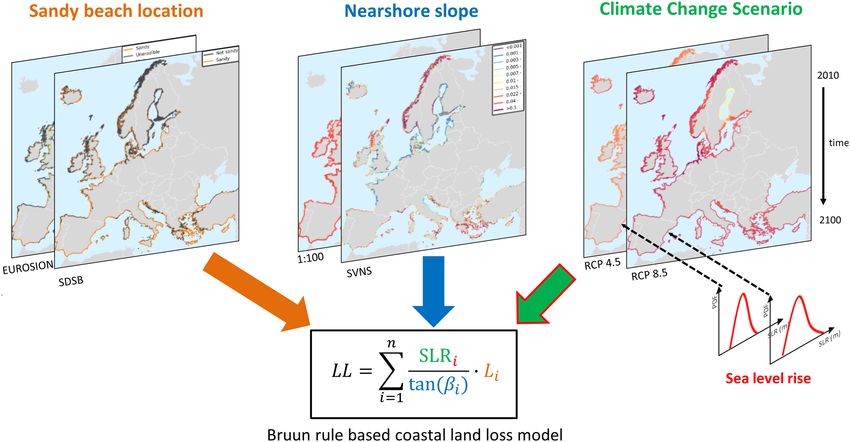
www.nature.com/scientificreports/
Figure 2. Projections of the European mean potential shoreline retreat (a, b, e, f) and European total coastal
land loss (c, d, g, h) under the RCP 4.5 (blue colors) and RCP 8.5 (red colors), relative to the baseline year 2010
(in the absence of ambient shoreline changes), for the four different geophysical data (sandy beach location
and nearshore slope) combinations: (a, c) EUROSION and 1:100 slope, (b, d) EUROSION and SVNS, (e, g)
SDSB and 1:100 slope and (f, h) SDSB and SVNS. The solid lines are the projected potential shoreline retreat/
coastal land loss under the median SLR projections, while the shaded areas indicate the 5% and 95% confidence
intervals.
Fig. S1). Only in the North Baltic Sea is the shoreline retreat significantly low due to GIA which reduces the
regional SLR in the a rea43.
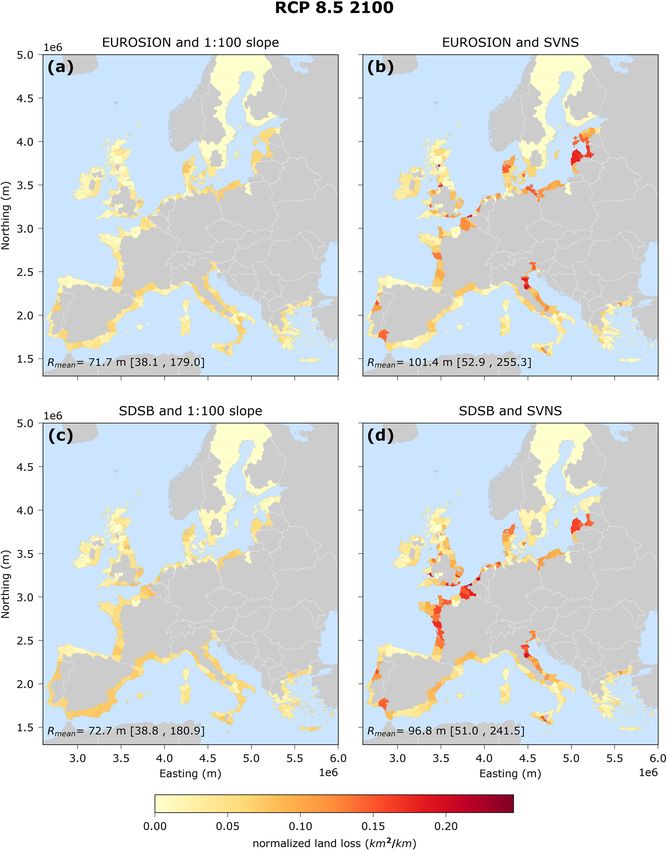
The coastal retreat values calculated per location are aggregated to coastal land loss at the NUTS3 regional
level using Eq. (1), and then normalized according to the coastal length of each NUTS3 region. This results in
maps that indicate vulnerable NUTS3 regions which could potentially lose large coastal areas with respect to
their total coastal length. The spatial distribution of the normalized coastal land loss per region (in the absence
of ambient shoreline changes) varies between the four data combinations but has a similar spatial pattern for
RCP 8.5 (Fig. 4 and Supplementary Fig. S3) and RCP 4.5 (Supplementary Figs S2 and S4), with the magnitude
differing significantly. The normalized coastal land loss (km2 of area lost / km of coastline) is the combination of
the coastal retreat per location, which is in turn connected to the SLR and the average nearshore slopes, and the
relative length of the sandy coastline. When using the SVNS data and irrespective of the sandy beach distribu-
tions dataset, highly vulnerable regions are identified on the Italian Adriatic coast, the French Atlantic coast,
Belgium, The Netherlands, Denmark, Lithuania and Latvia (Fig. 4).
Uncertainty analysis. As the results presented above indicate, the choice of the input geophysical datasets
(i.e., sandy coastline and nearshore slope) is critical for the representation of the coastal retreat along the Euro-
pean coastline. The relative contribution of the different sources of uncertainty to the total uncertainty (being
equal to unity in every year) and their temporal evolution per European country are quantified using a global
sensitivity analysis (Fig. 5). The main effect of each source of uncertainty in Eq. (1) to the total variance of the
coastal land loss projections (in the absence of ambient shoreline changes) per NUTS3 region is described by
the 1st order Sobol index (see “Methods”, subsection 4). This value can be interpreted as the relative amount of
the total variance that would be removed if the true value of the parameter was known25. The global sensitivity
analysis was performed for each NUTS 3 region, mapping the contribution of each parameter to the total vari-
Scientific Reports | (2020) 10:11895 | https://doi.org/10.1038/s41598-020-68576-0 4
Vol:.(1234567890)www.nature.com/scientificreports/
Figure 3. Potential shoreline retreat (m) projections at sandy beaches for the median projected SLR at 2100
under RCP8.5 (in the absence of ambient shoreline changes), relative to the baseline year 2010. Each map
represents an assessment with a specific combination of geophysical data (sandy beach location and nearshore
slope): (a) EUROSION and 1:100 slope, (b) EUROSION and SVNS, (c) SDSB and 1:100 slope and (d) SDSB and
SVNS. The maps are projected in the ETRS89-LAEA system.
ance through the twenty-first century and then aggregated per country. The temporal evolution of each source
through the century differs significantly among countries (Fig. 5). As expected, an increase of the uncertainty
due to the selected RCP is observed towards the end of the century for all countries, as indicated by the green
shaded area in Fig. 5. Even though sandy beach location and nearshore slope information is constant in time,
their Sobol indices can be time dependent, since Sobol indices describe the relative contribution of each input
parameter to the total variance. For the same reason, the uncertainty contribution of SLR projections can be high
Scientific Reports | (2020) 10:11895 | https://doi.org/10.1038/s41598-020-68576-0 5
Vol.:(0123456789)www.nature.com/scientificreports/
Figure 4. Normalized coastal land loss (km2/km) projections per NUTS 3 region for the median SLR at 2100
under RCP 8.5 (in the absence of ambient shoreline changes), relative to the baseline year 2010. The coastal
land loss has been normalized per the coastline length of each NUTS3 region. Note that each region has a
variable area and thus coastline length as defined by Eurostat. Each map represents an assessment with a specific
combination of geophysical (sandy beach location and nearshore slope): (a) EUROSION and 1:100 slope, (b)
EUROSION and SVNS, (c) SDSB and 1:100 slope and (d) SDSB and SVNS. The maps are projected in the
ETRS89-LAEA system. The values at the bottom left of each map indicate the European average shoreline retreat
(m) and are derived for median SLR projections, while in the brackets the average EU values are given for the of
5th to 95th percentiles of the SLR projections.
Scientific Reports | (2020) 10:11895 | https://doi.org/10.1038/s41598-020-68576-0 6
Vol:.(1234567890)www.nature.com/scientificreports/
Figure 5. Variance-based global sensitivity analysis of the coastal land loss model as a function of time for
different EU countries. For each year considered, the width of each patch indicates the fraction of the variance
of the coastal land loss projections (in the absence of ambient shoreline changes) that could be removed if the
respective input parameter was known. White areas indicate interactions between parameters. The 1st order
Sobol indices presented here are calculated as the weighted average of the country’s regions (with respect to the
sandy coastline length). The total potential sandy coastline length (EUROSION or SDSB) is indicated at the top
right corner of each graph. On the bottom right an EU average plot shows the average values over all of Europe.
at the beginning of the century for some countries, because even though the variance of the SLR projections is
small, it can have large relative effect, since it is the main driving force of changes in the coastal land loss model.
Figure 5 also indicates that European countries can be divided into three groups with respect to the differ-
ent uncertainty contributions. There are countries (Poland, Ireland, Italy, United Kingdom, Lithuania, Finland,
Sweden and Denmark representing 50% of total sandy coastline) where the relative contribution of the variance
related to the climate change scenario and the SLR projections dominate by the middle of the century (72.6%,
58.6%, 53.9%, 53.3%, 52.5%, 50.7%, 42.3% and 38.8% by 2050 respectively). This type of uncertainty is inherent
and is connected to unknowns in future climate change mitigation policies and physical processes as e.g., ice sheet
dynamics. A second group (Malta, Estonia, Slovenia, Greece, Portugal, Spain and Germany representing 38% of
total sandy coastline) have a quite high relative contribution to the total uncertainty due to the choice of the sandy
beach distribution dataset (70.9%, 46.7%, 43.5%, 39.9%, 35.3%, 32.3% and 31.6% by 2050 respectively). This is
Scientific Reports | (2020) 10:11895 | https://doi.org/10.1038/s41598-020-68576-0 7
Vol.:(0123456789)www.nature.com/scientificreports/
an artefact of a regional disagreement between the total sandy coast length of the two datasets considered here,
which overshadows the uncertainty of the other parameters. In the third group (Belgium, Latvia, Netherlands
and France representing 12% of total sandy coastline) the variability of coastal land loss projection is dominated
by the nearshore slope uncertainty (61.7%, 50.2%, 43.5% and 28.0% by 2050 respectively). In these countries the
largest contribution to coastal land loss variance is from the difference between the average nearshore slopes as
calculated by the SVNS dataset and the commonly used assumption of 1:100.
The uncertainty of the coastal land loss projections could be reduced on average by up to 45% in 2050 and
by 26% by 2100 if the exact spatial distribution of sandy beaches across Europe and their nearshore slopes were
known (Fig. 5). Still, these values can vary significantly when considering specific regions (Supplementary Figs
S5 and S6), as agreement between datasets and differences in SLR projections can vary locally. Note that the white
area in Fig. 5, which for most of the countries is smaller than 20% by 2100, indicates the interactions between
the parameters meaning that the combined variation of the considered parameters also contributes to the total
variance. This for example can be related to the spatial dependency of the variables used herein, since for each of
the sandy beach location datasets, different combinations of SLR projections and nearshore slopes will be used.
Discussion
Our results provide novel insights with respect to the use of different geophysical datasets and assumptions in
large scale assessments of SLR driven shoreline retreat and consequent coastal land loss. The use of the SVNS
dataset instead of the uniform slope assumption resulted in an increased estimate of European average shoreline
retreat. This is due to the fact that the SVNS based slopes are on average milder than 1:100 across Europe41. On
the other hand, the differences in the European coastal land loss predictions (Fig. 2) are connected to differences
in the sandy beach distribution and total length of sandy beaches in the EUROSION and SDSB datasets. Their
point-to-point agreement was 36% along the total European coastline (Supplementary Fig. S10). The agreement
was larger than 50% in most NUTS3 regions, with the exception of the Atlantic coast of Spain, some regions in
France and the UK, Sweden, Finland and Greece (Supplementary Fig. S11).
The European average shoreline retreat due to SLR calculated herein with the SDSB and SVNS datasets
compares well with the results from a previous global assessment that used the same input, but with some over-
estimation related to the use of a Bruun Rule correction factor in that study31, which is described by a triangular
probability distribution ranging from 0 to 1 with a peak at 0.7. An older study at the European scale by Hinkel
et al.29 which employs the assumption of uniform 1:100 nearshore slopes, projected a total coastal land loss of
about 450 k m2 (300 k m2) by 2100 under IPCC SRES A2 (B1). The projected median coastal land loss when using
the 1:100 uniform slopes here is about 1,700 k m2 (950 k m2) under RCP 8.5 (4.5). These results are not directly
comparable since they are based on different greenhouse gases concentration pathways, but differences can be
attributed to a) mainly the use of different mitigation scenarios, SLR projections and baseline years, b) differences
in the coastline definition and thus coastline length, and c) sandy beach distribution differences between their
study and the assessment presented herein.
The present analysis has inherent limitations and assumptions. Despite its widespread use, the Bruun Rule
has been c riticized45,46 for its assumptions and simplifications. These include: (a) that an equilibrium profile is
always attained, (b) that there is a cross-shore sediment balance (no sediment sinks and sources) and (c) that
it does not take into account alongshore sediment transport gradients. Additionally, recent studies have shown
that the Bruun rule tends to overestimate coastal retreat when compared to physics-based probabilistic numeri-
cal models17,19,25. This could be potentially added as a correction factor in Eq. (1) in future studies (similarly to
Vousdoukas et al.31) and modelled as a stochastic variable in the uncertainty analysis. The use of a physics-based
model was not feasible within the scope of the present study due to time constraints as a result of the regional
spatial scale of the assessment. The contribution of the choice of the coastal impact model has been previously
shown to account for 20–40% of the variance in shoreline change projections by 2100 in various sites in France25.
Shoreline change is a dynamic process that is not only dictated by SLR. Long-term changes in shoreline posi-
tion can be expected in response to long-shore sediment transport g radients22,31,47. Additionally, the presence
of sediment sources/sinks37,48 and any residual effects of storms and others seasonal, annual or multi-annual
fluctuations49 can lead to additional shoreline changes22,25,31,37,48. In the work herein, we focused on the shoreline
retreat that is directly driven by SLR, omitting the uncertainty related to the aforementioned additional pro-
cesses. Therefore, to investigate whether the SLR-induced shoreline retreat calculated herein is the dominant
mechanism of future shoreline retreat, we compare our results with projections of historic shoreline c hanges31.
These ambient changes are derived from historical change rates of shoreline position based on publicly available
satellite imagery9,39 assuming that these trends can be extrapolated into the future. We therefore calculate the
ratio of median SLR induced shoreline retreat (R) to the median long-term ambient changes ( AC ) for each sandy
location along the European coastline, differentiating between historically eroding (i.e., AC > 0) and historically
advancing (i.e., AC < 0) coasts (Fig. 6 and Supplementary Fig. S12). We then distinguish between two groups;
SLR dominated coasts (|R| > |AC|) and ambient changes dominated coasts (|R| < |AC|). We find that under
RCP 4.5, AC is slightly more important than R in 2050, while in 2100 their relative importance is quite similar
for both historically eroding and advancing coasts. Under RCP 8.5 though, in 2050, R is more important than AC
over Europe, while in 2100 the dominance of R over AC becomes even more pronounced. These insights show
that at least under RCP 4.5 ambient shoreline changes can be of the same importance as SLR driven shoreline
retreat overall in Europe. On the other hand, under RCP 8.5 SLR driven shoreline retreat dominates especially at
the end of the century when SLR rates increase. Historically advancing coasts represent almost 40% of the sandy
coastline studied herein. Up to 14% of the sandy coastline can have an overall land gain by 2100 and under RCP
8.5 if the accreting historic trends continue (|R| < |AC| and AC < 0). For these coasts (e.g. heavily nourished
beaches along the Dutch coast), SLR driven shoreline retreat could potentially be counteracted with continuing
Scientific Reports | (2020) 10:11895 | https://doi.org/10.1038/s41598-020-68576-0 8
Vol:.(1234567890)www.nature.com/scientificreports/
Figure 6. Ratios of SLR driven shoreline retreat to erosion due to ambient shoreline changes |R|/|AC| for
median projected SLR at 2100 under RCP8.5, for historically eroding (HE) coasts (a) and historically advancing
(HA) coasts (b). Histograms of ratios R/LT for historically eroding (R/AC > 0) and historically advancing (R/
AC < 0) coasts for RCP 4.5 (c, d) and RCP 8.5 (e, f). For the comparison the points from Vousdoukas et al. 2020
were interpolated to the points of the present study by using inverse distance interpolation at a 2 km radius.
interventions at the historic rate under RCP 4.5. Obviously, there are distinct spatial patterns (Fig. 6) which show
quite some spatial variability of the ratio. Furthermore, the assumption of the long-term shoreline change rates
to remain constant in the future is also somewhat tenuous.
For the sake of completeness, the projected shoreline retreat induced by SLR alone ( R ) were compared with
projections of total potential shoreline retreat (dx ) that includes the aforementioned ambient shoreline change
( AC ). Here, dx was estimated in a probabilistic manner, by sampling R and AC from their distributions in a
Monte Carlo simulation and adding them up to create probabilistic dx projections for 2050 and 2100 under RCP
4.5 and 8.5. As an illustrative example, European maps of the median dx values across Europe thus obtained
are shown in Supplementary Fig. S15, indicating that the general spatial patterns when AC is included stay the
same for the most part, with the exception of a few locations where a shoreline advance is projected (e.g., Dutch
coast and North Baltic Sea) or where more severe shoreline retreat (than R alone) is projected. The variance of
the projected distributions of dx is somewhat larger than that of the variance associated with projections of R
alone (Supplementary Fig. S1).
Other missing uncertainty factors include the choice of the parameter distributions u sed25 in the global
sensitivity analysis, which can affect the total variance of coastal land loss projections and subsequently alter the
relative contribution of each variable. For example, assigning the same probability to the choice of the two sandy
beach location datasets and the two nearshore slope approaches is a choice that directly affects the uncertainty
Scientific Reports | (2020) 10:11895 | https://doi.org/10.1038/s41598-020-68576-0 9
Vol.:(0123456789)www.nature.com/scientificreports/
quantification. For the former, this choice derives from the spatial extent of the dataset which makes it difficult
to assign different performance levels for the two datasets. For the latter, even though we can expect that the
SVNS dataset will contribute to better estimations of shoreline retreat than the assumption of a uniform slope,
we assign the same probability to quantify the sensitivity of this choice and to be able to compare our results with
previous studies29,30. Additionally, we treat the geophysical characteristics of the coastline (i.e. location of sandy
beaches and nearshore slopes) as constants in the future and thus described by the current available datasets,
even though at the end of the century changes in hydrodynamics and sediment supply might alter them.
Our uncertainty analysis is based on choices with respect to the geophysical representation of the coastline
that need to be made in large-scale shoreline retreat assessments. For this reason, we use available large-scale
datasets that cover all of Europe or a large part of it (see “Methods”, subsection 2 for spatial coverage of EURO-
SION). Uncertainty related to geophysical representation is epistemic and is mainly due to the availability, spatial
coverage and accuracy of data and observations. However, at the regional or country scale, better resolution and
higher accuracy data are seldom available. Exceptions are The Netherlands and Belgium where the relatively
smaller coastline length and long-term surveying have contributed to the creation of detailed coastal bathymetric
datasets available at country l evel50. Where such data are available, the uncertainty arising from the sandy beach
location and nearshore slopes can be reduced significantly. Thus, data acquisition and observational programs
could provide better representation of the coastal system and reduce the uncertainties in shoreline retreat projec-
tions, especially for the 2nd and 3rd group of countries described in Results subsection 2. Conversely, uncertainty
related to future SLR projections (1st group of countries described in Results subsection 2) is more difficult to
reduce, since it is related to global carbon emission reductions, economic developments, and inherit uncertain-
ties in the physical processes that will lead to SLR.
The SLR projections used here include the contribution from GIA but not the local tectonics and subsidence
effects42. Thus, the relative sea level rise in areas with significant subsidence (e.g. Po Delta in Italy51) can be larger
than the values used here. Nevertheless, there is to date no Europe-wide map of subsidence projections available.
Additionally, due to the effect of GIA, there are regions (mainly in North Baltic Sea) where there is negative SLR,
and for which we assume a zero coastal retreat in the study herein as the Bruun rule has in fact not been derived
to explicitly account for coastal accretion due to sea level drop. Nevertheless, we expect that negative SLR would
contribute to land gain in these areas (which roughly account for almost 3% of the European transects).
Regional coastal land loss projections presented here are sensitive to the spatial extent of the regions used,
due to the spatial characteristics of the input datasets. This means that the level at which the coastal retreat per
segment is aggregated to coastal land loss is important for both the (normalized) coastal land loss projections
and the uncertainty analysis. Here we used the NUTS 3 level, as it is the smallest administrative unit defined
from the European Union available and we believe that at that level our results could be most useful for policy
making and adaptation planning. Furthermore, our projections of shoreline retreat of sandy coastlines assume
that a sufficiently wide erodible beach is present. However, it should be noted that at some locations the erodible
beach width could be smaller than the projected retreat, leading to an overestimation of coastal land loss therein.
Nevertheless, as observations of beach width at the European scale are not readily available, the erodible beach
width cannot be taken into account at present. That is why our projections are defined as potential shoreline
retreat and coastal land loss. When European-wide information becomes available on the actual spatial distribu-
tion of sandy beach width our results could be translated to actual beach loss.
Conclusions
The present analysis focused on shoreline retreat and regional coastal land loss projections at the European scale
driven only by sea level rise (SLR), in the absence of any other natural processes or human influences that could
result in shoreline change. Against previous studies at this scale, here we employ different geophysical datasets,
identifying the sensitivity of this choice. The spatially averaged median value of SLR driven potential shoreline
retreat of sandy beaches in Europe by 2100, relative to the baseline year 2010, is projected to be about 97 m
under RCP 8.5 and 54 m under RCP 4.5. This translates to a potential coastal land loss of about 2,500 k m2 under
RCP 8.5 and 1,400 km2 under RCP 4.5 for the same time period along the European coastal zone. For coastlines
with historically advancing trends larger than that of the SLR retreat ones (about 14% of the European coastline
studied herein), overall net changes on coastal land area might result in land gain. The use of spatially-variable,
data-based nearshore slope information identified a number of coastal land loss hotspots around Europe and
higher shoreline retreat values compared to projections provided by previous assessments that used the assump-
tion of a uniform 1:100 slope throughout Europe. These hotspots include regions along the Italian Adriatic coast,
the French Atlantic coast, the east part of the Baltic Sea and around the North Sea.
An analysis of the temporal evolution of the composition of the total uncertainty associated with projected
SLR driven coastal land losses indicated that the choice of the input geophysical datasets (i.e. sandy beach loca-
tion and nearshore slope) is an important source of uncertainty for a large number of European coastal regions
especially until 2050. By the end of the twenty-first century, the uncertainties associated with climate change
scenario and SLR projections become more dominant. On average, the variance of coastal land loss projections
could diminish by almost 45% in 2050 and 26% in 2100 if accurate data on sandy beach location and nearshore
slope were used. In Malta, Estonia, Slovenia, Greece, Portugal, Spain and Germany, the choice of the sandy beach
location dataset was the most important source of uncertainty, while for Belgium, Latvia, Netherlands and France
the choice of spatially varying versus uniform slopes was the most important choice. For the rest of European
countries, the uncertainties associated with unknown future scenarios and the SLR projections dominated the
total uncertainty in projections.
Scientific Reports | (2020) 10:11895 | https://doi.org/10.1038/s41598-020-68576-0 10
Vol:.(1234567890)www.nature.com/scientificreports/
Methods
Coastal impact model. We used the Bruun r ule34 to quantify the direct erosion of sandy beaches due to
SLR. This approach is based on a simple two-dimensional mass conservation rule assuming that an equilibrium
profile will be preserved in the future when SLR occurs. It employs a number of assumptions and simplifica-
tions (i.e. equilibrium profile existence, cross-shore sediment balance), that have made it a controversial matter,
ecades45,46. Nevertheless, it is, at present, the only method that can produce coastal
debated in the literature for d
recession estimates due to SLR at large spatial scales in a computationally efficient manner. The Bruun Rule is
expressed as:
SLR
R= , (2)
tan(β)
where R is the horizontal shoreline retreat, SLR is the sea level rise, and β is the active profile slope. As active
profile slope here we describe the slope between the depth of closure (i.e., the depth beyond which observed bed
level changes show no significant changes in time) and the s horeline34 which we call herein nearshore slope. We
also assume that if SLR is negative there will be no shoreline retreat.
The European coastline was discretized with an alongshore spacing of 1 km to have a good coverage of the
alongshore variability of the coastal profiles, while keeping the computational costs at a feasible level. The coast-
line was defined by the Open Street Maps dataset of 2 01652. This approach has been previously used for a global
assessment of historical coastal erosion9. Our projections coverage is determined by the overlap of the two sandy
beach distribution datasets used (see next section). This was defined by the EUROSION dataset which includes
the coastal EU counties except Croatia, and Romania, Bulgaria and Cyprus which are partially covered.
Geophysical data. The spatial distribution of sandy beaches at the European scale is a critical input for
assessing shoreline retreat. Here we used two datasets that describe the location of sandy beaches and have
European-scale coverage. The first was the geomorphological map of the European coasts available from the
EUROSION project40. This map includes 20 different classes and it is available at a coastal segment level with
coherent characteristics (e.g. geomorphology, geology, erosion rates and more) and various lengths. These
data were extracted as points with a 250 m alongshore resolution, using GIS. The resulting data-points were
used to populate the alongshore point grid described in the previous section, employing proximity analysis.
Another coastal geomorphological map is available for the Mediterranean53, which classifies coastal segments in
four classes and was used herein to reclassify the EUROSION dataset. The classes that were used are (a) sandy
beaches, (b) unerodable coasts, (c) muddy coastlines and (d) rocky coasts with pocket beaches. The EUROSION
classes were then regrouped in these four classes according to the highest occurrence as described in Athanasiou
et al.41. Ultimately, only the alongshore points that were classified as sandy beaches were used for the assessment
of future shoreline retreat and coastal land loss. For the points classified as “rocky with pocket beaches” a rela-
tive percentage of sandy beach length per 1 km long segments was retained using the length of pocket beaches
following Monioudi et al.26.
The second dataset was the Satellite Derived Sandy Beaches (SDSB) location dataset9. This dataset has a global
coverage and was created using machine learning techniques on satellite images from the Sentinel-2 mission.
It classifies locations with an alongshore spacing of 500 m as sandy or not sandy. Using the same method as for
the EUROSION data, the alongshore points of our computational vector were populated with the SDSB data,
creating another layer of sandy beaches location (Supplementary Fig. S7).
The coastal recession computed using the Bruun rule is linearly dependent on nearshore slope (Eq. 2). A
recent study produced a global dataset of nearshore slopes, using global topo-bathymetric data at a 1 km along-
shore resolution41 (called SVNS dataset herein). The spatial variability of β as indicated from this dataset is quite
distinctive in Europe (Supplementary Fig. S8). In order to compare the importance of the spatial variability of
the nearshore slope against the so far commonly used assumption of a uniform slope of 1:100, we used both
approaches when applying Eq. (1). To constrain nearshore slopes to the naturally encountered values we used
an upper and lower limit of 1:5 and 1:30031. The points that had values out of this range were constrained to the
limits. This was necessary to take into account outliers from the SVNS dataset and consider that in some cases
the sandy beach location datasets can erroneously indicate presence of sandy beaches in non-sandy coastlines.
From the sandy segments across the European coastline extents that were considered presently, we found that
about 51.5% have slopes milder than 1:100 (as defined between the depth of closure and the shoreline).
Sea level rise data. We used the results of a global probabilistic, process based study4,42 to obtain SLR
projections around Europe up to end of the twenty-first century. The data were available at offshore points
with a spacing of about 50 km. Projections were available from 2010 to 2100, every 10 years, capturing the 5th,
17th, 50th, 83th, 95th and 99th percentiles of potential SLR under RCP 4.5 and RCP 8.5. For RCP 8.5 we use
the high-end RCP 8.5 scenario from Jackson and Jevrejeva42 which is based on IPCC AR52 but uses Antarctic
and Greenland ice sheet contributions from Bamber and Aspinall54, resulting in higher median global SLR (i.e.,
84 cm versus 74 cm of AR5) and larger and more asymmetric u ncertainties4. These projections were of regional
SLR, thus taking into account the regional footprint of SLR, due to various contributions as described in Jackson
and Jevrejeva42. On the other hand, local tectonics and subsidence are not included in the projections. For each
computational point a specific SLR value was attributed for each decade, RCP and percentile using proximity
analysis (Supplementary Fig. S9). Then an empirical cumulative distribution function (ECDF) was created for
each location and RCP scenario, using the percentile values.
Scientific Reports | (2020) 10:11895 | https://doi.org/10.1038/s41598-020-68576-0 11
Vol.:(0123456789)www.nature.com/scientificreports/
Uncertainty analysis. A variance-based sensitivity analysis was used to quantify the uncertainty of the
coastal land loss estimates produced using Eq. (1). This method measures the contribution of each of the uncer-
tain input parameters Xi to the variance of the outcome of a model Y 55,56 and has been previously applied in
various studies of coastal impacts25,57,58. On this basis, the 1st order Sobol indices, which range between zero and
one, can be defined as follows:
VarXi EX∼i [Y |Xi ]
Si = (3)
Var(Y )
where X∼i denotes the matrix of all parameters but Xi . The first-order indices Si can be interpreted as the
main effects of Xi , i.e. the proportion of the total variance of the output Y that would be removed if we knew the
true value of parameter Xi . This index provides a measure of importance (i.e. a sensitivity measure) useful when
ranking, in terms of importance, the different input p arameters55.
We applied the variance-based sensitivity analysis on Eq. (1), using as inputs: the choice of the 2 geophysical
datasets (i.e., sandy beach location and nearshore slopes), the unknown mitigation scenarios (i.e., RCP 4.5 or
RCP 8.5) and the SLR projections (Fig. 1). A discrete uniform distribution with the same probability of 50% was
applied for the choices of geophysical datasets and the RCPs, assuming that there is no information on which
one performs better (for the geophysical datasets) or which is most probable to occur (for the RCPs). Sea level
rise uncertainty was described by the probability distribution for each location and decade, per RCP as described
in the previous subsection.
For each NUTS3 region and decade, auxiliary random variables uniformly distributed in [0,1] were sampled
for each parameter, following Le Cozannet et al.58. Then the inverse cumulative distribution functions of each
parameter were used to translate these to the actual parameters. Each of the four input parameters was sampled
from the aforementioned distributions following a quasi-random Sobol sequence of 5,000 samples, resulting in
50,000 input parameter combinations which were propagated through Eq. (1) using a Monte Carlo approach,
leading to 50,000 realizations of coastal land loss per NUTS3 region and per decade. The sampling of the SLR
was performed from the specific SLR distributions of each region and decade. An outline of the framework can
be seen in Supplementary Fig. S14. The number of samples was chosen in order to achieve a precision of the
Sobol indices in the order of 2% while maintaining computational costs within reasonable limits. The Python
package SALib was used to perform the analysis56,59.
Data availability
The projections of shoreline retreat are available at https: //doi.org/10.4121/uuid:8e73ca b0-960b-46a8-bf67-ee0ea
dcc1e7d.
Received: 6 December 2019; Accepted: 25 June 2020
References
1. World Economic Forum. The global Risks Report 201813th edn. (2018). doi:978-1-944835-15-6
2. Church, J. A. et al. Sea level Change (PM Cambridge University Press, Cambridge, 2013).
3. Jevrejeva, S., Jackson, L. P., Riva, R. E. M., Grinsted, A. & Moore, J. C. Coastal sea level rise with warming above 2 °C. Proc. Natl.
Acad. Sci. U.S.A. 113, 13342–13347 (2016).
4. Vousdoukas, M. I. et al. Global probabilistic projections of extreme sea levels show intensification of coastal flood hazard. Nat.
Commun. 9, 2360 (2018).
5. Vitousek, S. et al. Doubling of coastal flooding frequency within decades due to sea-level rise. Sci. Rep. 7, 1399 (2017).
6. Melet, A., Meyssignac, B., Almar, R. & Le Cozannet, G. Under-estimated wave contribution to coastal sea-level rise. Nat. Clim.
Change 8, 234–239 (2018).
7. Neumann, B., Vafeidis, A. T., Zimmermann, J. & Nicholls, R. J. Future coastal population growth and exposure to sea-level rise
and coastal flooding - A global assessment. PLoS ONE 10, e0118571 (2015).
8. McGranahan, G., Balk, D. & Anderson, B. The rising tide: assessing the risks of climate change and human settlements in low
elevation coastal zones. Environ. Urban. 19, 17–37 (2007).
9. Luijendijk, A. et al. The state of the world’s beaches. Sci. Rep. 8, 6641 (2018).
10. Nicholls, R. J. et al. Coastal systems and low-lying areas. Climate Change 2007: Impacts, Adaptation and Vulnerability. In Contribution
of Working Group II to the Fourth Assessment Report of the Intergovernmental Panel on Climate Change (eds Parry, M.L., Canziani,
O.F., Palutikof, J.P., van der Linden, P.J. & Hanson, C.E. (2007).
11. Ranasinghe, R. Assessing climate change impacts on open sandy coasts: A review. Earth-Sci. Rev. 160, 320–332 (2016).
12. Smallegan, S. M., Irish, J. L. & van Dongeren, A. R. Developed barrier island adaptation strategies to hurricane forcing under rising
sea levels. Clim. Change 143, 173–184 (2017).
13. Barnard, P. L. et al. Dynamic flood modeling essential to assess the coastal impacts of climate change. Sci. Rep. 9, 1–13 (2019).
14. Pollard, J. A., Spencer, T. & Brooks, S. M. The interactive relationship between coastal erosion and flood risk. Prog. Phys. Geogr.
43, 574–585 (2019).
15. Houser, C., Hapke, C. & Hamilton, S. Controls on coastal dune morphology, shoreline erosion and barrier island response to
extreme storms. Geomorphology 100, 223–240 (2008).
16. Enríquez, A. R., Marcos, M., Álvarez-Ellacuría, A., Orfila, A. & Gomis, D. Changes in beach shoreline due to sea level rise and
waves under climate change scenarios: application to the Balearic Islands (western Mediterranean). Nat. Hazards Earth Syst. Sci.
17, 1075–1089 (2017).
17. Toimil, A., Losada, I. J., Camus, P. & Díaz-Simal, P. Managing coastal erosion under climate change at the regional scale. Coast.
Eng. 128, 106–122 (2017).
18. Jongejan, R., Ranasinghe, R., Wainwright, D., Callaghan, D. P. & Reyns, J. Drawing the line on coastline recession risk. Ocean
Coast. Manag. 122, 87–94 (2016).
19. Ranasinghe, R., Callaghan, D. & Stive, M. J. F. Estimating coastal recession due to sea level rise: beyond the Bruun rule. Clim.
Change 110, 561–574 (2012).
Scientific Reports | (2020) 10:11895 | https://doi.org/10.1038/s41598-020-68576-0 12
Vol:.(1234567890)www.nature.com/scientificreports/
20. Dastgheib, A., Jongejan, R., Wickramanayake, M. & Ranasinghe, R. Regional scale risk-informed land-use planning using proba-
bilistic coastline recession modelling and economical optimisation: east coast of Sri Lanka. J. Mar. Sci. Eng. 6, 1–32 (2018).
21. Enríquez, A. R., Marcos, M., Falqués, A. & Roelvink, D. Assessing beach and dune erosion and vulnerability under sea level rise:
a case study in the Mediterranean Sea. Front. Mar. Sci. 6, 4 (2019).
22. Giardino, A. et al. A quantitative assessment of human interventions and climate change on the West African sediment budget.
Ocean Coast. Manag. 156, 249–265 (2018).
23. Li, F., van Gelder, P. H. A. J. M., Ranasinghe, R., Callaghan, D. P. & Jongejan, R. B. Probabilistic modelling of extreme storms along
the Dutch coast. Coast. Eng. 86, 1–13 (2014).
24. Wainwright, D. J. et al. Moving from deterministic towards probabilistic coastal hazard and risk assessment: development of a
modelling framework and application to Narrabeen Beach, New South Wales Australia. Coast. Eng. 96, 92–99 (2015).
25. Le Cozannet, G. et al. Quantifying uncertainties of sandy shoreline change projections as sea level rises. Sci. Rep. 9, 42 (2019).
26. Monioudi, I. N. et al. Assessment of island beach erosion due to sea level rise: the case of the Aegean archipelago (Eastern Mediter-
ranean). Nat. Hazards Earth Syst. Sci. 17, 449–466 (2017).
27. Udo, K. & Takeda, Y. Projections of future beach loss in Japan Due to sea-level rise and uncertainties in projected Beach Loss.
Coast. Eng. J. 59, 1740006 (2017).
28. Ritphring, S., Somphong, C., Udo, K. & Kazama, S. Projections of future beach loss due to sea level rise for sandy beaches along
Thailand’s coastlines. J. Coast. Res. 85, 541–545 (2018).
29. Hinkel, J., Nicholls, R. J., Vafeidis, A. T., Tol, R. S. J. & Avagianou, T. Assessing risk of and adaptation to sea-level rise in the Euro-
pean Union: an application of DIVA. Mitig. Adapt. Strateg. Global Change 15, 703–719 (2010).
30. Hinkel, J. et al. A global analysis of erosion of sandy beaches and sea-level rise: an application of DIVA. Glob. Planet. Change 111,
150–158 (2013).
31. Vousdoukas, M. I. et al. Sandy coastlines under threat of erosion. Nat. Clim. Chang. 10, 260–263 (2020).
32. Vousdoukas, M. I. et al. Understanding epistemic uncertainty in large-scale coastal flood risk assessment for present and future
climates. Nat. Hazards Earth Syst. Sci. 18, 2127–2142 (2018).
33. Viavattene, C. et al. Selecting coastal hotspots to storm impacts at the regional scale: a coastal risk assessment framework. Coast.
Eng. 134, 33–47 (2017).
34. Bruun, P. Sea-level rise as a cause of shore erosion. J. Waterw. Harb. Div. 88, 117–132 (1962).
35. Zhang, K. Q., Douglas, B. C. & Leatherman, S. P. Global warming and coastal erosion. Clim. Change 64, 41–58 (2004).
36. Vörösmarty, C. J. et al. Anthropogenic sediment retention: major global impact from registered river impoundments. Glob. Planet.
Change 39, 169–190 (2003).
37. Ranasinghe, R., Wu, C. S., Conallin, J., Duong, T. M. & Anthony, E. J. Disentangling the relative impacts of climate change and
human activities on fluvial sediment supply to the coast by the world’s large rivers: Pearl River Basin, China. Sci. Rep. 9, 9236
(2019).
38. Cowell, P. J. et al. The coastal-tract (part 1): a conceptual approach to aggregated modeling of low-order coastal change. J. Coast.
Res. 19, 812–827 (2003).
39. Mentaschi, L., Vousdoukas, M. I., Pekel, J. F., Voukouvalas, E. & Feyen, L. Global long-term observations of coastal erosion and
accretion. Sci. Rep. 8, 1–11 (2018).
40. EUROSION. Living with coastal erosion in Europe: Sediment and Space for Sustainability: PART I - Major findings and Policy Recom-
mendations of the EUROSION project. Service contract B4–3301/2001/329175/MAR/B3 “Coastal erosion – Evaluation of the need
for action”. Directorate General Environment, European Commission (2004).
41. Athanasiou, P. et al. Global distribution of nearshore slopes with implications for coastal retreat. Earth Syst. Sci. Data 11, 1515–1529
(2019).
42. Jackson, L. P. & Jevrejeva, S. A probabilistic approach to 21st century regional sea-level projections using RCP and High-end
scenarios. Global Planet. Change 146, 179–189 (2016).
43. Peltier, W. R., Argus, D. F. & Drummond, R. Space geodesy constrains ice age terminal deglaciation: the global ICE-6G_C (VM5a)
model. J. Geophys. Res. Solid Earth 120, 450–487 (2015).
44. Eurostat. Regions in the European Union—Nomenclature of Territorial Units for Statistics NUTS 2013/EU-28. Eurostat-Manuals
and guidelines (2015). https://doi.org/10.2785/53780
45. Cooper, J. A. G. & Pilkey, O. H. Sea-level rise and shoreline retreat: time to abandon the Bruun Rule. Global Planet. Change 43,
157–171 (2004).
46. Ranasinghe, R. & Stive, M. J. F. Rising seas and retreating coastlines. Clim. Change 97, 465–468 (2009).
47. Anderson, T. R., Fletcher, C. H., Barbee, M. M., Frazer, L. N. & Romine, B. M. Doubling of coastal erosion under rising sea level
by mid-century in Hawaii. Nat. Hazards 78, 75–103 (2015).
48. Ranasinghe, R., Duong, T. M., Uhlenbrook, S., Roelvink, D. & Stive, M. Climate-change impact assessment for inlet-interrupted
coastlines. Nat. Clim. Change 3, 83–87 (2013).
49. Antolínez, J. A. A., Méndez, F. J., Anderson, D., Ruggiero, P. & Kaminsky, G. M. Predicting climate-driven coastlines with a simple
and efficient multiscale model. J. Geophys. Res. Earth Surf. 124, 1596–1624 (2019).
50. Rijkswaterstaat. Jarkus cross-shore profile measurements database (2018). Available at: https://publicwiki.deltares.nl/display/OET/
Dataset+%0Adocumentation+JarKus. Accessed 15 November 2018.
51. Wolff, C., Vafeidis, A. T., Lincke, D., Marasmi, C. & Hinkel, J. Effects of scale and input data on assessing the future impacts of
coastal flooding: an application of DIVA for the Emilia-Romagna Coast. Front. Mar. Sci. 3, 41 (2016).
52. OpenStreetMap contributors. OSM coastline (2015). Available at: https://planet.osm.org/. Accessed 22 February 2018.
53. Wolff, C. et al. A Mediterranean coastal database for assessing the impacts of sea-level rise and associated hazards. Sci. Data 5,
180044 (2018).
54. Bamber, J. L. & Aspinall, W. P. An expert judgement assessment of future sea level rise from the ice sheets. Nat. Clim. Change 3,
424–427 (2013).
55. Saltelli, A. Global sensitivity analysis : An introduction. In: Proceedings of the 4th International Conference on Sensitivity. Analysis
Model Output 27–43 (2004).
56. Sobol, I. Global sensitivity indices for nonlinear mathematical models and their Monte Carlo estimates. Math. Comput. Simul. 55,
271–280 (2001).
57. Wong, T. E. & Keller, K. Deep Uncertainty Surrounding Coastal Flood Risk Projections : A Case Study for New Orleans Earth ’ s
Future Special Section : Deep Uncertainty Surrounding Coastal Flood Risk Projections : A Case Study for New Orleans (2017). https
://doi.org/10.1002/eft2.255
58. Le Cozannet, G. et al. Evaluating uncertainties of future marine flooding occurrence as sea-level rises. Environ. Model. Softw. 73,
44–56 (2015).
59. Saltelli, A. et al. Variance based sensitivity analysis of model output. Design and estimator for the total sensitivity index. Comput.
Phys. Commun. 181, 259–270 (2010).
Scientific Reports | (2020) 10:11895 | https://doi.org/10.1038/s41598-020-68576-0 13
Vol.:(0123456789)You can also read