Case study Air France - KLM - Erasmus Platform for Sustainable Value Creation Willem Schramade - Rotterdam School of ...
←
→
Page content transcription
If your browser does not render page correctly, please read the page content below
Erasmus Platform for Sustainable Value Creation

Case study
Air France - KLM

Willem Schramade
Air France - KLM:
             a sustainable
             finance case study
             March 2019

             Willem Schramade
             Erasmus Platform for Sustainable Value Creation

Important: this company analysis was done for educational purposes. It is not
an investment recommendation nor does it in any way reflect the opinion of
RSM, Erasmus University. Target prices were calculated only to illustrate ways of
thinking about value.
Abstract 3 Introduction 4 The list of questions 5 Answering the questions for AFK 8 Conclusions and reflections 30 References 31 Important: this company analysis was done for educational purposes. It is not an investment recommendation nor does it in any way reflect the opinion of RSM, Erasmus University. Target prices were calculated only to illustrate ways of thinking about value. 3 | Erasmus Platform for Sustainable Value Creation
1          Abstract

This is the second in a series of RSM case studies on sustainable finance. Using a
list of questions, we show how to integrate sustainability into investment analysis
by connecting sustainability to business models, competitive position, strategy and
value drivers. Here the questions are answered for Air France - KLM, a company
that faces substantial sustainability headwinds, on both the social and
environmental dimensions.
Our findings suggest that Air France - KLM creates too much value on S (social) for
its pilots, at the expense of value destruction in F (financial) and E (environmental)
terms. We explore the likely (and substantial) impact of a serious carbon price. This
could put the company out of business, but could also help it to solve its S
problem. The case highlights the need for fundamental analysis (that is, going well
beyond ESG ratings) to properly assess a company’s transition preparedness,
which we deem the essence of corporate sustainability.

4 | Erasmus Platform for Sustainable Value Creation
2          Introduction

In this case study we analyse airline company Air France - KLM (henceforth AFK)
from a sustainable finance perspective. As argued in our Philips case study
(Schramade and Schoenmaker, 2019), analysts often struggle to integrate
sustainability into investment analysis, partly because sustainability is so context
specific and hard to capture in ratings and other standardisations. The case
questions and answers offer analysts the tools to integrate sustainability in
investment (and credit) analysis. AFK’s context is very different from that of Philips,
as AFK has serious tensions between S, E and F. So, in spite of using the same set
of questions (see next section), we get very different answers, different priorities,
and different follow-up questions than in the Philips case.

The case should help analysts to do such an analysis, which goes well beyond
ratings and historical data patterns. Rather, we explore how one can deal with
scenarios that have not happened yet. It requires an active and fundamental
approach to assess transition preparedness.

We chose AFK because of the structural headwinds it faces, namely its very high
carbon emissions and its labour problem. It is hard to precisely quantify these
headwinds, but trying is valuable. First, it shows that they are so substantial that
they cannot be ignored from a financial perspective either. Second, it highlights
the gaps in reporting and standards that we face and the follow-up questions that
beg for answers. For example, based on AFK’s current disclosure we cannot
determine to what extent the company is capable of dealing with serious carbon
prices – nor how it compares to its peers.

This article is set up as follows: in the next section, the list of questions is
presented. In the subsequent section, the questions are answered for AFK, starting
with the company’s business model and value drivers, before diving into strategy
and sustainability. It then goes back to the value drivers and the investment case to
see how they have been affected by the sustainability analysis. In this way, the
analyst develops a holistic view of the company. The final section concludes and
reflects.

5 | Erasmus Platform for Sustainable Value Creation
3          The list of questions

The below list of questions (Table 1) has been made over the course of several
years of doing ESG integrated investment analysis, and is exactly the same as in
the Philips case. More recently, they have been structured as an assignment for
the Sustainable Finance course taught at Erasmus University and can be found in
our Sustainable Finance textbook (Schoenmaker and Schramade, 2019, Chapter
8).
They are meant to deepen students’ and practitioners’ understanding of ESG
integration by having them apply sustainable finance insights to a real life example
– and ideally discuss with fellow students or colleagues. They are 25 questions
(even more including sub-questions) in six sections. Although the six sections
address different issues, it should become obvious during the analysis that they are
very much related.
TABLE 1 LIST OF SUSTAINABLE FINANCE QUESTIONS FOR ESG INTEGRATION

 Section            Questions
                    1.How would you describe the company’s business model?
 1. Business
 model &            2.How strong do you rate the company’s competitive position?
 competitive
                    3.What trends affect the company’s business model and competitive
 position
                    position?
                    1.Sales growth: what seems to be a normal sales growth for the
                    company? And what are the drivers of sales growth?

                    2.Margins: what seems to be a normal profit margin (EBIT or EBITDA)
                    for the company? And what are the drivers of that margin?
 2. Value drivers
 (part 1)           3.Capital: how capital intense is the company? What do you think is
                    the firm's cost of capital? What is the firm's return on invested capital
                    (ROIC)

                    4.Please sketch how you see the company’s value drivers going
                    forward?

6 | Erasmus Platform for Sustainable Value Creation
1.Purpose: what is the company's mission / purpose / raison d'être? In
what way does the company create value for society? How does it
get paid for that value creation?
2.Stakeholders: what are the company's main stakeholders? Please fill
out the stakeholder impact tool
3.Externalities & impact: Does the company generate serious
externalities? Are they positive or negative? How do you assess the
chances of these externalities to be internalized? Thresholds: how
does the company perform versus the planetary boundaries?
4.SDGs: which of the SDGs (if any) does the company help achieve?
Which negative SDG exposures (if any) does the company have?
3. Sustainability 5.Impact: to what extent can the company’s impact be measured?
Does the company report on its impact? How can its impact reporting
be improved?
6.Material issues: what are the most material ESG factors? I.e., what
issues are most critical to the success of the company's business
model? Please fill out the given matrix, discussing for each of these
most material ESG factors (1) how the company performs on it; (2)
whether the company derives a competitive (dis)advantage from it; (3)
how they might affect the value drivers
7.Sustainability reporting: how do you assess the company’s non-
financial reporting? Does the company (claim to) do Integrated
Reporting ()? To what extent do you see the seven principles of
reflected in the company’s reporting?
1.How would you describe the strategy of the company?
2.To what extent does that strategy take into account the company's
most material ESG issues? Please link to your answer in the
sustainability section.
3.Is the strategy consistent with the company's purpose?
4. Strategy 4.What does long-term value creation look like? What are the best
KPIs for it?
5.What does management compensation look like? To what extent
does management have long-term incentives? And are those
incentives aligned with long term-value creation?
6.How does the company communicate its long-term value creation
with shareholders and stakeholders?
1.Given all of the above questions & their answers, how do you rate
the effect of material sustainability issues on the value drivers going
5. Value drivers forward? Per value driver, please indicate whether you see a positive,
(part 2) negative or neutral effect
2.How would this affect your valuation of the company?
7 | Erasmus Platform for Sustainable Value Creation1.How well prepared do you think Philips is for the transition to a
more sustainable economic model?
6. Investment 2.How attractive do you find the company as an investment?
conclusions 3.What did you find most surprising when answering the above
questions?
4.If you were to engage with the firm, what topics would you address?
Source: authors
Of course, these questions can be answered either very high level or in a very
detailed way. And not all questions will need to be answered every time or right
away. Ideally, priorities will depend on the needs of the user and the relevance of
the particular issue in the context at hand. It certainly should not be a matter of
perfectionism or box-ticking, as answering the questions is not a goal in itself but
meant to build a good holistic understanding of a company’s transition
preparedness and investment attractiveness.
8 | Erasmus Platform for Sustainable Value Creation4 Answering the questions
for AFK
In this section, the questions are answered for AFK, an airline company
headquartered in France with its main hubs in France and the Netherlands. We
answered the questions based on publicly available material. Ideally, the answers
serve as a useful illustration and help answering the same or similar questions for
different companies as well.
1. Business model & competitive position
See Chapter 5 of Schoenmaker and Schramade (2019) for a description of the
below concepts and how they relate to each other.
Business model & competitive position
1.1. How would you describe the company’s business model? What
are its customer value proposition and profit formula? 1
AFK’s business model is about offering air transport services. The company is
organised into four segments:
Network (>90% of sales); this includes both the passenger and cargo operations of
its two big brands, Air France and KLM, as well as some other brands;
Maintenance; aircraft maintenance for external and internal customers;
Transavia; a low cost airline that offers passenger flights in Europe;
The above mix shows that the vast majority of AFK’s business is about offering air
transport, mainly to individual travellers. So, for the remainder of the analysis, we’ll
focus on that part of the business. There, the customer value proposition is to
offer fast, safe, reliable, convenient and affordable transport over medium to long
distances.
1Johnson et al. (2008) argue that a successful business model has three components:
1. the model helps customers perform a specific ‘job’ that alternative offerings do not address;
2. the model generates value for the company through factors such as the revenue model, cost structure, margins
and/or inventory turnover;
Key resources and processes: the company has the people, technology, products, facilities, equipment and brand
required to deliver the value proposition to targeted customers. The company also has processes (training,
manufacturing, services) to leverage those resources.
9 | Erasmus Platform for Sustainable Value CreationIn its profit model, the company tries to maximise its sales in the face of high fixed
costs (planes, labour) and highly dynamic variable costs (fuel) – as we’ll see, this
involves serious social and environmental issues. Maximising sales is about getting
good volumes (plane utilisation rates) and good ticket prices. For this, the
company uses several brands, algorithms, and diversified pricing schemes.
Ingredients for driving sales include a good reputation, a strong set of connecting
flights, onboard comfort, customer service, and loyalty schemes.
1.2. How strong do you rate the company’s competitive position?
AFK claims to derive competitive advantage from its brands (Air France, KLM) and
its hubs (Paris Charles de Gaulle and Amsterdam Schiphol). Capacity constraints at
its hubs effectively shut out new entrants. However, its competitive position does
not look very strong as the airline industry is highly competitive and faces serious
issues such as high and fluctuating fuel costs, and problematic labour relations. In
addition, legacy airlines like AFK typically have higher labour costs than low-cost
airlines like Ryanair or EasyJet. Moreover, there is increasing competition from
aggressive Middle Eastern airlines with deep pockets. And in short-haul, airlines
also compete with cars and trains, which typically offer more seating space and
less safety hassles.
TABLE 2 SWOT ANALYSIS
Strengths: Weaknesses:
• Brands • Strong labour unions
• Capacity constrained airports • High personnel cost base
• Weak balance sheet
• Oil price sensitivity
Opportunities: Threats:
• Transavia growth • Low cost competitio
• Restructuring • Aggressive Middle East carriers
• More integration of group • Political turmoil / terorist
brands attacks
• Carbon prices
1.3. What trends affect the company's business model and
competitive position?
The following trends can be discerned for the airline industry:
• Population growth & rising incomes in Asia
• Climate change / emissions
10 | Erasmus Platform for Sustainable Value Creation• Digitalisation
Population growth is a positive trend for the airline industry, but as a European
player, AFK’s exposure is limited. On the negative side, carbon emissions
regulation and pricing are likely to become a serious headwind for the industry,
and AFK is no exception. Digitalisation is a question mark. In a recent report2 ,
consultants PwC observe:
“Carriers that invest in owning this data, and in the top-notch analytics needed to
mine it, could do as digital leaders in the retail sector do: anticipate customer
desires and their willingness to pay with astounding precision. They could also
track the effectiveness of nearly every offer and decision—from marketing to
pricing to partnerships—throughout the value chain.”
2. Value drivers - part 1
Sales growth
2.1. What seems to be a normal sales growth for the company? Please
explain. And what are the drivers of sales growth?
AFK has low and volatile sales growth. Revenue shrank in four out of the last eight
reporting years and amounted to €25.8bn in 2017. Drivers of sales include
passenger volumes and the (in)ability to charge high prices, which is in turn driven
by factors such as customer service, planning, demand and competition.
Passenger volumes are expressed in metrics like ASK (available seat kilometres),
RPK (revenue passenger kilometres) and load factor (capacity utilisation). Table 3
shows these numbers for 2016 and 2017.
TABLE 3: PASSENGER VOLUMES FOR THE NETWORK BUSINESS3
Passenger network data 2017 2016
Passengers, millions 83.9 80.2
Capacity, ASK million 286,190 278,807
Traffic, RPK million 248,475 238,183
Load factor 86,8% 85,4%
Passenger revenues 19,630 18,849
2 PwC, Tailwinds report, 2018 airline industry trends
3 Network means that this is excluding Transavia, which carried another 14.8 million passengers
11 | Erasmus Platform for Sustainable Value CreationSource: 2017 AR, p87
The main drivers of passenger volumes are population, incomes, (the absence of)
terrorist attacks, and the viability of alternatives – such as rail connections on the
short haul, which is likely to intensify as 1) new high speed rail connections are laid
out; 2) rail is much less carbon intensive and will benefit from a serious carbon
price. In Section 3 on sustainability, we explore AFK’s carbon emissions exposure,
and the likely impact of a carbon price.
Margins
2.2. What seems to be a normal profit margin (EBIT or EBITDA) for the
company? Please explain. And what are the drivers of that
margin?
AFK’s profitability is low, and unevenly split over Air France (3.7% operating margin
2017) and KLM (8.8% operating margin 2017). EBIT margins hovered around 0%
from 2009-2014, but recovered to over 5% in 2017. It remains to be seen if they
can maintain that margin, but they do try hard with serious cost reduction targets.
The main drivers of margins are: labour costs (€7.6bn in 2017 [29% of sales],
excluding lost sales from strikes); fuel costs (€4.5bn in 2017 [17% of sales]); and
their ability to make up for those costs with high ticket prices and load factors (i.e.,
utilisation, driven by sales matching planned capacities). Both labour costs and fuel
costs are hard to control, and industry trends don’t look good. In a report on the
global airline industry, PwC4 reported the following:
“Non-fuel costs surged nearly 10% in 2017, to $561 billion. Labour costs are rising
especially quickly. They are expected to account for over 30% of global airline
costs in 2018, while fuel costs should only be about 20%.”
Capital
2.3. How capital intense is the company?
By end 2017, AFK had €24.4 billion assets and €14.8 billion invested capital (IC)5 .
With sales of €25.8 billion, the firm’s capital intensity (IC/sales) is 0.6. This is lower
than Philips’ 1.0 and much lower than the 1.5 we see at a typical aluminium
company. However, AFK also has much lower margins than the latter and hence
has lower ROIC as well. Moreover, capital intensity will probably rise as operating
leases come on the balance sheet as a liability per January 2019 (IFRS 16). AFK’s
capital structure is quite risky, with long-term debt (most notably long term
borrowing, pension obligations and leases) over €10bn by end of 2017, versus less
than €6bn in market cap and only €3bn in book equity at the time.
4 PwC, Tailwinds report, 2018 airline industry trends
5 Invested capital deviates from total assets as non-operating assets (such as stakes and excess cash) and non-interest bearing short
term liabilities are deducted from total assets to arrive at invested capital
12 | Erasmus Platform for Sustainable Value Creation2.4. What do you think is the firm's cost of capital? Please explain
AFK’s levered beta is 0.66 on a 5-year monthly basis. Due to its leverage (Net debt/
Equity6 =2), its unlevered beta is even lower, at 0.22 (0.66/3=0.22). However, this
seems way too low given the cyclicality of the business and is probably more a
reflection of the stock’s poor return history than of its operational risk. Over a 20-
year time frame, the company’s levered beta is 1.42, and for extended periods,
airline beta’s have been over 2. We therefore deem a beta of 1.5 more appropriate.
Assuming a long-term risk-free rate (Rf) of 4% and long-term market expected
return (Rm) of 8%, its WACC becomes: 4%+1.5*(8%-4%)=10%. That is significantly
higher than AFK’s own estimate of 7.5% (AR 2017, p198) – based on a cost of equity
at 12.1% (reasonable), and driven down by currently low cost of debt (2.7%).
2.5. What is the firm's return on invested capital (ROIC)? Please
explain
With NOPLAT7 at €1.1 billion, AFK has ROIC=NOPLAT/IC=1.1/13.88=7.7%. This is
not high, but much higher than the company made historically: around 0% over
2010-2014 and 5-6% during 2015-2016. It is still below our estimate of the
company’s cost of capital (10%) and pretty close to AFK’s own estimate of 7.5%.
Value driver overview
2.6. Please sketch how you see the company's value drivers going
forward in the table below
TABLE 4: VALUE DRIVER ASSESSMENT FOR AFK
Our assessment on
Our assessment on
the next decade,
Value driver Market implied the next decade,
before ESG
after ESG analysis
analysis
Sales growth 2% 1% -2%
EBIT margins 4,5% 4% 3%
WACC 10% 10% 11%
Resulting fair value € 10,2 € 5,5The resulting fair values of €5.5 and 0 are obtained by putting the value driver
assumptions in a DCF like the one shown in the Philips case. These fair values are
well below AFK’s stock price of €10.2 per mid-February 2019. By adjusting our
assumptions to solve for the market price, we obtain the market implied value
driver assumptions: the market seems to price in 2% sales growth, while
maintaining the 4.5% EBIT margins at a 10% WACC. It is quite common to see
stocks price in the continuation of recent results.
While we get a negative fair value in our ESG integrated analysis, value and price
cannot go below 0. The negative equity value means that fair enterprise value is
below the value of debt. In that case, and also in cases where enterprise is slightly
above debt value, the equity effectively becomes an option and will be priced
accordingly.
Sensitivities on sales growth and margins are shown in Graph 1.
GRAPH 1: VALUATION SENSITIVITIES
Source: authors’ analysis
The high sensitivity to margins and WACC is extreme, but not surprising given the
high leverage and low ROIC.
3. Sustainability
Purpose
3.1. What is the company's purpose / raison d'être? In what way does
the company create value for society? How does it get paid for
that value creation?
We could not find a reference to the mission or purpose of either the group or Air
France, but did find KLM’s stated corporate purpose:
”Moving Your World By Creating Memorable Experiences”.
14 | Erasmus Platform for Sustainable Value CreationFrankly, this seems more of a marketing slogan than an authentic purpose. More
credible would be something about moving and connecting people. The
company creates value by bringing people to other places, and gets paid for doing
so, but insufficiently to cover its cost of capital. At the same time, the company
(like any airline) also destroys a lot of value with its carbon emissions. On balance,
the company is probably value destructive, and the same applies to most of its
peers.
Stakeholders
3.2. What are the company's main stakeholders? Please fill out below
the stakeholder impact tool
TABLE 5: STAKEHOLDER IMPACT MAP FOR AFK
Employees Customers Governmenst Airports
Good working Jobs,
conditions & environmental
working hours, Cheap tickets, protection,
high salaries & good services, compliance, Fees,
benefits, reliability, safety, security connections,
Goals
personal range of measures, tax traffic for retail
development, destinations, big income, national operations
professional seats, etc. pride, influence,
pride & financial/ economic
job security growth
How the Offer discounts, Keep running
Pay and job Keep running their operations
company helps frills, new routes
fulfilment their operations
those goals etc.
Job cuts, Bargaining for
How the efficiency fees, switch to
High prices, poor Job cuts, high
company hurts measures, different airports
service, delays emissions
those goals utilization
maximization
Source: authors' analysis
In the stakeholder impact map, two frictions stand out:
1. The friction between what customers want (low prices & high service), and
what employees want (high wages and less work pressure) in an unsuccessful
profit formula;
2. The governments’ conflicting interests of having on the one hand more traffic
(and jobs and tax income) and on the other hand lower carbon emissions.
15 | Erasmus Platform for Sustainable Value CreationThese frictions are serious and are in stark contrast to the Philips case, where the
stakeholder impact map found very limited friction among stakeholders. Most
companies seem to be in between, with less but still significant frictions among
stakeholders. These frictions deserve to be discussed in a group. Our teaching
sessions showed that, with a bit of help, a group of students can get to the core of
such issues very fast.
Externalities & impact
To guide the transition towards a sustainable and inclusive economy, the United
Nations has developed the 2030 Agenda for Sustainable Development. The 17 UN
Sustainable Development Goals (SDGs) stimulate action over the years 2015-2030
in areas of critical importance for humanity and the planet. This should result in a
serious reduction in negative externalities. The corporate sector too is increasingly
working on the internalisation of externalities, which is a threat for some and an
opportunity for others (e.g. Schramade, 2017). However, even if the SDGs are
achieved, that does not guarantee that we stay within the planetary boundaries
identified by Steffen et al. (2015) – beyond which climate may change so
dramatically that life on earth becomes hard if not impossible.
3.3. Does the company generate serious externalities? Are they
positive or negative? How do you assess the chances of these
externalities to be internalised?
On the positive side, airlines stimulate economic growth and the exchange of
people and ideas. The large negative externality is its impact on the environment.
For AFK and its main peers, Table 6 shows the limited availability of carbon
emissions data in Bloomberg, the main financial terminal used by financial
analysts.
TABLE 6: AFK'S EMISSIONS VERSUS PEERS
2016 2017
2016 2017
Bloomberg Bloomberg 2016 2017
sales, sales,
Company direct CO2 direct CO2 emissions emissions
EUR EUR
emissions, emissions, /sales /sales
bn bn
mn t mn t
AFK 28.2 Not available 24.8 25.8 1.17 Not available
Lufthansa 28.5 30.3 31.7 35.6 0.90 0.85
16 | Erasmus Platform for Sustainable Value CreationIAG /
Not
British Not available Not available 22.6 23.0 Not available
available
Airways
Ryanair* 8.6 Not available 6.6 7.2 1.30 Not available
Not
EasyJet Not available Not available 4.7 5.0 Not available
available
Source: Bloomberg and authors' analysis
Data availability is limited and so is comparability. Differences in carbon emissions
intensity of sales might be a genuine reflection of differences in carbon emissions
efficiency, but they might also be driven by differences in the type of flights (short
haul vs long haul), measurement, or the ability to charge high prices. Based only
on the available data, we cannot tell.
Reporting is poor and target setting is even poorer: recent work by the LSE9 shows
that that none of the world’s top 20 stock-listed air carriers have any plans in place
to manage their carbon emissions after 2025.
3.4. Which of the SDG's (if any) does the company help achieve?
Which negative SDG-exposure (if any) does the company have?
AFK claims to significantly contribute to the realisation of SDGs 7, 8, 9, 12 and 13.
That claim is probably correct for SDGs 8 (decent work and economic growth)
and 9 (industry, innovation and infrastructure), but not for SDGs 7 (affordable and
clean energy), 12 (responsible consumption and production) , and 13 (climate
action). AFK does make efforts to reduce its environmental footprint, but the
company continues to be a heavy polluter and still contributes negatively to these
SDGs. Like many others, AFK confuses a less negative contribution with a positive
contribution.
3.5. To what extent can the company's impact be measured? Does the
company report on its impact? How can its reporting be
improved?
The company’s negative impact on the environment can be measured to some
extent: its emissions are partly reported, but not other effects like its impact on
biodiversity. We also have no quantifiable information on the company’s social
impact. Unlike Philips, the company makes no effort at impact reporting, and it
9 https://www.euractiv.com/wp-content/uploads/sites/2/2019/03/TPIstudy.pdf
17 | Erasmus Platform for Sustainable Value Creationdoes not set impact targets. AFK’s social impact could be estimated though, either superficially with models on employee and customer well-being, or more thoroughly by applying the TruePrice or True Value methodology. On the carbon emissions side, we can do some rough calculations based on the following numbers: TABLE 7: AFK KEY FINANCIALS & EMISSIONS 2017 CO2 emissions, scope 1 & 2, millions of tonnes 32.7 2017 sales, millions of Euros 25,784 2017 EBIT, millions of Euros 1,423 2017 Net income, millions of Euros -274 Source: AFK AR 2017 Based on 2017 numbers, AFK’s negative environmental externality can be made visible by applying a carbon tax to its carbon emissions - regardless of whether such a tax is actually in place or not. The charge is then simply the carbon tax times the amount of carbon emissions. The below chart illustrates the size of the charge at various carbon prices. GRAPH 2: AFK'S CO2 CHARGE The horizontal axis represents CO2-prices Source: authors' analysis So, for example, at a carbon price of €100, the charge is €3.3 billion. If such a carbon price were indeed levied, AFK would try to pass on the cost to its customers. Thus, the charge would come on top of ticket prices and sales. In the case of a €100 carbon price, that would mean 13% higher ticket prices and sales. See Graph 3. 18 | Erasmus Platform for Sustainable Value Creation
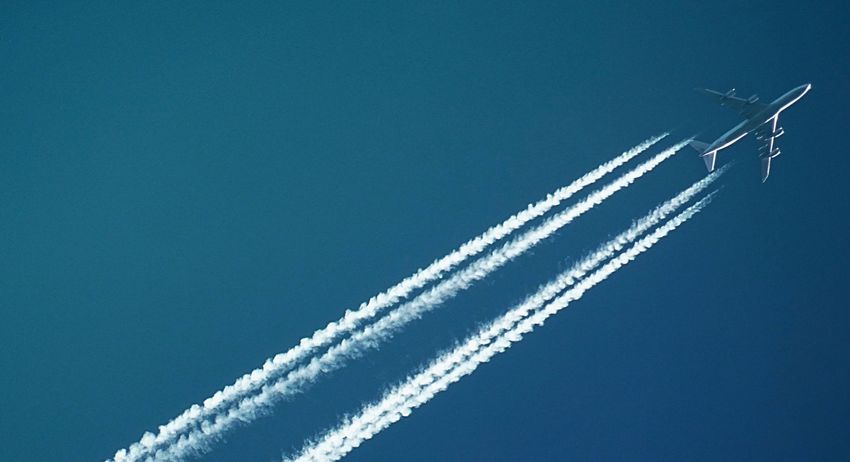
GRAPH 3: AFK’S CO2 CHARGE AS A PERCENTAGE OF SALES & EBIT

Source: authors' analysis

In reality, AFK’s sales would likely go up less than the charge, or would even drop,
as passenger numbers would fall in response to higher ticket prices. The charge is
even higher when compared to EBIT: 235% of EBIT at a €100 carbon price.

But the actual impact of such a carbon price is unclear as it would depend on the
company’s ability to pass on the cost (which is likely low in such a price
competitive industry). At first sight, the impact could range from 0 (full pass on) to
the aforementioned 3.3 billion (0 pass on), as illustrated in Graph 4.

GRAPH 4: AFK’S EBIT REDUCTION RELATED TO ITS ABILITY TO PASS ON THE CO2 CHARGE

Source: authors' analysis

19 | Erasmus Platform for Sustainable Value Creation
However, this is still too simplistic, as it ignores the volume effects. The impact on
EBIT is impossible to tell, as you need to take into account the reactions of the
airline, its competitors and its clients. The company (and industry) might be able to
pass on the charge in its prices to customers (in the hypothetical case of 0 price
elasticity), but can still take a hit due to lower passenger volumes, which means
less of its fixed cost base is covered. In fact, there could even be a positive effect
on EBIT if the company manages to have a lower CO2 footprint than its peers
(thanks to biofuel initiatives & a younger fleet). The ideal scenario would see AFK
benefit from a CO2 advantage and from strong connections to high-speed rail at
its hubs – and gain back market share from low-cost carriers. This scenario is not
as far-fetched as it may sound: long-haul flights cannot be replaced by train
connections and are therefore less likely to be disrupted than short-haul. At least
in this respect, legacy carriers seem to be better positioned than low-cost carriers.

       Thresholds: how does the company perform versus the planetary
       boundaries?

In other words: is the firm’s sustainability performance good enough? It is hard to
tell and the company does not indicate how big its contribution is versus how big
it should be. Then again, neither does Philips. The only company we are aware of
that has made a serious try in this respect is Novo Nordisk, which recently
launched its Future Fit analysis.

Material issues
Not all sustainability issues are equally important (‘material’) from an investment
perspective. It is important to identify material sustainability issues, which may
differ across companies and industries (Khan et al., 2016).

       3.6. What are the most material ESG factors? I.e., what issues are
            most critical to the success of the company's business model?
            Please fill out the below matrix, discussing for each of these most
            material ESG factors: how the company performs on it, whether
            the company derives a competitive (dis)advantage from it and
            how they might affect the value drivers.

TABLE 8: MOST MATERIAL ISSUES FOR AFK & VALUE DRIVER IMPACT

                                                                            Impact on value
Material issue         Performance              Competitive edge?
                                                                            drivers?
                      It is not clear how
                                                                            Not enough
                      well AFK does versus      AFK has the potential
                                                                            information, but likely
                      airline peers. In short   to obtain a
                                                                            negative on sales &
                      haul, the airline         competitive edge,
Carbon emissions                                                            margins going
                      industry clearly          given its biofuel
                                                                            forward, given the
                      underperforms the         initiatives. But there is
                                                                            edge of high-speed
                      high-speed rail           no evidence yet.
                                                                            rail
                      network

20 | Erasmus Platform for Sustainable Value Creation
Four large
shareholders
Corporate
including two State No, disadvantage Higher WACC
governance
governments make
this a tricky situation
Weak, especially on
the Air France side, No, higher costs than Negative on margins
Human capital
which is hit by strikes entrants (already)
very frequently
Source: authors' analysis
One could also mention product quality, brand, supply chain and digitalisation. But
the above three seem most material, and we discuss them below.
Carbon emissions
As indicated above, carbon emissions are a very material issue for AFK. To address,
this, the company presents its Climate Action Plan on page 163 of the 2017 AR,
with six main priorities:
• Fleet modernisation & contribution to aeronautics research
• Mobilising the groups internal and external players around action plans
enshrining eco-design principles
• Supporting NGO-led environmental programs
• Promoting the emergence of sustainable alternative biofuels for aviation and
research into renewables
• Giving customers information on their travel-related CO2 emissions and the
opportunity to offset these
• Supporting international efforts to reach a global climate agreement in which
the aviation sector would make a just and equitable contribution
These points make sense, but they do raise some questions, such as: what is the
progress on these points? What is a just and equitable contribution?
The 2017 AR also refers to IATA’s10 emission reduction targets:
• By 2020, a 1.5% annual improvement in energy efficiency
• From 2020, neutral growth in CO2 emissions, particularly via market-based
mechanisms
• By 2050, a 50% reduction in CO2 emissions relative to their 2005 level
• Will AFK exceed theses targets? A 1.5% annual improvement in energy efficiency
is not good enough versus airline growth.
Corporate governance
10 The International Air Transport Association
21 | Erasmus Platform for Sustainable Value CreationAFK has a complicated group structure, with heavy government influence, which
exacerbates the human capital problem of the group. Moreover, in February 2019,
the Dutch government surprisingly took a 14% stake in AFK, putting it on par with
the French stake, and ahead of Delta Airlines and China Eastern Airlines. The move
was meant to protect the interests of KLM and Schiphol airport (which is wholly
owned by the Dutch state). It should also be seen in light of the skewness in the
group: KLM is smaller but much more profitable (85% of group operating result in
H1 2017) than Air France.
This move sparked a lot of debate on the role of governments in capital markets
and the quality of the investment climate. For AFK, it means more uncertainty as it
now has four large shareholders with conflicting interest. This could result in
actions that hurt minority shareholders.
Human capital
Personnel is key for an airline and AFK’s staff cost amounted to €7.6bn in 2017.
Table 9 shows the distribution of AFK’s personnel, which is skewed to France. It is
especially the 8 thousand flight deck crew (pilots) that drive up personnel cost.
They are heavily unionised and have strong bargaining power. And in May 2018,
CEO Jean-Marc Janaillac resigned over not reaching a pay deal with the unions.
However, bargaining power will likely erode over time:
1. they earn much more than at low-cost peers, which seems unsustainable;
2. autonomous flight is possible and basically makes them superfluous. Suppose
the 8 thousand pilots are overpaid by €100,000 on average, then the rent
extraction amounts to €800 million annually. It also weakens AFK’s
competitive position vis-à-vis the low cost carriers, which do not overpay their
pilots.
TABLE 9: AFK KEY STAFF NUMBERS
2015 2016 2017
Total staff 89,490 87,917 87,312
Ground staff 56,318 54,969 53,185
Cabin crew 24,947 24,757 25,859
Flight deck crew 8,225 8,191 8,268
50 years and above 28,672 30,378 30,318
The Netherlands 30,101 29,747 30,217
France 50,034 49,510 48,961
22 | Erasmus Platform for Sustainable Value Creationsource: 2017 AR, p142
AFK is frequently hit by strikes, particularly on the Air France side. The word
combination ‘Air France & strike’ gives 89 million hits on Google (25 Oct 2018) vs
1.4 million for ‘KLM & strike’. A strike effectively puts the company out of business
for several days, costing it hundreds of millions. They typically strike during the
holiday season, as they know they hit results hardest then. Surprisingly, Air France
scores 4.1 (out of 5) on Indeed and KLM 4.2; Air France scores 3.8 on Glassdoor,
and KLM 4.0; Air France - KLM scores 3.3 (i.e., HQ lower). The cynical explanation
of these scores is that working conditions are good and that employees are
exploiting their bargaining power.
Sustainability reporting
Integrated Reporting () aims to improve financial reporting by giving a more
complete picture of corporate performance, including non-financial or pre-
financial performance.
3.7. How do you assess the company’s non-financial reporting? And
its approach to sustainability? How credible is it?
AFK reports on a number of sustainability issues, but it is still a far cry from
integrated reporting, as the strategic context is mostly lacking. Unlike Philips, AFK
does not offer an visualisation of its business model in its 2017 annual report.
In contrast, Philips’s sustainability reporting is very advanced. The company has a
long tradition in integrated reporting (since 2008) and sustainability reporting
(since 1998). Notable features in its 2017 annual report include targets on circular
economy sales, and the target of 3bn lives improved – making it one of the few
companies that reports on impact. Philips also has an environmental profit & loss
(EP&L) statement.
3.8. Does the company (claim to) do Integrated Reporting ()?
No. This is unlike Philips, which has been doing since 2008.
3.9. To what extent do you see the seven principles of reflected
in the company’s reporting? Please fill out the following matrix
(see also Table 6.3 in Chapter 6):
Philips does quite well:
23 | Erasmus Platform for Sustainable Value CreationTABLE 10: PRINCIPLES OF FOR AFK AND PHILIPS
Degree of application for Degree of application for
Principle
AFK Philips
~ there is a part on strategy,
Strategic focus and future √ describe the path to value
but it does not explain the
orientation creation; ‘roadmap to win’
company’s strategy very well
√ there is quite a bit of cross-
Connectivity of information ~ limited
referencing
√ Air France - KLM has a
separate section called
‘dialogue with stakeholders’ √ Philips explicitly refers to its
Stakeholder relationships and often refers to its stakeholders and to its multi-
stakeholders – though in a stakeholder projects
less structured way than
Philips
√ Philips reports a materiality
matrix that rates quite a few E,
~ priorities are not clear and
Materiality S, and G issues on business
no materiality matrix is given
impact versus importance to
stakeholders
X report is still hundreds of X report is still hundreds of
Conciseness
pages long pages long
~ Philips reports ‘sustainability
statements’, which includes
references to stakeholders; a
materiality matrix, as well as
data and targets on items
X key issues are missing and
Reliability and such as lives improved,
the assurance is limited on
completeness circular revenues, carbon
most reported issues
footprint, waste recycling and
supplier sustainability.
However, it is not very clear
how that affects financial
results
√ comparability of data versus
Consistency and other years is good, but
~ limited comparability
comparability comparability with other
companies is limited
Source: authors’ assessment of the Philips and AFK 2017 annual reports
4. Strategy
Ideally, a company’s strategy is aimed at long-term value creation (see
Schoenmaker and Schramade, 2019, Chapter 5).
24 | Erasmus Platform for Sustainable Value Creation4.1. How would you describe the strategy of the company? The strategy of the company is not very well described, but seems to be based on hubs and partnerships. As the company puts it in its 2017 annual report (page 70): The Air France - KLM Group’s ambition is to be a European leader in the air transport industry by offering all customer segments transport offers tailored to their needs, between both Europe and the rest of the world and on intra- European routes on departure from the Group’s natural markets. This goal is supported by the Group’s different brands which are positioned in complementary markets with their own specific operating models. The network brands, Air France, KLM and Joon, are based on a system of hubs around efficient infrastructure at Paris- CDG and Amsterdam- Schiphol, and take advantage of numerous partnerships to offer a high-density network. They also offer a wide range of top-quality products and services in which digital technologies will enable more personalization to ensure a more effective response to customer expectations. Air France - KLM’s expertise in the cargo business supports the Group’s airline operations while making a material contribution to their economics. The point- to- point (HOP! Air France) and low- cost (Transavia) brands aim to provide efficient transportation solutions for domestic and intra- European travel. The Air France - KLM Group also plans to develop its positioning as a global reference player in the aeronautics maintenance market by leveraging its recognised know- how in terms of operational efficiency, innovation and technical expertise. The company goes on to list its strengths: • A strong presence in all the major markets • Coordinated hubs • A portfolio of strong brands aligned with customer expectations • A balanced customer portfolio And on page 70 it says: The Group’s strategy, whose concrete expression is the “Trust Together” project, must enable Air France - KLM to rise to three major challenges: capture its share of global air transport industry growth, further enhance the customer experience and reinforce the Group’s operational efficiency while achieving the competitiveness targets in the “Perform 2020” plan. Unfortunately, the company does not explain its strategy in terms of the five elements of a strategy as defined by Hambrick & Fredrickson (2005): arenas, staging, vehicles, differentiators and economic logic. 25 | Erasmus Platform for Sustainable Value Creation
4.2. To what extent does that strategy take into account the
             company’s most material ESG issues? Please link to your answer
             in section 3.

The strategy is not linked to material ESG issues, which is surprising given the
challenges the company faces in human capital and carbon emissions.

        4.3. Is the strategy consistent with the company’s purpose? Please
             explain.

That is not clear as both the company’s strategy and its purpose are not very clear.

        4.4. What does long-term value creation look like? What are the best
             KPIs for it?

Long-term value creation for all stakeholders means decent returns on F, E and S:
• F: ROIC above the cost of capital. AFK does not achieve that.
• E: avoid harm and ideally improve by providing solutions to others in reducing
  their harm. AFK does do harm and tries to reduce it. Possible KPIs include
  carbon emissions; carbon emissions savings.
• S: similar to E in terms of avoiding harm and providing solutions. In some
  respects, AFK seems to give too much value to employees, especially pilots.
  KPIs: salaries, NPS, local medical scores, employee satisfaction.

In sum, AFK’s value creation/destruction process is rather unbalanced. More
generally, the criteria for value creation in terms of E and S are not fully clear, but
KPIs to proxy them are available.

        4.5. What does management compensation look like? To what extent
             does management have long-term incentives? And are those
             incentives aligned with long-term value creation?

Page 43 of the 2017 AR outlines that over 2017, the CEO’s compensation was
€600,000 in cash, plus variable compensation. The variable compensation was
60% based on financial targets and 40% on qualitative performance in terms of
governance, strengthening of internal group alliances, and the “Trust together”
project. So, it was partly tied to human capital (“Trust together” project), but not to
environmental performance.

        4.6. How does the company communicate its long-term value
             creation with shareholders and stakeholders?

This is not clear.

26 | Erasmus Platform for Sustainable Value Creation
5. Value drivers – part 2
In Schramade (2016) it is described how analysts can make adjustments to their
value driver assumptions based on how the company’s most material ESG issues
affect its competitive position.
5.1. Given all of the above questions & their answers, how do you rate
the effect of material sustainability issues on the value drivers
going forward? Per value driver, please indicate whether you see
a positive, negative or neutral effect – and please explain why.
All three value drivers are negatively affected by material ESG issues:
TABLE 11: VALUE DRIVER ASSESSMENT FOR AFK
Positive/negative/ Explanation
Value driver
neutral
Carbon pricing will come
Sales growth Negative (going forward) and it will hurt industry
growth, notably in Europe
Labour is keeping margins
down and carbon pricing
Profitability Negative (already)
is likely to depress them
further
Governance is an issue
and investments are
Capital Negative
needed to solve the
emissions problem
Source: authors' analysis
5.2. How would this affect your valuation of the company?
Our assessment gives lower growth, lower margins and a higher cost of capital for
AFK, as summarised in table 12 (and shown also in table 4):
TABLE 12: VALUE DRIVER ADJUSTMENTS FOR AFK
Explanation AFK
AFK incl ESG AFK
Value driver ex ESG
disadvantage disadvantage
disadvantage
Sales
-2% 1% 300bps
growth
Margins 3% 4% 100bps
27 | Erasmus Platform for Sustainable Value CreationCost of capital
11% 10% 100bps
DCF value of the
€0 € 5,5 € 5,5
stock price
Source: authors' analysis
Given the extreme outcome (€0 fair value) and the large impact of carbon pricing,
we should not stop our analysis here. We apply scenario analysis to better
understand AFK’s value.
Our scenarios are as follows:
• Bull: airplane manufacturers brilliantly solve the carbon emissions problem &
AFK solves its labour problem
• Market: business as usual. This is what the market price implied in February 2019
• Base: AFK will suffer from high carbon prices (and negative growth), but those
troubles will allow it to solve its labour problem. The company will shrink, but it
survives in an ultimately more sustainable way
• Bear: the carbon price rises in shock that AFK is unable to absorb
The four scenarios have the following numbers associated with them:
TABLE 13: SCENARIOS & VALUE DRIVER ASSUMPTIONS FOR AFK
Overall
Market Our base
Bull case Bear case share
base case case
price
Gradual rise & Gradual rise &
Nothing Rise in
Emissions very well managed
happens shocks
managed by AFK okay
-2% & some
Growth 4% 2% -2% years with
-10%
Margins 8% 5% 3% 0%
Resulting
35 10 0 0
value
Probability (1) 15% 45% 20% 20% 9
Probability (2) 10% 30% 30% 30% 6
Source: authors' analysis
28 | Erasmus Platform for Sustainable Value CreationBalancing these scenarios with probabilities is visualised in Table 14, which only
contrasts the probabilities of the bull and market base scenarios, since the other
two both have (€0 fair value and hence their probabilities can be combined.
TABLE 14: SCENARIOS & VALUE DRIVER ASSUMPTIONS FOR AFK
Source:authors' analysis
The current price (€10, early Feb 2019) can be read as 20% chance of the bull
case, 30% chance of the market base case, and 50% combined chance of our
base case and the bear case.
6. Investment conclusions
6.1. How well prepared do you think AFK is for the transition to a
more sustainable economic model?
In our view, AFK does not look well prepared. In contrast, Philips is comparatively
very well prepared for a more sustainable economic model, with advanced
sustainability thinking and reporting, and its actions in the right direction: efforts on
carbon emissions reductions, circular economy, and a more affordable and
efficient healthcare system. AFK is in a much tougher predicament and has shown
no clear signs of being able to overcome its challenges.
6.2. How attractive do you find the company as an investment? Please
explain and refer to your above answers.
It is hard to find AFK attractive as an investment. The environmental, human capital
and governance issues are severe. The equity looks more like an option than like a
solid investment.
6.3. What did you find most surprising when answering the above
questions?
We found the lack of integration of environmental and social issues into the
company’s strategy quite surprising.
29 | Erasmus Platform for Sustainable Value Creation6.4. If you were to engage with the firm, what topics would you
address?
Questions:
• What are management’s views on consumer preferences, technology
development, CO2 pricing etc.? And what are the implications for AFK’s
strategy?
• What is their view on sustainability thresholds?
• What kind of CO2 price scenarios do they use? What do they assume in terms
of sales and margins?
• How are they going to deal with a rising CO2 price? How do they compare to
other legacy carriers and to low cost carriers?
• How much of the CO2 price will they be able to pass on?
• What can we expect from their biofuels initiatives?
• Progress on climate targets? What does a fair & equitable contribution from the
airline industry look like?
• Do they see scope for cooperation with high-speed train operators in a hub-
and-spoke model?
• How are they going to deal with the high costs of pilots (salaries and pension
contributions)? How do they compare to low cost carriers?
Feedback:
• Please improve reporting, provide a much clearer strategic view…
• Please give more granularity on impact and the contributions to the SDGs: how
big are those in both positive and negative terms?
In addition, data on comparable firms would be most welcome, but ESG data
providers or sell-side research would be the more logical source of such
comparisons.
30 | Erasmus Platform for Sustainable Value Creation5 Conclusions and
reflections
AFK provides interesting case material due to the significant challenges it faces
especially on carbon emissions, human capital and governance. On the website of
the Erasmus Platform for Sustainable Value Creation (https://www.rsm.nl/
erasmus-platform-for-sustainable-value-creation/home/) we also publish similar
cases for other companies, which allows for comparing AFK with companies that
face much different circumstances. For example, our first case study was on
Philips, which is very advanced in sustainability thinking and reporting. For Philips,
sustainability is much more of an opportunity than a threat.
During our executive course on sustainable finance, the students (mostly bankers
and pension fund professionals) compared AFK’s transition preparedness to that of
McDonald’s and BMW. In their opinion, AFK is the weakest of these three
companies since it has least room to manoeuvre. Still, we identified a serious
carbon price scenario in which AFK could prosper. For that to happen though, it
will have to be successful in dealing with its material issues.
On the carbon emissions side, AFK is exposed to the risk of a serious carbon price.
It is unclear to what extent the company can prepare itself for that. Nor is it clear
how the company is positioned versus peers. However, we do observe that the
company is trying to lower its exposure by updating its fleet and by doing pilots on
biofuels. Human capital management at AFK is tough, as the pilots’ unions are
powerful and often go on strike, resulting in significant losses. Governance is also
a major concern, with government involvement likely to override the concerns of
shareholders and other stakeholders.
The above analysis was done based on public information, which contains serious
gaps. We might have been able to fill some of those gaps by talking to AFK’s
management11. Management’s thinking on sustainability issues is likely to go much
beyond what is currently disclosed and it typically does not get challenged on
these issues by investors – in spite of their relevance to the value drivers.
Therefore, engagement on these issues could be very valuable to investors and
management alike.
11 This would not be inside information, in contrast to stock price sensitive information on yet unreported results.
31 | Erasmus Platform for Sustainable Value Creation6 References
Hambrick, D. C., and J.W. Fredrickson (2005). Are you sure you have a strategy?. Academy of
Management Perspectives, 19(4), 51-62.
Johnson, M., C. Christensen and H. Kagermann (2008), ‘Reinventing your business model’,
Harvard Business Review, 86(12): 57-68.
Khan, M., G. Serafeim and A. Yoon (2016), ‘Corporate Sustainability: First Evidence on Materiality’,
Accounting Review, 91(6): 1697-1724.
Koller, T., M. Goedhart, and D. Wessels, D. (2015). Valuation: Measuring and managing the value of
companies, 6th edn, John Wiley & Sons, New York.
PwC (2018), Tailwinds report, 2018 airline industry trends.
Steffen, W., K. Richardson, J. Rockström, S. Cornell, I. Fetzer, E. Bennett, R. Biggs, S. Carpenter, W.
de Vries, C. de Wit, C. Folke, D. Gerten, J. Heinke, G. Mace, L. Persson, V. Ramanathan, B.
Reyers and S. Sörlinet (2015), ‘Planetary boundaries: Guiding human development on a
changing planet’, Science 347(6223): 736-47.
Schoenmaker, D. and W. Schramade (2019), Principles of Sustainable Finance, Oxford University
Press, Oxford.
Schramade, W., and D. Schoenmaker (2018), Royal Philips: a sustainable finance case study.
Erasmus Platform for Sustainable Value Creation.
Schramade, W. (2016), ‘Integrating ESG into valuation models and investment decisions: the
value-driver adjustment approach’, Journal of Sustainable Finance & Investment, 6(2),
95-111.
Schramade, W. (2017), ‘Investing in the UN Sustainable Development Goals: Opportunities for
Companies and Investors’, Journal of Applied Corporate Finance, 29(2): 87-99.
32 | Erasmus Platform for Sustainable Value CreationYou can also read