Improvement of the satellite-derived NOx emissions on air quality modeling and its effect on ozone and secondary inorganic aerosol formation in ...
←
→
Page content transcription
If your browser does not render page correctly, please read the page content below
Atmos. Chem. Phys., 21, 1191–1209, 2021
https://doi.org/10.5194/acp-21-1191-2021
© Author(s) 2021. This work is distributed under
the Creative Commons Attribution 4.0 License.

Improvement of the satellite-derived NOx emissions on air quality
modeling and its effect on ozone and secondary inorganic aerosol
formation in the Yangtze River Delta, China
Yang Yang1,5 , Yu Zhao1,2 , Lei Zhang1 , Jie Zhang3 , Xin Huang4 , Xuefen Zhao1 , Yan Zhang1 , Mengxiao Xi1 , and Yi Lu1
1 StateKey Laboratory of Pollution Control & Resource Reuse and School of the Environment, Nanjing University,
163 Xianlin Ave., Nanjing, Jiangsu 210023, China
2 Jiangsu Collaborative Innovation Center of Atmospheric Environment and Equipment Technology (CICAEET),

Nanjing University of Information Science & Technology, Jiangsu 210044, China
3 Jiangsu Environmental Engineering and Technology Co., Ltd, Jiangsu Environmental Protection Group Co., Ltd., 8 East

Jialingjiang St, Nanjing, Jiangsu 210019, China
4 School of the Atmospheric Sciences, Nanjing University, 163 Xianlin Ave., Nanjing, Jiangsu 210023, China
5 College of Environmental & Resource Sciences, Zhejiang University, Hangzhou, Zhejiang 310058, China

Correspondence: Yu Zhao (yuzhao@nju.edu.cn)

Received: 22 July 2020 – Discussion started: 10 August 2020
Revised: 21 November 2020 – Accepted: 9 December 2020 – Published: 28 January 2021

Abstract. We developed a top-down methodology combin-          and from 111 % to 33 %, respectively. The results demon-
ing the inversed chemistry transport modeling and satellite-   strate the improvement of NOx emission estimation with the
derived tropospheric vertical column of NO2 and estimated      nonlinear inversed modeling and satellite observation con-
the NOx emissions of the Yangtze River Delta (YRD) re-         straint. With the smaller NOx emissions in the top-down es-
gion at a horizontal resolution of 9 km for January, April,    timate than the bottom-up one, the elevated concentrations
July, and October 2016. The effect of the top-down emission    of ambient O3 were simulated for most of the YRD, and
estimation on air quality modeling and the response of am-     they were closer to observations except for July, implying
bient ozone (O3 ) and inorganic aerosols (SO2−        −
                                               4 , NO3 , and   the VOC (volatile organic compound)-limited regime of O3
    +
NH4 , SNA) to the changed precursor emissions were evalu-      formation. With available ground observations of SNA in the
ated with the Community Multi-scale Air Quality (CMAQ)         YRD, moreover, better model performance of NO−   3 and NH4
                                                                                                                         +

system. The top-down estimates of NOx emissions were           was achieved for most seasons, implying the effectiveness
smaller than those (i.e., the bottom-up estimates) in a na-    of precursor emission estimation on the simulation of sec-
tional emission inventory, Multi-resolution Emission Inven-    ondary inorganic aerosols. Through the sensitivity analysis
tory for China (MEIC), for all the 4 months, and the monthly   of O3 formation for April 2016, the decreased O3 concentra-
mean was calculated to be 260.0 Gg/month, 24 % less than       tions were found for most of the YRD region when only VOC
the bottom-up one. The NO2 concentrations simulated with       emissions were reduced or the reduced rate of VOC emis-
the bottom-up estimate of NOx emissions were clearly higher    sions was 2 times of that of NOx , implying the crucial role
than the ground observations, indicating the possible over-    of VOC control in O3 pollution abatement. The SNA level
estimation in the current emission inventory, attributed to    for January 2016 was simulated to decline 12 % when 30 %
its insufficient consideration of recent emission control in   of NH3 emissions were reduced, while the change was much
the region. The model performance based on top-down es-        smaller with the same reduced rate for SO2 or NOx . The re-
timate was much better, and the biggest change was found       sult suggests that reducing NH3 emissions was the most ef-
for July, with the normalized mean bias (NMB) and nor-         fective way to alleviate SNA pollution of the YRD in winter.
malized mean error (NME) reduced from 111 % to −0.4 %

Published by Copernicus Publications on behalf of the European Geosciences Union.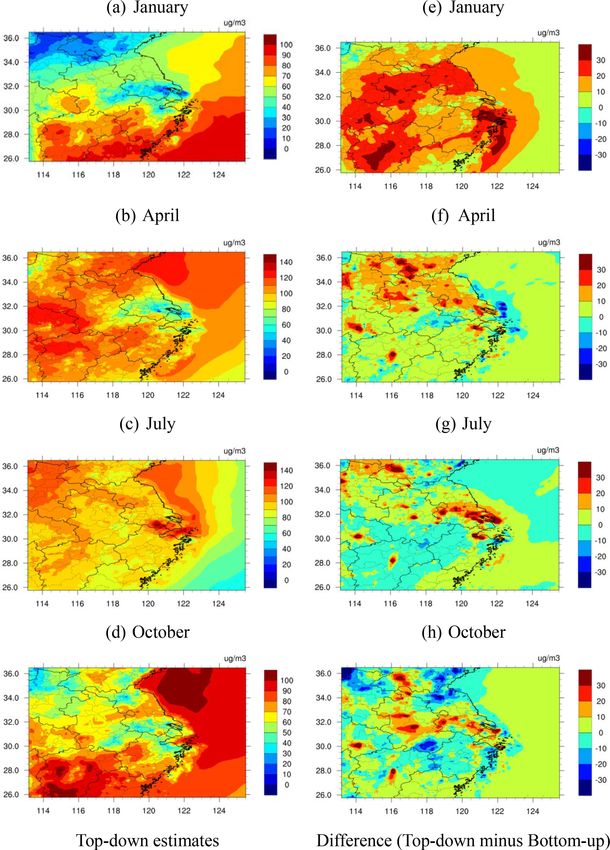
1192                                                Y. Yang et al.: Improvement of satellite-derived NOx emissions in YRD

1   Introduction                                                  to national and regional ones, limited estimates were avail-
                                                                  able at the regional scale with finer resolution. In China, great
Nitrogen oxides (NOx = NO2 + NO) play an important role           differences exist in the levels and patterns of air pollution
in the formation of ambient ozone (O3 ) and inorganic             across the regions, attributed partly to a big variety of air
aerosols (SO2−         −           +
               4 , NO3 , and NH4 , SNA). The NOx emis-            pollutant sources across the country. To achieve the target of
sion inventory is a necessary input of the air quality model      air quality improvement required by the central government,
(AQM) and has a great influence on NO2 , O3 , and SNA sim-        varied air pollution control plans were usually developed and
ulation (Zhou et al., 2017; Chen et al., 2019a). Moreover, it     implemented at the city/provincial level. Therefore, the top-
is crucial for exploring the sources of atmospheric pollution     down estimates in NOx emissions at finer horizontal resolu-
of O3 and fine particles (particles with aerodynamic diame-       tion are greatly needed for understanding the primary sources
ter smaller than 2.5 µm, PM2.5 ) with the AQM. The inven-         of NO2 pollution and demonstrating the effect of emission
tories were usually developed with a bottom-up method, in         control at the regional scale.
which the emissions were calculated based on the activity            At present, the reliability and rationality of the top-
data (e.g., fuel consumption and industrial production) and       down emission estimates are commonly evaluated with the
emission factors (the emissions per unit of activity data) by     AQM and satellite observations. For example, the bias be-
source category and region. Bias existed commonly in the          tween the NO2 TVCDs from OMI observations and the
bottom-up inventories, due mainly to the uncertainty of eco-      AQM based on the top-down NOx emission estimation was
nomic and energy statistics and to the fast changes in the        −30.8 ± 69.6 × 10¹³ molec. cm−2 in winter in India (Jena et
emission control measures, especially in developing coun-         al., 2014). The linear correlation coefficient (R 2 ) between
tries like China (Granier et al., 2011; Saikawa et al., 2017;     OMI and the AQM with the top-down emission estimates
Zhang et al., 2019).                                              could reach 0.84 in Europe (Visser et al., 2019). Compared
   To improve the emission estimation, an inversed top-down       to the satellite observations with relatively large uncertainty
method has been developed based on satellite observations         (Yang et al., 2019b; Liu et al., 2019), surface concentrations
and the AQM (Martin et al., 2003; Zhao and Wang, 2009;            that better represent the effect of air pollution on human
Zyrichidou et al., 2015; Yang et al., 2019a). The emis-           health and the ecosystems were less applied in the evalua-
sions were corrected based on the difference between the          tion of the top-down estimates of NOx emissions. Limited
modeled and observed tropospheric vertical column densi-          assessments were conducted at the national scale. For exam-
ties (TVCDs) of NO2 and the response coefficient of NO2           ple, Liu et al. (2018) found that the normalized mean error
TVCDs to emissions (Martin et al., 2003; Cooper et al.,           (NME) between the observed and simulated NO2 concen-
2017). With higher temporal and spatial resolution than other     trations based on the top-down estimate of NOx emissions
instruments, the NO2 TVCDs from the Ozone Monitoring              could reach 32 % in China at the resolution of 0.25◦ × 0.25◦ .
Instrument (OMI) were frequently used (Kurokawa et al.,           Besides NO2 , the estimation of NOx emissions also plays
2009; Gu et al., 2014; de Foy et al., 2015; Kong et al., 2019;    an important and complicated role in secondary air pollu-
Yang et al., 2019a).                                              tant simulation including O3 and SNA, and the response of
   Currently, top-down methods are mainly developed at the        secondary pollution to the primary emissions was commonly
global or national scale with relatively coarse horizontal res-   nonlinear. The simulated O3 concentrations in Shanghai (the
olution (Martin et al., 2003; Miyazaki et al., 2012; Jena et      most developed city in eastern China) could increase over
al., 2014; Gu et al., 2014). At the global scale, for example,    20 %, with a 60 % reduction in NOx emissions in summer
Martin et al. (2003) and Miyazaki et al. (2012) estimated the     2016, implying a clear VOC (volatile organic compound)-
NOx emissions at the horizontal resolution of 2◦ × 2.5◦ and       limited pattern for the O3 formation in the megacity (Wang
2.8◦ × 2.8◦ , respectively. Martin et al. (2003) found that the   et al., 2019). For the response of SNA to NOx emissions,
                                                                                      2−
satellite-derived NOx emissions for 1996–1997 were 50 %–          the NH+  4 and SO4 concentrations at an urban site in an-
100 % larger than the bottom-up estimates in the Po Val-          other megacity Nanjing in eastern China were simulated to
ley, Tehran, and Riyadh urban areas. Miyazaki et al. (2012)       increase 1.9 % and 2.8 %, with a 40 % abatement of NOx
suggested that the bottom-up method underestimated the            emissions in autumn 2014, respectively, due to the weak-
NOx emissions over eastern China, the eastern United States,      ened competition of SNA formation against SO2 (Zhao et al.,
southern Africa, and central–western Europe. At the national      2020). To the best of our knowledge, however, the relatively
scale with the horizontal resolution of 0.5◦ × 0.5◦ , the an-     new information from the inversed modeling of NOx emis-
nual NOx emissions in India 2015 derived with the top-down        sions has not been sufficiently incorporated into the SNA and
method were 7 %–60 % smaller than various bottom-up es-           O3 analyses with the AQM in China.
timates (Jena et al., 2014). With the TVCDs from OMI and             Located in eastern China, the Yangtze River Delta (YRD)
another instrument (Global Ozone Monitoring Experiment,           region, including the city of Shanghai and the provinces of
GOME), the difference in national NOx emissions for China         Anhui, Jiangsu, and Zhejiang, is one of the most developed
was quantified to be 0.4 Tg N/yr (5.8 % relative to OMI) at       and heavy-polluted regions in the country. The air quality for
the resolution of 70 km × 70 km (Gu et al., 2014). Compared       most cities in the YRD failed to meet the National Ambi-

Atmos. Chem. Phys., 21, 1191–1209, 2021                                             https://doi.org/10.5194/acp-21-1191-2021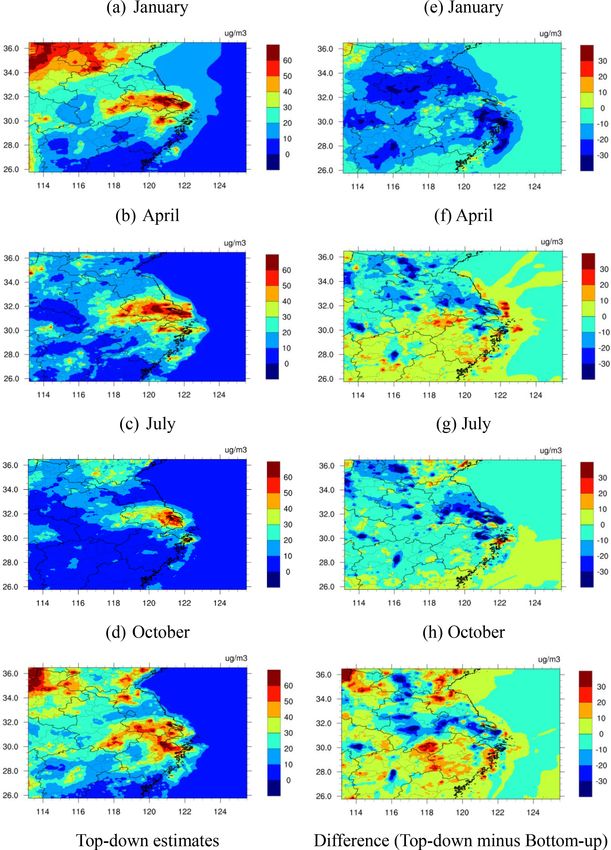
Y. Yang et al.: Improvement of satellite-derived NOx emissions in YRD                                                     1193

ent Air Quality Standard (NAAQS) Class II in 2016 (MEP-          emission inventory, instead of those from satellite observa-
PRC, 2017). NOx emissions made great contributions to the        tions. We found that sufficient iteration times could result in
severe air pollution in the region. Based on an offline sam-     a relatively constant emission estimate (the top-down esti-
pling and measurement study, for example, the annual aver-       mate) close to the “true” emission input. From a bottom-up
age of the NO−  3 mass fraction to total PM2.5 reached 19 %      perspective, the difference in NOx emissions between week-
in Shanghai in 2014, and it was significantly elevated in the    days and the weekend was within 5 % in the YRD region
pollution event periods (Ming et al., 2017). In this study,      (Zhou et al., 2017), indicating an insignificant bias from the
we chose the YRD to estimate the NOx emissions with the          ignorance of the daily variation of emissions.
inversed method and to explore their influence on the air           The NO2 TVCDs were from OMI on board the Aura satel-
quality modeling. The top-down estimates of NOx emissions        lite. It crosses the Equator at 13:30 local time. The horizon-
were firstly obtained with the nonlinear inversed method and     tal resolution of OMI was 24 km × 13 km at nadir (Levelt et
OMI-derived NO2 TVCDs for 2016. The advantage of the             al., 2006), one of the finest resolutions available for NO2
top-down estimation against the bottom-up one was then           TVCD observations before October 2017. We applied the
evaluated with the AQM and abundant ground-based NO2             Peking University Ozone Monitoring Instrument NO2 prod-
concentrations. The influences of the top-down estimation in     uct (POMINO v1; Lin et al., 2014, 2015) to constrain the
NOx emissions were further detected on O3 and SNA mod-           NOx emissions. POMINO v1 modified the retrieval method-
eling. Sensitivity analyses were conducted by changing the       ology of the Dutch Ozone Monitoring Instrument NO2 prod-
emissions of precursors to investigate the sources and po-       uct (DOMINO v2) in China and provided better linear cor-
tential control approaches of O3 and SNA pollution for the       relation of NO2 TVCDs between the satellite and avail-
region.                                                          able ground-based observations using multi-axis differential
                                                                 optical absorption spectroscopy (MAX-DOAS) (Lin et al.,
                                                                 2015). The original NO2 TVCDs from POMINO v1 (level 2)
2     Data and methods                                           were resampled into an 18 km × 18 km grid system based on
                                                                 the area weight method and then downscaled to 9 km × 9 km
2.1    The top-down estimation of NOx emissions
                                                                 with Kriging interpolation. As an example, the NO2 TVCDs
The top-down estimation of NOx emissions was conducted           for July 2016 in the YRD are shown in Fig. S1 in the Sup-
for January, April, July, and October of 2016, representing      plement, and larger TVCDs were found in the east–central
the situations of the four seasons in the YRD region, and the    YRD.
horizontal resolution was 9 km ×9 km. The inversed method
assumed a nonlinear and variable correlation between NOx         2.2   Model configuration
emissions and NO2 TVCDs (Cooper et al., 2017), and the a
posterior daily emissions (top-down estimates) were calcu-       The Models-3 Community Multi-scale Air Quality (CMAQ)
lated with the following equation:                               version 5.1 was used to conduct the inversed modeling of
                                                                 NOx emission estimation and to simulate the ground-level
                                                                 concentrations of NO2 , O3 , and SNA. As a three-dimensional

                o − a
Et = Ea 1 +              β ,                              (1)    Eulerian model, CMAQ includes complex interactions of at-
                   o
                                                                 mospheric chemistry and physics and is one of the most
where Et and Ea represent the a posterior and the a prior        widely applied AQMs to evaluate the sources and processes
daily NOx emissions, respectively; o and a represent the       of air pollution in China (UNC, 2012; Xing et al., 2015;
observed and simulated NO2 TVCDs, respectively; β repre-         Zheng et al., 2017). As shown in Fig. 1, the two nested
sents the response coefficient of the simulated NO2 TVCDs        modeling domains were applied with their horizontal resolu-
to a specific change in emissions and was calculated based on    tions set to 27 km and 9 km, respectively. The mother domain
the simulated changes in TVCDs (1) from a 10 % change           (D1, 177 cells × 127 cells) included most parts of China, and
in emissions (1E).                                               the second (D2, 118 × 121 cells) covered the YRD region.
   The inversed method assumed that the daily emissions          The model included 28 vertical layers, and the height of the
were similar. For a given month, the a posterior daily emis-     first layer (ground layer) was approximately 60 m. The car-
sions were used as the a priori emissions of the next day, and   bon bond gas-phase mechanism (CB05) and AERO6 aerosol
the monthly top-down estimate of the NOx emissions was           module were used in the CMAQ. The initial concentrations
scaled from the average of the a posterior daily emissions of    and boundary conditions for the D1 were derived from the
the last 3 d in the month, as the top-down estimate of daily     default clean profile, while those of D2 were extracted from
NOx emissions usually converged within a 1-month simula-         the CMAQ Chemistry Transport Model (CCTM) outputs of
tion period (Zhao and Wang, 2009; Yang et al., 2019b). In our    its mother domain. The first 5 d of each simulated month
previous work (Yang et al., 2019b), we demonstrated the ro-      were chosen as the spin-up period. Details on model con-
bustness of the method, by applying the “synthetic” TVCDs        figuration were described in Zhou et al. (2017) and Yang and
from air quality simulation based on a hypothetical “true”       Zhao (2019).

https://doi.org/10.5194/acp-21-1191-2021                                          Atmos. Chem. Phys., 21, 1191–1209, 2021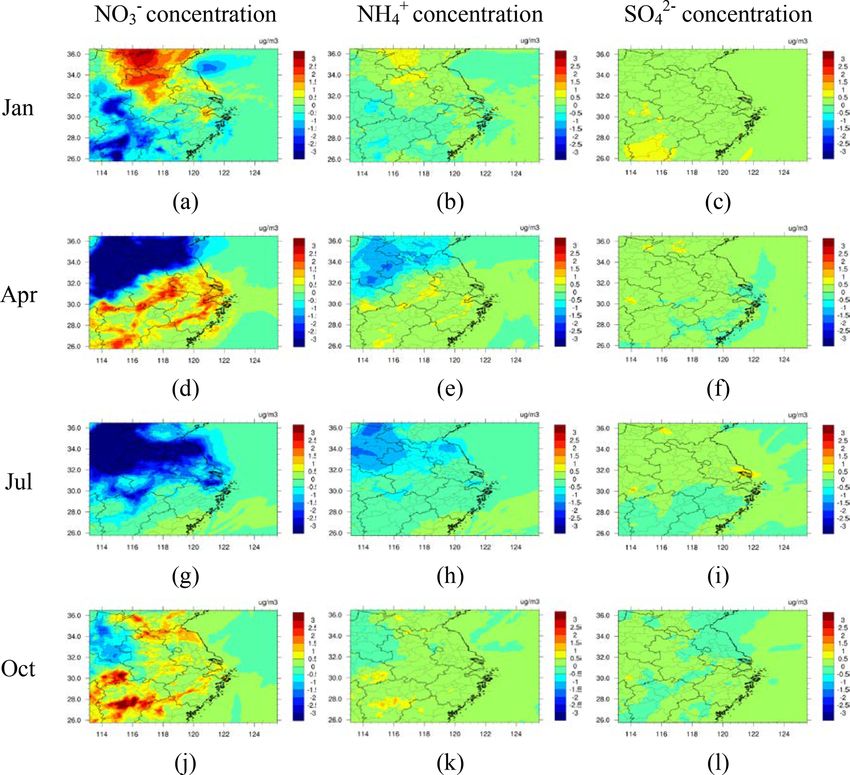
1194                                                   Y. Yang et al.: Improvement of satellite-derived NOx emissions in YRD

                                                                        Meteorological fields were provided by the Weather Re-
                                                                     search and Forecasting (WRF) model version 3.4, a state-
                                                                     of-the-art atmospheric modeling system designed for both
                                                                     numerical weather prediction and meteorological research
                                                                     (Skamarock et al., 2008). The simulated parameters from
                                                                     WRF for D2 in January, April, July, and October 2016 were
                                                                     compared with the observation dataset of the US National
                                                                     Climate Data Center (NCDC), as summarized in Table S1
                                                                     in the Supplement. The index of agreement (IOA) of wind
                                                                     speed for the 4 months between the two datasets was larger
                                                                     than 0.8. The root mean square error (RMSE) of wind direc-
                                                                     tions for the 4 months was smaller than 40◦ , and the index
                                                                     of agreement (IOA) of temperature and relative humidity be-
                                                                     tween the two datasets was larger than 0.8 and 0.7, respec-
                                                                     tively. The simulated meteorological parameters in D2 could
                                                                     reach the benchmarks derived from Emery et al. (2001) and
                                                                     Jiménez et al. (2006).
                                                                        The hourly NO2 and O3 concentrations were observed
                                                                     at 230 state-operated stations of air quality monitoring in
                                                                     41 cities within the YRD region, and they were applied to
                                                                     evaluate the model performance. Locations of the stations
                                                                     are indicated in Fig. 1, and the observation data were de-
                                                                     rived from the China National Environmental Monitoring
                                                                     Center (CNEMC; http://www.cnemc.cn/, last access: 20 Jan-
                                                                     uary 2020). The observations of SO2−             −
                                                                                                             4 , NO3 , and NH4
                                                                                                                                   +

                                                                     (SNA) concentrations in PM2.5 for the YRD region during
                                                                     2015–2017 were collected and applied to evaluate the in-
                                                                     fluence of the top-down estimation of NOx emissions on
                                                                     SNA simulation. In particular, the hourly SNA concentra-
Figure 1. The modeling domain and locations of meteorological        tions of PM2.5 at the Jiangsu Provincial Academy of Envi-
and air quality monitoring sites. The map data provided by the       ronmental Science, an urban site in the capital city of Jiangsu
Resource and Environment Data Cloud Platform are freely avail-       Province, Nanjing (JSPAES; Chen et al., 2019b), were ob-
able for academic use (http://www.resdc.cn/data.aspx?DATAID=
                                                                     served with the Monitor for Aerosols and Gases in ambi-
201, last access: 20 January 2020). © Institute of Geographic Sci-
ences & Natural Resources Research, Chinese Academy of Sci-
                                                                     ent Air (MARGA; Metrohm, Switzerland) for January, April,
ences.                                                               July, and October 2016. Meanwhile, the daily average con-
                                                                     centrations of SNA were also available from MARGA mea-
                                                                     surement for the 4 months at the Station for Observing Re-
   The Multi-resolution Emission Inventory for China                 gional Processes and the Earth System, a suburban site in
(MEIC; http://www.meicmodel.org/, last access: 20 Jan-               eastern Nanjing (SORPES; Ding et al., 2019). In addition,
uary 2020) for 2015 was applied as the initial input of anthro-      the seasonal average concentrations of SNA were available
pogenic emissions in D1 and D2, with an original horizontal          at another four sites in the YRD, including the Nanjing Uni-
resolution of 0.1◦ × 0.1◦ . In this study, the MEIC emissions        versity of Information Science & Technology site in Nanjing
from residential sources were downscaled to the horizontal           (NUIST; Zhang, 2017), and three sites respectively in the
resolution of 9 km × 9 km, based on the spatial density of           cities of Hangzhou (HZS; Li, 2018), Changzhou (CZS; Liu et
population, and those from power, industry, and transporta-          al., 2018), and Suzhou (SZS; Wang et al., 2016). Details of
tion based on the spatial distribution of gross domestic prod-       the collected SNA measurement studies are summarized in
uct (GDP). The NOx emissions from soil were originally ob-           Table S2 in the Supplement, and the locations of those sites
tained from Yienger and Levy (1995) and were doubled as              are illustrated in Fig. 1.
advised by Zhao and Wang (2009). The emissions of Cl, HCl,
and lightning NOx were collected from the Global Emissions           2.3   Scenario setting of sensitivity analysis
Initiative (GEIA; Price et al., 1997). Biogenic emissions were
derived from the Model Emissions of Gases and Aerosols               In general, there are two categories of chemical regimes
from Nature developed under the Monitoring Atmospheric               (VOC-limited and NOx -limited) in O3 formation (Wang et
Composition and Climate project (MEGAN MACC; Sinde-                  al., 2010; Jin et al., 2017). In the VOC-limited regime,
larova et al., 2014).                                                growth in O3 concentrations occurs with increased VOC

Atmos. Chem. Phys., 21, 1191–1209, 2021                                               https://doi.org/10.5194/acp-21-1191-2021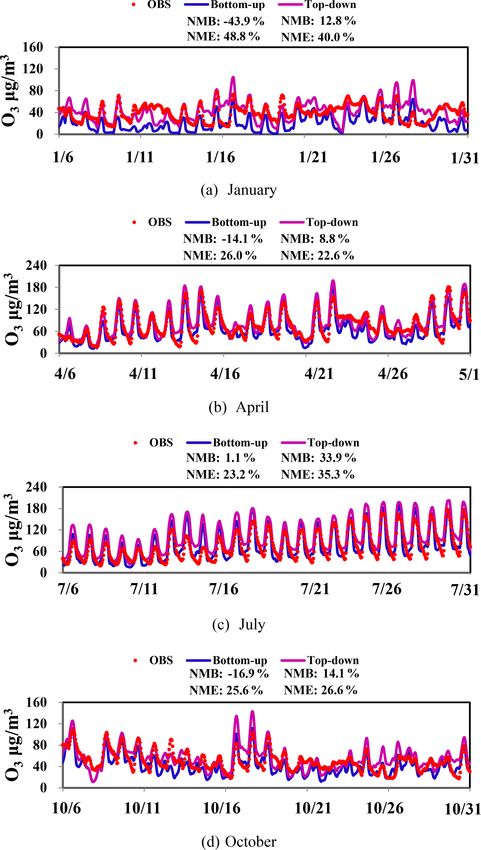
Y. Yang et al.: Improvement of satellite-derived NOx emissions in YRD 1195
3 Results and discussion
3.1 Evaluation of the bottom-up and top-down
estimates of NOx emissions
Figure 2 compares the magnitude of the NOx emissions esti-
mated based on the bottom-up (MEIC) and top-down meth-
ods by month in the YRD region. The top-down estimates
were smaller than the bottom-up ones for all the 4 months
concerned, and the average of the monthly NOx emissions
Figure 2. The bottom-up and top-down estimates of NOx emissions was calculated to be 260.0 Gg/month for 2016 with the
by month for the YRD region in 2016.
top-down method, 24 % smaller than the bottom-up estima-
tion. The comparison indicates a probable overestimation in
NOx emissions with the current bottom-up methodology, at-
emissions and declined NOx emissions, while the increased
tributed partly to the insufficient consideration of the effect
NOx emissions result in enhancement of O3 concentrations
of recent control on emission abatement. Stringent measures
in the NOx -limited regime. To explore the sources and poten-
have gradually been conducted to improve the local air qual-
tial control approaches of O3 pollution, the sensitivity of O3
ity in the YRD region. For example, the “ultra-low” emis-
formation to its precursor emissions for April was analyzed
sion policy for the power sector started in 2015, requiring
with CMAQ modeling in the YRD region. In the YRD, the
the NOx concentration in the flue gas of coal-fired units to
peaking time of O3 concentration has gradually moved from
be the same as that of gas-fired units. Technology retrofitting
summer to late spring, and the mean observed O3 concen-
on power units has been widely conducted, significantly im-
tration in April was 72.5 µg/m3 , slightly higher than that in
proving the NOx removal efficiencies of selective catalytic
July (71.9 µg/m3 ). In addition, the model performance of O3
reduction (SCR) systems. These detailed changes in emis-
was better for April than that for July in this work (see de-
sion control, however, could not be fully incorporated in a
tails in Sect. 3.2). Therefore, we selected April to explore the
timely manner into the national emission inventory that re-
sensitivity analysis of O3 formation in the region. As sum-
lies more on the routinely reported information and policy of
marized in Table S3 in the Supplement, eight cases were set
environmental management over the country. With the online
besides the base scenario with the top-down NOx estimates
data from continuous emission monitoring systems (CEMS)
for April 2016. Cases 1 and 6 reduced only the NOx emis-
incorporated, NOx emissions from the power sector were es-
sions by 30 % and 60 %, and Cases 2 and 7 reduced only the
timated to be 53 % smaller than MEIC for China in 2015 in
VOC emissions by 30 % and 60 %, respectively. To explore
our previous work (Zhang et al., 2019). The bias between
the co-effect of VOCs and NOx emission controls on O3 con-
the top-down and bottom-up estimates could be larger in ear-
centrations, cases with different reduction rates of VOCs and
lier years and reduced more recently. According to Yang et
NOx emissions were designed. The emissions of NOx and
al. (2019b) and Qu et al. (2017), for example, the top-down
VOCs in Case 4 were decreased by 30 % and 60 % and in
NOx emissions were 44 % and 31 % smaller than bottom-up
Case 5 by 60 % and 30 %, respectively. Both NOx and VOC
ones for the YRD region and the whole of China in 2012.
emissions were reduced 30 % and 60 % in Cases 3 and 8, re-
Benefiting from the better data availability, the bottom-up in-
spectively.
ventory has been improved with the inclusion of more infor-
The response of SNA concentrations to the changes in pre-
mation on individual power and industrial plants for recent
cursor emissions was influenced by various factors includ-
years (Zheng et al., 2018).
ing the abundance of NH3 , atmospheric oxidation, and the
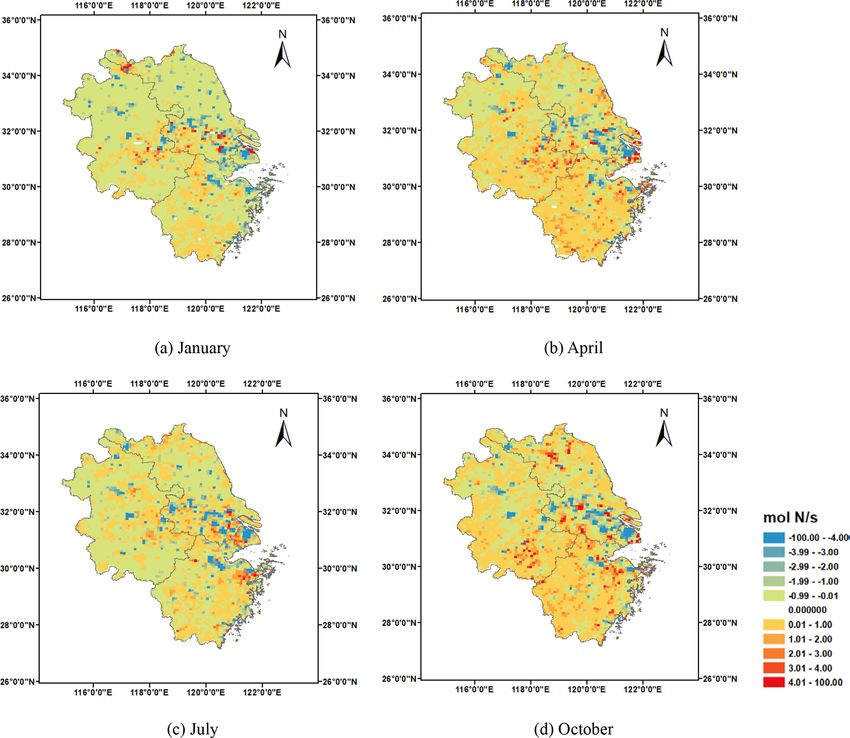
The differences in the spatial distribution of NOx emis-
chemical regime of O3 formation (Wang et al., 2013; Cheng
sions between the bottom-up and top-down estimates are il-
et al., 2016; Zhao et al., 2020). To explore the sensitivity of
lustrated by month for the YRD in Fig. 3. The top-down es-
SNA formation to its precursor emissions, four cases were
timates were commonly smaller than the bottom-up ones in
set besides the base scenario for January 2016, the month
the east–central YRD, with intensive manufacturing industry
with the largest observed SNA concentrations. As shown in
and high population, and larger than those in most of Zhe-
Table S4 in the Supplement, the emissions of NOx , SO2 , and
jiang Province, with more hilly and suburban regions. The
NH3 were reduced by 30 % in Cases 9–11, respectively, and
bias might result from the following issues. From a bottom-
the emissions of NOx , SO2 , and NH3 were simultaneously
up perspective, on the one hand, more stringent control mea-
decreased by 30 % in Case 12.
sures were preferentially conducted for power and industrial
plants in regions with heavier air pollution like the east–
central YRD. As mentioned above, the effects of such ac-
tions were difficult to fully track in the bottom-up inventory,
leading to the overestimation of emissions for those regions.
https://doi.org/10.5194/acp-21-1191-2021 Atmos. Chem. Phys., 21, 1191–1209, 2021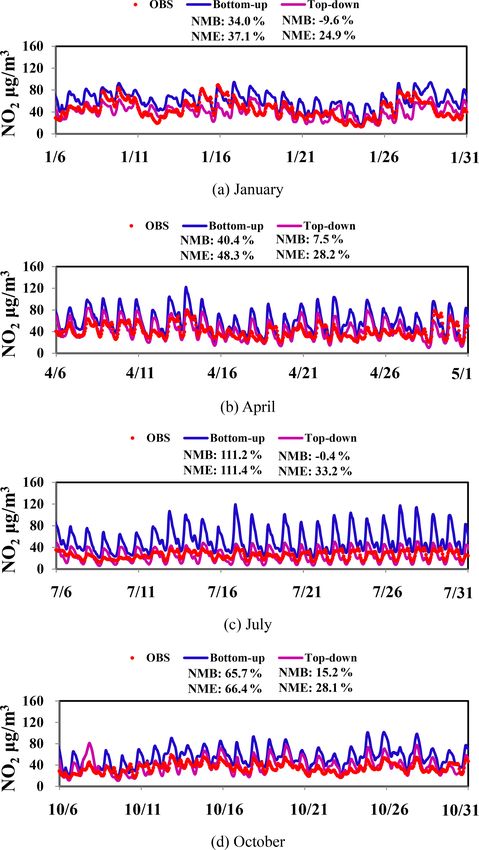
1196                                                 Y. Yang et al.: Improvement of satellite-derived NOx emissions in YRD

Figure 3. The spatial differences between the bottom-up and top-down estimates of NOx emissions for January, April, July, and October
2016 (top-down minus bottom-up, in units of mol N/s).

Due to the lack of precise locations of individual industrial        satellite retrieval, and thereby emissions constrained with the
plants (except for large point sources), moreover, the spatial       inversed modeling, was expected.
allocation of the emissions relied commonly on the densi-               Figure 4 illustrates the observed and simulated hourly NO2
ties of population and economy, assuming a strong correla-           concentrations using the bottom-up and top-down estimates
tion with emissions for them. Such an assumption, however,           of NOx emissions in the CMAQ by month. The NO2 concen-
would not still hold in recent years, as a number of facto-          trations simulated with the bottom-up estimates were clearly
ries in the relatively developed region have been moved to           larger than the observations in all the 4 months concerned,
less developed suburban regions (e.g., southern Zhejiang) for        with the largest and smallest normalized mean bias (NMB)
both environmental and economic purposes. The insufficient           reaching 111 % and 34 % for July and January, respectively.
consideration of the moving of emission sources is thus ex-          The result suggests again the overestimation in NOx emis-
pected to result in the overestimation of emissions for devel-       sions in the current bottom-up inventory for the YRD. The
oped regions and underestimation for the less developed. On          model performance based on the top-down estimates was
the other hand, the satellite-derived TVCDs were relatively          much better than that based on the bottom-up ones, indicat-
small in southern Zhejiang (Fig. S1), and a larger error in the      ing that the inversed modeling with the satellite observation

Atmos. Chem. Phys., 21, 1191–1209, 2021                                                https://doi.org/10.5194/acp-21-1191-2021
Y. Yang et al.: Improvement of satellite-derived NOx emissions in YRD                                                       1197

                                                                  ence in the two slopes implies that the surface NO2 concen-
                                                                  trations simulated with the bottom-up estimation were over
                                                                  50 % larger than those based on top-down ones. As a com-
                                                                  parison, the total emissions in the bottom-up inventory were
                                                                  only 30 % larger than the top-down estimation for the whole
                                                                  YRD region. The larger overestimation in the concentrations
                                                                  than the emissions from the bottom-up inventory could re-
                                                                  sult partly from the bias of the locations of state-operated
                                                                  ground observation sites. Most of these sites were located in
                                                                  the urban areas where excess emissions were allocated ac-
                                                                  cording to the high density of economy and population, and
                                                                  elevated concentrations were thus simulated compared to ru-
                                                                  ral areas. The similar correlation coefficients (R) suggested
                                                                  that the spatial distribution of NOx emissions was not greatly
                                                                  improved in the top-down estimation on an annual basis of
                                                                  urban observations. Uncertainty existed in the satellite ob-
                                                                  servations: the NMB between NO2 TVCDs in POMINO and
                                                                  available ground-based MAX-DOAS observations was 21 %
                                                                  on cloud-free days (Liu et al., 2019). Due mainly to the NOx
                                                                  transport, moreover, a bias of 13 %–33 % on the spatial distri-
                                                                  bution of emissions was estimated for the inversed method at
                                                                  the horizontal resolution of 9 km or finer (Yang et al., 2019b).
                                                                  Inclusion of more available observations in rural areas helps
                                                                  improve the comprehensive evaluation of emission estima-
                                                                  tion.
                                                                     Figure 5 illustrates the spatial distribution of monthly
                                                                  mean NO2 concentrations simulated based on the top-down
                                                                  estimates and the differences between the simulations with
                                                                  the top-down and bottom-up ones. The larger NO2 concen-
                                                                  trations existed in the east–central YRD for all the months
                                                                  (left column in Fig. 5), and the difference in the spatial
                                                                  distribution of NO2 concentrations (right column in Fig. 5)
                                                                  was similar to that in NOx emissions (Fig. 3). Larger reduc-
                                                                  tion in NO2 concentrations based on the top-down estimates
                                                                  was commonly found in the east–central YRD, while the in-
                                                                  creased concentrations were found in most of Zhejiang.
Figure 4. The observed and simulated hourly NO2 concentrations
based on the bottom-up and top-down NOx emissions for January,    3.2   Evaluation of the O3 simulation based on the
April, July, and October 2016.                                          top-down NOx estimates

                                                                  Figure 6 shows the observed and simulated hourly O3 con-
constraint effectively improved the estimation of NOx emis-       centrations based on the bottom-up and top-down estimates
sions. The biggest improvement was found for July, with the       of NOx emissions by month. Indicated by the smaller NMBs
NMB reduced from 111 % to −0.4 % and the NME reduced              and NMEs, the model performance of O3 based on the top-
from 111 % to 33 %. As shown in Fig. 2, a relatively big re-      down estimates was better than that based on the bottom-up
duction from the bottom-up to top-down estimation in NOx          ones for most months. It suggests that the constrained NOx
emissions was found for July compared to most of the other        emissions with satellite observations could play an impor-
months.                                                           tant role in the improvement of O3 simulation. The largest
   Scatter plots of the annual means of the observed and sim-     improvement was found in January, for which the NMB and
ulated surface NO2 concentrations are shown in Fig. S2 in the     NME were changed from −44 % and 49 % to 13 % and 40 %,
Supplement. The slope between the observations and simula-        respectively, attributed to the biggest change in NOx emis-
tion with the top-down estimate (0.99) was much closer to 1       sions between the top-down and bottom-up estimates for
than that with the bottom-up one (1.57), indicating clearly the   the month. The worse O3 modeling performance was found
advantage of the top-down method for constraining the mag-        for July when the top-down estimate instead of the bottom-
nitude of the total emissions in the YRD region. The differ-      up one was applied in the simulation, indicated by the in-

https://doi.org/10.5194/acp-21-1191-2021                                           Atmos. Chem. Phys., 21, 1191–1209, 2021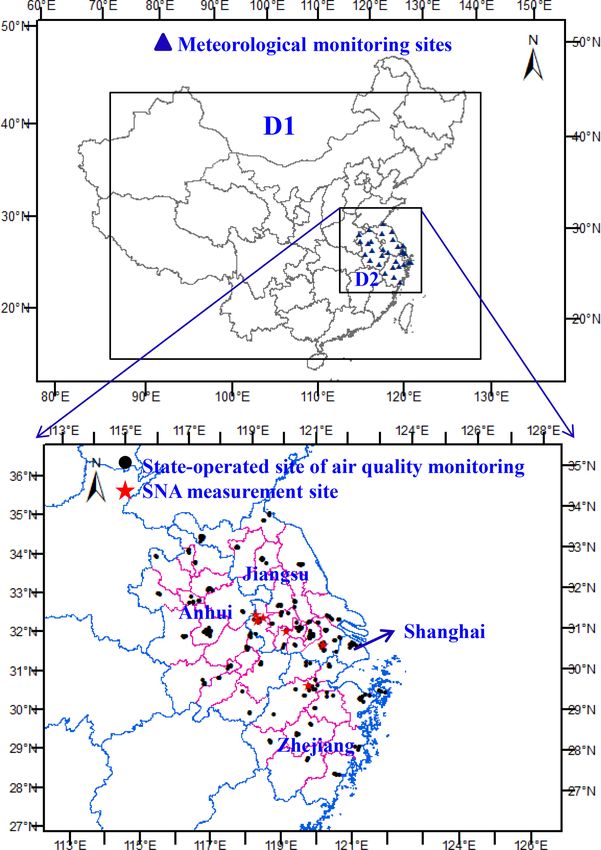
1198                                                 Y. Yang et al.: Improvement of satellite-derived NOx emissions in YRD

Figure 5. The spatial distribution of the simulated monthly mean NO2 concentration with the top-down estimates and differences between
the simulations with the top-down and bottom-up NOx emissions in January, April, July, and October 2016 (top-down minus bottom-up).

Atmos. Chem. Phys., 21, 1191–1209, 2021                                                https://doi.org/10.5194/acp-21-1191-2021
Y. Yang et al.: Improvement of satellite-derived NOx emissions in YRD                                                         1199

                                                                  Table 1. The model performance statistics of daily maximum 8 h
                                                                  averaged (MDA8) O3 concentrations in January, April, July, and
                                                                  October 2016 with the bottom-up and top-down NOx emissions.

                                                                   Month     Emission    Observed    Simulated      NMB      NME
                                                                             input        (µg/m3 )     (µg/m3 )
                                                                   January   Bottom-up       50.6         33.0    −34.8 %   38.6 %
                                                                             Top-down                     56.3     11.3 %   27.7 %
                                                                   April     Bottom-up      101.5         87.2    −14.1 %   20.2 %
                                                                             Top-down                    108.5      6.9 %   16.1 %
                                                                   July      Bottom-up      107.4        117.3      9.2 %   15.7 %
                                                                             Top-down                    140.7     31.0 %   31.0 %
                                                                   October   Bottom-up       65.9         53.9    −18.3 %   23.2 %
                                                                             Top-down                     73.4     11.3 %   21.7 %

                                                                  O3 based on the top-down estimate of NOx emissions and the
                                                                  reduced BVOC emissions declined 27 % in July. However, it
                                                                  was still larger than the NMB at 1.1 % when the bottom-up
                                                                  estimate of NOx emissions was applied (Fig. 4c). This com-
                                                                  parison thus suggested that the complicated mechanism for
                                                                  summer O3 formation was insufficiently considered in the
                                                                  current model. A recent study conducted an intercompari-
                                                                  son of surface-level O3 simulation from 14 state-of-the-art
                                                                  chemical transport models and implied that the larger overes-
                                                                  timation of summer O3 than winter for eastern China resulted
                                                                  possibly from the uncertainty in the photochemical treatment
                                                                  in models (Li et al., 2019).
                                                                      Table 1 summarizes the observed and simulated daily
                                                                  maximum 8 h averaged (MDA8) O3 concentrations based on
                                                                  the bottom-up and top-down estimates of NOx emissions and
                                                                  summarized by month for the YRD region. The MDA8 O3
                                                                  concentrations simulated with the top-down estimates were
                                                                  larger than those with the bottom-up ones and were closer
                                                                  to the observations for most months. As most of the YRD
Figure 6. The observed and simulated hourly O3 concentrations     was identified as a VOC-limited region (Li et al., 2012; Zhou
with the bottom-up and top-down NOx emission estimates for Jan-   et al., 2017), the reduced NOx emissions with the top-down
uary, April, July, and October 2016.
                                                                  method enhanced the O3 levels in the AQM. Similar to the
                                                                  hourly concentrations, the most significant improvement for
                                                                  MDA8 was found in January, with the NMB and NME re-
creased NMB and NME. Since the top-down estimation of             duced from −35 % and 39 % to 11 % and 28 %, respectively.
NOx emissions was justified by the improved NO2 simula-           Moreover, the improvement of April and October for MDA8
tion in July (Fig. 4c), the worse O3 simulation might result      was larger than that for the hourly concentrations, indicating
from the uncertainty in emissions of the volatile organic com-    that the improved NOx emissions were more beneficial for
pounds (VOCs) and the chemical mechanism of the AQM               the simulation of daytime peak O3 concentrations in spring
in summer. As suggested by Li (2019), the biogenic VOC            and winter. Figure 7 illustrates the spatial distribution of the
(BVOC) emissions of the YRD region could be overesti-             monthly mean O3 concentrations simulated based on the top-
mated by 121 % in summer attributed to ignoring the effect        down NOx estimates and the differences between the simula-
of droughts, and such overestimation might elevate the O3         tions with the top-down and bottom-up estimates by month.
concentrations in the AQM. In order to explore the influence      In contrast to NO2 , the smaller O3 concentrations existed
of the uncertainty of BVOC emissions on O3 model perfor-          in the east–central YRD for most months, as it was iden-
mance, we conducted an extra case in which the BVOC emis-         tified as a VOC-limited region with a relatively high NO2
sions were cut by 50 % in CMAQ. As shown in Fig. S3 in the        level (Wang et al., 2019). Larger O3 concentrations were
Supplement, the NMB between the observed and simulated            found for the surrounding regions in the YRD, e.g., southern

https://doi.org/10.5194/acp-21-1191-2021                                           Atmos. Chem. Phys., 21, 1191–1209, 2021
1200 Y. Yang et al.: Improvement of satellite-derived NOx emissions in YRD Figure 7. The spatial distribution of the simulated monthly mean O3 concentration with the top-down NOx estimates and the spatial differ- ences between the simulations with the top-down and bottom-up NOx emissions in January, April, July, and October 2016 (top-down minus bottom-up). Atmos. Chem. Phys., 21, 1191–1209, 2021 https://doi.org/10.5194/acp-21-1191-2021
Y. Yang et al.: Improvement of satellite-derived NOx emissions in YRD                                                         1201

Zhejiang, attributed partly to the relatively abundant BVOC       the promoted NH+     4 formation. In summer, however, the sig-
emissions (Li, 2019). An exception existed for July, with         nificant drop in the simulated NO2 concentration was as-
clearly larger O3 concentrations in the east–central YRD.         sumed to reduce the NO−                +
                                                                                              3 and NH4 formation and to weaken
With the largest population density and the most developed        the consistency between the simulated and observed NH+          4.
economy in the YRD, the area contains a large number of           The difference between the simulated SO2−      4  with the bottom-
chemical industrial plants and solvent storage, transportation,   up and top-down NOx emission estimates was small for most
and usage (Zhao et al., 2017). High temperature in summer         seasons, implying a limited benefit of improved NOx emis-
promoted the volatilization of chemical products and solvent      sions on SO2− 4 modeling. Besides emission data, the chem-
and thereby enhanced the seasonal VOC emissions more sig-         ical mechanisms included in the model should be important
nificantly compared to other less developed YRD regions.          for the model performance. For example, adding SO2 het-
Moreover, the lowest NO2 concentration found in summer            erogeneous oxidation in the model could largely improve the
helped increase the O3 concentration for the region (Gu et al.,   sulfate simulation in Nanjing (Sha et al., 2019).
2020). Regarding the simulation difference with two emis-            Figure 8 shows the differences in the spatial distribution of
sion estimates, application of the top-down estimates instead     SNA concentrations simulated with the bottom-up and top-
of the bottom-up ones elevated the O3 concentrations in most      down estimates of NOx emissions by month. In most of the
of the YRD region. In particular, the big reduction in NOx        region, the differences of NO−      3 concentrations were larger
emissions for the east–central YRD (Fig. 3) was expected to                           +          2−
                                                                  than those of NH4 and SO4 for all seasons, and they were
be responsible for the evident growth in O3 concentrations.       mainly controlled by the changed ambient NO2 or O3 level.
As the east–central YRD was identified as a VOC-limited re-       The difference in spatial pattern of NO−     3 was similar to that
gion in terms of O3 formation, the O3 concentration in the        of O3 for January, and the larger growth attributed to the
region would be elevated along with the reduced NOx emis-         application of the top-down estimates was found in north-
sions, reflecting the negative effect of NOx control on O3        ern Anhui and eastern Zhejiang (Fig. 8a). The result implies
pollution alleviation (Wang et al., 2019).                        that the change in NO−     3 concentration in winter could re-
                                                                  sult partly from the improved O3 simulation; i.e., the elevated
3.3   Evaluation of SNA simulation based on the                   O3 was an important reason for the enhanced formation of
      top-down NOx estimates                                      SNA in winter (Huang et al., 2020). Similarly, the increased
                                                                  NO− 3 was found for more than half of the YRD region in
Shown in Table 2 is the comparison between the observed           April, along with the growth of O3 concentrations (Fig. 8d).
and simulated SNA (SO2−         −           +
                         4 , NO3 , and NH4 ) concentrations       For July, however, the difference in spatial pattern of NO−      3
by season. Larger observed and simulated SNA concentra-           (Fig. 8g) was similar to NO2 (Fig. 5g), and the larger reduc-
tions were found in winter and spring, and smaller concentra-     tion attributed to the application of the top-down estimates
tions were found in summer and autumn. For most seasons,          was found in the northern YRD. The result suggests that
the simulations of NO− 3 concentrations were moderately im-       the declining NOx emissions and thereby NO2 concentration
proved with the top-down estimates of NOx emissions for           dominated the reduced NO−      3 formation in summer. This was
all the YRD cities concerned, with an exception of Nanjing        mainly because the reduction of the top-down NOx emission
in autumn. The largest improvement was found in summer,           estimate from the bottom-up emission inventory was much
with the mean bias between the simulation and observations        larger for July compared to spring or autumn (Fig. 2). In
reduced 35 % for all the cities involved. Compared to the         addition, the VOC-limited mechanism in O3 formation was
bottom-up inventory, the commonly smaller NOx emissions           found to be weaker in summer than winter (see Fig. 7e and
in the top-down estimates limited the NO2 concentration and       g), resulting in less O3 formation and thereby nitrate aerosol
suppressed the formation of NO−   3 , while the enhanced O3       through oxidation. In October, the growth in NO−        3 concen-
from the reduced NOx emissions promoted it (Cai et al.,           trations was found again in most of the YRD when the top-
2017; Huang et al., 2020). In summer, the former dominated        down estimates were applied (Fig. 8j). The growth in the
the process, with the most evident improvement in NO2 sim-        north resulted mainly from the increased O3 level, while that
ulation (Fig. 4); thus the reduced NO−  3 concentrations that     in the south was associated with the increased NO2 . The dif-
were closer to observations were simulated for all the cities.    ferences in spatial patterns of simulated NH+     4 concentrations
   The simulations with both top-down and bottom-up esti-         were similar to those of NO−         for the 4 months,  suggesting
                                                                                                   3
mates of NOx emissions underestimated the NH+     4 concentra-    that the change in NH+       was   associated  with formation  and
                                                                                            4
tions for most cases, and such underestimation was slightly       decomposition of NH4 NO3 . However, the changes of spatial
corrected with the application of the top-down estimates ex-      distribution of SO2−  4 were similar to those of O3 concentra-
cept for summer. The average change in NH+   4 concentrations     tion. Since NH4 was preferred to react with SO2−
                                                                                   +
                                                                                                                       4 rather than
was 2.3 %, much smaller than that of NO−   at 14 %. The mod-                                                          2−
erate improvement in NH+    simulation
                                         3
                                        with the reduced NOx      NO− 3  (Wang   et al., 2013), the formation   of SO 4 was mainly
                          4
emissions in the top-down estimates resulted partly from the      influenced by the atmospheric oxidizing capacity when only
enhancement of the simulated O3 concentrations and thereby        NOx emissions were changed.

https://doi.org/10.5194/acp-21-1191-2021                                           Atmos. Chem. Phys., 21, 1191–1209, 2021
1202 Y. Yang et al.: Improvement of satellite-derived NOx emissions in YRD
2−
Table 2. Comparison of observed and simulated NO− + 3
3 , NH4 , and SO4 concentrations by site and season in 2016 (unit: µg/m ). The
information on SNA observation sites is provided in Table S2 in the Supplement. BU and TD indicate the CMAQ modeling with the bottom-
up and top-down estimate of NOx emissions, respectively.
Spring Summer Autumn Winter
NO−
3 NH+
4 SO2−
4 NO−
3 NH+
4 SO2−
4 NO−
3 NH+
4 SO2−
4 NO−
3 NH+
4 SO2−
4
JSPAES 19.1 16.5 12.7 5.7 9.3 10.5 10.3 6.1 9.7 31.1 16.5 20.3
CMAQ (BU) 20.7 8.5 12.0 14.4 6.0 9.1 10.9 5.0 9.0 25.6 9.3 12.8
CMAQ (TD) 22.3 9.0 12.2 11.8 5.4 9.5 11.6 5.2 9.1 26.2 9.4 12.8
SORPES 14.1 8.6 13.2 7.5 6.6 11.5 8.8 5.2 8.3 23.0 13.4 15.7
CMAQ (BU) 18.5 7.3 8.0 12.2 4.3 5.2 9.3 4.0 5.4 23.6 8.7 10.9
CMAQ (TD) 18.0 7.0 7.4 8.3 3.7 5.0 9.8 4.2 5.4 23.6 8.8 10.1
NUIST 16.9 11.0 15.9 6.8 7.1 13.1 N/A N/A N/A 20.9 14.3 16.8
CMAQ (BU) 20.0 7.9 9.9 14.0 5.8 7.5 24.3 9.0 11.3
CMAQ (TD) 21.8 8.5 9.9 11.8 5.3 7.8 24.6 9.1 11.3
HZS 19.9 6.6 19.9 1.9 2.8 6.2 12.7 8.3 13.3 25.3 6.6 19.5
CMAQ (BU) 14.1 5.7 8.8 5.0 1.5 2.1 8.3 3.6 6.5 18.5 6.6 9.1
CMAQ (TD) 16.0 6.3 8.6 3.7 1.3 2.8 9.3 3.9 6.6 19.9 6.8 8.9
CZS N/A N/A N/A 5.1 5.1 10.9 N/A N/A N/A 20.4 11.8 10.9
CMAQ (BU) 11.6 4.9 7.1 23.1 9.1 11.3
CMAQ (TD) 10.7 5.0 7.3 23.1 9.1 11.3
SZS 17.8 10.2 14.7 7.9 8.0 14.9 14.2 9.0 13.1 23.2 12.5 15.1
CMAQ (BU) 14.5 6.0 7.1 13.3 5.3 7.1 6.2 2.9 6.3 19.6 7.8 11.7
CMAQ (TD) 15.5 6.3 7.1 11.7 5.0 7.7 6.9 3.0 6.3 19.9 7.9 11.7
Mean 17.6 10.6 15.3 5.8 6.5 11.2 11.5 7.1 11.1 24.0 12.5 16.4
CMAQ (BU) 17.6 7.1 9.1 11.7 4.6 6.3 8.7 3.9 6.8 22.5 8.4 11.2
CMAQ (TD) 18.7 7.4 9.1 9.7 4.3 6.7 9.4 4.1 6.8 22.9 8.5 11.0
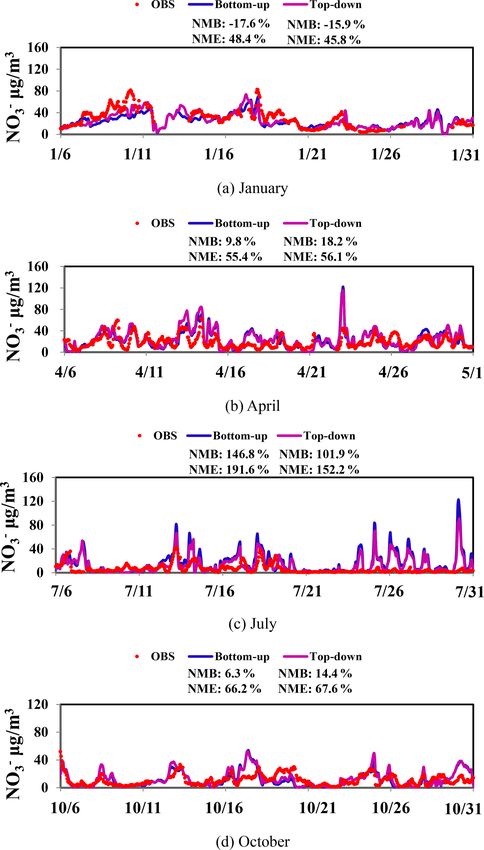
Figure 9 illustrates the observed and simulated hourly shown in Fig. S7 in the Supplement, the SO2 concentra-
NO− 3 concentrations based on the bottom-up and top-down tions were overestimated by 61 % at the site. The results
estimate of NOx emissions by month at JSPAES. The NMBs thus imply a great uncertainty in the gas–particle partitioning
and NMEs for simulation with the top-down emissions were of (NH4 )2 SO4 formation in the model in winter, attributed
smaller than those with bottom-up ones in January and July, probably to the missed oxidation mechanisms of SO2 (Chen
implying the benefit of the improved NOx emissions on et al., 2019c).
hourly NO− 3 concentration simulation in winter and summer.
The best model performance with the top-down estimates 3.4 Sensitivity analysis of O3 and SNA formation in the
was found in January, with the hourly variation commonly YRD region
caught with the AQM. However, the NO− 3 concentration was
seriously overestimated, and the model failed to catch the
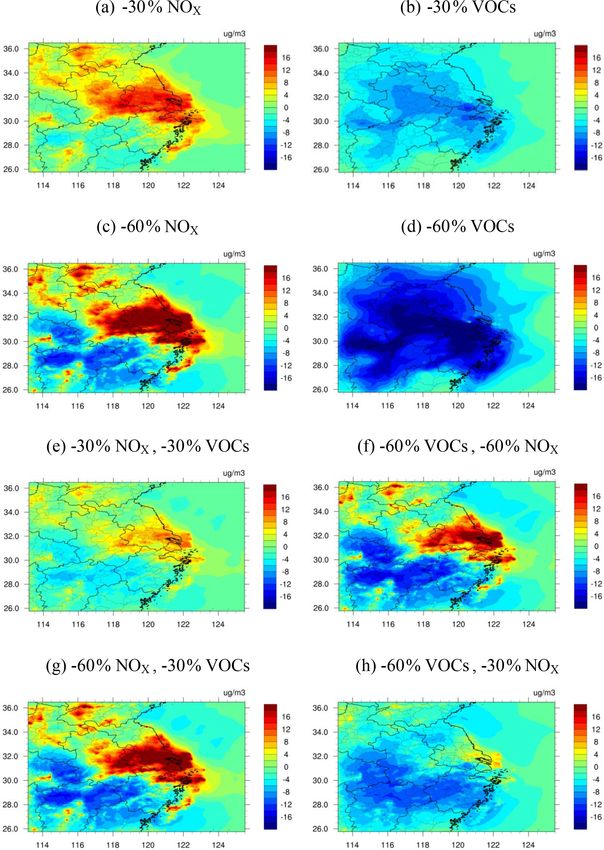
Table 3 summarizes the relative changes in the simulated O3
hourly variations in summer indicated by the large NMB and
concentrations for April 2016 in different cases. The mean
NME. As shown in Fig. S4 in the Supplement, both the NO2
O3 concentration would decline by 8.9 % and 19.5 % with
and O3 concentrations at JSPAES were significantly overesti-
30 % and 60 % VOC emissions off (Cases 2 and 7), while it
mated for July except O3 with the bottom-up NOx emission
would increase by 14.2 % and 23.7 % with 30 % and 60 %
estimate, and this partly explained the elevated NO− 3 level NOx emissions off (Cases 1 and 6), respectively. The result
from the CMAQ simulation.
confirmed the VOC-limited regime of O3 formation in the
Figures S5 and S6 in the Supplement compare the ob-
YRD region: controlling VOC emissions was an effective
served and simulated hourly concentrations at JSPAES by
2− way to alleviate O3 pollution, while reducing NOx emissions
month for NH+ 4 and SO4 , respectively. The NMBs and
+ alone would aggravate O3 pollution.
NMEs for NH4 simulation with the top-down estimates were
The growth of O3 concentrations was also found when the
smaller than those with the bottom-up ones for most months,
reduction rate of NOx emissions was equal to or larger than
while the changes in SO2− 4 concentration were small. The
2−
that of VOCs. The O3 concentration would increase by 7.1 %
NH+ 4 and SO 4 concentrations were largely underestimated and 14.5 % respectively when both NOx and VOC emissions
with the top-down estimates in January, indicated by the were reduced by 30 % and 60 % (Cases 3 and 8), and it would
NMB at −44 % and −38 %, respectively. Meanwhile, as increase by 19.8 % when NOx and VOC emissions were re-
Atmos. Chem. Phys., 21, 1191–1209, 2021 https://doi.org/10.5194/acp-21-1191-2021Y. Yang et al.: Improvement of satellite-derived NOx emissions in YRD 1203
Figure 8. The spatial differences between the simulated SNA concentrations with the bottom-up and top-down NOx emission estimates for
January, April, July, and October 2016 (top-down minus bottom-up).
Table 3. The changed percentages of ozone concentration based on the sensitivity analysis for April 2016.
No reduction −30 % VOC emissions −60 % VOC emissions
No reduction – −8.9 % (Case 2) −19.5 % (Case 7)
−30 % NOx emissions 14.2 % (Case 1) 7.1 % (Case 3) −2.1 % (Case 4)
−60 % NOx emissions 23.7 % (Case 6) 19.8 % (Case 5) 14.5 % (Case 8)
spectively declined by 60 % and 30 % (Case 5). In contrast, be restrained when the reduction rate of VOCs was 2 times
small abatement of O3 concentrations (2.1 %) was achieved that of NOx or more. To control the O3 pollution effectively
from the 30 % and 60 % reduction of emissions respectively and efficiently, therefore, the magnitude of VOC and NOx
for NOx and VOCs (Case 4), implying that the O3 level could emission reduction should be carefully planned and imple-
https://doi.org/10.5194/acp-21-1191-2021 Atmos. Chem. Phys., 21, 1191–1209, 20211204 Y. Yang et al.: Improvement of satellite-derived NOx emissions in YRD
2−
Table 4. The changed percentages of NO− +
3 , NH4 , and SO4 concentrations based on the sensitivity analysis for January 2016.
NO−
3 NH+
4 SO2−
4 SNA
−30 % NOx emissions (Case 9) −3.3 % −1.2 % 3.8 % −1.0 %
−30 % SO2 emissions (Case 10) 2.0 % 0.2 % −2.4 % 0.5 %
−30 % NH3 emissions (Case 11) −16.3 % −14.5 % −0.6 % −11.7 %
−30 % (NOx + NH3 + SO2 ) emissions (Case 12) −15.5 % −15.5 % −4.0 % −12.4 %
are most active in O3 formation (Wei et al., 2014; Zhao et
al., 2017). Moreover, substantial VOC emissions are from
fugitive sources, for which emission control technology can
hardly be effectively applied. Therefore, it is a big challenge
to control O3 pollution by reducing more VOCs than NOx .
Figure 10 illustrates the differences in spatial patterns of
the simulated monthly mean O3 concentrations between the
base and sensitivity cases in April. The O3 concentrations
were expected to decline for the whole YRD region in the
cases of 30 % and 60 % VOC emissions off (Fig. 10b and
d), indicating the VOC-limited regime of O3 formation for
the entire YRD. For other cases, the O3 concentrations were
clearly elevated in the central–eastern YRD with relatively
large population and developed industry, particularly for the
cases with NOx control only (Fig. 10a and c) or relatively
large NOx abatement together with VOC control (Fig. 10f
and g). Even for the case with 60 % of VOC reduction and
30 % of NOx (Fig. 10h), there was still a small increase in O3
concentration in the central–eastern YRD, in contrast to the
slight O3 reduction found for most areas of the YRD. These
results reveal the extreme difficulty in O3 pollution control
for the region. In southwestern Zhejiang, the O3 concentra-
tions were found to decline in the cases with large abatement
of NOx emissions (Fig. 10c, f and g), suggesting a shift from
a VOC-limited to a NOx -limited region for the O3 formation.
Table 4 summarizes the change in the simulated monthly
2−
means of SNA (NO− +
3 , NH4 , and SO4 ) concentrations be-
tween the base case and sensitivity cases in January. The
SNA concentrations were decreased in most cases, imply-
ing that the reduction in precursor emissions was useful for
mitigating the SNA pollution. Compared to that of precur-
sor emissions, however, the reduction rate of SNA was much
smaller, attributed to the strong nonlinearity of SNA forma-
tion. The largest reductions were found at 11.7 % and 12.4 %
when emissions of NH3 and all the three precursors were
decreased by 30 % (Cases 11 and 12), respectively. In con-
Figure 9. The observed and simulated hourly NO−3 concentrations trast, the SNA concentrations declined slightly by 1 % and
with the bottom-up and top-down NOx emission estimates for Jan-
uary, April, July, and October 2016 at JSPAES.
increased by 0.5 % when NOx and SO2 emissions were re-
duced by 30 % (Cases 9 and 10), respectively. The results
suggest that most of the YRD was in an NH3 -neutral or even
NH3 -poor condition in winter, consistent with the judgment
mented. In actual fact, controlling VOCs is more difficult through the AQM based on an updated NH3 emission inven-
than NOx . Compared to NOx that come mainly from fos- tory (Zhao et al., 2020), as the NH3 volatilization in winter
sil fuel combustion (Zheng et al., 2018), it is more compli- was much smaller than other seasons. Reducing NH3 emis-
cated to identify the sources of specific VOC species that sions was the most efficient way to control SNA pollution
Atmos. Chem. Phys., 21, 1191–1209, 2021 https://doi.org/10.5194/acp-21-1191-2021Y. Yang et al.: Improvement of satellite-derived NOx emissions in YRD 1205 Figure 10. The spatial differences of monthly mean O3 concentrations between the simulations based on the base case (top-down estimates) and sensitivity cases in April 2016 (sensitivity case minus base case). https://doi.org/10.5194/acp-21-1191-2021 Atmos. Chem. Phys., 21, 1191–1209, 2021
1206                                               Y. Yang et al.: Improvement of satellite-derived NOx emissions in YRD

for the region in winter. In Case 11 with NH3 control only,      observations from online measurement are recommended for
the reduction in NO−             +
                      3 and NH4 concentrations was much          a better space coverage and temporal resolution to explore
                        2−                                       more carefully the response of SNA to the changes in emis-
larger than that of SO4 . As NH3 reacted with SO2 prior
to NOx , NH4 NO3 was assumed easier to decompose than            sions of NOx and other precursors.
(NH4 )2 SO4 when NH3 emissions were reduced. The growth
of NO− 3 concentrations was found for Case 10 (SO2 control
only), since the free NH3 from the reduced SO2 emissions         Data availability. All data in this study are available from the au-
could react with NOx in the NH3 -poor condition. Similarly,      thors upon request.
the SO2−4 concentrations increased for Case 9 (NOx control
only), as the elevated O3 attributed to the reduction of NOx
                                                                 Supplement. The supplement related to this article is available on-
emissions promoted the SO2− 4 formation.                         line at: https://doi.org/10.5194/acp-21-1191-2021-supplement.

4   Summary
                                                                 Author contributions. YY developed the strategy and methodology
                                                                 of the work and wrote the draft. YZ improved the methodology
From a top-down perspective, we have estimated the monthly
                                                                 and revised the manuscript. LZ provided useful comments on the
NOx emissions for the YRD region in 2016, based on non-          methodology. JZ and XH provided observation data of secondary
linear inversed modeling and NO2 TVCDs from POMINO,              inorganic aerosols. XZ, YZ, MX, and YL provided comments on
and the bottom-up and top-down estimates of NOx emissions        air quality modeling.
were evaluated with the AQM and ground NO2 observa-
tions. Due to insufficient consideration of improved controls
on power and industrial sources, the NOx emissions were          Competing interests. The authors declare that they have no conflict
probably overestimated in the current bottom-up inventory        of interest.
(MEIC), resulting in significantly higher simulated NO2 con-
centrations than the observations. The simulated NO2 con-
centrations with the top-down estimates were closer to the       Special issue statement. This article is part of the special issue “Re-
observations for all four seasons, suggesting the improved       gional assessment of air pollution and climate change over East and
emission estimation with satellite constraint. Improved O3       Southeast Asia: results from MICS-Asia Phase III”. It is not associ-
and SNA simulations with the top-down NOx estimates for          ated with a conference.
most months indicate the importance role of precursor emis-
sion estimation in secondary pollution modeling for the re-
                                                                 Acknowledgements. This work was sponsored by the National
gion. Through the sensitivity analysis of O3 formation, the
                                                                 Natural Science Foundation of China (91644220 and 41575142),
mean O3 concentrations were found to decrease for most of
                                                                 the National Key Research and Development Program of China
the YRD when only VOC emissions were reduced or the re-          (2017YFC0210106), and the Key Program for Coordinated Control
duced rate of VOCs was 2 times that of NOx , and the result      of PM2.5 and Ozone for Jiangsu Province (2019023). We would
indicates the effectiveness of controlling VOC emissions in      also like to thank Tsinghua University for the free use of national
O3 pollution abatement for the region. For part of southern      emissions data (MEIC) and Peking University for the support of
Zhejiang, however, the O3 concentrations were simulated to       satellite data (POMINO v1).
decline with the reduced NOx emissions, implying the shift
from a VOC-limited to a NOx -limited region. Compared to
reducing NOx or SO2 only, larger reduction in SNA concen-        Financial support. This research has been supported by the Na-
trations was found when 30 % of emissions were cut for NH3       tional Natural Science Foundation of China (grant nos. 91644220
or all the three precursors (NO2 , NH3 , and SO2 ). The result   and 41575142), the National Key Research and Development Pro-
suggests that reducing NH3 emissions was crucial to alleviate    gram of China (grant no. 2017YFC0210106), and the Key Program
                                                                 for Coordinated Control of PM2.5 and Ozone for Jiangsu Province
SNA pollution of the YRD in winter.
                                                                 (2019023).
   Limitations remain in this study. Due to the limited hori-
zontal resolution of OMI, a relatively big bias existed in the
spatial distribution of the constrained NOx emissions at the     Review statement. This paper was edited by Hang Su and reviewed
regional scale compared to national or continental ones, and     by two anonymous referees.
the uncertainty could exceed 30 % for the YRD region (Yang
et al., 2019b). Therefore the improvement in the top-down
estimates of NOx emissions can be expected when more ad-
vanced and reliable products of satellite observations become
available at a finer horizontal resolution (e.g., TROPOspheric
Monitoring Instrument, TROPOMI). In addition, more SNA

Atmos. Chem. Phys., 21, 1191–1209, 2021                                             https://doi.org/10.5194/acp-21-1191-2021
You can also read