Contactless analysis of heart rate variability during cold pressor test using radar interferometry and bidirectional LSTM networks - Nature
←
→
Page content transcription
If your browser does not render page correctly, please read the page content below
www.nature.com/scientificreports
OPEN Contactless analysis of heart rate
variability during cold pressor
test using radar interferometry
and bidirectional LSTM networks
Kilin Shi1,5*, Tobias Steigleder2,5, Sven Schellenberger3, Fabian Michler1, Anke Malessa2,
Fabian Lurz3, Nicolas Rohleder4, Christoph Ostgathe2, Robert Weigel1 & Alexander Koelpin3
Contactless measurement of heart rate variability (HRV), which reflects changes of the autonomic
nervous system (ANS) and provides crucial information on the health status of a person, would
provide great benefits for both patients and doctors during prevention and aftercare. However, gold
standard devices to record the HRV, such as the electrocardiograph, have the common disadvantage
that they need permanent skin contact with the patient. Being connected to a monitoring device
by cable reduces the mobility, comfort, and compliance by patients. Here, we present a contactless
approach using a 24 GHz Six-Port-based radar system and an LSTM network for radar heart sound
segmentation. The best scores are obtained using a two-layer bidirectional LSTM architecture. To
verify the performance of the proposed system not only in a static measurement scenario but also
during a dynamic change of HRV parameters, a stimulation of the ANS through a cold pressor test is
integrated in the study design. A total of 638 minutes of data is gathered from 25 test subjects and
is analysed extensively. High F-scores of over 95% are achieved for heartbeat detection. HRV indices
such as HF norm are extracted with relative errors around 5%. Our proposed approach is capable to
perform contactless and convenient HRV monitoring and is therefore suitable for long-term recordings
in clinical environments and home-care scenarios.
Heart rate describes the number of heartbeats per minute. However, the beat of a healthy heart is not absolutely
regular. Fluctuations in the time intervals of adjacent heartbeats are referred to as heart rate variability (HRV)1,2.
This variability is linked to the neurocardiac function of the body and is generated by heart-brain interactions and
by dynamic non-linear processes which are regulated by the autonomic nervous system (ANS)3. It is influenced
by many factors such as exercise and mental stress or physiological events such as respiration, blood pressure
regulation, or the circadian r hythm4,5. HRV is an indicator for both chronic and psychological conditions such
as depression, epileptic seizures6, diabetic neuropathy7, or the surveillance of post-infarction patients to prevent
sudden cardiac death8. Especially chronic diseases pose a major concern in future health care as both loss of
quality of life and consumption of resources due to their effects are immense and their impact rises steadily.
On the other side lies a tremendous chance in addressing chronic diseases in a timely fashion as by adequate
prophylactic measures, their course can be altered drastically and outcomes can be changed fundamentally. In
order to achieve this, HRV needs to be measured over long periods in a way, which is both agreeable for the
patient and resource-friendly for society. Established devices, which are capable to measure HRV indices, are
the electrocardiograph (ECG)2,8 or the photoplethysmograph (PPG)9. However, these devices have the common
disadvantage that they need permanent contact to the patient. Especially during long-term recordings, this
reduces their mobility, comfort, and c ompliance10. Furthermore, electrodes might lead to further distress, false
alarms and thereby increase symptom b urden11.
A very promising approach for this task are radar systems. Radar technology promises an unobtrusive way
for continuous and touch-free monitoring of vital s igns12–21. A radar system transmits an electromagnetic wave,
1
Institute for Electronics Engineering, Friedrich-Alexander-Universität Erlangen-Nürnberg (FAU), 91058 Erlangen,
Germany. 2Department of Palliative Medicine, Universitätsklinikum Erlangen, Comprehensive Cancer Center CCC
Erlangen-EMN, Friedrich-Alexander-Universität Erlangen-Nürnberg (FAU), 91054 Erlangen, Germany. 3Hamburg
University of Technology, Institute of High-Frequency Technology, 21073 Hamburg, Germany. 4Chair of Health
Psychology, Friedrich-Alexander-Universität Erlangen-Nürnberg (FAU), 91052 Erlangen, Germany. 5These authors
contributed equally: Kilin Shi and Tobias Steigleder. *email: kilin.shi@fau.de
Scientific Reports | (2021) 11:3025 | https://doi.org/10.1038/s41598-021-81101-1 1
Vol.:(0123456789)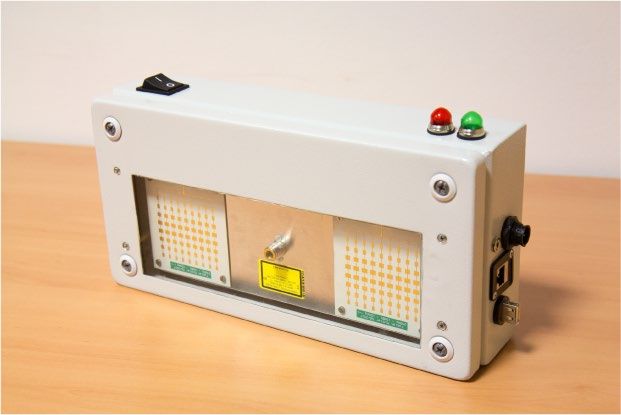
www.nature.com/scientificreports/
which is scattered at the proband’s body and received back by the radar. By evaluation of the propagation time
between transmit and reception of the signal the relative distance can be determined. Another radar concept is
based on phase measurements between transmit and receive signal for distance monitoring. Using this technique,
researchers have reported high accuracies when detecting heart rates and single heartbeats, not only with direct
line of sight but also through obstacles such as clothing. However, in order to reliably measure HRV, heart rate
determination is not sufficient. Precise beat-to-beat detection and segmentation is needed to obtain correct values
since small fluctuations in the detection timing have high impact on the resulting HRV indices.
Previous works that researched radar-based heart beat or HRV extraction utilised the pulse wave component
as cardiac signal. However, the shape and configuration of the pulse wave is connected to respiration and there-
fore changes continuously during each respiration cycle. This might complicate precise heartbeat extraction that
is needed for HRV determination. For the first time, this work explores the possibility of HRV extraction using
the radar heart sound component, which promises higher accuracy and precision when compared to cardiac
analysis using the pulse wave component due to its prominent shape and temporal d istinctness19,22. In order to
perform precise beat-to-beat localisation in the heart sound signal for HRV calculation, a hidden-Markov-based
algorithm and a bidirectional Long Short-Term Memory (LSTM) network are implemented, evaluated, and com-
pared. Several LSTM configurations are tested to obtain the optimal set of hyperparameters. Whereas previous
works only evaluated the measurability and performance of radar-based HRV extraction in a static setting, e.g.,
in a supine or seated position, we employed a defined test scenario including a stimulation of the ANS through
a cold pressor test (CPT). Thereby, the indices are not only measured at rest but also during sudden changes
of the HRV parameters. To obtain a conclusive result, data from 25 test subjects are gathered and a reference
ECG is used to perform an extensive evaluation of the performance of heartbeat detection and HRV extraction.
Heart rate variability
To quantify HRV, different sets of parameters have been introduced. These indices can be separated into two
major groups: Time-domain and frequency-domain parameters2,23,24. Time domain indices provide a quantifi-
cation of the amount of variance in the inter-beat intervals (IBIs) using statistical measures. Commonly known
parameters comprise the standard deviation of the NN intervals (SDNN) or the the root mean square successive
difference of intervals (RMSSD). Another established parameter is the triangular index (TRI), which represents
the integral of the density of the IBI histogram divided by its height2. TRI has a high validity25,26 and can be used
to distinguish between normal heart rhythms and a rrhythmias27. The major advantage of geometric measures
such as TRI compared to measures like SDNN or RMSSD is their relative insensitivity to computational errors
of the IBI v alues28. Therefore, in this work, TRI was selected for further analysis.
Frequency-domain measures are calculated by transforming a windowed IBI signal into frequency-domain
using the discrete Fourier transform (DFT)2. Afterwards, the power distribution among certain frequency bands
is analysed. Frequency-domain parameters are separated into high-frequency (HF) and low-frequency (LF)
bands2. The LF band ranges from 0.04 Hz ... 0.15 Hz, equalling rhythms or modulations with periods lengths of
7 s ... 25 s. LF has often been used as a marker for sympathetic activity29. The HF band ranges from 0.15 Hz ... 0.4
Hz, corresponding to rhythms between 2.5 s ... 7 s. This band reflects parasympathetic or vagal activity and is
sometimes also called the respiratory band since it is affected by Heart rate (HR) variations which are caused by
the respiratory cycle, an effect which is called “respiratory sinus arrhythmia”. Low HF values are associated with
stress, panic, anxiety, or worry. Another frequency-domain parameter is LF/HF ratio, which is simply calculated
as the ratio of the respective absolute values. Since both sympathetic nervous system (SNS) and the parasym-
pathetic nervous system (PNS) regulate HR, this value tries to reflect the dominance of either sympathetic or
parasympathetic activity. Low LF/HF ratios are assumed to reflect stronger parasympathetic activity while high
ratios may indicate higher sympathetic a ctivity1,4.
Two measures are usually calculated for each band, the absolute power and the normalised value. The unit of
the absolute power in a certain band is ms2. Normalised values are calculated by dividing the respective power
by the total power of LF and HF and are given in normalised units (n.u.). These values represent the percentage
of the component in the total activity and emphasise the controlled and balanced behaviour of the SNS and
PNS. Moreover, normalisation minimises the effect of changes in the total power which might lead to incorrect
conclusions1,2.
Methods
Subjects. The university hospital in Erlangen was responsible for the acquisition and support of test subjects,
the clinical validation, and acquiring the approval of the ethics committee. All of the data recordings were per-
formed at the university hospital in Erlangen. Overall, measurements were performed with 25 healthy subjects.
The written consent was obtained from all participants of this study.
Before each measurement medical staff checked the health state of the participants. The test persons were
then informed in detail about the measurement procedure and were able to ask questions about any uncertain-
ties. Before starting the measurement, the participants laid down on the examination table and were wired to the
so-called “Task Force Monitor (TFM)” by CNSystems. This medical gold standard device was used for recording
the reference ECG signal synchronised to the radar measurements.
The average age of all participants is 24.3 years with a standard deviation of 2.8 years. The average body mass
index of all participants is 23.7 kg/m2 with a standard deviation of 2.9 kg/m2 . Equal gender ratio is observed
(female n = 12, male n = 13).
Measurement setup and synchronisation. A picture of the measurement setup can be seen in Fig. 1A.
The radar system is mounted on a fixed construction placed above the examination table and focuses on the
Scientific Reports | (2021) 11:3025 | https://doi.org/10.1038/s41598-021-81101-1 2
Vol:.(1234567890)
www.nature.com/scientificreports/
Figure 1. Overview of the measurement setup and measurement protocol. (A) Photograph of the measurement
setup, including the TFM, the radar system, and the examination table17. (B) Block diagram of the measurement
setup. (C) Flowchart of the data synchronisation routine. (D) Cross-correlation of the SYNC sequences which
is used to determine the latency between both systems. (E) Synchronisation sequences of the TFM and the
radar system after resampling and time shift removal. (F) Depiction of the measurement protocol: after a resting
measurement of nine minutes, the CPT manoeuvre is performed, which includes three main parts with a length
of 90 s and pauses with a length of 60 s in between.
chest area of the test subjects. The height above the chest as well as the position of the radar can be adapted. On
average, the distance between the antenna and the skin of a test subject was around 40 cm. A block diagram
of the setup is depicted in Fig. 1B. The signals of the radar system and the TFM are sampled by two different
computers. The signals are synchronised during post-processing by creating a sequential binary synchronisation
sequence according to the Gold codes inside the radar system. These sequences are sampled by the radar system
as well as the reference device by feeding the synchronisation sequence into the TFM by connecting a cable to the
external input. The synchronisation procedure is shown in Fig. 1C. Since the radar system and the TFM system
have different sampling frequencies, the first step is to find the resampling factor that is used to obtain the same
sampling rate. This is done by optimising the factor using the fminbnd function in MATLAB and taking the
maximum cross-correlation value as objective function. This resampling factor is used to determine the latency
Scientific Reports | (2021) 11:3025 | https://doi.org/10.1038/s41598-021-81101-1 3
Vol.:(0123456789)www.nature.com/scientificreports/
between ECG and radar signal by searching for the maximum in the cross-correlation of both synchronisation
sequences as shown in Fig. 1D. The time shift results from the asynchronous start of both systems. Using both
the resampling factor and the latency, the ECG signal is resampled and shifted in order to obtain synchro-
nised radar and ECG signals. A section of a resampled and shifted synchronisation sequence of both systems is
depicted in Fig. 1E. After synchronisation, both signals have a sample rate of 2000 samples per second.
Cold pressor test. The goal of this study is to examine the possibility of contactless HRV measurement
using radar technology. For this purpose, a test procedure analyses HRV parameters of healthy test subjects
simultaneously collected by both a reference ECG and the radar system. In order to achieve a reliable statement
whether the radar is capable of accurately determining the parameters not only in a static setting but also in the
case of abrupt HRV changes, the designed test protocol includes not only a resting scenario but also a forced
activation of the ANS. In order to force a stimulation of the ANS, the CPT was chosen as part of the experimental
protocol. The CPT is a test procedure designed to provoke a sympathetic activation and an increase in blood
pressure in healthy s ubjects30,31. The CPT manoeuvre is typically performed by immersing a subject’s hand into
ossible30.
ice water (1◦ C ... 5◦ C) for a short period of several minutes (1 min ... 6 min) or as long as p
Experimental protocol. The measurement routine is depicted in Fig. 1F. First, a resting measurement was
performed for nine minutes. During this time, the test subject was asked to lie calmly on the examination table.
Room temperature and brightness were set to a comfortable level. The resting measurement ensures the test
subjects for being able to calm down in order to have a comparable starting point.
Next, the CPT sequence was started. The data gathered from these recordings are used to compare the
extracted HRV values of the reference device and the radar system to each other. The CPT manoeuvre was split
into three parts of equal length: “Baseline”, “Response”, and “Recovery” with pauses of 60 s in between. HRV
comparison is performed separately for all three parts. Baseline serves as a reference starting point, Response
measures the abrupt change of HRV during the ice water stimulation, and Recovery provides information about
the ability to return to normal condition. These windows were chosen in order to achieve large amount of vari-
ation between the successive HRV values since the overall objective is to evaluate the ability of radar systems to
correctly determine HRV values not only in one setting but also after abrupt changes.
Each of the three parts has a length of 90 s. This length was chosen due to practical and theoretical considera-
tions. During Response, the test subjects were asked to hold their hands into the ice water for two minutes or
as long as possible. The windowed data which are used for the HRV calculation of this part, however, should be
fully covered by this action, i.e., the window length should not be longer than 120 s. A slightly shorter window
would be preferred in case a subject is not able to hold their hands into the ice water for the entire two minutes.
Although the standard window length of short-time HRV measurements is five minutes, researchers have shown
that the calculation of valid HRV parameters is possible for shorter w indows3,32,33. Parameters such as HF, LF, or
LF/HF ratio can be calculated for a window length of 90 s, therefore, this length was chosen as overall window
length for HRV calculation. It is important to choose the same window length for all parts of the CPT manoeuvre
in order to ensure c omparability2.
The overall measurement of the CPT sequence is started a little ahead of Baseline and is stopped a little
behind Recovery, in order to make sure that the same depicted sequence can be extracted from every test sub-
ject. “Immersion” represents the point in time at which the subject is asked to put the hand into the ice water.
Removing the hand from the water happens after a maximum of two minutes or earlier, so this point in time
may lie after the end of the Response window but never in the Recovery part.
Six‑Port interferometry. The Six-Port consists of two input and four output ports. The input signals are
the reference signal P1 and the signal P2 which is the signal that is reflected at the target and received by the
antenna. In the Six-Port structure, these two signals are superimposed under four relative and static phase shifts
of 0◦ , 90◦ , 180◦, and 270◦. These four output signals P3 ... 6 are then down-converted into baseband using diode
power detectors, resulting in baseband signals B3 ... 6. The baseband signals form two pairs of differential signal
which represent the orthogonal in-phase and quadrature components I and Q of a complex number Z 34:
Z = I + jQ = (B5 − B6 ) + j(B3 − B4 ). (1)
The relative distance change x can then be extracted from Z using:
�ϕ
�x = · , (2)
2π 2
with being the known wavelength of the signal and �ϕ, the argument of Z , representing the relative phase shift
between the two input signals:
�ϕ = arg{Z} = arg{(B5 − B6 ) + j(B3 − B4 )}. (3)
Calculation and processing of HRV parameters. The HRV parameters HF, LF, LF/HF ratio, and TRI
are calculated for both the radar and the ECG signal. The first step hereby is to extract single heartbeats from the
ECG and the radar heart sound signal. For the ECG, the R-peaks are used as reference points which are located
using the algorithm presented by Zhang et al.35. Afterwards, detected peaks are manually inspected to check for
erroneous labels. The interval between two successive heartbeats is called RR interval whereas a set of successive
RR intervals is called RR sequence. To obtain radar RR sequences, the radar heart sound signals are segmented
Scientific Reports | (2021) 11:3025 | https://doi.org/10.1038/s41598-021-81101-1 4
Vol:.(1234567890)www.nature.com/scientificreports/
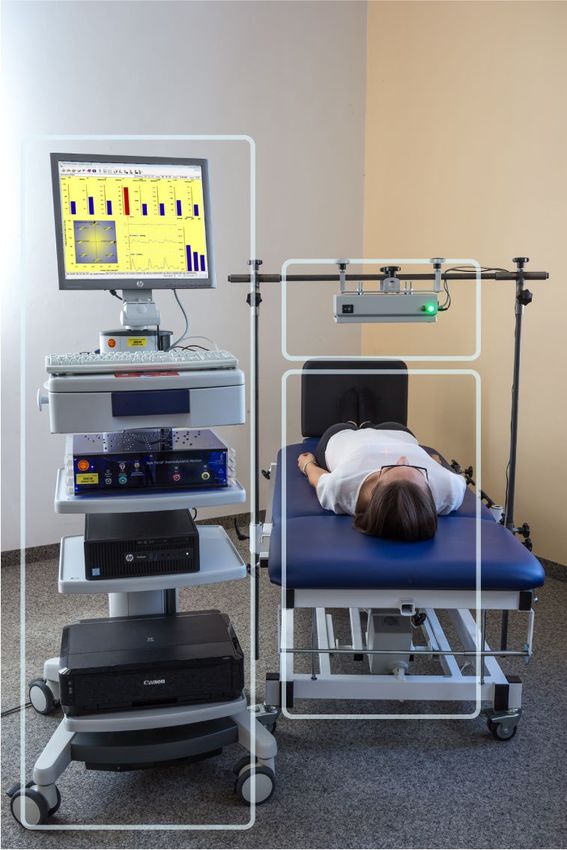
Figure 2. The radar system and its components17. (A) Photograph of the radar system. (B) Planar realisation
of the Six-Port structure. (C) Simulated (Sim.) and measured (Meas.) radiation pattern in horizontal plane. (D)
Simulated and measured radiation pattern in vertical plane at 10◦ inclination.
first. The start of the first state, i.e., the first heart sound, is used as reference point for each heartbeat of the radar
heart sound signal.
The RR sequences of the ECG and radar signal are checked for invalid values using an automated procedure.
These correction steps are important since single outliers will otherwise cause large errors in the resulting HRV
parameters, especially when calculating frequency-domain p arameters2. To remove artefacts, e.g., missed beats
or falsely detected beats, an algorithm for artefact removal is utilised which is based on the work by Vollmer36,37.
After artefact removal, the HRV parameters are calculated. Time-domain parameters can be directly derived
from the RR sequences. To calculate frequency-domain parameters like LF or HF, the RR sequences are linearly
interpolated and standardized first. Interpolation is necessary since equidistant sampling is required in order
to calculate the DFT. Before calculating the DFT, the signal is zero-padded until its length is a power of two.
Human subjects. The study was approved by the ethics committee of the Friedrich-Alexander-Universität
Erlangen-Nürnberg (No. 85_15B). All research was performed in accordance with relevant guidelines and regu-
lations. The informed consent was obtained from all subjects in human trials.
Contactless heart sound recording using radar interferometry. The first step of contactless HRV
acquisition is to measure cardiac vital signs using radar. Two approaches are possible, either to measure the
motion of the chest surface due to the propagation of the pulse waves13,15,18,38,39 or to record the substantially
smaller vibrations of the skin due to the heart sounds19,40–43. The latter technique has proved to deliver higher
accuracies when determining the timings of the single h eartbeats19. This is preferable since HRV represents the
variation of the time intervals of single successive heartbeats. Precisely locating single heartbeats is therefore
essential since outliers cause large errors in the resulting HRV values, especially when calculating frequency-
domain parameters2.
Six-Port-based interferometers have shown to be able to measure heart sound signals using a phase evalua-
tion technique34,44. In this study, a bistatic 24 GHz Six-Port-based radar system was built and utilised which can
be seen in Fig. 2A. A photo of the Six-Port structure is shown in Fig. 2B. The system consists of two antennas, a
transmitting (TX) as well as a receiving (RX) antenna. The beams of the antennas are tilted towards a common
focal point at a target distance of around 40 c m17. The resulting inclination angle of the antennas is ±10◦. The
antennas have a simulated gain of 19 dBi and a measured gain of 17.7 dBi each and are realised using a planar
design in order to facilitate the integration into the housing. The 72 patches of the antenna are arranged in nine
columns with eight elements each. The simulated and measured radiation patterns of the antennas in both hori-
zontal and vertical plane are shown in Fig. 2C,D. It can be seen that measured and simulated value exhibit high
agreement. The system has an equivalent isotropically radiated power (EIRP) smaller than 20 dBm, which is the
limit as defined by the regulations for the industrial, scientific, and medical (ISM) band.
Algorithms for heart sound segmentation. An LSTM network and a hidden semi-Markov model
(HSMM)45 are used for the detection of single heartbeats in the radar heart sound signal. The HSMM model is
implemented as described in19. Three features are used for training and testing: the homomorphic, the Hilbert,
and the power spectral density envelope of the heart sound signal. The HSMM is chosen as state-of-the-art
algorithm since it is the only segmentation technique that has been evaluated for radar heart sound analysis.
However, the HSMM algorithm has the disadvantage that it requires a priori information. Due to its limited
heart rate range, it sometimes lacks the capability to correctly detect high variations of the heart rate. Recurrent
neural network (RNNs) architectures and especially LSTMs promise to be a fitting candidate to overcome these
drawbacks. LSTM networks are a special type of RNN, which are able to learn time-dependencies. Hochreiter
and Schmidhuber46 introduced LSTMs to avoid long-term dependency problems and handle issues that con-
ventional RNNs face. Standard LSTMs can only take the preceding elements into account. However, for the
task of heart sound segmentation, subsequent inputs might also carry relevant information regarding the state
change47. Therefore, bidirectional LSTMs are employed in this work, which consist of two LSTM layers. One
Scientific Reports | (2021) 11:3025 | https://doi.org/10.1038/s41598-021-81101-1 5
Vol.:(0123456789)www.nature.com/scientificreports/
F1 Sensitivity
CPT CPT
Resting (%) Baseline (%) Response (%) Recovery (%) Mean (%) Resting (%) Baseline (%) Response (%) Recovery (%) Mean (%)
LSTM 99.01 97.76 92.98 98.09 96.28 98.89 97.96 91.39 97.70 95.54
HSMM 93.67 94.48 86.57 94.19 91.75 94.35 95.01 88.18 93.96 92.25
Precision Accuracy
CPT CPT
Resting (%) Baseline (%) Response (%) Recovery (%) Mean (%) Resting (%) Baseline (%) Response (%) Recovery (%) Mean (%)
LSTM 98.94 97.33 92.92 98.05 96.01 97.86 95.39 85.44 95.84 91.89
HSMM 94.62 95.40 85.02 94.49 91.33 89.54 90.85 76.32 89.08 84.82
Table 1. Performance comparison of LSTM and HSMM for single heartbeat detection.
layer computes the forward embedding while the other layer computes the backward layer. The final result is
obtained by concatenating both embeddings.
Several LSTM configurations were thoroughly evaluated for the purpose of radar heart sound segmenta-
tion using leave-one-subject-out cross-validation (LOSOCV). The models are hereby trained on the data of all
subjects except the one that is tested. This is iterated until the data of all subjects have been tested once. Models
with one and two LSTM or bidirectional LSTM layers are compared. Furthermore, the units per layer are varied
between 50 and 400 hidden units. The best results are obtained using a model with two bidirectional LSTM lay-
ers containing 400 hidden units in the first layer and 200 hidden units in the second layer. A dropout layer with
a drop probability of 0.2 is used after each LSTM layer to combat overfitting. The LSTM layers are followed by
a fully-connected layer, a softmax layer, and a classification layer. Training is done for 50 epochs with a batch
size of 64. The initial learn rate is 0.001 and drops after every 20 epochs by a factor of 10. The utilised features
include the homomorphic, the Hilbert, and the power spectral density envelope of the heart sound signal as for
the HSMM model. Additionally, heart rate is estimated using the autocorrelation of the heart sound signal. This
is done by searching for the maximum in the autocorrelation signal in a certain range, corresponding to heart
rates of 40 to 135 beats per minute (bpm). This value is used as a feature for every time step of the windowed
signal that is segmented.
Results
Performance evaluation of beat‑to‑beat detection and HRV extraction. To determine the per-
formance of the radar system for HRV analysis, the first step is to evaluate the scores when detecting single heart-
beats. A reference heartbeat is defined at every R-peak in the ECG signal. This point in time also corresponds to
the start of the first heart sound. LSTM and HSMM return a segmentation of the heart sound signal consisting
of four states: first heart sound, systole, second heart sound, and diastole. To compare the performance of heart-
beat extraction and HRV calculation, the start of each first state, i.e., each detected first heart sound, is used for
comparison.
Scores are obtained using LOSOCV. Four figures are compared: F1 score, sensitivity, precision, and accuracy.
Sensitivity is calculated as the number of true positives (TP) divided by the sum of true positives and false nega-
tives (FN). Precision is defined as the number of true positives divided by the sum of true positives and false
positives (FP). Accuracy is calculated as the number of true positives divided by the sum of all true positives,
false positives, and false negatives. The F1 score represents a harmonic mean of sensitivity and precision and can
be calculated as: (2 · TP)/(2 · TP · FP · FN).
A detected heartbeat is counted as true positive when it deviates no more than 75 ms from the reference
heartbeat. This corresponds to half of the recognised tolerance range of 150 ms for ECG R-peak d etection48. A
false negative is counted when no heartbeat is detected within this range around an ECG R-peak. A false posi-
tive is added when there is no ECG R-peak around a detected one. The scores for all test subjects, separated by
the nine minutes resting measurement and the CPT manoeuvre, are summarised in Table 1. In addition to the
mean score of the whole CPT manoeuvre, the scores for the three single CPT scenarios, Baseline, Response, and
Recovery, are also shown. The data from subject 20 was excluded due to massive clipping of the baseband signals.
For the resting measurement, the LSTM achieves an F1 score of 99.01%, a sensitivity of 98.89%, a precision of
98.94%, and an accuracy of 97.86%. The HSMM scores four to eight percentage points lower in comparison with
an F1 score of 93.67%, a sensitivity of 94.35%, a precision of 94.62%, and an accuracy of 89.54%. For the CPT
manoeuvre, the LSTM also scores around three to seven percentage points higher in comparison, with an F1
score of 96.28%, a sensitivity of 95.54%, a precision of 96.01%, and an accuracy of 91.89%. It can be noted that
the resting scores are on average higher than the CPT scores. This is due to the lower scores during the Recovery
scenario. Overall, higher scores can be observed for the LSTM algorithm for all figures.
High scores in Table 1 indicate that HRV can in principle be measured by radar. To further validate this
assumption, LSTM and HSMM performances are evaluated for the calculation of several HRV parameters.
Besides the data from test subject 20, which was excluded due to clipping of the radar signal, the data from
test subjects 8 and 16 also had to be excluded from HRV calculation. Test subject 8 was excluded since she was
not able to hold their hand in the ice water for a sufficient time and test subject 16 was excluded since no trig-
ger signals were acquired during the measurement, i.e., the single parts of the CPT could not be distinguished
Scientific Reports | (2021) 11:3025 | https://doi.org/10.1038/s41598-021-81101-1 6
Vol:.(1234567890)www.nature.com/scientificreports/
afterwards. Several HRV parameters are compared: Heart rate (HR), HF, HF norm, LF, LF/HR ratio, and TRI.
Although the heart rate is not a typical HRV parameter per se, it is closely linked to HRV and is also widely used
for medical decision-making.
Table 2 compares the HRV indices that are obtained using the radar system and the LSTM/HSMM algorithm
to the reference ECG HRV indices. Rows correspond to different parameters and scenarios while columns rep-
resent the methods. The first row corresponds to the nine-minute resting measurement (Rest.) while the other
rows represent the CPT manoeuvre. The CPT values are again split into the three scenarios Baseline (Base.),
Response (Resp.), and Recovery (Reco.) as well as a mean score. The first six columns display absolute values
with their mean and standard deviation. The results from different test subjects are separated into two groups.
The groups were formed by distinguishing the different reactions of the test subjects to the CPT. As noted by
Mourot et al.30, some people react with an increasing HF norm in response to ice water stimulus while others
exhibit a decreasing HF norm. Therefore, the scores of the test subjects are separated under this consideration.
Test subjects 1, 4, 6, 7, 12, and 25 had a decrease of HF norm due to the ice water stimulus, i.e., a lower HF norm
during Response in comparison to Baseline. Their scores are summarised under “Group neg.” while the others
are summarised under “Group pos.”. The inverse reactions of different test subjects are no drawback for this study
as the direction of change of the HRV parameters is not important. The goal of this study is to demonstrate reli-
able measurability of HRV parameters using radar interferometry during sudden changes, therefore, only the
absolute change is of interest. The table was split into two groups to underline the changes of parameters which
would otherwise be hidden due to two opposing groups.
For both groups, an increase of heart rate can be observed during Response. Per definition, the negative
group has a decrease of HF and HF norm during Response while the positive group has an increase of these
parameters. During Recovery, HF norm return to Baseline level. As expected, LF and LF/HF ratio increase dur-
ing Response in the negative group while they decrease in the positive group. Again, they return to normal level
during Recovery. TRI increases in both groups during Response and decreases again during Recovery. These
trends are reproduced by both the LSTM and the HSMM.
The last two columns show the percentage differences of the LSTM or HSMM values in comparison to the
reference ECG values. These percentage differences are calculated by taking the mean difference over all test
subjects. For HR, both LSTM and HSMM achieve deviations of 0.16%% and 0.35% for the resting measurement
and 1.06% and 2.08% for the whole CPT manoeuvre. For HF, LSTM achieves substantially lower deviations of
8.17% and 10.87% in comparison to HSMM with 14.74% and 17.10%. For HF norm, LSTM again achieves small
deviations of 4.83% and 5.52%, which are around four percentage points lower in comparison to the HSMM
values. For LF, LSTM and HSMM have similar CPT differences of 10.25% and 10.43%, respectively. For LF/HF
ratio, the differences of the LSTM algorithm are around 7% lower in comparison to HSMM, with deviations of
9.43% for the resting measurement and 11.15% for the CPT manoeuvre. For TRI, HSMM achieves a slightly
lower deviation during the resting measurement but a higher deviation of 18.37% during the CPT manoeuvre.
Figures 3 and 4 show scatter plots and Bland–Altman plots for heart rate, HF, HF norm, LF, LF/HF ratio, and
TRI. The left and right side depict the results obtained by LSTM and HSMM, respectively. Each row corresponds
to one parameter. In order to evaluate the performance of the radar under sudden HRV changes, the resting
measurements were not included in the plots. The CPT measurement data in the scatter plots are visually split
into the three scenarios Baseline, Response, and Recovery.
The scatter plots reveal the amount of correlation between two methods. Correlation is calculated as Pearson
correlation coefficient (R). However, a high correlation does not necessarily lead to a good agreement between
those methods49. This is the reason why Bland and Altman introduced the so-called Bland–Altman plot50. This
plot allows for easy visual identification of any systematic errors such as a fixed or proportional bias. The mean
value shows if there is any fixed bias between two methods. A fixed bias indicates that there is a constant offset
between two methods while a proportional bias shows that differences between the two methods depend on
the absolute value. The limits of agreement (LoA) describe a range of agreement within which 95% of the dif-
ferences between the two methods are included. Small values of mean and LoA show a high agreement between
two methods.
For heart rate, LSTM achieves a correlation coefficient of 95.72%. A small mean value of −0.43 bpm is
observed in the Bland–Altman plot with the LoA lying at −6.45 bpm and −5.58 bpm. No proportional bias can
be seen. HSMM has a correlation of 80.41%, mainly due to one outlier. The mean values of the differences is at
0.68 bpm and the LoA are at −13.97 bpm and 15.32 bpm. Compared to LSTM, the mean value as well as the LoA
are substantially higher. For HF, LSTM again has a substantially higher correlation than HSMM with R = 91.36%
for LSTM and R = 80.47% for HSMM. LSTM has a mean difference of 0.22 with the LoA at −0.76 and 1.20
while HSMM has a mean difference of 0.40 with the LoA at −1.06 and 1.86. For HF norm, similar values can be
observed for R. For the LSTM, R = 91.86% while for the HSMM, R = 79.81%. In the Bland–Altman plot, a mean
difference of 0.79 × 10⁻² and LoA of −8.50 × 10⁻² and 10.09 × 10⁻² can be observed for the LSTM. HSMM has
a mean difference of 2.05 × 10⁻² and LoA at −12.17 × 10⁻² and 16.27 × 10⁻².
For LF, LSTM has a slightly smaller correlation of 78.56% in comparison to HSMM with a correlation of
79.83%. The mean difference of LSTM is at 0.09 with the LoA at −1.01 and 1.18. These numbers are also slightly
higher than for HSMM, which has a mean difference of 0.07 and LoA at −0.96 and 1.10. For LF/HF ratio, LSTM
again has a high correlation of 92.87 % with the mean difference at −0.04 and the LoA at −0.40 and 0.31. HSMM
only reaches a lower correlation of 75.39% with the mean difference at −0.11 and the LoA at −0.73 and 0.52. For
the time-domain parameter TRI, LSTM achieves a correlation of 73.93% in comparison to the ECG. HSMM
has a correlation of 61.28%. No proportional biases can be observed in any of the Bland–Altman plots of all six
parameters.
The LSTM algorithm has generally achieved better results than the HSMM model. It might be additionally of
interest to investigate the dynamic changes of the parameters to determine if the LSTM is also able to reproduce
Scientific Reports | (2021) 11:3025 | https://doi.org/10.1038/s41598-021-81101-1 7
Vol.:(0123456789)www.nature.com/scientificreports/
Overall (percentage
Group neg. (mean ± std.dev.) Group pos. (mean ± std.dev.) difference)
Difference Difference
LSTM ↔ HSMM ↔
ECG LSTM LSTM ECG LSTM HSMM ECG(%) ECG (%)
Heart
Resting 55.81 ± 5.90 55.80 ± 5.86 55.71 ± 5.89 61.56 ± 11.60 61.55 ± 11.61 61.42 ± 11.48 0.16 0.35
Rate (bpm)
Baseline 56.78 ± 7.59 56.79 ± 7.60 56.79 ± 7.61 62.22 ± 11.70 62.61 ± 11.94 61.92 ± 11.84 0.79 0.45
Response 63.26 ± 11.73 62.80 ± 10.81 62.88 ± 11.96 67.12 ± 13.11 65.24 ± 11.69 70.67 ± 17.84 1.98 5.27
CPT
Recovery 55.79 ± 5.99 55.90 ± 6.06 55.92 ± 6.06 60.56 ± 10.84 60.65 ± 11.18 60.19 ± 10.69 0.41 0.41
Mean 58.61 ± 9.38 58.49 ± 8.93 58.53 ± 9.43 63.30 ± 12.24 62.83 ± 11.76 64.26 ± 14.56 1.06 2.08
HF (stand.) Resting 4.45 ± 0.66 4.55 ± 0.64 4.70 ± 0.59 3.91 ± 1.06 4.14 ± 1.07 4.24 ± 0.91 8.17 14.74
Baseline 4.66 ± 0.51 4.87 ± 0.58 5.02 ± 0.72 3.61 ± 1.15 3.73 ± 1.07 3.96 ± 0.89 11.39 21.68
Response 4.14 ± 0.72 4.21 ± 1.06 4.20 ± 0.54 3.84 ± 1.27 4.07 ± 1.17 4.24 ± 1.32 10.04 11.75
CPT
Recovery 4.91 ± 0.92 5.39 ± 0.89 5.33 ± 0.96 3.87 ± 1.34 4.11 ± 1.21 4.45 ± 1.25 11.19 17.88
Mean 4.57 ± 0.80 4.82 ± 0.99 4.85 ± 0.90 3.77 ± 1.26 3.97 ± 1.17 4.21 ± 1.19 10.87 17.10
HF norm
Resting 61.19 ± 6.34 61.80 ± 6.29 62.31 ± 6.35 52.05 ± 10.38 53.61 ± 10.40 53.92 ± 8.25 4.83 8.68
(n.u.)
Baseline 64.60 ± 8.01 65.86 ± 7.32 66.74 ± 7.69 47.29 ± 10.33 48.83 ± 9.15 49.71 ± 8.25 5.26 12.99
Response 57.88 ± 5.26 55.60 ± 5.46 56.58 ± 5.47 55.58 ± 10.44 54.25 ± 9.18 56.42 ± 7.65 4.96 5.45
CPT
Recovery 61.62 ± 8.23 66.56 ± 8.51 62.63 ± 6.80 51.34 ± 13.49 52.75 ± 13.23 55.68 ± 12.43 6.36 10.80
Mean 61.37 ± 7.79 62.67 ± 8.78 61.98 ± 7.90 51.40 ± 12.00 51.94 ± 10.93 53.94 ± 10.13 5.52 9.75
LF (stand.) Resting 2.84 ± 0.64 2.84 ± 0.62 2.88 ± 0.56 3.49 ± 0.57 3.47 ± 0.58 3.55 ± 0.51 4.82 7.48
Baseline 2.60 ± 0.78 2.55 ± 0.70 2.53 ± 0.75 3.86 ± 0.51 3.78 ± 0.66 3.95 ± 0.60 5.86 7.08
Response 3.00 ± 0.52 3.31 ± 0.59 3.25 ± 0.63 2.93 ± 0.70 3.34 ± 0.72 3.14 ± 0.58 16.26 11.79
CPT
Recovery 3.05 ± 0.68 2.70 ± 0.71 3.13 ± 0.49 3.57 ± 0.93 3.62 ± 0.97 3.47 ± 0.89 8.61 12.43
Mean 2.88 ± 0.70 2.85 ± 0.75 2.97 ± 0.71 3.45 ± 0.83 3.58 ± 0.81 3.52 ± 0.78 10.25 10.43
LF/HF ratio Resting 0.67 ± 0.18 0.65 ± 0.18 0.65 ± 0.17 1.04 ± 0.45 0.98 ± 0.44 0.93 ± 0.28 9.43 16.02
Baseline 0.57 ± 0.21 0.54 ± 0.19 0.52 ± 0.21 1.23 ± 0.52 1.13 ± 0.44 1.06 ± 0.32 8.80 21.61
Response 0.74 ± 0.17 0.81 ± 0.17 0.78 ± 0.17 0.87 ± 0.38 0.90 ± 0.37 0.81 ± 0.25 13.42 11.30
CPT
Recovery 0.65 ± 0.20 0.53 ± 0.20 0.61 ± 0.17 1.08 ± 0.53 1.02 ± 0.50 0.89 ± 0.44 11.22 21.44
Mean 0.66 ± 0.21 0.63 ± 0.23 0.64 ± 0.21 1.06 ± 0.51 1.02 ± 0.45 0.92 ± 0.36 11.15 18.12
TRI Resting 11.52 ± 2.93 10.19 ± 2.21 12.39 ± 2.67 11.13 ± 2.75 10.17 ± 2.67 11.41 ± 3.02 17.67 17.43
Baseline 11.08 ± 2.26 9.45 ± 3.06 12.75 ± 2.82 11.09 ± 2.35 11.02 ± 2.76 11.85 ± 4.27 12.92 18.97
Response 12.85 ± 6.26 12.06 ± 4.15 14.43 ± 3.56 12.01 ± 2.87 10.48 ± 2.69 12.70 ± 3.59 14.45 24.16
CPT
Recovery 10.48 ± 2.38 8.58 ± 1.59 11.00 ± 1.37 10.03 ± 2.52 9.49 ± 2.63 10.72 ± 2.97 23.15 11.97
Mean 11.47 ± 4.20 10.03 ± 3.45 12.73 ± 3.07 11.04 ± 2.71 10.33 ± 2.77 11.76 ± 3.74 16.84 18.37
Table 2. Comparison of calculated HRV parameters. The HRV parameters of the reference ECG are compared
to the radar HRV parameters using both the LSTM and HSMM algorithm. The absolute values are compared
for the two groups (mean ± standard deviation), while the mean deviation of the parameters are given for all
test subjects.
the instantaneous variations in response to the stimulation of the CPT. Figure 5 shows a comparison of the HRV
parameters before, during, and after the CPT. Depicted are the mean and standard deviation for each scenario
and each parameter as obtained by the ECG and the LSTM. To emphasise the absolute change of the parameters
in response to the CPT, the data is again split into the positive and negative group. Although there are small
bias errors at Response for LF and for the negative group of TRI, the direction of change can be reconstructed
for all parameters. For the positive group, a small error occurs at TRI but only for the Response scenario. In
summary, the LSTM is able to demonstrate its ability to closely track the changes of the HRV parameters that
are induced by the CPT.
Discussion
We have introduced and validated a method for contactless HRV acquisition using a Six-Port-based radar system
and a bidirectional LSTM model. Compared to other contactless ways of vital sign and HRV measurement such
as cameras51 or laser systems52, radar technology has the advantage that it is independent of surrounding light
and is able to penetrate clothing or other visually non-transparent obstacles.
The possibility of extracting HRV parameters using radar technology has been investigated in g eneral53–57.
Previous works focused mainly on the measurability of HRV indices in a static setting, e.g., when lying or sitting
at rest. However, it has not been investigated if the systems are able to track rapidly changing HRV parameters
in a dynamic setting. To research this aspect, we defined an experimental protocol including not only a resting
measurement but also a subsequent CPT manoeuvre, a commonly used cardiovascular test, which was used to
Scientific Reports | (2021) 11:3025 | https://doi.org/10.1038/s41598-021-81101-1 8
Vol:.(1234567890)www.nature.com/scientificreports/
Figure 3. Scatterplots and Bland–Altman analyses of the parameters heart rate, HF, and HF norm. (A,C,E)
Comparison of LSTM values with reference ECG. (B,D,F) Comparison of HSMM values with reference ECG.
force a sudden change of HRV due to the stimulus of the ANS. We utilised a bistatic radar system to acquire vital
sign data from 25 test subjects, a larger number of test subjects compared to previous studies. Altogether, 683
minutes of data were gathered and analysed extensively. An ECG signal was acquired in parallel which served
as a reference gold standard device for heartbeat detection and HRV calculation.
Previous works utilised the pulse wave component to extract HRV. However, this may complicate precise
beat-to-beat localisation due to the influence of respiration on the shape and configuration of the pulse wave. In
this paper, we firstly evaluated the possibility of HRV extraction using radar heart sound signals. This promises
for higher accuracies since the shape and configuration of the heart sound signal is more distinct and not influ-
enced by respiration. Radar heart sound data were used to determine the RR sequences and HRV parameters
for the radar system. We implemented two algorithms for the task of heartbeat segmentation and beat-to-beat
recognition, a state of the art HSMM algorithm and a bidirectional LSTM network. Several configurations of
the LSTM model were compared using different numbers of layers and hidden units. A two-layer bidirectional
LSTM with 400 and 200 hidden units in the first and second layer demonstrated the best results.
For heartbeat detection, high F1 scores, sensitivities, precisions, and accuracies around 90% ... 99% have been
observed for both algorithms, however, the LSTM algorithm performed around three to seven percentage points
better than the HSMM. Furthermore, HRV indices of the radar system were compared to ECG HRV indices.
Overall, LSTM performed better for both the resting scenario as well as the CPT manoeuvre. When acquiring
parameters such as HF norm or LF/HF ratio, LSTM achieved low deviations of 5.52% and 11.15%, respectively,
for the CPT, while the HSMM had higher deviations of 9.75% and 18.12%. Using scatter and Bland–Altman
plots to compare radar and ECG HRV indices, correlations over 90% could be observed with small offsets and
no proportional biases. We demonstrated that the LSTM algorithm is capable to perform precise heart sound
segmentation in order to track the dynamic changes of HRV before, during, and after the CPT. Our results show
Scientific Reports | (2021) 11:3025 | https://doi.org/10.1038/s41598-021-81101-1 9
Vol.:(0123456789)www.nature.com/scientificreports/
Figure 4. Scatterplots and Bland–Altman analyses of the parameters LF, LF/HF ratio, and TRI. (A,C,E)
Comparison of LSTM values with reference ECG. (B,D,F) Comparison of HSMM values with reference ECG.
that the proposed system is able to track HRV parameters not only in a static resting scenario but also during
sudden changes.
The main benefit of our proposed system is its ability to perform contactless and accurate monitoring of
HRV. Without the need of permanent cabling, this method allows for burden-free long-term monitoring which
is crucial for a medical diagnosis. One of the limitations of this approach is that it is only suited for stationary
usage, e.g., to monitor a person in bed. If the person leaves the bed, the radar will not be able to track the sub-
ject. However, for most use cases, this would not be considered a drawback, e.g., for patient monitoring at the
hospital or for measurements at night in a domestic scenario. Another limitation of our system is random body
movement. During the movement of the subject, heart sound data cannot be measured with high accuracy.
Therefore, HRV cannot be determined for this period of time. Nonetheless, this is no drawback for the scenario
that the system is designed for. During a long-term measurement, e.g., at night, short periods without reliable
data are negligible. Sections containing low quality heart sound signals need to be automatically detected and
discarded from the HRV analysis.
Our presented approach enables precise, touch-free, and continuous monitoring of HRV parameters using a
24 GHz radar system and an LSTM network. The proposed bidirectional LSTM architecture is able to perform
real-time analysis of HRV parameters. This allows for a convenient way of long-term monitoring in a wide range
of everyday applications. In hospitals, where latex or cold foam mattresses are commonly used, the system can
be mounted under the mattress without causing any major impact, provided that the slatted frame has a gap
amping58. Mounting the system above the patient is also possible, since
or does not contribute significantly to d
common blankets can be easily penetrated. Additionally, its low output power, which lies within the limits of
the regulations of the ISM band, makes it suitable for long-term monitoring applications not only in a clinical
Scientific Reports | (2021) 11:3025 | https://doi.org/10.1038/s41598-021-81101-1 10
Vol:.(1234567890)www.nature.com/scientificreports/
Figure 5. Changes of the HRV parameters before, during, and after the CPT. The plots on the left sides show
the values of the positive group whereas the plots on the right sides illustrate the results of the negative group.
For each scenario, the mean and standard deviation is given for both the ECG and the LSTM. (A) Heart rate. (B)
HF. (C) HF norm. (D) LF. (E) LF/HF ratio. (F) TRI.
environment, e.g., for patient monitoring at the general ward, but also in a home-care scenario, e.g., for aftercare
treatment or preventative health care.
Data availability
The data that supports the findings of this study are available upon request from the corresponding author.
Received: 13 November 2020; Accepted: 4 January 2021
References
1. McCraty, R. & Shaffer, F. Heart rate variability: New perspectives on physiological mechanisms, assessment of self-regulatory
capacity, and health risk. Glob. Adv. Health Med. 4, 46–61 (2015).
2. Task Force of the European Society of Cardiology the North American Society of Pacing Electrophysiology. Heart rate variability.
Circulation 93, 1043–1065. https://doi.org/10.1161/01.CIR.93.5.1043 (1996).
3. Shaffer, F. & Ginsberg, J. P. An overview of heart rate variability metrics and norms. Front. Public Health 5, 258 (2017).
4. Shaffer, F., McCraty, R. & Zerr, C. L. A healthy heart is not a metronome: An integrative review of the heart’s anatomy and heart
rate variability. Front. Psychol. 5, 1040 (2014).
5. Rohleder, N., Wolf, J. M., Maldonado, E. F. & Kirschbaum, C. The psychosocial stress-induced increase in salivary alpha-amylase
is independent of saliva flow rate. Psychophysiology 43, 645–652. https://doi.org/10.1111/j.1469-8986.2006.00457.x (2006).
6. Lotufo, P. A., Valiengo, L., Benseñor, I. M. & Brunoni, A. R. A systematic review and meta-analysis of heart rate variability in
epilepsy and antiepileptic drugs. Epilepsia 53, 272–282. https://doi.org/10.1111/j.1528-1167.2011.03361.x (2012).
7. Liao, D., Carnethon, M., Evans, G. W., Cascio, W. E. & Heiss, G. Lower heart rate variability is associated with the development of
coronary heart disease in individuals with diabetes. Diabetes 51, 3524–3531. https://doi.org/10.2337/diabetes.51.12.3524 (2002).
8. Rovere, M. T. L., Bigger, J. T., Marcus, F. I., Mortara, A. & Schwartz, P. J. Baroreflex sensitivity and heart-rate variability in predic-
tion of total cardiac mortality after myocardial infarction. Lancet 351, 478–484. https://doi.org/10.1016/S0140-6736(97)11144-8
(1998).
9. Lan, K.-C., Raknim, P., Kao, W.-F. & Huang, J.-H. Toward hypertension prediction based on PPG-derived HRV signals: A feasibility
study. J. Med. Syst. 42, 103 (2018).
10. Stiller, K. Safety issues that should be considered when mobilizing critically ill patients. Crit. Care Clin. 23, 35–53 (2007).
11. Cohen, I. L. et al. Management of the agitated intensive care unit patient. Crit. Care Med. 30, S97–S123 (2002).
12. Shi, K. et al. Automatic signal quality index determination of radar-recorded heart sound signals using ensemble classification.
IEEE Trans. Biomed. Eng. 67, 773–785. https://doi.org/10.1109/TBME.2019.2921071 (2019).
13. Lee, Y. et al. A novel non-contact heart rate monitor using impulse-radio ultra-wideband (ir-uwb) radar technology. Sci. Rep. 8,
13053. https://doi.org/10.1038/s41598-018-31411-8 (2018).
Scientific Reports | (2021) 11:3025 | https://doi.org/10.1038/s41598-021-81101-1 11
Vol.:(0123456789)www.nature.com/scientificreports/
14. Li, C. et al. A review on recent progress of portable short-range noncontact microwave radar systems. IEEE Trans. Microw. Theory
Tech. 65, 1692–1706. https://doi.org/10.1109/TMTT.2017.2650911 (2017).
15. Mercuri, M. et al. Vital-sign monitoring and spatial tracking of multiple people using a contactless radar-based sensor. Nat. Electron.
2, 252–262 (2019).
16. Shi, K. et al. A contactless system for continuous vital sign monitoring in palliative and intensive care. Conf. Proc. IEEE Int. Syst.
Conf. 2018, 1–8. https://doi.org/10.1109/SYSCON.2018.8369507 (2018).
17. Michler, F. et al. A clinically evaluated interferometric continuous-wave radar system for the contactless measurement of human
vital parameters. Sensors 19, 2492 (2019).
18. Park, J.-Y. et al. Preclinical evaluation of a noncontact simultaneous monitoring method for respiration and carotid pulsation using
impulse-radio ultra-wideband radar. Sci. Rep. 9, 11892. https://doi.org/10.1038/s41598-019-48386-9 (2019).
19. Will, C. et al. Radar-based heart sound detection. Sci. Rep. 8, 11551. https://doi.org/10.1038/s41598-018-29984-5 (2018).
20. Hui, X. & Kan, E. C. Monitoring vital signs over multiplexed radio by near-field coherent sensing. Nat. Electron. 1, 74–78. https://
doi.org/10.1038/s41928-017-0001-0 (2018).
21. Hui, X. & Kan, E. . C. No-touch measurements of vital signs in small conscious animals. Sci. Adv. 5, eaau0169. https://doi.
org/10.1126/sciadv.aau0169 (2019).
22. Will, C. et al. Local pulse wave detection using continuous wave radar systems. IEEE J-ERM 1, 81–89. https://doi.org/10.1109/
JERM.2017.2766567 (2017).
23. Acharya, U. R., Joseph, K. P., Kannathal, N., Lim, C. M. & Suri, J. S. Heart rate variability: A review. Med. Biol. Eng. Comput. 44,
1031–1051 (2006).
24. Berntson, G. G. et al. Heart rate variability: Origins, methods, and interpretive caveats. Psychophysiology 34, 623–648 (1997).
25. Hämmerle, P. et al. Heart rate variability triangular index as a predictor of cardiovascular mortality in patients with atrial fibrilla-
tion. J. Am. Heart Assoc. 9, e016075. https://doi.org/10.1161/JAHA.120.016075 (2020).
26. Kouidi, E., Haritonidis, K., Koutlianos, N. & Deligiannis, A. Effects of athletic training on heart rate variability triangular index.
Clin. Physiol. Funct. Imaging 22, 279–284. https://doi.org/10.1046/j.1475-097X.2002.00431.x (2002).
27. Jovic, A. & Bogunovic, N. Electrocardiogram analysis using a combination of statistical, geometric, and nonlinear heart rate vari-
ability features. Artif. Intell. Med. 51, 175–186 (2011).
28. Malik, M. et al. Influence of the recognition artefact in automatic analysis of long-term electrocardiograms on time-domain
measurement of heart rate variability. Med. Biol. Eng. Comput. 31, 539–544. https://doi.org/10.1007/bf02441992 (1993).
29. Malliani, A., Lombardi, F., Pagani, M. & Cerutti, S. Power spectral analysis of cardiovascular variability in patients at risk for sud-
den cardiac death. J. Cardiovasc. Electrophysiol. 5, 274–286 (1994).
30. Mourot, L., Bouhaddi, M. & Regnard, J. Effects of the cold pressor test on cardiac autonomic control in normal subjects. Physiol.
Res. 58, 83–91 (2009).
31. Wirch, J. L., Wolfe, L. A., Weissgerber, T. L. & Davies, G. A. Cold pressor test protocol to evaluate cardiac autonomic function.
Appl. Physiol. Nutr. Metab. 31, 235–243 (2006).
32. Salahuddin, L., Cho, J., Jeong, M. G. & Kim, D. Ultra short term analysis of heart rate variability for monitoring mental stress in
mobile settings. In Conf. Proc. IEEE Eng. Med. Biol. Soc. (2007), 4656–4659 (2007).
33. Baek, H. J., Cho, C.-H., Cho, J. & Woo, J.-M. Reliability of ultra-short-term analysis as a surrogate of standard 5-min analysis of
heart rate variability. Telemed. J. E. Health 21, 404–414 (2015).
34. Koelpin, A. et al. Six-Port based interferometry for precise radar and sensing applications. Sensors 16, 1556. https: //doi.org/10.3390/
s16101556 (2016).
35. Zhang, Q., Manriquez, A. I., Medigue, C., Papelier, Y. & Sorine, M. An algorithm for robust and efficient location of t-wave ends
in electrocardiograms. IEEE Trans. Biomed. Eng. 53, 2544–2552. https://doi.org/10.1109/TBME.2006.884644 (2006).
36. Vollmer, M. A robust, simple and reliable measure of heart rate variability using relative rr intervals. In 2015 Proc. Comput. Cardiol.,
609–612 (2015).
37. Vollmer, M. Arrhythmia classification in long-term data using relative rr intervals. In 2017 Proc. Comput. Cardiol., 1–4 (IEEE,
New York, 2017).
38. Li, C., Lubecke, V. M., Boric-Lubecke, O. & Lin, J. A review on recent advances in Doppler radar sensors for noncontact healthcare
monitoring. IEEE Trans. Microw. Theory Tech. 61, 2046–2060. https://doi.org/10.1109/TMTT.2013.2256924 (2013).
39. Liang, X., Deng, J., Zhang, H. & Gulliver, T. A. Ultra-wideband impulse radar through-wall detection of vital signs. Sci. Rep. 8,
13367. https://doi.org/10.1038/s41598-018-31669-y (2018).
40. Aardal, Ø. et al. Detecting changes in the human heartbeat with on-body radar. In 2013 Proc. IEEE Rad. Conf., 1–6, https://doi.
org/10.1109/RADAR.2013.6586027 (2013).
41. Mikhelson, I. V., Bakhtiari, S., Elmer, T. W. II. & Sahakian, A. V. Remote sensing of heart rate and patterns of respiration on a sta-
tionary subject using 94-GHz millimeter-wave interferometry. IEEE Trans. Biomed. Eng. 58, 1671–1677. https://doi.org/10.1109/
TBME.2011.2111371 (2011).
42. Shi, K. et al. A dataset of radar-recorded heart sounds and vital signs including synchronised reference sensor signals. Sci. Data
7, 1–12. https://doi.org/10.1038/s41597-020-0390-1 (2020).
43. Schellenberger, S. et al. A dataset of clinically recorded radar vital signs with synchronised reference sensor signals. Sci. Data 7,
1–11. https://doi.org/10.1038/s41597-020-00629-5 (2020).
44. Vinci, G. et al. Six-Port radar sensor for remote respiration rate and heartbeat vital-sign monitoring. IEEE Trans. Microw. Theory
Tech. 61, 2093–2100. https://doi.org/10.1109/TMTT.2013.2247055 (2013).
45. Springer, D. B., Tarassenko, L. & Clifford, G. D. Logistic regression-HSMM-based heart sound segmentation. IEEE Trans. Biomed.
Eng. 63, 822–832. https://doi.org/10.1109/TBME.2015.2475278 (2016).
46. Hochreiter, S. & Schmidhuber, J. Long short-term memory. Neural Comput. 9, 1735–1780 (1997).
47. Shi, K. et al. Segmentation of radar-recorded heart sound signals using bidirectional lstm networks. In Conf. Proc. IEEE Eng. Med.
Biol. Soc. (2019), 6677–6680, https://doi.org/10.1109/EMBC.2019.8857863 (2019).
48. ANSI/AAMI. Testing and reporting performance results of cardiac rhythm and st segment measurement algorithms (2012).
49. Giavarina, D. Understanding Bland Altman analysis. Biochem. Medica 25, 141–151 (2015).
50. Bland, J. M. & Altman, D. Statistical methods for assessing agreement between two methods of clinical measurement. Lancet 327,
307–310 (1986).
51. Poh, M., McDuff, D. J. & Picard, R. W. Advancements in noncontact, multiparameter physiological measurements using a webcam.
IEEE Trans. Biomed. Eng. 58, 7–11 (2011).
52. Cosoli, G., Casacanditella, L., Tomasini, E. & Scalise, L. Evaluation of heart rate variability by means of laser doppler vibrometry
measurements. In J. Phys. Conf. Ser., Vol. 658, 012002 (IOP Publishing, 2015).
53. Massagram, W., Lubecke, V. .M., HØst-Madsen, A. & Boric-Lubecke, O. Assessment of heart rate variability and respiratory sinus
arrhythmia via doppler radar. IEEE Trans. Microw. Theory Tech. 57, 2542–2549 (2009).
54. Nosrati, M. & Tavassolian, N. High-accuracy heart rate variability monitoring using doppler radar based on gaussian pulse train
modeling and FTPR algorithm. IEEE Trans. Microw. Theory Tech. 66, 556–567 (2018).
55. Petrović, V. L., Janković, M. .M., Lupšić, A. .V., Mihajlović, V. .R. . & Popović-Božović, J. .S. High-accuracy real-time monitoring
of heart rate variability using 24 GHz continuous-wave doppler radar. IEEE Access 7, 74721–74733 (2019).
Scientific Reports | (2021) 11:3025 | https://doi.org/10.1038/s41598-021-81101-1 12
Vol:.(1234567890)You can also read