Ground subsidence and heave over permafrost: hourly time series reveal interannual, seasonal and shorter-term movement caused by freezing, thawing ...
←
→
Page content transcription
If your browser does not render page correctly, please read the page content below
The Cryosphere, 14, 1437–1447, 2020
https://doi.org/10.5194/tc-14-1437-2020
© Author(s) 2020. This work is distributed under
the Creative Commons Attribution 4.0 License.

Ground subsidence and heave over permafrost: hourly time series
reveal interannual, seasonal and shorter-term movement caused by
freezing, thawing and water movement
Stephan Gruber
Department of Geography and Environmental Studies, Carleton University, Ottawa, ON, K1S 5B6, Canada

Correspondence: Stephan Gruber (stephan.gruber@carleton.ca)

Received: 29 September 2019 – Discussion started: 1 October 2019
Revised: 22 March 2020 – Accepted: 1 April 2020 – Published: 30 April 2020

Abstract. Heave and subsidence of the ground surface can           1   Introduction
offer insight into processes of heat and mass transfer in freez-
ing and thawing soils. Additionally, subsidence is an im-          The presence, formation and decay of ground ice control
portant metric for monitoring and understanding the trans-         many phenomena in cold regions. Especially at locations
formation of permafrost landscapes under climate change.           with permafrost, large amounts of ground ice can exist and
Corresponding ground observations, however, are sparse and         its decay may have pronounced effects at the terrain sur-
episodic. A simple tilt-arm apparatus with logging incli-          face (Shumskiy and Vtyurin, 1963; Mackay, 1970; Hegin-
nometer has been developed to measure heave and subsi-             bottom, 1973). In recent decades, the interest in observation
dence of the ground surface with hourly resolution and mil-        (Liu et al., 2010; Bartsch et al., 2019) and prediction (Hwang,
limeter accuracy. This contribution reports data from the first    1976; Lee et al., 2014) of ground subsidence has been in-
two winters and the first full summer, measured at three sites     creasing along with the prevalence of ground-ice loss due to
with contrasting organic and frost-susceptible soils in warm       anthropogenic climate change.
permafrost. The patterns of surface movement differ signifi-          The formation and melt of excess ice, the volume of ice
cantly between sites and from a prediction based on the Ste-       in the ground exceeding the total pore volume under natural
fan equation and observed ground temperature. The data are         unfrozen conditions, is an expression of the redistribution of
rich in features of heave and subsidence that are several days     mass and energy and often a major determinant of surface
to several weeks long and that may help elucidate processes        heave and subsidence in response to freezing and thawing of
in the ground. For example, late-winter heave followed by          soil. Excess ice forms through a number of processes (Out-
thawing and subsidence, as reported in earlier literature and      calt, 1971; Rempel et al., 2004), and when it melts, the soil
hypothesized to be caused by infiltration and refreezing of        consolidates (Nixon et al., 1971). These phenomena are su-
water into permeable frozen ground, has been detected. An          perimposed on the volume changes without redistribution of
early-winter peak in heave, followed by brief subsidence, is       mass, which are due to thermal expansion of soil materials
discernible in a previous publication but so far has not been      and the density contrast of water and ice. Together, these pro-
interpreted. An effect of precipitation on changes in surface      cesses define the thermo-hydro-mechanical behavior of the
elevation can be inferred with confidence. These results high-     active layer and permafrost. Challenging the simple distinc-
light the potential of ground-based observation of subsidence      tion of active layer and permafrost (Shur et al., 2005), the
and heave as an enabler of progress in process understanding,      existence of a transition zone points to the importance of its
modeling and interpretation of remotely sensed data.               thermo-hydro-mechanical dynamics for linking surface de-
                                                                   formation, phenomena of thawing and freezing, and climate
                                                                   change. As a consequence, the analysis and simulation of
                                                                   subsidence due to permafrost thaw may require careful at-
                                                                   tention not only to the loss of excess ground ice, but also

Published by Copernicus Publications on behalf of the European Geosciences Union.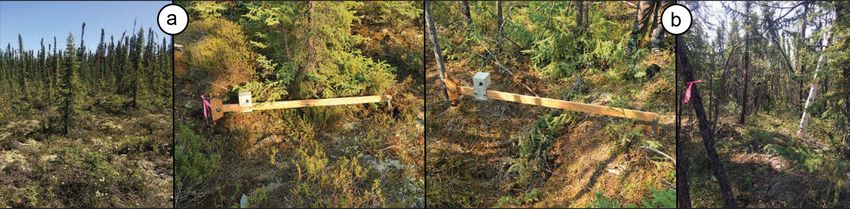
1438                                        S. Gruber: Hourly time series of surface subsidence and heave over permafrost

to the dynamics of its episodic growth. While time series of        test the hypothesis that seasonal vertical ground movement is
ground temperature are widely available but rare for mois-          well approximated by the Stefan model.
ture content, they are nearly nonexistent for surface heave
and subsidence.
   Most in situ and remote observations of surface displace-
ment have frequencies ranging from a few times per year to          2     Background: measuring subsidence and heave
multiannual. A common assumption in the interpretation of
such data is that a seasonal signal is superimposed on, and         2.1    Episodic observation
can be distinguished from, the longer-term trend. When only
decadal-scale change is of interest and clearly dominates in        Methods for observing heave and subsidence at point loca-
the observations available, seasonal or higher-frequency sig-       tions in situ and areally by remote sensing are discussed in
nals may be ignored in data interpretation (e.g., O’Neill et al.,   a recent review (Arenson et al., 2016). Here, the character-
2019; Streletskiy et al., 2017). If, however, their magnitudes      istics of in situ methods are presented to provide context for
are similar or only short time series are available (cf. Anony-     the new method proposed. Elevation change of the soil sur-
mous, 1969), the shape of the seasonal cycle and its adequate       face, or for differing depths beneath the surface when tele-
sampling become important during interpretation. The most           scoping aluminum tubes are used, has been measured rela-
common assumption is that the seasonal progression of sub-          tive to metal or fiberglass rods anchored in permafrost (e.g.,
sidence or heave resembles the square root of accumulated           Mackay et al., 1979; Smith, 1985, 1987; Overduin and Kane,
thawing or freezing degree days, as predicted by the Stefan         2006; O’Neill and Burn, 2012). The accuracies reported are
equation (e.g., Liu et al., 2010; Bartsch et al., 2019). The va-    ±1–5 mm, and the frequency of manual readings ranges from
lidity of this assumption, however, is rarely tested and likely     once every several years to more than 10 times per year.
differs between locations and years.                                   Maximum heave and subsidence, over typically 1 year,
   High-resolution data on ground heave and subsidence can          can be recorded with heave sleeves (Nixon et al., 1995) that
support improved understanding and modeling of the un-              has a typical accuracy of ±10 mm (Nixon and Taylor, 1998).
derlying processes and phenomena. They can complement               These comprise a small section of metal tubing connected to
temperature monitoring with time series of inferred ground-         a grille resting on the ground surface. As the sleeve moves
ice loss or aggradation, an important element of the subsur-        up and down a reference pipe anchored in permafrost, a pro-
face energy balance and ground thermal regime that is often         trusion scratches a painted section on it. Heave sleeves are
neglected in observations. Finally, high-resolution data can        robust and highly efficient for recording long-term change
provide ground truth for other methods of sensing surface           (O’Neill et al., 2019). Optical leveling of markers against
subsidence. The potential of high-resolution measurements           benchmarks has reported accuracies on the order of ±1–
of surface displacement has been demonstrated for environ-          20 mm (e.g., Mackay et al., 1979; Mackay, 1973). Differ-
ments with permafrost and with only seasonally frozen soil          ential GNSS (Global Navigation Satellite System) survey-
(e.g., Overduin and Kane, 2006; Harris et al., 2008). These         ing has reported accuracies of ±9–40 mm (e.g., Little et al.,
studies measured hourly surface displacement with millime-          2003; Lambiel and Delaloye, 2004; Streletskiy et al., 2017).
ter accuracy and revealed subseasonal fluctuations as well as
differences in seasonal patterns between years. As they re-         2.2    Automatic observation
quire sturdy support frames and elaborate data logging sys-
tems, however, such installations are expensive to deploy and       Analogue recorders (Matthews, 1967; Fahey, 1974) and later
maintain.                                                           electronic data loggers with displacement transducers (Mat-
   Better understanding the dynamics of surface displace-           suoka, 1994, 2003; Matsuoka et al., 1997; Hallet, 1998; Har-
ment in response to freeze–thaw processes superimposed on           ris et al., 2007, 2008; Matsumoto et al., 2010) have been
the potential of net subsidence requires methods that can be        used to measure surface elevation relative to deeply anchored
applied at many locations and in the long term. This study          metal frames at hourly intervals. The accuracies reported are
demonstrates a robust and relatively inexpensive candidate          on the order of ±1 mm. In a similar mode of installation, ul-
method for measuring the vertical movement of natural soil          trasonic distance sensors, although affected by the presence
surfaces of about 30 cm × 30 cm with hourly to daily tempo-         of snow and vegetation, have been used to record hourly sur-
ral resolution and millimeter accuracy. This contribution has       face movement with an accuracy of about ±10 mm (Over-
three objectives: (1) to describe the tilt-arm method in terms      duin and Kane, 2006).
of its design and expected accuracy, and to share lessons              In steep unconsolidated materials, subsidence has been re-
learned from its initial deployment; (2) to describe and inter-     vealed from a combination of continuous GNSS and incli-
pret the features visible in tilt-arm data – as heave and sub-      nometer observations (Wirz et al., 2014, 2016a, b) and in
sidence are driven by meteorological forcing but also modu-         bedrock with a combination of multiple crack meters (Hasler
lated by site conditions, the commonalities and contrasts be-       et al., 2012; Weber et al., 2019), where ice loss has also been
tween sites of varying similarity will be examined; and (3) to      inferred from ambient seismic vibration (Weber et al., 2018).

The Cryosphere, 14, 1437–1447, 2020                                                     www.the-cryosphere.net/14/1437/2020/
S. Gruber: Hourly time series of surface subsidence and heave over permafrost                                                    1439

Table 1. Sites details, including coordinates (west, north), serial   ing parts, is simple to build, and is suitable for anchoring
numbers of instruments, active layer thickness (ALT) and the ap-      on borehole casing pipes used for thermal monitoring or as
proximate thickness of the organic layer overlying mineral soil.      benchmarks. The red dots visible on top of the anchor point
                                                                      (Fig. 2b) and the soil attachment (Fig. 2c) facilitate surveying
    Site name         Coordinates       Serial   ALT     Organic      or optical leveling to relate the installation to external bench-
    Evil Peat         114.016, 62.554   5120     1.2 m     1.5 m      marks. This may help to detect if the anchor pole was frost
    Drill the Chill   114.532, 62.457   5121     0.7 m     1.1 m      jacked.
    Active Slayer     114.095, 62.540   5122     1.3 m     0.1 m         A metal pipe with a length of about three meters was in-
                                                                      stalled at each site to provide anchoring in permafrost at
                                                                      depth. After inserting the pipes, the holes were filled with
3     Study area and sites                                            coarse sand to avoid heaving phenomena during refreezing.
                                                                      At a distance of 10 m or less from the tilt arms, soil temper-
The sites instrumented are within 25 km from Yellowknife,             ature has been logged 0.30–0.35 m deep. The digital sensors
Northwest Territories, Canada. Climate is continental sub-            are accurate to ±0.1 ◦ C and measure hourly. Daily total pre-
arctic with a mean annual air temperature of −3.6 ◦ C and             cipitation and snow height are available for the Yellowknife
an average annual precipitation sum of 291 mm observed at             airport (Government of Canada, 2019).
the airport (YZF) during 1971–2000. The maximum mean                     A tilt logger, RST model IC6560, with a microelectrome-
monthly snow depth of 0.39 m is usually reached in February.          chanical system (MEMS) accelerometer and 4 MB of mem-
Permafrost near Yellowknife exists mostly in black spruce             ory is used to record hourly time series of inclination. It
forests underlain by fine-grained frost-susceptible soils and         measures one axis with a range of ±15◦ and has an oper-
in open black spruce forest peatlands (Morse et al., 2016).           ating range of −40 to 60 ◦ C. The instrument has a resolu-
Active layer thicknesses were 0.6–1.2 m at mineral soil sites         tion of ±0.0006◦ and a repeatability of ±0.002◦ as stated by
and 0.5–0.7 m in peatlands.                                           the manufacturer. When applied to a near-horizontal tilt arm
   Three sites were instrumented (Table 1) on 6–8 July 2017.          of 1.5 m this is equivalent to resolving elevation differences
Drill the Chill is in a peatland with open black spruce and           of ±0.015 mm with a repeatability of ±0.045 mm. When
tamarack forest, 8 km west of Yellowknife. The organic layer          mounted on the tilt arm, positive inclination corresponds to
has a thickness of about 1.1 m and is underlain by reworked           lowering of the end embedded in the soil.
glaciolacustrine silt; the active layer is about 0.7 m thick. Evil
                                                                      4.2   Conversion from inclination to elevation difference
Peat is in a peatland with open black spruce and tamarack
forest, 21 km northeast of Yellowknife. The organic layer has         Measured inclination is converted to elevation change based
a thickness of about 1.5 m, followed by an interval of fluvial        on the geometry of the tilt arm (Fig. 3) with L = 1.5 m and
sand with a thickness of 0.35 m and glaciolacustrine silt be-         P = 0.115 m. The vertical distance of the arm’s end from the
low. The active layer is about 1.2 m thick. Active Slayer is          reference point is dYL = sin(α) × L, based on the angle α
located in dense black spruce forest 17 km northeast of Yel-          (◦ ) between the horizontal plane and the inclined arm with
lowknife, with about 0.1 m of organics overlying hummocks             length L. The changing horizontal distance during tilting is
in mineral soil. The active layer is about 1.3 m thick beneath        dX = (1 − cos(α)) × L. The vertical distance between the
hummock tops.                                                         arm’s end and the ground attachment, added√by the double-
                                                                      pivot mechanisms with length P , is dYP = P 2 − dX2 us-
                                                                      ing the Pythagorean theorem. The vertical distance between
4     Materials and methods
                                                                      the reference point and the ground attachment can then be
                                                                      calculated as dY = dYL + dYP or
4.1     Tilt arm
                                                                                       p
                                                                      dY = sin(α)L + P 2 − (1 − cos(α))2 L2 .                  (1)
The vertical movement of the soil surface is measured via
the changing inclination of a tilting arm that connects a ref-
erence point with a small grille buried just beneath the veg-
etation mat at a distance of 1.5 m (Fig. 2). The tilt arm was         4.3   Error from thermal expansion and contraction
constructed from hard wood (aged red oak) to have minimal
thermal expansion and coated with urethane varnish for wa-            The vertical error introduced by thermal expansion of the an-
terproofing. The reference point is given by a pivot attached         chor pipe is εAP = dT βA, with dT (◦ C) being the temper-
to pipe anchored in permafrost at depth. When tilting, the            ature difference causing expansion, β (m (m K)−1 ) the co-
changing horizontal distance between the anchor pipe and              efficient of linear thermal expansion, and A (m) the length
the ground attachment is accommodated by a double-pivot               of the anchor pipe between the permafrost and the elevation
mechanism. This design minimizes the disturbance of the               of the tilt-arm reference point. As permafrost becomes near-
surface and subsurface at the point measured. It has few mov-         isothermal and soft, the actual anchoring point may be deeper

www.the-cryosphere.net/14/1437/2020/                                                        The Cryosphere, 14, 1437–1447, 2020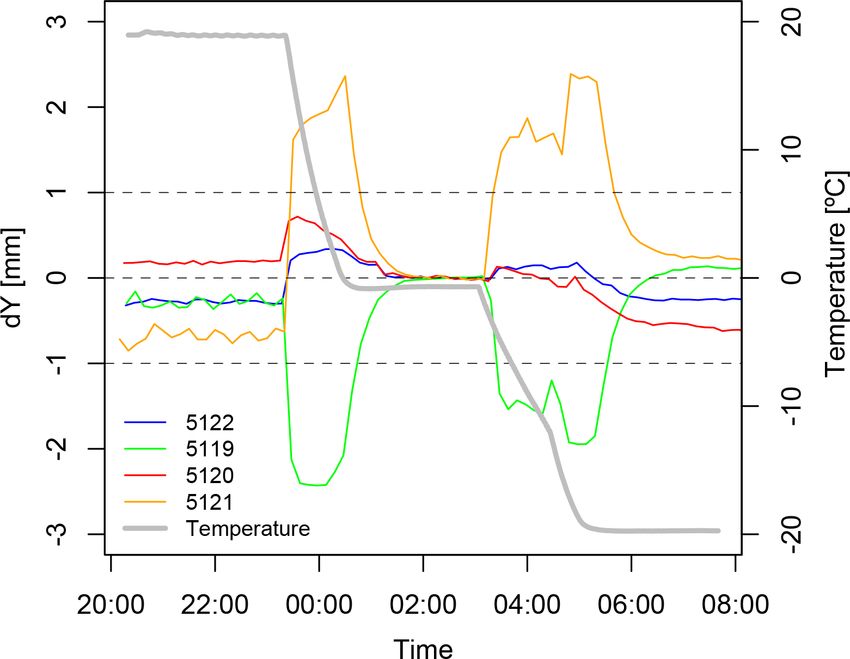
1440 S. Gruber: Hourly time series of surface subsidence and heave over permafrost
Figure 1. Overview images and close-up photographs of ground cover around tilt arms showing the character of the sites instrumented. Site
Evil Peat (a), similar to site Drill the Chill, is in a peatland with open black spruce and tamarack forest. Site Active Slayer (b) is in dense
black spruce forest overlying hummocks in mineral soil.
Figure 3. Geometry of the tilt arm defined by the lengths of the arm
(L) and the double-pivot mechanism (P ). The reference point on
the anchor pipe is shown in red, the end of the tilt arm in blue and
the ground attachment at the end of the double pivot in green. Only
vertical soil movement is measured.
posed above the ground surface be 0.5 m and at the tempera-
ture measured inside the tilt logger. The temperature-related
vertical error introduced by the tilt arm is approximated as
εTA = dY − dY (T ) based on Eq. (1), where dY (T ) denotes
the temperature-affected vertical distance obtained from us-
ing the thermally expanded lengths for the tilt arm L(T ) and
double pivot P (T ). As εTA ∝ α, only values for α = 15◦ are
reported; the tilt arm is assumed to be at the temperature mea-
sured by the logger. The maximum ranges of instantaneous
temperatures in soil (41 ◦ C) and in the logger (85 ◦ C) were
measured at Active Slayer, and for these, estimated errors for
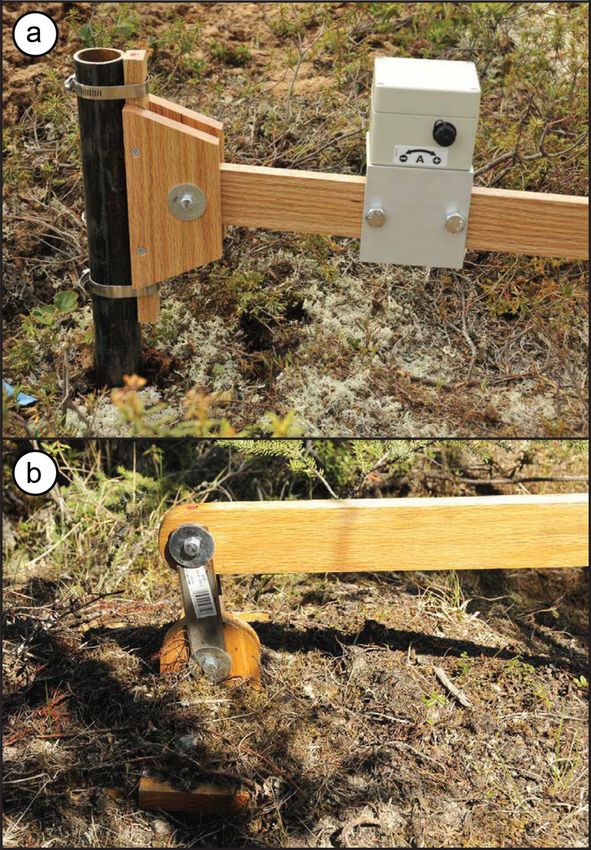
Figure 2. Detailed views on the tilt-arm logger and the attachment typical materials are listed in Table 2. The assumptions on
to the anchor pipe (a) and the double-pivot mechanism (b) just temperature fluctuation and angles are extreme and represent
above the wooden grille inserted beneath the vegetation. See Fig. 1 a deliberately high estimate of error induced by thermal ex-
for an overview image of tilt arms. pansion of the measurement setup. Even so, the combined
error from tilt arm and anchor pipe is ±0.6 mm and, there-
fore, neglected in the results presented.
than the permafrost table. While this may be a problem for
the anchoring of the pipe, temperature fluctuations will be 4.4 Error from temperature stability of tilt meter
subdued. To generate an extreme (high) estimate of εAP , let
the active layer be 1.2 m thick and entirely at the shallow soil Laboratory testing was performed to investigate temperature-
temperature measured, and let the length of anchor pipe ex- related artifacts in the inclination recorded. Instruments were
The Cryosphere, 14, 1437–1447, 2020 www.the-cryosphere.net/14/1437/2020/S. Gruber: Hourly time series of surface subsidence and heave over permafrost 1441
Table 2. Estimated maximum error resulting from thermal expan-
sion of anchor pipe εAP (mm) and tilt arm εTA (mm) for com-
mon materials, together with typical values of the coefficient of lin-
ear thermal expansion β (10−6 m (m K)−1 ). Materials used in this
study are shown in bold font; note that the short double-pivot seg-
ment is made from steel.
Material β εAP εTA
Plastic (ABS, PVC) 80 ±3.74 mm ±1.69 mm
Aluminum 22 ±1.03 mm ±0.46 mm
Steel 12 ±0.56 mm ±0.25 mm
Wood, along grain 3 ±0.14 mm ±0.06 mm
tested in a Caron 7900-25 freeze–thaw chamber at an inclina-
tion of 0◦ while changing temperature from 20 to 0 to −20 ◦ C
with 3 h at each temperature and 2 h for transitions. Tempera- Figure 4. Tilt measured by differing sensors in the laboratory. The
ture was monitored using GeoPrecision M-Log5W-SIMPLE- instruments, identified by their serial numbers, have not been moved
US miniature data loggers with a precision of 0.01 ◦ C and an during the experiment; instrument 5119 is not used in the field. In-
accuracy of ±0.1 ◦ C. Inclination is converted to an equivalent clination is expressed as equivalent elevation change dY assuming
an arm of length 1.5 m as is used in the field.
elevation difference dY = sin(α)×1.5 m for easy comparison
with the field installation (Fig. 4). The stability of inclination
between −20 and 20 ◦ C, after few hours of equilibration, was 4.6 Estimating vertical movement from surface
within ±0.8 mm. In the presence of strong temperature gra- temperature time series based on the Stefan
dients (≈ 10 ◦ C h−1 ), differences up to ±2.5 mm were ob- equation
served. The four tilt loggers tested showed no uniform re-
sponse in their error. By comparison, the manufacturer states Under the assumptions of saturated conditions, negligible
a repeatability equivalent to dY = 0.045 mm; whether this amounts of liquid water in frozen soil and no water move-
includes the effect of variable temperature and temperature ment, the progressive top-down thawing of soil can be related
gradients is unknown. As the laboratory testing is not based to an equivalent subsidence s = zφ(1 − (ρi /ρw )), where z is
on an inclination reference with known accuracy, there is a the thickness of soil thawed, φ is the porosity of the soil, and
possibility that the higher temperature-related error reported ρi and ρw are the densities of ice and water.
here is an artifact of the freeze–thaw chamber deforming dur- The Stefan equation relates the evolution of surface tem-
ing temperature cycles. For the current work, these tests at perature to the progression of the freezing or thawing front
least highlight the importance of temporal temperature gra- in the soil. When the absolute depth of freezing or thawing
dients in affecting tilt measurements, and they provide a con- is required, terms accounting for the thermal conductivity of
servative (high) estimate of the error introduced. the soil between the surface and the frozen/unfrozen inter-
face and for the volumetric latent heat of the soil undergo-
4.5 Data processing ing phase change as well as correction factors to account for
the heat capacity of soil exist (Kurylyk and Hayashi, 2016).
Hourly data are read from the original logger files and con-
Here, only the shape√of the temporal progression of subsi-
verted to elevation differences relative to 15 September 2017.
dence or heave z ∝ I (t) is used, where I (t) is the thaw-
Hourly soil temperatures, recorded by a separate instrument,
ing index as derived from the cumulative summation of daily
are interpolated linearly to the times logged by the tilt me-
positive temperatures or the freezing index based on negative
ters at each location. Hourly data are aggregated to daily val-
temperatures.
ues using the arithmetic mean of soil temperature. For ele-
Freezing indices (◦ C d) for each winter were derived from
vation differences the median is used as it is more tolerant
the sum of negative daily soil temperatures during nine
to extreme values caused by fast heating and cooling. Diur-
months after 1 September and thawing indices for sum-
nal ranges of surface elevation and logger temperature are
mer from positive daily temperatures in nine months after
derived based on the daily minimum and maximum values
1 March. The start and end days of the freezing and thawing
after detrending the original time series with a centered 25 h
seasons are found by using the minimum and maximum of
running mean.
each series, excluding values of zero. For display as time se-
ries, indices are scaled to coincide with the observed surface
elevation on those dates.
www.the-cryosphere.net/14/1437/2020/ The Cryosphere, 14, 1437–1447, 20201442 S. Gruber: Hourly time series of surface subsidence and heave over permafrost
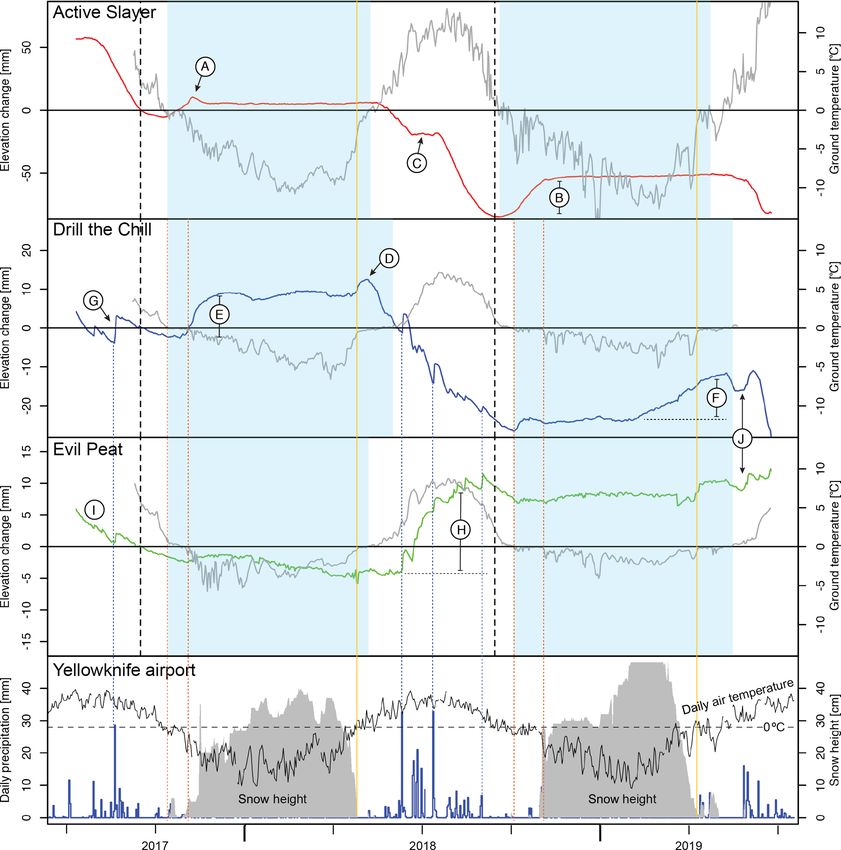
the onset of subsidence, while near-surface ground temper-
ature remains isothermal. This pattern may derive from the
refreezing of snowmelt infiltrating into frozen soil and sub-
sequent progressive thaw that has not yet reached the depth
of the temperature sensor. An initial phase of heave (E), fol-
lowed by minor subsidence, is prominent in the first winter
and detectable in the second. While reminiscent of feature A,
all three instances differ in shape, magnitude and duration.
Toward the end of the second winter, a period of relatively
steady heave and a total magnitude of about 15 mm (F) exists.
While features D and F may be interpreted as phase changes
near the bottom of the active layer, where saturated condi-
Figure 5. Probability density of diurnal vertical movement for all tions are frequently found and freezing would commence
three sites. The height of the curves indicates the relative frequency only late in winter, the relatively rapid rate of heave contrasts
of occurrence of intervals of diurnal vertical movement, for example with the slow progression of freezing and heave to be ex-
those smaller versus larger than 1 mm. pected late in winter based on the Stefan equation.
Sudden heave followed by gradual subsidence is identi-
fied by G, and these features are abundant both at Drill the
5 Results and interpretation Chill and at Evil Peat. For a subset of features, thin blue dot-
ted lines highlight the synchronicity of heave between sites
5.1 Diurnal movement
and with heavy precipitation recorded at the Yellowknife air-
The diurnal range of movement is almost always less than port. This synchronicity and the resemblance of the subsi-
1 mm (Fig. 5), and the diurnal temperature range in the tilt dence phase and recession curves support an attribution to
loggers is mostly less than 30 ◦ C. A significant fraction of hydrologic drivers. As such, also less obvious features ob-
the diurnal oscillation is likely an artifact, related to ther- served need to be considered as possibly related to the water
mally conditioned changes of installation geometry and mea- balance, including lateral flow. This may offer an explanation
surement electronics. This is in line with the error estimates for the anomalous thaw season at Evil Peat, where net heave
presented in Sect. 4.4 and 4.5, and as a consequence, diurnal instead of subsidence was observed in summer 2018 (H) in
patterns are not interpreted here. contrast to the partial summer of 2017 (I). Finally, Drill the
Chill and Evil Peat have a synchronous episode resembling
5.2 Detailed time series a dip (J). Here, subsidence may coincide with the onset of
thaw and heave with the infiltration and refreezing of early
The detailed movement and relevant auxiliary information spring precipitation.
are displayed in Fig. 6. Here, the prominent features iden-
tified in the figure are described, and for some, hypothe- 5.3 Comparison with Stefan equation
ses on their drivers and determinants are formulated. Ap-
proximate near-surface zero-curtain periods, the duration of The observed elevation change deviates from estimates us-
ground freezing and snowpack ripening are inferred visually. ing the Stefan equation. Figure 7 shows observed elevation
At Active Slayer, a short period of increasing heave is off- change and scaled predictions, shifted to coincide with ob-
set partially by subsidence (A) before relative stability for the servations at the start and end of the freezing and thawing
rest of the first winter. In the second winter, there is a simi- seasons. First, the general seasonal evolution of observation
lar initial period of heave (B), followed by long stability. In and model differ in most cases, and in one season, prediction
contrast to the previous year, there is no subsidence after the and observation have opposite signs. Second, some observed
initial heave and the overall amount of heave is about 3 times features of heave and subsidence last several days to several
larger. The start of both periods of stability is synchronous weeks and cannot correspond to the monotonous progression
with the establishment of a thick snow cover (Yellowknife described by the Stefan equation. It is therefore likely, and
airport), although this may be coincidental. During summer, illustrated well by Fig. 6, that processes other than volume
subsidence resembles the shape expected based on the Stefan changes due to the advance of freezing and thawing have ad-
equation but is interrupted by a period of stability (C), and a ditional, and possibly dominating, influence on the observed
similar effect may be visible near the end of the time series. patterns.
This effect may be related to the vertical distribution of ice in
the soil, with a desiccated zone, which does not consolidate
upon thaw, at intermediate depth in the active layer.
At Drill the Chill, a period of heave exists after snow-
pack ripening during the first winter (D). It is followed by
The Cryosphere, 14, 1437–1447, 2020 www.the-cryosphere.net/14/1437/2020/S. Gruber: Hourly time series of surface subsidence and heave over permafrost 1443 Figure 6. Daily elevation change and ground temperature (0.30–0.35 mm) recorded at the three sites, with nearby (
1444                                            S. Gruber: Hourly time series of surface subsidence and heave over permafrost

                                                                            A late-winter dip, similar to feature (J) at Drill the Chill
                                                                         and Evil Peat, was observed previously at sloping and sea-
                                                                         sonally frozen sites (Matsuoka, 1994; Harris et al., 2008)
                                                                         but was not interpreted. These sites had frost-susceptible
                                                                         fines, whereas the observations of (J) were made on or-
                                                                         ganic material at least 1 m thick. Hydrologic control on el-
                                                                         evation change, as hypothesized for (G) and (H), has been
                                                                         described for peat on scales from hours to years (cf. Price
                                                                         and Schlotzhauer, 1999).

                                                                         6.2   Differing environments and applications

                                                                         The vertical movement of the soil surface is, to various de-
                                                                         grees, determined by climate, the characteristics and stratig-
                                                                         raphy of ground materials, hydrology, and possibly veg-
                                                                         etation. The study presented here samples three sites in
                                                                         warm, and likely thawing, permafrost. Many of the inter-
                                                                         esting geocryological phenomena, including summer heave
                                                                         (Mackay, 1983), the growth of segregated near-surface
                                                                         ground ice (O’Neill and Burn, 2012), the formation of in-
                                                                         jection ice (Morse and Burn, 2014), or differential heave and
                                                                         settlement in patterned ground, including experimental site
                                                                         manipulation (Kokelj et al., 2007), may be studied with tilt
                                                                         arms at other locations. Similarly, phenomena of seasonal
                                                                         freezing (e.g., Harris et al., 2008) may be investigated.
                                                                            As permafrost areas progressively enter a state of perva-
                                                                         sive thaw and ground-ice loss, quantifying and understanding
                                                                         surface subsidence and heave becomes increasingly impor-
Figure 7. Visual comparison of observed elevation change (color)         tant. While episodic measurements may reveal multiannual
with predictions (black) based on the Stefan equation and ground         trends, it will likely be high-resolution observations that can
temperature. Solid black lines represent freezing seasons and
                                                                         drive progress in simulation of subsidence and the interpre-
dashed lines thawing seasons. The dotted line for site Evil Peat has
been shifted upwards for clarity, illustrating that the observed thaw-
                                                                         tation of remote sensing data. This method and the results
ing season was accompanied by surface heave, whereas the Stefan          of this study may be relevant for other applications such as
model predicts subsidence. Predictions are scaled and shifted to co-     correcting snow-height observations for the heave and sub-
incide with observations at the start and end of the freezing and        sidence beneath the snow pack, monitoring peatland hydrol-
thawing seasons and, therefore, can only be used to visually assess      ogy and seasonal frost heave in nonpermafrost areas, or pro-
how well they resemble the temporal pattern of elevation but not         viding ground truth for remote sensing studies. The trend of
seasonal magnitude.                                                      decreasing cost for tilt sensors and data logging systems is
                                                                         expected to continue and will make the wide replication of
                                                                         this method increasingly affordable.
horizontal site (Matsuoka, 1994) but not interpreted. At other
seasonally frozen sites (Matsuoka et al., 1997; Matsuoka,                6.3   Improving the tilt-arm setup
2003; Matsumoto et al., 2010) and one in permafrost (Hallet,
1998); however, winters showed gradual early heave, with-                Wood has been chosen as the material for the tilt arm due to
out an early-winter peak. These previously studied sites had             its low coefficient of thermal expansion. However, deterio-
frost-susceptible fines like Active Slayer but negligible veg-           ration of the varnish and ingress of moisture over time may
etation or organic cover.                                                lead to longitudinal expansion of up to 0.4 % (Hann, 1969),
   Late-winter heave followed by thawing and subsidence                  equivalent to an additional elevation error of ±0.2 mm, and
similar to (D) and possibly (F) in Fig. 6 has been reported              also an unknown amount of warping may occur. As a con-
previously (e.g., Matsumoto et al., 2010) and, because of its            sequence, steel pipe is the preferable material for future tilt
association with the zero-curtain period, also hypothesized              arms.
to be caused by infiltration and refreezing of water in perme-              The anchor pipes in this experiment are relatively shallow,
able frozen ground (Matsuoka et al., 1997; Matsuoka, 2003)               and long-term installations will benefit from deep anchoring
or by ice segregation at shallow depths following initiation             because the possibility of upward vertical displacement (frost
of surface thaw (Harris et al., 2008).                                   jacking) has to be taken into account. This is because anchor

The Cryosphere, 14, 1437–1447, 2020                                                          www.the-cryosphere.net/14/1437/2020/
S. Gruber: Hourly time series of surface subsidence and heave over permafrost 1445
pipes embedded insufficiently deep in permafrost may not 4. Interannual, seasonal, and subseasonal patterns of sub-
have the resistance to counteract heaving forces developed sidence and heave differ in magnitude and sign between
in the active layer (cf. Ladanyi and Foriero, 1998). The es- the three sites, despite their proximity. This underscores
tablishment of additional nearby benchmarks, in bedrock or the need to better understand the freeze–thaw processes
with other pipes, is useful to support the regular surveying driving this spatial and temporal heterogeneity. Further-
of the tilt-arm installation. Periodic surveying will allow one more, it points to the importance of remote sensing for
to ascertain the integrity of long time series by demonstrat- investigating spatial patterns of terrain subsidence and
ing no frost jacking or lowering of the pipe due to thaw have heave.
occurred. Given the absence of experience with miniaturized
5. The interpretation of surface movement as a proxy for
tilt loggers operating in cold environments in the long term,
freezing and thawing processes can be confounded by
measuring tilt-arm inclination with a manual inclinometer
hydrologic effects.
or digital level during field visits is advisable as it will per-
mit one to detect if significant sensor drift should occur over
time.
Code and data availability. Field data, including R code to gener-
Lateral movement of the soil can occur on sloping sur- ate the plots, are available from
faces (e.g., Harris et al., 2007) or be caused by lateral hetero- https://doi.org/10.5281/zenodo.3466097 (Gruber, 2019).
geneity (e.g., Kokelj et al., 2007; Kääb et al., 2014). Where
lateral movement occurs, tilt-arm installations may need to
be serviced episodically to maintain a favorable geometry. Competing interests. The author is affiliated with Cryogeeks Ltd, a
Where lateral heterogeneity of materials and ground condi- company that sells the GeoPrecision products mentioned in this ar-
tions is large, e.g. in hummocky terrain or in forest, multiple ticle and develops competing products for the tilt loggers described
arms may be needed to adequately represent one terrain type, here.
and, additionally, the lateral tilt of shallow stakes may reveal
growth or collapse of hummocks. Similarly, an instrument
resembling a heave meter (e.g., Mackay et al., 1979) can be Acknowledgements. Thomas Knecht performed the laboratory
composed of multiple tilt arms to measure differential frost tests. During the field campaign, Emilie Stewart-Jones, Ari-
heave. Finally, given that an influence of water-table fluctu- ane Castagner, Thomas Knecht and Stuart MacDonald helped with
ations was inferred, the direct measurement of water level at drilling and installation of instruments; Rupesh Subedi, Chris-
tian Peart and Nick Brown installed some of the temperature moni-
tilt-arm installations may prove to be valuable.
toring sites used here. The Northwest Territories Geological Survey
supported field logistics, and Steve Kokelj gave advice on site se-
7 Conclusions lection. Bill Leard built the tilt arms and insisted rightfully that they
must have the double pivot. Thank you to Bin Cao, Jayson Eppler
This study demonstrates a simple method for obtaining high- and Steve Kokelj for their comments on the manuscript. Two anony-
resolution time series of surface elevation change and, based mous referees and the editor supported the quality of this paper with
their comments.
on analysis of the data obtained, supports these conclusions:
1. The tilt-arm setup can efficiently monitor surface heave
and subsidence over time. The accuracy of daily me- Financial support. This research has been supported by the Natu-
dian values, conservatively expressed as the maximum ral Sciences and Engineering Research Council of Canada (grant
error expected from the effects of thermal expansion and no. RGPIN-2015-06456). Equipment was available via the project
sensor stability over the entire measurement period, is “Quantifying the Hidden Thaw” supported by the Canada Founda-
±1.4 mm. Hourly values are subject to additional vari- tion for Innovation and the Ontario Research Fund. NSERC Per-
mafrostNet provided additional support.
ation of ±0.5 mm that is largely an artifact from strong
thermal gradients.
2. The observed seasonal patterns differ strongly from the Review statement. This paper was edited by Ylva Sjöberg and re-
prediction of a simple Stefan model and observed near- viewed by two anonymous referees.
surface ground temperature. Consequentially, processes
other than surface-driven phase change in homogeneous
soil are important for explaining surface movement. References
3. High-resolution surface heave and subsidence data re- Anonymous: Mass-balance terms, J. Glaciol., 8, 3–7, 1969.
veal features that may help to elucidate underlying pro- Arenson, L. U., Kääb, A., and O’Sullivan, A.: De-
cesses or to discover similarities in space and time. tection and analysis of ground deformation in per-
Some of these features have been previously observed mafrost environments, Permafrost Periglac., 27, 339–351,
but not interpreted in detail. https://doi.org/10.1002/ppp.1932, 2016.
www.the-cryosphere.net/14/1437/2020/ The Cryosphere, 14, 1437–1447, 20201446 S. Gruber: Hourly time series of surface subsidence and heave over permafrost
Bartsch, A., Leibman, M., Strozzi, T., Khomutov, A., Widhalm, Ladanyi, B. and Foriero, A.: Evolution of frost heaving stresses act-
B., Babkina, E., Mullanurov, D., Ermokhina, K., Kroisleit- ing on a pile, in: Proceedings of Seventh International Confer-
ner, C., and Bergstedt, H.: Seasonal progression of ground ence Permafrost, Collection Nordicana, Yellowknife, 55, 623–
displacement identified with satellite radar interferometry and 633, 1998.
the impact of unusually warm conditions on permafrost at Lambiel, C. and Delaloye, R.: Contribution of real-time kinematic
the Yamal Peninsula in 2016, Remote Sensing, 11, 1865, GPS in the study of creeping mountain permafrost: examples
https://doi.org/10.3390/rs11161865, 2019. from the Western Swiss Alps, Permafrost Periglac., 15, 229–241,
Fahey, B. D.: Seasonal frost heave and frost penetration measure- https://doi.org/10.1002/ppp.496, 2004.
ments in the indian peaks region of the Colorado Front Range, Lee, H., Swenson, S. C., Slater, A. G., and Lawrence, D. M.:
Arctic Alpine Res., 6, 63–70, https://doi.org/10.2307/1550370, Effects of excess ground ice on projections of permafrost
1974. in a warming climate, Environ. Res. Lett., 9, 124006,
Government of Canada: Yellowknife A, daily data reports, available https://doi.org/10.1088/1748-9326/9/12/124006, 2014.
at: http://climate.weather.gc.ca/climate_data/daily_data_e.html? Little, J. D., Sandall, H., Walegur, M. T., and Nelson, F. E.: Appli-
StationID=51058 (last access: 21 July 2019), 2019. cation of differential global positioning systems to monitor frost
Gruber, S.: Data and code to accompany the manuscript “Ground heave and thaw settlement in tundra environments, Permafrost
subsidence and heave over permafrost: hourly time series re- Periglac., 14, 349–357, https://doi.org/10.1002/ppp.466, 2003.
veal inter-annual, seasonal and shorter-term movement caused by Liu, L., Zhang, T., and Wahr, J.: InSAR measurements
freezing, thawing and water movement” (Version initial), Data of surface deformation over permafrost on the North
set, Zenodo, https://doi.org/10.5281/zenodo.3466097, 2019. Slope of Alaska, J. Geophys. Res., 115, F03023,
Hallet, B.: Measurement of soil motion in sorted circles, Western https://doi.org/10.1029/2009JF001547, 2010.
Spitsbergen, in: Proceedings ofthe Seventh International Con- Mackay, J. R.: Disturbances to the tundra and forest tundra envi-
ference on Permafrost, Centre d’études Nordiques, Université ronment of the western Arctic, Can. Geotech. J., 7, 420–432,
Laval, Québec, 55, 415–420, 1998. https://doi.org/10.1139/t70-054, 1970.
Hann, R. A.: Longitudinal shrinkage in seven species of wood, Mackay, J. R.: The growth of pingos, Western Arctic coast, Canada,
Tech. Rep. FPL-0203, Forest Products Laboratory (FPL) USDA, Can. J. Earth Sci., 10, 979–1004, https://doi.org/10.1139/e73-
1969. 086, 1973.
Harris, C., Luetschg, M., Davies, M. C. R., Smith, F., Christiansen, Mackay, J. R.: Downward water movement into frozen ground,
H. H., and Is aksen, K.: Field instrumentation for real-time mon- western arctic coast, Canada, Can. J. Earth Sci., 20, 120–134,
itoring of periglacial solifluction, Permafrost Periglac., 18, 105– https://doi.org/10.1139/e83-012, 1983.
114, https://doi.org/10.1002/ppp.573, 2007. Mackay, J. R., Ostrick, J., Lewis, C. P., and Mackay, D. K.:
Harris, C., Kern-Luetschg, M., Smith, F., and Isaksen, K.: So- Frost heave at ground temperatures below zero degrees
lifluction processes in an area of seasonal ground freez- centigrade, Inuvik, Northwest Territories, Tech. rep.,
ing, Dovrefjell, Norway, Permafrost Periglac., 19, 31–47, https://doi.org/10.4095/104879, 1979.
https://doi.org/10.1002/ppp.609, 2008. Matsumoto, H., Yamada, S., and Hirakawa, K.: Relationship be-
Hasler, A., Gruber, S., and Beutel, J.: Kinematics of steep tween ground ice and solifluction: Field measurements in the
bedrock permafrost, J. Geophys. Res., 117, F01016, Daisetsu Mountains, northern Japan, Permafrost Periglac., 21,
https://doi.org/10.1029/2011JF001981, 2012. 78–89, https://doi.org/10.1002/ppp.675, 2010.
Heginbottom, J.: Some effects of surface disturbance on the Matsuoka, N.: Continuous recording of frost heave and creep on a
permafrost active layer at Inuvik, N.W.T., in: North Ameri- Japanese alpine slope, Arctic Alpine Res., 26, 245–254, 1994.
can contribution: permafrost, second international conference, Matsuoka, N.: Contemporary permafrost and periglaciation in
National Academy of Science, Washington, DC, 649–657, Asian high mountains: an overview, Z. Geomorphol., 47, 145–
https://doi.org/10.1192/bjp.112.483.211-a, 1973. 166, 2003.
Hwang, C. T.: Predictions and observations on the behaviour of a Matsuoka, N., Hirakawa, K., Watanabe, T., and Moriwaki, K.:
warm gas pipeline on permafrost, Can. Geotech. J., 13, 452–480, Monitoring of periglacial slope processes in the Swiss Alps: the
https://doi.org/10.1139/t76-045, 1976. first two years of frost shattering, heave and creep, Permafrost
Kääb, A., Girod, L., and Berthling, I.: Surface kinematics of Periglac., 8, 155–177, https://doi.org/10.1002/(SICI)1099-
periglacial sorted circles using structure-from-motion technol- 1530(199732)8:23.0.CO;2-N, 1997.
ogy, The Cryosphere, 8, 1041–1056, https://doi.org/10.5194/tc- Matthews, B.: Automatic measurement of frost-heave: results from
8-1041-2014, 2014. Malham and Rodley (Yorkshire), Geoderma, 1, 107–115, 1967.
Kokelj, S. V., Burn, C. R., and Tarnocai, C.: The struc- Morse, P. D. and Burn, C. R.: Perennial frost blisters of the outer
ture and dynamics of earth hummocks in the subarc- Mackenzie Delta, western Arctic coast, Canada, Earth Surf. Proc.
tic forest near Inuvik, Northwest Territories, Canada, Arct. Land., 39, 200–213, https://doi.org/10.1002/esp.3439, 2014.
Antarct. Alp. Res., 39, 99–109, https://doi.org/10.1657/1523- Morse, P. D., Wolfe, S. A., Kokelj, S. V., and Gaanderse,
0430(2007)39[99:TSADOE]2.0.CO;2, 2007. A. J.: The occurrence and thermal disequilibrium state of per-
Kurylyk, B. L. and Hayashi, M.: Improved Stefan equation cor- mafrost in forest ecotopes of the Great Slave Region, North-
rection factors to accommodate sensible heat storage during west Territories, Canada, Permafrost Periglac., 27, 145–162,
soil freezing or thawing, Permafrost Periglac., 27, 189–203, https://doi.org/10.1002/ppp.1858, 2016.
https://doi.org/10.1002/ppp.1865, 2016. Nixon, F. M. and Taylor, A. E.: Regional active layer monitoring
across the sporadic, discontinuous and continuous permafrost
The Cryosphere, 14, 1437–1447, 2020 www.the-cryosphere.net/14/1437/2020/S. Gruber: Hourly time series of surface subsidence and heave over permafrost 1447 zones, Mackenzie Valley, northwestern Canada, Proceedings of Smith, D. J.: Frost-heave activity in the Mount Rae area, Canadian the Seventh International Conference on Permafrost, 815–820, Rocky Mountains, Arctic Alpine Res., 19, 155–166, 1987. 1998. Smith, M. W.: Observations of soil freezing and frost heave at Inu- Nixon, F. M., Taylor, A. E., Allen, V. S., and Wright, F.: Active vik, Northwest Territories, Canada, Can. J. Earth Sci., 22, 283– layer monitoring in natural environments, lower Mackenzie Val- 290, https://doi.org/10.1139/e85-024, 1985. ley, Northwest Territories, in: Current Research 1995-B, 99–108, Streletskiy, D. A., Shiklomanov, N. I., Little, J. D., Nel- 1995. son, F. E., Brown, J., Nyland, K. E., and Klene, A. E.: Nixon, J. F., Morgenstern, N. R., and Nixon, J. F.: One-dimensional Thaw subsidence in undisturbed tundra landscapes, Bar- consolidation of thawing soils, Can. Geotech. J., 8, 558–565, row, Alaska, 1962–2015, Permafrost Periglac., 28, 566–572, https://doi.org/10.1139/t71-057, 1971. https://doi.org/10.1002/ppp.1918, 2017. O’Neill, H. B. and Burn, C.: Physical and temporal factors con- Weber, S., Fäh, D., Beutel, J., Faillettaz, J., Gruber, S., and Vieli, trolling the development of near-surface ground ice at Illisarvik, A.: Ambient seismic vibrations in steep bedrock permafrost used western Arctic coast, Canada, Can. J. Earth Sci., 49, 1096–1110, to infer variations of ice-fill in fractures, Earth Planet. Sc. Lett., https://doi.org/10.1139/e2012-043, 2012. 501, 119–127, https://doi.org/10.1016/j.epsl.2018.08.042, 2018. O’Neill, H. B., Smith, S. L., and Duchesne, C.: Long- Weber, S., Beutel, J., Da Forno, R., Geiger, A., Gruber, S., Gsell, term permafrost degradation and thermokarst subsidence in T., Hasler, A., Keller, M., Lim, R., Limpach, P., Meyer, M., the Mackenzie Delta area indicated by thaw tube mea- Talzi, I., Thiele, L., Tschudin, C., Vieli, A., Vonder Mühll, surements, in: Cold Regions Engineering 2019, Ameri- D., and Yücel, M.: A decade of detailed observations (2008– can Society of Civil Engineers, Reston, VA, 1, 643–651, 2018) in steep bedrock permafrost at the Matterhorn Hörn- https://doi.org/10.1061/9780784482599.074, 2019. ligrat (Zermatt, CH), Earth Syst. Sci. Data, 11, 1203–1237, Outcalt, S. I.: An algorithm for needle ice growth, Water Resour. https://doi.org/10.5194/essd-11-1203-2019, 2019. Res., 7, 394–400, https://doi.org/10.1029/WR007i002p00394, Wirz, V., Beutel, J., Gruber, S., Gubler, S., and Purves, R. 1971. S.: Estimating velocity from noisy GPS data for investigat- Overduin, P. P. and Kane, D. L.: Frost boils and soil ice con- ing the temporal variability of slope movements, Nat. Hazards tent: field observations, Permafrost Periglac., 17, 291–307, Earth Syst. Sci., 14, 2503–2520, https://doi.org/10.5194/nhess- https://doi.org/10.1002/ppp.567, 2006. 14-2503-2014, 2014. Price, J. S. and Schlotzhauer, S. M.: Importance of shrink- Wirz, V., Geertsema, M., Gruber, S., and Purves, R. S.: Tempo- age and compression in determining water storage ral variability of diverse mountain permafrost slope movements changes in peat: the case of a mined peatland, Hydrol. derived from multi-year daily GPS data, Mattertal, Switzer- Proc., 13, 2591–2601, https://doi.org/10.1002/(SICI)1099- land, Landslides, 13, 67–83, https://doi.org/10.1007/s10346- 1085(199911)13:163.0.CO;2-E, 1999. 014-0544-3, 2016a. Rempel, A. W., Wettlaufer, J. S., and Worster, M. G.: Premelting dy- Wirz, V., Gruber, S., Purves, R. S., Beutel, J., Gärtner-Roer, namics in a continuum model of frost heave, J. Fluid Mech., 498, I., Gubler, S., and Vieli, A.: Short-term velocity varia- 227–244, https://doi.org/10.1017/S0022112003006761, 2004. tions at three rock glaciers and their relationship with me- Shumskiy, P. A. and Vtyurin, B. I.: Underground ice, in: Interna- teorological conditions, Earth Surf. Dynam., 4, 103–123, tional Permafrost Conference, 108–113, 1963. https://doi.org/10.5194/esurf-4-103-2016, 2016b. Shur, Y., Hinkel, K. M., and Nelson, F. E.: The transient layer: implications for geocryology and climate-change science, Per- mafrost Periglac., 16, 5–17, https://doi.org/10.1002/ppp.518, 2005. www.the-cryosphere.net/14/1437/2020/ The Cryosphere, 14, 1437–1447, 2020
You can also read