Killer whales are attracted to herring fishing vessels - Inter ...
←
→
Page content transcription
If your browser does not render page correctly, please read the page content below
Vol. 652: 1–13, 2020                  MARINE ECOLOGY PROGRESS SERIES
                                                                                                         Published October 15
https://doi.org/10.3354/meps13481                   Mar Ecol Prog Ser

                                                                                                           OPEN
                                                                                                           ACCESS
FEATURE ARTICLE

Killer whales are attracted to herring fishing vessels
   Evert Mul1,*, Marie-Anne Blanchet1, 5, Brett T. McClintock2, W. James Grecian3,
                         Martin Biuw4, Audun Rikardsen1
       1
         Faculty of Biosciences, Fisheries and Economics, UiT The Arctic University of Norway, 9037 Tromsø, Norway
             2
              Marine Mammal Laboratory, NOAA/NMFS Alaska Fisheries Science Center, Seattle, WA 98115, USA
          3
           Sea Mammal Research Unit, Scottish Oceans Institute, University of St Andrews, St Andrews KY16 8LB, UK
4
 Institute of Marine Research, FRAM − High North Research Centre for Climate and the Environment, 9007 Tromsø, Norway
                             5
                                 Present address: Norwegian Polar Institute, 9296 Tromsø, Norway

ABSTRACT: Marine mammals and fisheries often tar-
get the same resources, which can lead to operational
interactions. Potential consequences of operational
interaction include entanglements and damaged or
reduced catches but also enhanced foraging opportu-
nities, which can attract marine mammals to fishing
vessels. Responsible fisheries management therefore
requires detailed knowledge of the impact of these
interactions. In northern Norway, killer whales Orcinus
orca are frequently observed in association with large
herring aggregations during the winter. We use a
combination of biotelemetry and fisheries data to
study if, to what extent and at what distances killer
whales are attracted to fishing activity. Twenty-five             In northern Norway, killer whales often forage near herring
satellite transmitters were deployed on killer whales             fisheries during the winter, as the fisheries may present
at herring overwintering and spawning grounds,                    beneficial foraging opportunities for them.
often near fishing vessels. Over 50% of the killer                                                                    Photo: Evert Mul
whale core areas of high usage overlapped with the
fisheries core areas, and individual whales spent up to
34% of their time close to active fishing. We used a 3-
state hidden Markov model to assess whether killer
whale movements were biased towards fishing activi-
ties. Of the overall whale movements, 15% (CI = 11−                                    1. INTRODUCTION
21%) were biased towards fishing activities, with
marked heterogeneity among individuals (0−57%).                      Commercial fisheries are present in all the world’s
During periods of active fishing, whale movements                 oceans and can affect marine wildlife and ecosys-
were biased towards fishing events 44% (CI = 24−                  tems in various ways (Botsford 1997). Marine top
66%) of the time, with individual percentages ranging
                                                                  predators, such as marine mammals, seabirds, sharks
from 0 to 79%. Whales were more likely to be at-
                                                                  and sea turtles, often inhabit the same regions and
tracted when they were within 20 km. This informa-
tion can be used in fishery management to consider                share resources with a variety of fisheries. As a
potential consequences for fishers and whales.                    result, their movements overlap temporally and spa-
                                                                  tially, leading directly to operational interactions,
KEY WORDS: Fishery interactions · Killer whales ·                 which are defined as direct contacts with operational
Orcinus orca · Herring fishery · Behaviour · Hidden               fishing gear (Northridge 1991, Read et al. 2006, Read
Markov model · momentuHMM · Attraction                            2008). Over the last decades, increasing fishing
                                                                  © E. Mul, M.-A. Blanchett, W. J. Grecian, M. Biuw, A Rikardsen and,
*Corresponding author: evert.mul@uit.no                           outside the USA, the US Government 2020. Open Access under Cre-
                                                                  ative Commons by Attribution Licence. Use, distribution and reproduc-
                                                                  tion are unrestricted. Authors and original publication must be credited.
                                                                  Publisher: Inter-Research · www.int-res.com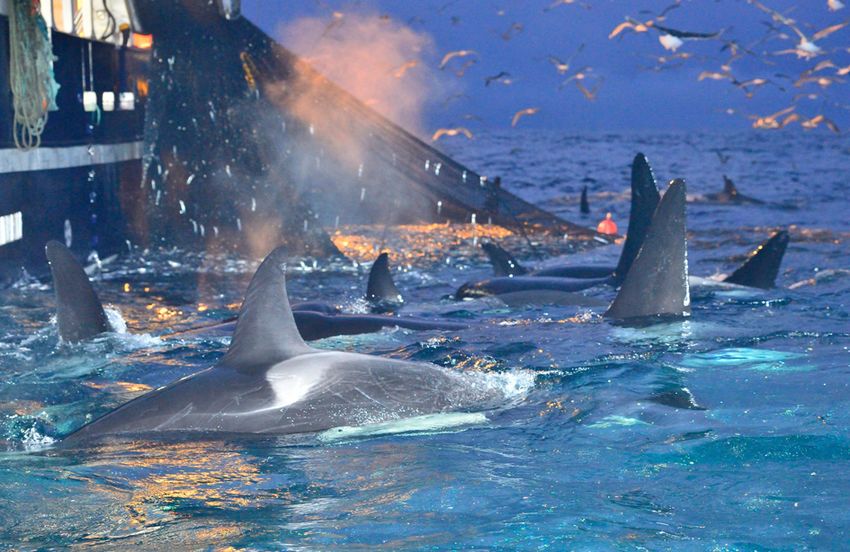
2                                          Mar Ecol Prog Ser 652: 1–13, 2020

activities have caused increased operational inter-          their primary prey species: Norwegian spring-
actions between fisheries and marine top predators           spawning (NSS) herring (Clupea harengus), which is
(Read et al. 2006, Read 2008, Northridge et al. 2017).       the largest herring stock in the northeastern Atlantic
   Consequences of these interactions can be neutral         (Dragesund et al. 1980, Similä et al. 1996, Kuningas et
(no effect), positive or negative for either the animals,    al. 2014, Jourdain et al. 2019). A large portion of the
the fisheries or both. Top predators may benefit from        NSS herring stock often overwinters close to the Nor-
fisheries, as fishing activity may provide good              wegian coast (Nøttestad & Axelsen 1999, Huse et al.
foraging opportunities by immobilizing or aggregat-          2010, Rikardsen 2019). These winter aggregations
ing prey or by relocating prey to the surface. Pre-          have attracted large numbers of killer whales since the
dators can either take fish that have been captured by       1980s and humpback whales Megaptera novae-
the fishers (depredation) or target discarded or es-         angliae since 2011 (Similä et al. 1996, Jourdain & Von-
caped fish or fish that aggregate around a fishing net       graven 2017). After the winter, herring migrate south-
(Söffker et al. 2015, Tixier et al. 2019). As a result,      wards to spawn off the coast of western Norway
some species are attracted to fishing activity. Similarly,   (Huse et al. 2010). NSS herring is also an important
fishers may also be attracted to top predators, which        commercial species, with a quota of 400 000 t in 2020.
might lead them to commercially important prey spe-          Purse seine fishing vessels congregate in the fjords
cies (Escalle et al. 2015). However, operational inter-      during the winter (November−January) and overlap
actions can also have adverse consequences. Fisheries        with killer whales and other top predators (Rikardsen
may lose revenue due to depredation or competition,          2019). However, little is known about the level of
lost or damaged fishing gear or increased operation          overlap and the nature of interactions between killer
time (Kock et al. 2006, Güçlüsoy 2008, Tixier et al.         whales and herring fishing activity in northern Nor-
2019). A wide range of seabirds, sea turtles, sharks         way. The killer whales appear to be attracted to fish-
and marine mammals die in various fishing gears              ing activity during the winter herring aggregations
around the world as a result of operational interactions     but to what extent, how often, and from what dis-
(Moore et al. 2009, Abdulqader et al. 2017, Northridge       tances remains unclear. Such knowledge should be
et al. 2017, Carretta et al. 2019). The foraging benefits    considered when managing coastal fisheries.
near fishing activity can provide long-term effects for         The main objective of this study was to describe
the killer whale population, such as increased calving       and quantify fine-scale overlap between herring
rate (Tixier et al. 2015). Ultimately, these effects can     fisheries and killer whale movements in northern
cascade through the ecosystem in which the killer            Norway during and after winter herring aggrega-
whales are the top predator. Studying the short-term         tions, based on killer whale satellite tags and fishing
behavioural response of killer whales to fisheries can       vessel data. More specifically, our aims were to (1)
help to identify long-term consequences that fisheries       identify areas of overlap between fishing activities
may have on killer whales in Norway. Little is known         and killer whales, (2) explore in detail the level of
about the mechanisms behind the interaction between          overlap in the fjords during the winter and offshore
fisheries and marine mammals and how animal be-              during the spring, and (3) investigate to what extent
haviour is influenced by the presence of fishery             killer whales are attracted to fishing vessels, how
activity (Richard et al. 2020). Studying the interaction     often they are attracted and from what distances.
between fisheries and marine mammals requires fine-
scale animal movement data, which can be used to
detect changes in the movement that may be induced                      2. MATERIALS AND METHODS
by the fisheries (Mathias et al. 2012, Straley et al.
2014, Towers et al. 2019, Richard et al. 2020).                         2.1. Killer whale instrumentation
   Killer whales Orcinus orca are highly mobile, glob-
ally distributed predators. In Norway, killer whales           We equipped 25 killer whales with Argos satellite
interact with industrial purse seine herring fisheries       tags (Limpet SPOT 6/240, Wildlife Computers). The
by feeding around the nets (Similä 2005, Rikardsen           tags measured 54 × 46 × 20 mm and were surface
2019). A recent estimate suggests that 15 056 killer         mounted with 2 subdermal 68 mm titanium anchors.
whales (CV = 0.293, 95% CI = 8423−26 914) inhabit            Tags were specifically deployed close to the middle of
the northeastern Atlantic (Leonard & Øien 2020), with        the dorsal fin, as this position yields better position data
more than 1100 known individuals in Norwegian wa-            compared to a lower-placed tag (Mul et al. 2019). All
ters (https://www.norwegianorca-id.no). Killer whale         killer whales were adult males, with the exception of 1
movements in Norway have been associated with                adult female. We used a 26 ft open rigid inflatable boat
Mul et al.: Killer whale attraction to fishing activity 3
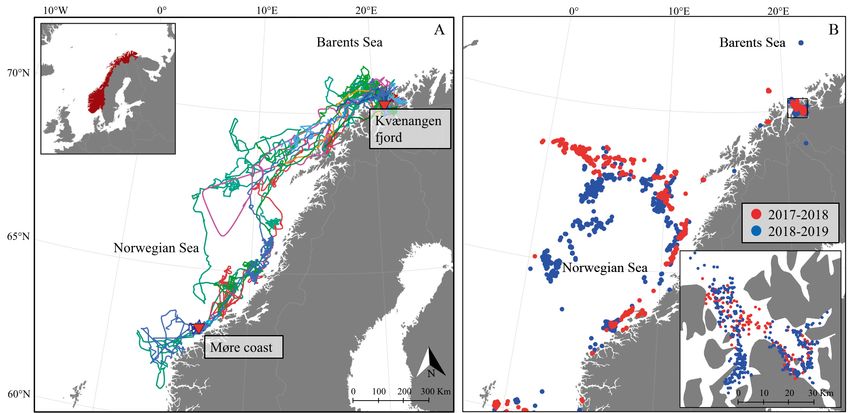
Fig. 1. (A) Northern Europe, showing the 2 tagging locations in Norway (red triangles). During the winter of 2017−2018, 11
killer whales were tagged in Kvænangen fjord. During the winter of 2018−2019, 10 killer whales were tagged in Kvænangen
fjord, and 4 whales were tagged near the coast of Møre. The colored lines represent individual whale tracks. The inset shows
Norway in a larger geographical extent. (B) Herring fishery locations in 2017−2018 and 2018−2019 during the periods when
killer whale tags were in operation. The inset shows Kvænangen fjord
and an air rocket transmitter system tag applicator 2.2. Fisheries data
(https://restech.no) with 7 to 10 bar pressure at a dis-
tance of about 5 to 10 m. The tags were programmed Electronic catch diaries from the fishing vessels
to transmit 14 to 15 messages per hour for the first 40 were reported to the Norwegian Directorate of Fish-
to 45 d. The number of transmissions was reduced to eries (https://www.fiskeridir.no). We obtained these
8−10 h–1 for the following 35 to 45 d and to 55 trans- data with masked vessel identification, through the
missions per day for the remaining lifespan of the bat- Institute of Marine Research (https://www.hi.no). In
tery. We deployed 11 tags between 2 December 2017 this study, we focused only on purse seine herring
and 20 January 2018 (hereafter first study period) and fishing vessels. NSS herring are caught throughout
10 tags between 26 October 2018 and 23 January the year but with a peak winter season between
2019 (hereafter second study period) in Kvæn- October and January. According to our data, 189
angen fjord in northern Norway (Fig. 1A, Table 1). In purse seine vessels made approximately 3500 fish-
addition, 4 tags were deployed between 16 and 17 ing trips in 2017. The fleet consists primarily of
February 2019 off the coast of Møre in the western small vessels that are between 20 and 40 m in
part of Norway (Fig. 1A, Table 1). Killer whales were length and large vessels that are between 60 and 80
tagged in different locations, in different social m in length. The latter operated primarily offshore.
groups and around different fishing vessels to avoid We only obtained fishery data that overlapped in
tagging multiple animals in the same social group. time with the killer whale tracking data (Fig. 1B).
The techniques used in this study have previously The data consisted of fishing locations, start and
been shown to have little or no long-term effect on end times of each fishing event and catch size. A
the demography and behaviour of the killer whales fishing event is defined as starting when the nets
(Reisinger et al. 2014). Tagging procedures were are set and ending when the nets are completely
approved by the Norwegian Food Safety Authority hauled onto the fishing vessel. However, based on
(https://www.mattilsynet.no, permit: FOTS-ID 14135) communication with fishers and with the Directorate
and evaluated in the field by an accredited veterinar- of Fisheries, there is some variation among fishers
ian (Mattilsynet Report no. 2017/279575). regarding the reporting of these events. In addition,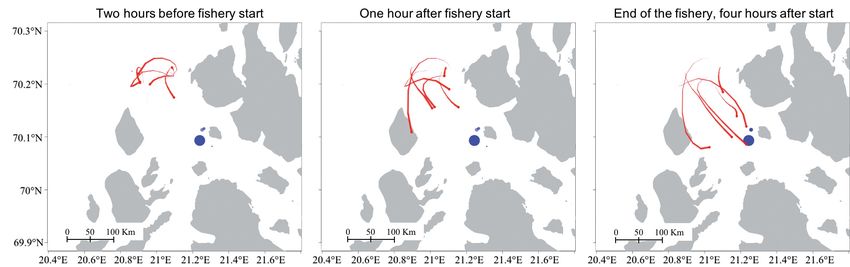
4                                            Mar Ecol Prog Ser 652: 1–13, 2020

Table 1. Detailed overview of raw killer whale data, tag performance, reconstructed whale tracks (based on a correlated
                               random walk) and number of locations near fishing activity

    Location                               Raw locations                               Reconstructed path
                  Whale        Tagging        No.    Tracking   Average       No. of Cumulative     No. of      No. of
                   ID            date         of     duration     no. of     hourly   distance   locations    locations
                            (dd/mm/yyyy)   locations    (d)     locations   locations   (km)
Mul et al.: Killer whale attraction to fishing activity 5
per function from the momentuHMM package as 100 km. This distance is an overestimation of the
(McClintock & Michelot 2018). All results based on maximum distance at which killer whales can either
the 30 realisations of each track were pooled using detect fishing activity or react to it. An event at a dis-
standard multiple imputation formulae (e.g. Rubin tance of 100 km is unlikely to trigger an attraction
1987). All data processing and analyses were per- response because it would take a killer whale 10 h to
formed with R statistical computing software, version reach it at a maximum sustained speed of 10 km h–1
4.0.0 (R Core Team 2019). (Williams & Noren 2009). In addition, killer whales
were most likely unable to detect audible cues from
fishing activity at a distance of 100 km. For example,
2.4. Large-scale overlap between whale Erbe (2002) found that small whale-watching motor-
movements and fishing activity boats were only audible to killer whales at distances
up to 16 km. We defined close proximity to fishing
We calculated the size of the areas of overlap activity as any location that was within 3 km of fish-
between whales and fisheries distributions for each ing activity, to account for the uncertainty in the
study period separately by identifying areas where whale locations and because fishing events within
killer whales and fishing events were more likely to 3 km were grouped.
occur. These core areas (CAs) were estimated by cal- To assess when killer whales arrived relative to
culating the 50% contour of the utilisation distribu- the start of the fishing activity, we calculated the
tion (UD) for fishing events and killer whales. The percentage of close encounters where whales
UD is an estimation of the probability density of an arrived after the start of the fishing activity. If killer
animal’s occurrence in space (Samuel et al. 1985). whales are attracted to fishing activity, they should
The fisheries UDs were calculated for each study not respond before the start. However, in some
period, based on a least squares cross-validation cases, a fishing vessel might have been present at
kernel method (Worton 1989, Horne & Garton 2006), the fishing location even before the reported start of
using the adehabitatHR package in R (Calenge the fishing activity. For example, searching time
2006). Since the killer whale data were based on con- and preparations for the fishery were not included
secutive locations rather than independent points in the reported fishing time. It is possible that killer
such as the fishery data, we used a Brownian bridge whales have learnt to associate these activities with
method to calculate killer whale UDs (Horne et al. an upcoming fishing activity, and they may there-
2007). We first calculated the UD for each of the fore be attracted to the fishing location even before
30 imputations for each whale over a 1 × 1 km grid, the reported start of the fishery. For this reason, we
using the BBMM package in R (Nielson et al. 2013). performed this analysis twice, once with the
We then calculated an average individual UD and reported start of the fisheries and once with the
finally a cumulative UD per study period, by sum- reported start minus 2 h.
ming individual UDs. The spatial overlap between
herring fisheries and whale movements was calcu-
lated as the percentage of the killer whale CA that 2.6. Whale behaviour
overlapped with the fisheries CA. In addition, we cal-
culated percentages of fisheries catches and fishing The effect of fishing activity on whale behaviour
events within the killer whale CA for each study was assessed using a hidden Markov model
period. (HMM). HMMs are discrete state space models
that can be used to identify an unknown underlying
state, such as a behavioural mode, based on indi-
2.5. Fine-scale overlap between killer whales rect measures such as turning angle and Euclidean
and fishing activity distance (step length) between consecutive loca-
tions (Langrock et al. 2012). Whale behaviour was
Overlap between whale movements and fishing categorised by the HMM into N = 3 states: travel-
activity on a finer scale was quantified by combining ling movement (state 1), area-restricted movement
spatial overlap and temporal overlap. We calculated (state 2) and attraction to the nearest fishing
how many killer whale locations were within the activity (state 3). Traveling movement was modelled
detection range of fishing activity and how many of as a correlated random walk with longer step
these locations were in close proximity to fishing lengths ((relative to area-restricted movements),
activity. The maximum detection range was defined area-restricted movement as a simple random walk6 Mar Ecol Prog Ser 652: 1–13, 2020
and attraction as a biased random walk (with bias state transition probabilities. For the best supported
directed towards the nearest fishing activity). We model, we used global state decoding (based on the
used a gamma distribution to describe the step Viterbi algorithm) to infer the most likely sequence
lengths and a von Mises distribution to describe the of states. Stationary probabilities were used to
turning angles, using the distance and angle assess overall state probabilities as a function of any
towards the nearest fishing activity as covariates on covariates. Goodness of fit for the best supported
the parameters. Given the wide range of distances model was assessed by visually examining pseudo-
to fishing activity ( yielded 14 791 hourly locations. During the first
km). We similarly included linear and quadratic study period, 97 952 t of herring were caught in 566
effects of the Euclidean distance between locations fishing activities. During the second study period,
and the nearest fishing activity on the turn angle 278 735 t of herring were caught in 1172 fishing
concentration parameter of the von Mises distribu- activities. Fishery events lasted between 4 and
tion for the attraction state (κ3 to investigate potential 18 h, with a mean of 6.55 h (SD = 1.67) or 6.72 h
distance effects on the strength of bias towards fish- (SD = 1.70) for the first and second study periods,
ing activity: respectively. Reported single catch sizes varied
κ 3 = exp ( α 0 + β1xt + β2 xt2 )
between 1 and 2442 t, with a median of 140 t.
(2)
Models were fitted by maximum likelihood using
the R Package momentuHMM version 1.5.1 3.2. Large-scale overlap between whale
(McClintock & Michelot 2020). We specified weakly distribution and fishing activity
informative Normal(0,100) prior constraints on αij
and βij to improve the numerical stability of the opti- During both study periods, the main killer whale
misation in the event any of the state transition CA was located in Kænangen fjord, the principal
probability estimates fell near a boundary. Move- tagging area. In addition, smaller offshore areas
ment parameters were independently estimated for were included in the northern and southern parts
each of the 30 imputations and then pooled. We of Norway including off the Møre county, where 4
used Akaike’s information criterion (AIC; Burnham individuals were tagged (Figs. 1 & 2). During the
& Anderson 2002) to evaluate the strength of evi- first and second study periods, 53 and 93%, respec-
dence for distance effects on the strength of bias tively, of the whale CAs overlapped with the fish-
across the 30 imputations. Since changing the tran- eries. In these areas of overlap, 16 and 32% of the
sition probability formula would result in different total herring catches were fished, respectively rep-
prior constraints, we were not able to use AIC to resenting 30 and 38% of the fishing events for each
compare models with different structures for the period.Mul et al.: Killer whale attraction to fishing activity 7
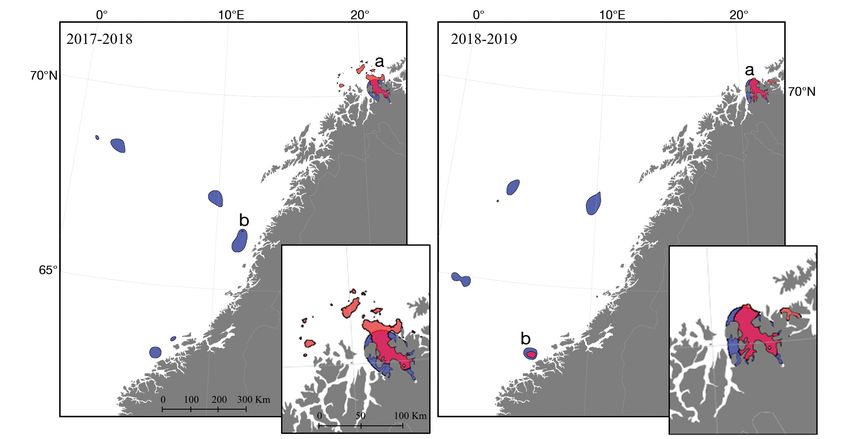
Fig. 2. Core areas (CAs) of killer whales (red) and fisheries (blue) for the first and second study periods, based on a 50% con-
tour of the utilisation distribution. CAs that overlap with fisheries are marked a and b. Insets show the largest killer whale CAs
(a) in more detail. Note that in both study periods, CAs are located near tagging locations
3.3. Fine-scale overlap between killer whales ple of killer whale movement relative to the start of a
and fishing activity fishing event. A more extensive example is provided
as an animation in Supplement 1 (see Anim. 1 at
Thirty-three percent of the killer whale locations www.int-res.com/articles/suppl/m652p001_supp/).
were within 100 km of active fishing events, and 8%
of all whale locations were within 3 km of the nearest
fishing activity (Table 1). On average, individual 3.4. Whale behaviour
whales spent 36% of their time (range: 0−74%)
within 100 km of the nearest active fishing event and Based on average AIC weights across all 30
9% (range: 0−34%) within 3 km of fishing activity. imputations (Table S1 in Supplement 2 at www.int-
Averaged over the 30 imputations per individual, res.com/articles/suppl/m652p001_supp/), the best
23% (SD = 0.3%) of the fishing events that took place supported model included linear and quadratic
during the study periods were approached (3 km) by terms for the effect of distance to the nearest vessel
1 or more killer whales. One whale never ventured on the turn angle concentration parameter for the
within 100 km of any fishery, while another did so attraction state (α0 = 0.87, CI = –0.75 – 2.48;
only once (Table 1). These 2 animals also had the β1 = –3.02, CI = –10.42 – 4.39; β2 = –7.26, CI =
shortest tracks (45 and 80 h). Ten killer whales spent –14.17 – –0.34). When the nearest fishing activity
at least 10% of their time within 3 km of the nearest was farther away (10−20 km), attraction towards
fishing activity. Of all the locations within 3 km of the the fishery was more directed as the distance
nearest fishing activity, only 4.4% were not in or near decreased. However, at shorter distances (8 Mar Ecol Prog Ser 652: 1–13, 2020
Fig. 3. Example of the attraction between killer whales (red lines) and fisheries (blue dots). Killer whale tracks are based on 1
imputation of a reconstructed path, and each frame represents a 3 h interval. The tail indicates the historical path of the whale
and fades out after 10 h. Fishery start and end represent the time the net is set until the time the net is retrieved, respectively.
Note that there may be some fishing-associated search activity prior to the reported start of the fishery
ranging from 0 to 79% (Table 2). Without fishing
activity within a 100 km radius, the percentage of
state assignments to travelling movement was 49%
(CI = 36−62%), and the percentage of area-restricted
movement was 51% (CI = 38−64%). When fishing
activity was within 100 km, the stationary probability
of travelling movement appeared to increase with
the distance to the nearest fishing activity, while the
probability of attraction appeared to decrease
(Fig. S2 in Supplement 2). Twenty-three of the
whales were attracted ≥ 10% of the time they were
within 100 km of the nearest fishing activity, and 10
whales were attracted ≥ 50% (Table 2). Two whales
had zero or 1 location within 100 km of the nearest
fishing activity and could therefore not have been
Fig. 4. Estimated effect of distance to the nearest fishing ac- attracted to any fishing activity.
tivity on the turn angle concentration parameter of the von Plots of the pseudo-residuals indicated that the
Mises distribution for the attraction state (κ3). This figure model fitted the data well (Fig. S3 in Supplement 2).
shows that the strength of attraction to the nearest fishery is
There appeared to be some lack of fit in the step
greatest at a distance of approximately 10 km. Dashed lines
indicate 95% confidence intervals lengths, which could be attributable to a small
amount of periodicity in the data and/or to unex-
plained variation in the step length distributions that
remaining in the attraction state (β33 = –10.76, appears to be largely attributable to 1 or 2 individual
CI = –21.23 – –0.30) (Fig. S1 in Supplement 2). whale tracks that had relatively short or relatively
Global state decoding by the Viterbi algorithm long step lengths compared to the overall average.
assigned 15% (CI = 11−21%) of the overall 1 h time
steps to the attraction state, 48% (CI = 40−54%) to
the area-restricted movement state and 37% (CI = 4. DISCUSSION
27−49%) to the travelling movement state. Between
0 and 57% of the locations for individual whales Our results reveal a strong spatial and temporal
were assigned to the attraction state. During periods overlap between killer whale Orcinus orca distribu-
of active fishing within a 100 km radius, 44% (CI = tion and herring Clupea harengus fishing activity in
24−66%) of the whale movements were assigned to northern Norway during the winter. All but 2 of the
the attraction state, with individual percentages tagged whales encountered fishing activity at closeMul et al.: Killer whale attraction to fishing activity 9
killer whales were caught inside the nets, but
Table 2. Percentage of time steps assigned to each state for locations
within 100 km of the nearest fishing activity. Values in parenthesesmost of them either escaped or were released
are SEs of the percentages. States were assigned by global state de-
successfully by the fishers. Although deaths
coding of the hidden Markov model. Whale 47573 did not have
locations within 100 km of an active fishery. NA: not applicable have occurred, no official numbers have been
published (Rikardsen 2019). In the absence of
fishing vessels, killer whales often herd the
Whale Location Traveling Area-restricted Attraction to the
ID movement movement nearest fishing herring towards the surface into a tight ball
(%) (%) activity (%) (carousel feeding) before they immobilise indi-
vidual or several herring with a fluke slap
47572 205 0 (0) 21 (23) 79 (23)
(Similä & Ugarte 1993). Carousel feeding is an
47580 135 16 (16) 23 (19) 61 (22)
47590 310 0 (0) 28 (19) 72 (19) elaborate cooperative feeding technique that
47592 272 15 (7) 27 (21) 58 (19) comes at a relatively high energetic cost, com-
47594 363 14 (7) 49 (10) 37 (8) pared to feeding on discarded herring from
47582 272 19 (8) 32 (15) 50 (15)
fishing activity. Earlier studies found that in the
47581 59 0 (0) 27 (21) 73 (21)
47587 73 2 (2) 49 (12) 49 (12) vicinity of herring fishing vessels, killer whales
47577 75 11 (15) 51 (14) 38 (12) changed their foraging behaviour (Van Opzee-
47573 0 NA NA NA land et al. 2005), and carousel feeding was ob-
47574 1 100 (0) 0 (0) 0 (0)
served less frequently (Kuningas et al. 2014). It
54013 571 1 (3) 49 (13) 50 (14)
53561 566 50 (17) 33 (16) 16 (7) is unclear what cues killer whales respond to
53559 605 8 (3) 49 (12) 44 (13) and how they detect the fishing activity. Sperm
54011 687 3 (2) 49 (11) 48 (11) whales appear to respond to acoustic cues from
83761 465 4 (4) 57 (8) 39 (9)
long-line fishing gear (e.g. winching) or from
83760 462 10 (6) 80 (24) 10 (20)
53557 412 3 (5) 33 (20) 64 (21) propellor or engine sounds that indicate
83764 366 4 (5) 38 (20) 58 (18) changes in speed (Thode et al. 2007, Mathias et
83756 339 24 (14) 29 (15) 47 (17) al. 2012). Killer whales and sperm whales can
83768 72 68 (14) 15 (12) 17 (8)
follow long-line fishing vessels for hundreds of
83755 128 1 (4) 58 (12) 41 (12)
83752 39 85 (13) 5 (9) 10 (11) kilometers (Towers et al. 2019), suggesting that
83754 106 11 (6) 48 (15) 42 (14) they respond to vessel-specific acoustic sig-
179032 118 88 (10) 3 (5) 8 (8) nals. It is possible that the killer whales in Nor-
Overall 6701 13 (4) 42 (11) 44 (11) way also respond to acoustic cues from the fish-
ing gear or fishing operation itself, such as
winching, pumping or setting of the nets.
proximity, primarily in Kvænangen fjord (Fig. 2). The Our results show that overlap and attraction oc-
start of fishing activity triggered a change of behav- curred primarily in and near the overwintering her-
iour, and killer whale movements were biased ring in the fjords. This might be because most of the
towards herring purse seiners, suggesting that killer recorded locations were inside Kvænangen fjord,
whales were sometimes attracted to fishing activity. where most of the tags were deployed. However, the
Killer whales are attracted to fisheries around the CAs of the 4 whales that were instrumented off the
world (Luque et al. 2006, Peterson et al. 2013, Escalle coast in southern Norway overlapped less with active
et al. 2015, Söffker et al. 2015, Towers et al. 2019), fishing activity. Whales that left the fjords also over-
because fishing activities offer beneficial foraging lapped less often with fisheries, compared to when
opportunities (Tixier et al. 2015, Esteban et al. 2016). they were still in the fjords. This suggests that out-
The fishing events in our study aggregated large side of the fjord, the whales might not react as
quantities of herring at the surface in purse seine strongly to fishing activity. Outside of the fjord, the
nets. This allowed killer whales to feed on the aggre- herring and fishing activities are distributed over a
gated, stunned and disorganised herring outside of larger area (Huse et al. 2010). Fishing activity may
the net, or they may pick individual fish through the occur at distances too large for killer whales to either
mesh of the net. The killer whales appeared to gather detect or respond to.
around the edges of the fishing net as soon as it was Herring is a keystone prey species for killer whales
set, even before the herring were pumped into the in Norway (Similä et al. 1996, Jourdain et al. 2020).
vessel. They stayed near the edges of the net until However, the importance of herring in the whale diet
the net was hauled out of the water and the last fish varies among individuals, as some animals occasion-
dispersed (A. Rikardsen & E. Mul pers. obs.). Some ally switch to other prey species (Jourdain et al.10 Mar Ecol Prog Ser 652: 1–13, 2020 2020). Therefore, some individuals may be less at- glements have been reported for this area (Rikardsen tracted to herring overwintering grounds. In addi- 2019), although deadly entanglements are considered tion, inter-individual differences in foraging behav- to be rare (Reeves et al. 2017). Interaction may also iour among herring-eating killer whales may cause lead to a predator dependency on the fishery (Tew Kai differences in the utilisation of fisheries. Such differ- et al. 2013). In some fisheries, depredation by marine ences in fisheries interaction have been observed in mammals results in reduced revenues (Hanselman et seabirds (Patrick et al. 2015). In our study, some indi- al. 2018, Tixier et al. 2020). Killer whales that were viduals did not interact with fishing activity, even feeding near fishing vessels mostly targeted the fish though they were tagged in areas with a high her- outside the net (A. Rikardsen & E. Mul pers. obs.), ring density. Perhaps these individuals were at- which does not impact the catch size for the fishers. tracted to herring but not to fishing activity. Finally, The number of fishes that were taken from the nets there may be gender-associated differences in the appeared to be low, and the effect on the catch size attraction to fishing activity, as there are gender- may have been insignificant. Still, if a whale entered related differences in feeding behaviour (Baird et al. a purse seine net, the fishers had to attempt to 2005). However, we observed both females and release the whale, which would take time and could males in large numbers around the fishing vessels. potentially mean the loss of (part of) the catch. Our HMM indicated attraction between killer Our results indicate that whales indeed benefit whales and fisheries and an effect of distance on the from feeding in close vicinity to fishing activity, strength of bias towards the nearest fishing vessel. At which suggest these activities provide a substantial very close range, the strength of attraction tended resource subsidy to the whales. Resource subsidies to to decrease, suggesting that the animals began to predators can lead to an increase in the abundance switch towards area-restricted movement (possibly of the predator, changes in dietary preferences, foraging) near the fishing vessels. Another possibility changes in survival, reproduction or sociality, and for the decreasing strength of attraction in close changes in home ranges or behaviour (Oro et al. proximity to fishing events might be that herring 2013, Newsome et al. 2015). These changes can fur- density in the general area of the fishing event may ther affect prey or other species that interact with be relatively high and therefore attractive to killer killer whales. We have shown that killer whales are whales. Area-restricted movement and attraction attracted to fishing activities during the overwinter- therefore became difficult to distinguish within close ing of herring in the fjords. However, it is unclear if, range of the fisheries based solely on step lengths and to what extent, killer whales interact with fish- and turn angles. Additional model structure or data eries during this time and during the rest of the year. streams, such as dive activity data, accelerometer Further research is required to determine the long- data or mandible movement (e.g. van Beest et al. term effect of the herring fishery and potential other 2019), would likely improve the ability of our model fisheries on killer whales in Norway. to distinguish between possible foraging and weaker attraction within close range of the fisheries. The ef- fect of distance to the nearest vessel on the state tran- 5. CONCLUSIONS sition probabilities was subject to large uncertainties, but the transition probabilities to the attraction state This study provided novel insight into fine-scale appeared to be negatively affected by distance. A interactions between killer whales and herring fish- confounding factor might have been the number of eries in northern Norway. Herring forms an important co-occurring fishing activities and the relatively close part of the diet for killer whales in Norway, and proximity between them. In our model, only the fishing activity provides easy foraging opportunities nearest fishing activity was considered as a potential specifically targeted by killer whales. Decreased attractor. However, killer whales could have been at- foraging costs might decrease their overall energy tracted to other fishing activities farther away. As a budget, and these foraging opportunities might be result, it is likely that the occurrence of attraction, as important for the growth of the Norwegian killer identified by the HMM, is an underestimation of the whale population (e.g. Halpern et al. 2019). Although real occurrence of attraction. Other studies may not there have been few reports of negative consequences have had this issue (e.g. Pirotta et al. 2018), since that herring fisheries may have on killer whales, it is there were fewer vessels operating at the same time. important to consider the cumulative effects from in- Interactions between killer whales and fisheries creasing anthropogenic activities to understand the may come at a cost. For example, killer whale entan- overall impact of anthropogenic activities on killer
Mul et al.: Killer whale attraction to fishing activity                                11

whales in Norway. Furthermore, if the interaction be-               Grecian WJ, Lane JV, Michelot T, Wade HM, Hamer KC
tween whales and fisheries increases and becomes a                     (2018) Understanding the ontogeny of foraging behaviour:
                                                                       insights from combining marine predator bio-logging with
challenge for the fishery, mitigation actions need to be               satellite-derived oceanography in hidden Markov models.
taken to reduce the risk of negative outcomes for both                 J R Soc Interface 15:20180084
the fishery and the whales.                                         Güçlüsoy H (2008) Damage by monk seals to gear of the arti-
                                                                       sanal fishery in the Foça Monk Seal Pilot Conservation
                                                                       Area, Turkey. Fish Res 90:70−77
                                                                    Halpern BS, Frazier M, Afflerbach J, Lowndes JS and others
Acknowledgements. E.M. was funded by a PhD scholarship
                                                                       (2019) Recent pace of change in human impact on the
from VISTA, which is a basic research programme in collab-
                                                                       world’s ocean. Sci Rep 9:11609
oration between The Norwegian Academy of Science & Let-
                                                                    Hanselman DH, Pyper BJ, Peterson MJ (2018) Sperm whale
ters and Equinor. The fieldwork was partly financed by the
                                                                       depredation on longline surveys and implications for the
Regional Norwegian Research Counsel (Whalefeast project,
                                                                       assessment of Alaska sablefish. Fish Res 200:75−83
RFFNORD no. 282469). The findings and conclusions herein
                                                                    Horne JS, Garton EO (2006) Likelihood cross-validation
are those of the author(s) and do not necessarily represent
                                                                       versus least squares cross-validation for choosing the
the views of NOAA/NMFS. Any use of trade, product or firm
                                                                       smoothing parameter in kernel home-range analysis.
names does not imply an endorsement by the US Govern-
                                                                       J Wildl Manag 70:641−648
ment. The authors thank Emma Frances Vogel, Lisa Elena
                                                                    Horne JS, Garton EO, Krone SM, Lewis JS (2007) Analyzing
Kettemer, Sune Hansen, Kunuk Lennert, Trond Johnsen
                                                                       animal movements using Brownian bridges. Ecology
and Lars Kleivane, who helped during the collection of the
                                                                       88:2354−2363
killer whale data. We also thank Raul Primicerio, André
                                                                    Huse G, Fernö A, Holst JC (2010) Establishment of new
Frainer, Jarad Pope Mellard and Paul Wensveen for their
                                                                       wintering areas in herring co-occurs with peaks in the
suggestions on early versions of the analysis and 3 anony-
                                                                       ‘first time/repeat spawner’ ratio. Mar Ecol Prog Ser
mous reviewers for their valuable suggestions and com-
                                                                       409:189−198
ments on the manuscript.
                                                                    Johnson DS, London JM (2018) crawl: an R package for fit-
                                                                       ting continuous-time correlated random walk models to
                                                                       animal movement data. Zenodo. https://doi.org/10.5281/
                   LITERATURE CITED                                    zenodo.596464
                                                                    Johnson DS, London JM, Lea MA, Durban JW (2008) Con-
Abdulqader EAA, Miller J, Al-Mansi A, Al-Abdulkader K,                 tinuous-time correlated random walk model for animal
   Fita N, Al-Nadhiri H, Rabaoui L (2017) Turtles and other            telemetry data. Ecology 89:1208−1215
   marine megafauna bycatch in artisanal fisheries in the           Jourdain E, Vongraven D (2017) Humpback whale (Mega-
   Saudi waters of the Arabian Gulf. Fish Res 196:75−84                ptera novaeangliae) and killer whale (Orcinus orca)
Baird RW, Hanson MB, Dill LM (2005) Factors influencing                feeding aggregations for foraging on herring (Clupea
   the diving behaviour of fish-eating killer whales: sex dif-         harengus) in northern Norway. Mamm Biol 86:27−32
   ferences and diel and interannual variation in diving            Jourdain E, Ugarte F, Víkingsson GA, Samarra FIP and oth-
   rates. Can J Zool 83:257−267                                        ers (2019) North Atlantic killer whale Orcinus orca pop-
Botsford LW (1997) The management of fisheries and mar-                ulations: a review of current knowledge and threats to
   ine ecosystems. Science 277:509−515                                 conservation. Mammal Rev 49:384−400
Burnham KP, Anderson DR (2002) Model selection and                  Jourdain E, Andvik C, Karoliussen R, Ruus A, Vongraven D,
   inference: a practical information-theoretic approach,              Borgå K (2020) Isotopic niche differs between seal and
   2nd edn. Springer-Verlag, New York, NY                              fish-eating killer whales (Orcinus orca) in northern
Calenge C (2006) The package adehabitat for the R soft-                Norway. Ecol Evol 10:4115−4127
   ware: a tool for the analysis of space and habitat use by        Kock KH, Purves MG, Duhamel G (2006) Interactions be-
   animals. Ecol Modell 197:516–519                                    tween cetacean and fisheries in the Southern Ocean.
Carretta JV, Moore JE, Forney KA (2019) Estimates of mar-              Polar Biol 29:379−388
   ine mammal, sea turtle, and seabird bycatch from the             Kuhn CE, Johnson DS, Ream RR, Gelatt TS (2009) Advances
   California large-mesh drift gillnet fishery: 1990−2017.             in the tracking of marine species: using GPS locations to
   NOAA Tech Memo NOAA-TM-NMFS-SWFSC-619                               evaluate satellite track data and a continuous-time
Dragesund O, Hamre J, Ulltang Ø (1980) Biology and pop-                movement model. Mar Ecol Prog Ser 393:97−109
   ulation dynamics of the Norwegian spring-spawning                Kuningas S, Similä T, Hammond PS (2014) Population size,
   herring. Rapp P-V Reùn Cons Int Explor Mer 177:43−71                survival and reproductive rates of northern Norwegian
Erbe C (2002) Underwater noise of whale-watching boats and             killer whales (Orcinus orca) in 1986−2003. J Mar Biol
   potential effects on killer whales (Orcinus orca), based on         Assoc UK 94:1277−1291
   an acoustic impact model. Mar Mamm Sci 18:394−418                Langrock R, King R, Matthiopoulos J, Thomas L, Fortin D,
Escalle L, Capietto A, Chavance P, Dubroca L and others                Morales JM (2012) Flexible and practical modeling of
   (2015) Cetaceans and tuna purse seine fisheries in the              animal telemetry data: hidden Markov models and
   Atlantic and Indian Oceans: interactions but few mortal-            extensions. Ecology 93:2336−2342
   ities. Mar Ecol Prog Ser 522:255−268                             Leonard D, Øien N (2020) Estimated abundances of cetac-
Esteban R, Verborgh P, Gauffier P, Giménez J, Foote AD, de             ean species in the northeast Atlantic from two multiyear
   Stephanis R (2016) Maternal kinship and fisheries inter-            surveys conducted by Norwegian vessels between
   action influence killer whale social structure. Behav Ecol          2002−2013. NAMMCO Sci Publ 11
   Sociobiol 70:111−122                                             Leos-Barajas V, Photopoulou T, Langrock R, Patterson TA,
12 Mar Ecol Prog Ser 652: 1–13, 2020 Watanabe YY, Murgatroyd M, Papastamatiou YP (2017) Pirotta E, Edwards EWJ, New L, Thompson PM (2018) Cen- Analysis of animal accelerometer data using hidden tral place foragers and moving stimuli: a hidden-state Markov models. Methods Ecol Evol 8:161−173 model to discriminate the processes affecting movement. Luque PL, Davis CG, Reid DG, Wang J, Pierce GJ (2006) J Anim Ecol 87:1116−1125 Opportunistic sightings of killer whales from Scottish R Core Team (2019) R: a language and environment for sta- pelagic trawlers fishing for mackerel and herring off tistical computing. R Foundation for Statistical Comput- North Scotland (UK) between 2000 and 2006. Aquat ing, Vienna. https://www.r-project.org/ Living Resour 19:403−410 Read AJ (2008) The looming crisis: interactions between Mathias D, Thode AM, Straley J, Calambokidis J, Schorr marine mammals and fisheries. J Mammal 89:541−548 GS, Folkert K (2012) Acoustic and diving behavior of Read AJ, Drinker P, Northridge S (2006) Bycatch of marine sperm whales (Physeter macrocephalus) during natural mammals in US and global fisheries. Conserv Biol 20: and depredation foraging in the Gulf of Alaska. J Acoust 163−169 Soc Am 132:518−532 Reeves R, Pitman RL, Ford JKB (2017) Orcinus orca. The McClintock BT (2017) Incorporating telemetry error into IUCN Red List of Threatened Species 2017: e.T15421A50 hidden Markov models of animal movement using mul- 368125 (accessed Apr 2020) tiple imputation. J Agric Biol Environ Stat 22:249−269 Reisinger RR, Oosthuizen WC, Péron G, Toussaint DC, McClintock BT, Michelot T (2018) momentuHMM: R package Andrews RD, De Bruyn PJN (2014) Satellite tagging and for generalized hidden Markov models of animal move- biopsy sampling of killer whales at subantarctic Marion ment. Methods Ecol Evol 9:1518−1530 Island: effectiveness, immediate reactions and long-term McClintock BT, Michelot T (2020) momentuHMM: maxi- responses. PLOS ONE 9:e111835 mum likelihood analysis of animal movement behavior Richard G, Bonnel J, Tixier P, Arnould JPY, Janc A, Guinet using multivariate hidden Markov models. https://cran.r- C (2020) Evidence of deep-sea interactions between project.org/package=momentuHMM toothed whales and longlines. Ambio 49:173−186 McClintock BT, London JM, Cameron MF, Boveng PL Rikardsen AH (2019) Winter whales. ToFoto, Harstad (2015) Modelling animal movement using the Argos Rubin DB (1987) Multiple imputation for nonresponse in satellite telemetry location error ellipse. Methods Ecol surveys. Wiley, New York, NY Evol 6:266−277 Samuel MD, Pierce DJ, Garton EO (1985) Identifying areas Moore JE, Wallace BP, Lewison RL, Žydelis R, Cox TM, of concentrated use within the home range. J Anim Ecol Crowder LB (2009) A review of marine mammal, sea 54:711 turtle and seabird bycatch in USA fisheries and the role Similä T (2005) Interactions between herring fishery and of policy in shaping management. Mar Policy 33: killer whales in northern Norway. ICES CM 2005/R:03. 435−451 www.ices.dk/sites/pub/CM Doccuments/2005/R/R0305. Mul E, Blanchet MAA, Biuw M, Rikardsen A (2019) Implica- pdf (accessed 1 Nov 2019) tions of tag positioning and performance on the analysis Similä T, Ugarte F (1993) Surface and underwater observa- of cetacean movement. Anim Biotelem 7:11 tions of cooperatively feeding killer whales in northern Newsome TM, Dellinger JA, Pavey CR, Ripple WJ, Shores Norway. Can J Zool 71:1494−1499 CR, Wirsing AJ, Dickman CR (2015) The ecological Similä T, Holst JC, Christensen I (1996) Occurrence and diet effects of providing resource subsidies to predators. Glob of killer whales in northern Norway: seasonal patterns Ecol Biogeogr 24:1−11 relative to the distribution and abundance of Norwegian Nielson MR, Sawyer H, McDonald TL (2013) BBMM: Brown- spring-spawning herring. Can J Fish Aquat Sci 53: ian bridge movement model. https://cran.r-project.org/ 769−779 package=BBMM Söffker M, Trathan P, Clark J, Collins MA, Belchier M, Scott Northridge SP (1991) An updated world review of inter- R (2015) The impact of predation by marine mammals on actions between marine mammals and fisheries. FAO Patagonian toothfish longline fisheries. PLOS ONE 10: Fish Tech Pap 251, Suppl 1. FAO, Rome e0118113 Northridge S, Coram A, Kingston A, Crawford R (2017) Dis- Straley JM, Schorr GS, Thode AM, Calambokidis J and oth- entangling the causes of protected-species bycatch in ers (2014) Depredating sperm whales in the Gulf of gillnet fisheries. Conserv Biol 31:686−695 Alaska: local habitat use and long distance movements Nøttestad L, Axelsen BE (1999) Herring schooling mano- across putative population boundaries. Endang Species euvres in response to killer whale attacks. Can J Zool 77: Res 24:125−135 1540−1546 Tew Kai E, Benhamou S, van der Lingen CD, Coetzee JC, Oro D, Genovart M, Tavecchia G, Fowler MS, Martínez- Pichegru L, Ryan PG, Grémillet D (2013) Are Cape gan- Abraín A (2013) Ecological and evolutionary implica- nets dependent upon fishery waste? A multi-scale analy- tions of food subsidies from humans. Ecol Lett 16: sis using seabird GPS-tracking, hydro-acoustic surveys 1501−1514 of pelagic fish and vessel monitoring systems. J Appl Patrick SC, Bearhop S, Bodey TW, Grecian WJ, Hamer KC, Ecol 50:659−670 Lee J, Votier SC (2015) Individual seabirds show consis- Thode A, Straley J, Tiemann CO, Folkert K, O’Connell V tent foraging strategies in response to predictable fish- (2007) Observations of potential acoustic cues that attract eries discards. J Avian Biol 46:431−440 sperm whales to longline fishing in the Gulf of Alaska. Peterson MJ, Mueter F, Hanselman D, Lunsford C, Matkin J Acoust Soc Am 122:1265−1277 C, Fearnbach H (2013) Killer whale (Orcinus orca) Tixier P, Authier M, Gasco N, Guinet C (2015) Influence of depredation effects on catch rates of six groundfish spe- artificial food provisioning from fisheries on killer whale cies: implications for commercial longline fisheries in reproductive output. Anim Conserv 18:207−218 Alaska. ICES J Mar Sci 70:1220−1232 Tixier P, Burch P, Richard G, Olsson K and others (2019) Com-
Mul et al.: Killer whale attraction to fishing activity                                13

   mercial fishing patterns influence odontocete whale−             van Beest FM, Mews S, Elkenkamp S, Schuhmann P and
   longline interactions in the Southern Ocean. Sci Rep 9:             others (2019) Classifying grey seal behaviour in relation
   1904                                                                to environmental variability and commercial fishing
Tixier P, Burch P, Massiot-Granier F, Ziegler P and others             activity — a multivariate hidden Markov model. Sci Rep
   (2020) Assessing the impact of toothed whale depreda-               9:5642
   tion on socio-ecosystems and fishery management in               Van Opzeeland IC, Corkeron PJ, Leyssen T, Similä T, Van
   wide-ranging subantarctic fisheries. Rev Fish Biol Fish             Parijs SM (2005) Acoustic behaviour of Norwegian killer
   30:203−217                                                          whales (Orcinus orca), during carousel and seiner forag-
Towers JR, Tixier P, Ross KA, Bennett J, Arnould JPY, Pit-             ing on spring-spawning herring. Aquat Mamm 31:
   man RL, Durban JW (2019) Movements and dive behav-                  110−119
   iour of a toothfish-depredating killer and sperm whale.          Williams R, Noren DP (2009) Swimming speed, respiration
   ICES J Mar Sci 76:298−311                                           rate, and estimated cost of transport in adult killer
Towner AV, Leos-Barajas V, Langrock R, Schick RS and                   whales. Mar Mamm Sci 25:327−350
   others (2016) Sex-specific and individual preferences            Worton BJ (1989) Kernel methods for estimating the utiliza-
   for hunting strategies in white sharks. Funct Ecol 30:              tion distribution in home-range studies. Ecology 70:
   1397−1407                                                           164−168

Editorial responsibility: Peter Corkeron,                           Submitted: June 16, 2020; Accepted: August 26, 2020
Woods Hole, Massachusetts, USA                                      Proofs received from author(s): October 8, 2020
You can also read