Distribution patterns of east Australian humpback whales (Megaptera novaeangliae) in Hervey Bay, Queensland: a historical perspective
←
→
Page content transcription
If your browser does not render page correctly, please read the page content below
CSIRO PUBLISHING
Australian Mammalogy, 202 0 , 4 2 , 16 –24 1 27
https://doi.org/10.1071/AM18029

      Distribution patterns of east Australian humpback whales
      (Megaptera novaeangliae) in Hervey Bay, Queensland:
      a historical perspective

      S. H. Stack A,B, J. J. Currie A, J. A. McCordic A, A. F. Machernis A and G. L. Olson A
      A
       Pacific Whale Foundation, 300 Ma’alaea Road, Suite 211, Wailuku, Maui, HI 96793, USA.
      B
       Corresponding author. Email: research@pacificwhale.org

      Abstract. Tourism activities are expanding in both terrestrial and marine environments, which can have detrimental
      effects on the target species. Balancing the amount of disturbance a population of animals receives against the educational
      value of tourism requires localised research and adaptive management. This study examined the distribution of humpback
      whales within Hervey Bay, Queensland, using data spanning 2004–16, just before the implementation of a commercial
      ‘swim-with-whales’ program. Spatial and temporal patterns of humpback whale calves were of particular interest given that
      they are more vulnerable to human-related disturbances than other group types. We found that humpback whales displayed a
      distinct spatial segregation in Hervey Bay based on pod composition. Most whales displayed a residency time of two to
      three days, with females having a somewhat shorter residency time than males. These findings suggest that humpback
      whales in Hervey Bay not only display temporal segregation dependent on maturation and reproductive status, but fine-scale
      spatial distribution based on pod composition. Understanding habitat preference and patterns of habitat use of humpback
      whales in Hervey Bay is critical for effective management of the newly sanctioned swim-with-whale tourism in Hervey Bay
      and the sustained recovery of humpback whales in this region.

      Additional keywords: Balaenopteridae, habitat preference, population management

      Received 24 April 2018, accepted 1 March 2019, published online 24 April 2019

Introduction                                                            feeding areas in the Antarctic (e.g. Franklin et al. 2012;
As top predators of the marine environment, whales play a vital         Constantine et al. 2014). During their southern migration from
role in sustaining a healthy ecosystem by regulating the food flow       late-July to November, an estimated 30–50% (Bryden et al.
of the ocean. Commercial whaling in the 20th century removed            1989; Chaloupka et al. 1999) of humpback whales detour from
millions of large whales from the Southern Hemisphere                   their main migration route and travel into Hervey Bay (e.g.
(Clapham and Baker 2008), resulting in large consequences for           Paterson 1991; DEH 2005). Hervey Bay is a wide, horseshoe-
the ecosystem below them, and the many species that live there.         shaped embayment bounded by the Queensland coast to the west
Both the east and west coast Australian humpback whale                  and south and by Fraser Island to the east. Fraser Island provides
(Megaptera novaeangliae) populations were decimated by an               protection from the prevailing winds, and water depth varies very
estimated 95% from their pre-exploitation populations of                little, with an average depth of ~18 m (Vang 2002), making
~27 000 individuals (DEH 2005). After the international                 Hervey Bay an ideal stopover site for whales to rest. Their
moratorium on commercial whaling came into effect in 1985, the          average residency time in the bay is 1–3 days before continuing
two Australian populations have experienced what is thought to          their migration towards Antarctica (Corkeron et al. 1994;
be one of the highest rates of population increase in the world, at a   Franklin 2012); however, extended stays of up to 22 days for
rate of 10.9–11% (Noad et al. 2011a). In 1999, the east coast           females and 51 days for males have been recorded for some
population was estimated to be 3160–4040 (DEH 2005) and in              individuals (Franklin 2012). In particular, Platypus Bay, located
2010, the absolute abundance estimate for the population was            along the north-western shores of Fraser Island, is where most
~14 522 whales (Noad et al. 2011b). While the population has            whales aggregate during this stopover period (Kaufman et al.
experienced tremendous recovery since the time of exploitation,         1987; Forestell et al. 2003).
threats such as vessel disturbance and collisions remain a concern           Humpback whales display distinct temporal segregation into
with the potential for cumulative impacts on individuals.               and out of Hervey Bay based on age, sex, and reproductive status
    Humpback whales in the eastern Australia Breeding Stock             (Dawbin 1997; Franklin et al. 2011). Data indicate that Hervey
E-1 population migrate annually between subtropical breeding            Bay is utilised by immature males and females early in the
grounds along the north-east coast of Australia and high-latitude       season, followed by mature adults in the middle of the season, and

Journal Compilation  Australian Mammal Society 2020                                                     www.publish.csiro.au/journals/am
Open Access CC BY-NC-ND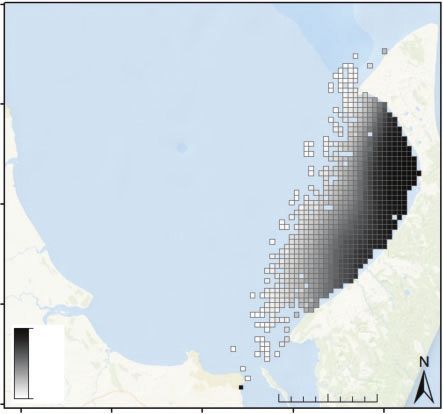
Distribution of humpback whales in Hervey Bay                                                                Australian Mammalogy       17

lastly by mother–calf pairs (Franklin et al. 2011). Competition          before the implementation of ‘swim-with-whale’ activities in
pods have also been observed in Hervey Bay, indicating that this         this region, providing baseline information to humpback whale
region may provide mature males one last opportunity for                 distribution patterns. This information will be crucial in helping
breeding with females of various age classes before returning to         to guide a precautionary management approach in this region that
Antarctica (Bryden et al. 1989; Corkeron 1995). For mothers              will reduce the level of disturbance to whales from an expanding
with young calves, Hervey Bay is an ideal stopover site to rest,         ecotourism industry.
conserve energy, and provide food and protection for their calves
before the calves’ first migration to their southern feeding ground       Methods
(Franklin et al. 2011). While Hervey Bay is not a designated             Study area
calving or breeding ground for humpback whales, it appears that
                                                                         Hervey Bay is located at 25000 S, 152520 E on the east coast of
it is utilised by multiple pod types for a variety of purposes
                                                                         Queensland, Australia (Fig. 1). It is a wide, shallow bay with an
(Corkeron 1995). This multifaceted use of the bay is logical
                                                                         area of ~4000 km2, consisting of a sand and mud bottom, located
considering the various age classes and reproductive stages of
                                                                         ~175 nautical miles north of the Gold Coast. Most of the bay is
animals that utilise it during their migration.
                                                                         18 m deep, with depths increasing northward to more than 40 m,
    As a result of Hervey Bay’s dynamic use by humpback whales
                                                                         where the bay connects to the open ocean via an ~60-km-wide
and close proximity to sheltered waters from land, it has become a
                                                                         gap (Vang 2002). The bay is bounded by the Queensland coast to
very reliable and highly sought-after whale-watching destination.
                                                                         the west and south and by Fraser Island (126 km long) along a
The whale-watching industry experienced substantial growth in
                                                                         north-easterly axis. The bay is open to the South Pacific Ocean in
the late 1980s and early 1990s (Stoeckl et al. 2005; O’Connor
                                                                         the north, while the Great Sandy Strait enters the bay from the
et al. 2009), but factors, such as competition with areas that are
                                                                         south (Corkeron 1995). At the northern tip of Fraser Island, the
more conveniently located near larger populations, have caused
                                                                         Great Sandy Spit separates the bay from the open ocean an
the industry in Hervey Bay to decline (Peake 2011). In an effort to
                                                                         additional 30 km north. This study was conducted within the
jumpstart the regional economy, in 2014, the Queensland
                                                                         Great Sandy Marine Park, an area covering ~6000 km2 of tidal
government initiated a trial ‘immersive whale watching’ program,
                                                                         land and waters, including Hervey Bay (Queensland Department
which allows passengers to enter the water with the whales (Anon.
                                                                         of Environment and Science 2018). During the study period, a
2014), the first of its kind for humpback whales in Australia.
                                                                         small fleet of 10–14 vessels conducted whale-watching
After an incident-free three-year trial, in 2017, the Australian
                                                                         operations annually within Hervey Bay. However, it should be
Government permitted the ‘immersive whale watching’ program
                                                                         noted that data on the number of annual whale-watching vessels
to become a permanent fixture in Hervey Bay, which was also
                                                                         were not available for the entire study period and the presented
supported by the Department of National Parks (Queensland
                                                                         ranges may vary slightly.
Department of the Premier and Cabinet 2017).
    The ‘swim-with’ industry has become an emerging form of              Definitions
tourism that is at the forefront of scientific evaluation to assess the
impacts of interactions on marine mammal populations. Most               The following terms are defined here for clarification:
swim-with activities occur with odontocete species, the responses            A pod was defined as either a lone (singleton) or a group of
of which are most frequently documented, but have also been              humpback whales within 100 m of each other, generally moving
known to occur with pinniped and mysticete species (Machernis            in the same direction, and coordinating their behaviour as well as
et al. 2018). In a review specifically looking at swim-with-whales        speed of travel (Whitehead 1983; Corkeron et al. 1994). The term
tourism, Rose et al. (2005) found that most programs are with            ‘pod’ used here does not imply stable groups.
humpback and minke whales in the Dominican Republic, Tonga,                  A calf was defined as an individual whale visually estimated
and the Great Barrier Reef. Swim-with interactions have also been        to be less than 50% of the length of the accompanying whale, less
documented with southern right whales (Lundquist 2007;                   than one body length apart, and maintaining a constant and close
Lundquist et al. 2008). In general, the literature suggests that         relationship (e.g. Chittleborough 1965) with the adult whale,
animals’ behavioural responses to swim-with activities vary              who is assumed to be the mother.
widely across species and locations and may be dependent on                  A subadult was defined as an individual whale estimated to be
certain aspects of swimmers’ presence (Machernis et al. 2018).           more than one year old and weaned from its mother, but not yet of
This consensus highlights the need to focus research efforts in          a size consistent with achieving sexual maturity, i.e. 7–12 m long
areas where swim-with-whale tourism programs are emerging in             (Coughran and Gales 2010).
order to evaluate its impact on regional whale populations.                  Calf pods were defined as pods containing one or more calves,
    A better understanding of how humpback whales utilise                while non-calf pods were defined as pods with no calves present.
Hervey Bay is essential as the swim-with-whale tourism industry          Each group could have any variation of additional whales
grows in this region. Mother-and-calf pairs are of particular            present.
importance given their use of this habitat to provide maternal
care, and disturbance may result in energetic consequences that          Data collection
could cause population-level impacts. The current study                  Humpback whale sighting data were collected daily from various
examines the distribution of calf and non-calf pods of humpback          whale-watching vessels departing from Urangan Harbour
whales in Hervey Bay, Australia, to determine whether there are          between July and October over a 12-year period (2004–16,
differences in where these pod types occur. Data were collected          excluding 2013). Each whale-watching trip lasted 4 hours and
from various whale-watching vessels over a period of 12 years,           followed a non-systematic search effort. Scanning for whales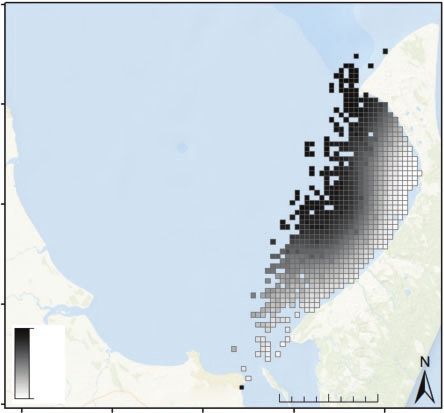
18    Australian Mammalogy                                                                                                            S. H. Stack et al.

                    1°0'0"N

                    6°0'0"S

                   13°0'0"S
                                                                                      Breeding grounds

                   20°0'0"S

                                                                                                             Hervey Bay
                                                                Australia
                   27°0'0"S

                   34°0'0"S

                   41°0'0"S
                                  N
                                                                                         Feeding grounds

                   48°0'0"S   0         1000 km

                           107°0'0"E          121°0'0"E         135°0'0"E          149°0'0"E          163°0'0"E

                   Fig. 1. The location of the study area, Hervey Bay, on the eastern coast of Australia. Humpback whales migrate
                   annually between the Antarctic feeding grounds in the summer and the breeding grounds in the winter, stopping in
                   Hervey Bay on their southern migration.

was completed by a researcher stationed on board and began once              Data preparation
boats departed the harbour. Scanning was conducted with the                  To facilitate analysis, the study area was divided into 1 km
naked eye and with binoculars looking for visual cues of                     1 km grid cells that covered 769 km2. For the entire 12-year
humpback whale presence.                                                     period, each grid cell was summarised by monthly counts of: (1)
    When a whale was sighted, the vessel approached the pod to a             total number of pods with calves present, and (2) total number of
distance 100 m. Upon approach and subsequent observation,                   pods without calves present.
information on group size, composition, and behaviour were                       Each grid cell was characterised by the following variables:
recorded. To ensure accurate group composition and size                      water depth, distance from shore, latitude, longitude. Water depth
estimates, only sightings where group composition could be                   was expressed in metres and calculated as the mean depth within
confirmed were included in subsequent analysis. Encounter                     the grid cell taken from Geoscience Australia bathymetry dataset
location (latitude and longitude) was recorded using handheld                (resolution: 300 m) (Geoscience Australia 2013). Distance from
GPS (Global Positioning System) when the vessel was 150 m                   shore was expressed as a positive value in kilometres and was
from the focal pod. After the initial whale sighting, the whale-             determined using the near tool in ArcMap (ESRI 2017) to measure
watching vessel navigated the area, randomly searching for more              the distance from the centre of each grid cell to the nearest
humpback whales. As such, the search effort was never                        shoreline. Environmental covariates (water depth and distance
consistently concentrated in a particular location or time.                  from shore) were tested for pairwise correlations using the stats
However, the nature of whale watching and the consistent track               package in R (R-Core Team 2017). To account for non-normality
back to the harbour resulted in uneven search effort.                        in site covariates, the Spearman correlation coefficient (rs) was
    Postprocessing of fluke photographs followed Rankin et al.                used to assess correlations. If site covariates were highly
(2013), where quality and distinctiveness were graded by                     correlated (rs  0.7), the most biologically relevant variable was
modified protocols for North Pacific humpback whales                           retained for subsequent analysis.
(Calambokidis et al. 2008). Each fluke was given a score of
1 through 5 (good to bad) for five criteria: (1) proportion of fluke
visible, (2) fluke angle, (3) photographer/lateral angle, (4) focus,          Residency time
and (5) exposure/contrast. A cumulative score was calculated by              For analysis of residency time, the sighting history for each
summing the scores of the five criteria. Flukes were not considered           individual whale was summarised per year from 1984–2016. Each
for analysis if: (1) they had a cumulative score exceeding 14, or            record had dates of the first and last observations within each year
(2) they were scored a 4 or 5 for any single criterion, or (3) no            that the individual was sighted, the sex of the whale, and, for
picture was available of the fluke’s central notch.                           females, lactation status (determined by the presence or absence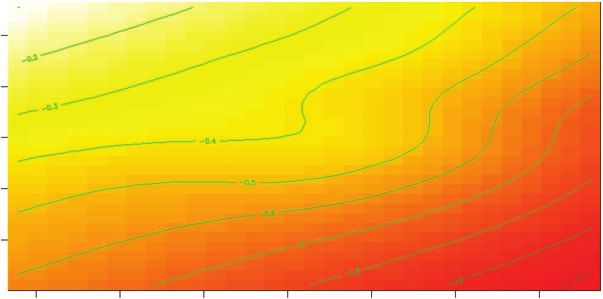
Distribution of humpback whales in Hervey Bay                                                               Australian Mammalogy        19

of a calf). Whales that were sighted two or more times within a           Although we cannot completely discount the potential of
season were included in this analysis. Residency time in days was     resighting the same pod between trips, there would be limited
calculated by subtracting the last sighting date from the first        impacts of this on modelling the relative distribution of
sighting date for each individual recorded within each year.          humpback whales. The use of opportunistic data is thought to
                                                                      have little effect on assessing the spatial segregation of calf and
                                                                      non-calf pods, as these biases are demonstrated to have more
Data analysis                                                         significant effects on abundance estimates (Williams et al. 2006).
Whale watches utilised a non-systematic search effort that did not    These effort biases can be overcome in spatial analysis with
incorporate equal coverage of the sampling area and employed a        sufficient coverage of environmental covariates within the
‘search-and-find’ type of effort. Higby et al. (2012) completed a      survey area. Finally, the biases in data collection outlined for this
detailed analysis on the use of presence-only data collected from     study are experienced equally across calf and non-calf pods
whale-watching vessels to determine humpback whale                    throughout the study period and are not thought to act
distribution. Despite some limitations, which are discussed           independently on differing pod compositions. Therefore the
below, Higby et al. (2012) found that this type of data had some      implications of comparing relative distribution between calf and
advantages and its use in analysis of distribution was warranted.     non-calf pods using presence-only data collected from whale-
    Given the absence of vessel GPS tracks, subsequent analysis       watching platforms is thought to be minimal.
is based on presence-only data. This, in addition to addressing           To determine whether mother–calf pod distributions were
some issues of lack of vessel GPS tracks, also limits multiple zero   influenced by environmental variables within the study area, a
counts in our dataset, reducing modelling bias and the need to        series of Generalised Additive Mixed Models (GAMM) were
account for zero-inflated models (Ridout and Demetrio 1992).           constructed, using the gamm4 package in R (Wood and Scheipl
    To ensure that no inferences are made on humpback whale           2017). Depth, distance from shore, and location (latitude and
distribution in areas where vessels did not travel, the final model    longitude) were considered as potential explanatory variables
predictions were made using only grid cells that had whale            for two response variables: (1) count of pods with calves, and
sightings throughout the 12-year study period. This significantly      (2) count of pods without calves. A Poisson error distribution
minimises the potential bias of predicting relative distribution in   with log-link function was utilised, with year as a random effect
areas where the vessels did not travel. However, it is important to   to account for temporal variation. The following model form was
note that inferences on distribution are limited to the travelled     used:
region, which is appropriate for this study as sufficient coverage                                           X
was achieved by pooling 12 years of data.                                                 Nk ¼ Yk þ 0 þ        f ðxik Þ
                                                                                                             i
    To ensure accuracy in data collection only trained
researchers, independent of whale-watching vessel crew, were          where f(xi) represents the smooth functions for each i explanatory
utilised to minimise: (1) the likelihood of misidentification of       variables, u0 is an intercept term, and Nk is the expected count in a
species, (2) inaccurate recording of sighting location, and (3) the   particular spatial grid cell k. The variable Yk represents the
misclassification of pod-composition (calf-pod and non-calf            random variable for sample year.
pod). To account for potential biases in detectability only trips
where the Beaufort Sea State was 6 (Calambokidis and Barlow          Model selection and prediction
2004; Andriolo et al. 2010) were included in subsequent analysis.     Model selection was based on the Akaike Information Criterion
As both the ‘calf’ and ‘non-calf’ groups contained adults, the        (AIC) to select the model with the lowest AIC value and highest
differences in detectability between groups is thought to be          explanatory power. Preliminary single-variable models were run
minimal and any behavioural differences between pod type as it        to determine which variables to include in the full model.
relates to detectability was not considered in this analysis.         A reduced model was then constructed using all variables that
    The use of whale-watching vessels also presents the potential     showed significant effects in the full model. To ensure
effort bias of seeking out pods encountered on previous trips. In     appropriate improvement in explanatory power, terms were
part, stratification of the study area into grid cells helps address   retained only when the reduction in AIC value was greater than
the issue of targeting high-use areas (Leaper et al. 1997; Macleod    the number of terms added. The best reduced models, based on
et al. 2004), with the 1-km2 grid cell division still allowing        AIC, were compared with a null model containing only the
for investigation of fine-scale influences of environmental             random effect for year using a likelihood ratio test (Polansky and
parameters on humpback whale distribution. However, it is             Robbins 2013). Only models that were significantly different
important to note that the nature of whale watching in Hervey Bay     (P  0.05) from the null model were selected as the final model.
limits the potential of relocating previously observed pods.          The final models were then used to predict counts of humpback
It takes ~1 h to commute from the harbour to the primary              whale pods with calves and pods without calves for each grid cell
whale-watching area and another hour to commute from the              within the study area.
whale-watching area back to the harbour. These two hours, plus
the additional hour between trips allows a whale at least three
hours to move from its previous location before there is potential    Results
to resight that whale on a subsequent trip. Analysis of photo-ID      From 16 August 2004 to 17 October 2016, 479 days were spent
data collected during this study from 2004–16 found that only         on the water and 10 585 whales in 4112 pods were documented.
4.1% of whales that were photographically identified were seen         It is important to note that these numbers do not reflect individual
twice on the same day over the study period.                          whales but rather a count of the humpback whales encountered on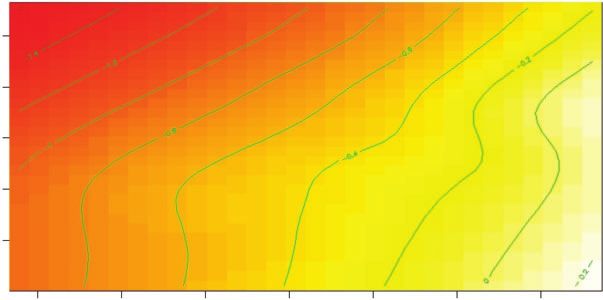
20      Australian Mammalogy                                                                                                       S. H. Stack et al.

Table 1. Summary of search effort and number of humpback whales                  study period. The longest duration of stay was 40 days. The
documented for each age-class in Hervey Bay over 12 years (2004–16)              sightings, including the first and last date sighted, span of
                                                                                 residency, and sex, if known, are summarised in Table 2.
Year       No. of      No. of   No. of       No. of      No. of        No. of
            days       pods     whales       adults     subadults      calves    Habitat modelling
2004         37          269    723           378          163          182      Model analysis procedures found latitude, longitude and depth to
2005         49          460    1246          526          460          260      be significant variables for modelling spatial distribution of both
2006         33          395    1056          629          141          286      calf and non-calf pods in Hervey Bay (Tables S1 and S2,
2007         41          422    1139          629          362          148
                                                                                 available as Supplementary Material to this paper). Including
2008         56          600    1476          525          730          221
2009         12          69     159            91          42            26
                                                                                 distance from shore and depth variables did not improve model
2010         26          297    795           456          184          155      fit, with top models for predicting both calf and non-calf pod
2011         28          293    797           468          253           76      counts including location (latitude and longitude) and month
2012         52          217    560           139          328           93      only (Tables S1 and S2).
2014         61          499    1233          509          527          197          The best-fit model for count of calf sightings per grid cell
2015         51          297    694           340          195          159      included a smoothed interaction term between latitude and
2016         33          294    707           381          18           308      longitude and month (expressed as a factor), both found to be
                                                                                 highly significant (Table 3). This model was significantly
                                                                                 different from that of the null model containing only a random
Table 2.    Within-season sightings of individual whales that displayed          effect for year (Likelihood ratio test statistic = 1009.66,
                extended residency time in Hervey Bay
                                                                                 P < 0.0001) and explained 63% of the deviance (Table 3).
Extended residency is defined as ‘10 or more days between first and last
sightings’. Sex was determined using either a photograph of the genital
                                                                                     The model identified a non-linear trend in the relationship of
        region, or by the presence of a calf next to an adult whale              location (latitude and longitude) to calf pod counts (Fig. 2). Calf
                                                                                 pods were found in the greatest density in mid-longitude areas
Individual            First         Last            Duration     Sex/lactating   within Hervey Bay, between 153.08 and 153.20E (Fig. 2).
  ID                sighting      sighting           (days)                          The best-fit model for count of non-calf sightings per grid cell
                                                                                 included a smoothed interaction term between latitude and
#0501          13 Aug. 2006     22 Sep. 2006          40         Unknown
                                                                                 longitude and month (expressed as a factor), with month found to
#0394          30 Aug. 2006     1 Oct. 2006           32         Unknown
#1067          13 Aug. 1999     13 Sep. 1999          31         Male
                                                                                 be the most significant term (Table 4). This model was
#1275          10 Aug. 1993     8 Sep. 1993           29         Male            significantly different from that of the null model, containing only
#0501          30 Aug. 2005     27 Sep. 2005          28         Unknown         a random effect for year (Likelihood ratio test statistic = 220.28,
#1247          11 Sep. 2007     5 Oct. 2007           24         Male            P < 0.0001) and explained 32% of the deviance (Table 4).
#0599          26 Aug. 1995     17 Sep. 1995          22         Unknown             The model identified a non-linear trend in the relationship
#0631          3 Sep. 1991      20 Sep. 1991          17         Female/No       between location (latitude and longitude) and non-calf pod
#1278          3 Sep. 2007      20 Sep. 2007          17         Female/Yes      counts (Fig. 3). When compared with calf pods, non-calf pods
#0501          15 Sep. 2002     1 Oct. 2002           16         Unknown         were located in a larger range of longitude within Hervey Bay,
#0853          14 Sep. 1991     29 Sep. 1991          15         Unknown         focussed around similar latitudes ranging from 25.2 to 24.8S
#3060          23 Aug. 2005     7 Sep. 2005           15         Unknown
                                                                                 (Fig. 3).
#0251          21 Sep. 2000     5 Oct. 2000           14         Female/Yes
#1012          19 Aug. 1991     2 Sep. 1991           14         Unknown
                                                                                     Model prediction showed that the highest counts of calf pods
#1900          17 Aug. 1998     31 Aug. 1998          14         Unknown         occurred in the waters near Fraser Island, with the highest
#0347          5 Sep. 1994      18 Sep. 1994          13         Unknown         predicted density occurring within the northern portion of the bay
#3289          3 Aug. 2006      15 Aug. 2006          12         Unknown         and alongside Fraser Island (Fig. 4). The model also showed that
#0454          21 Sep. 1989     2 Oct. 1989           11         Female/Yes      non-calf pod counts were low along the coastal waters of Fraser
#0251          4 Oct. 1992      14 Oct. 1992          10         Female/Yes      Island, with highest concentrations centred in the central and
#0502          13 Sep. 2010     23 Sep. 2010          10         Female/Yes      northern areas of the bay ~10–15 km off Fraser Island (Fig. 5).
                                                                                 There was minimal overlap between areas of pods with calves
                                                                                 and pods without calves, with the predicted distribution revealing
each day. Of these whales, 47.9% (n = 5071) were adults, 19.9%                   a clear spatial segregation between these pod types.
(n = 2111) were calves, and 32.2% (n = 3403) were subadults
(Table 1). Adults accounted for the highest proportion of whales                 Discussion
sighted, except in 2008, 2012, and 2014, when subadults made up
the larger proportion (Table 1).                                                 Distribution
                                                                                 Our results indicate that pods with and without a calf present were
                                                                                 segregated and utilise different areas of Hervey Bay. Pods with a
Residency in Hervey Bay                                                          calf were predicted to occur in the northern portion of the Bay
Throughout the study period, 748 whales were seen in Hervey                      alongside Fraser Island, whereas pods with no calf were
Bay on two or more dates within the same season. Most of                         predicted to occur ~10–15 km off Fraser Island, in the central and
these individuals were observed for two (n = 276) or three                       northern areas of Hervey Bay. The distribution of each pod type
(n = 112) days. Of the resighted whales, there were 20 cases of                  was predicted by the same environmental variable (i.e. location),
extended residency that spanned 10 or more days during this                      but each displayed a different relationship between the
Distribution of humpback whales in Hervey Bay Australian Mammalogy 21
Table 3. Results of the top generalised additive mixed model used for determining the linear and non-linear
relationships between all calf pod counts and variables, based on data collected within Hervey Bay, Australia, from 16
August 2004 to 17 October 2016
Variable Estimated d.f. Estimate (s.e.) c2 z P R2 Deviance explained
Non-linear s(latitude, longitude) 6.16 57.1122 Australian Mammalogy S. H. Stack et al.
–24.8
–24.9
Latitude
–25.0
–25.1
–25.2
152.90 152.95 153.00 153.05 153.10 153.15 153.20
Longitude
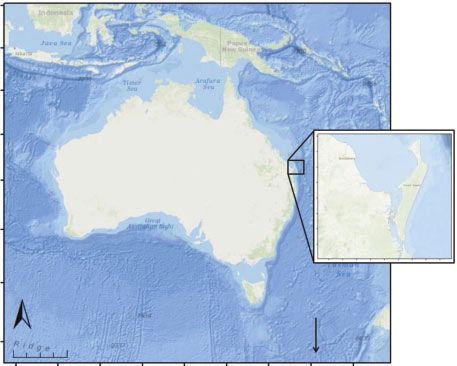
Fig. 3. The non-linear effects predicted from a generalised additive mixed model with interaction between latitude and longitude on non-calf pod use
within Hervey Bay, Australia, based on 12 years of sightings. The axes represent the independent variables of latitude and longitude, while contour lines
and corresponding numbers on them represent the smoothed effects of these variables on the response variable (count of non-calf pods).
24°40'0"S
24°50'0"S
25°0'0"S
Hervey Bay
25°10'0"S
High Fraser Island
0 5 10 20 km
Low Urangan harbour
152°30'0"E 152°40'0"E 152°50'0"E 153°0'0"E 153°10'0"E
Fig. 4. Model predictions of calf pod location and density in Hervey Bay, Australia, based on data collected from
2004 to 2016. Relative densities are presented to facilitate comparison among calf and non-calf pods, but calf pod
predictions ranged from 0.03 to 1.50 pods km–2.Distribution of humpback whales in Hervey Bay Australian Mammalogy 23
24°40'0"S
24°50'0"S
25°0'0"S
Hervey Bay
25°10'0"S
High
Fraser Island
0 5 10 20 km
Low Urangan harbour
152°30'0"E 152°40'0"E 152°50'0"E 153°0'0"E 153°10'0"E
Fig. 5. Model predictions of non-calf pod location and density in Hervey Bay, Australia, based on data collected
from 2004 to 2016. Relative densities are presented to facilitate comparison among calf and non-calf pods, but
non-calf pod predictions ranged from 0.13 to 1.48 pods km–2.
depth in other geographic regions for humpback whales, it was an Oviedo and Solís 2008), and are commonly found in depths of
important parameter to test for in Hervey Bay. Similarly, in terms less than 20 m (Ersts and Rosenbaum 2003; Félix and Botero-
of distance to shore, Hervey Bay is a semi-enclosed circle; there Acosta 2011); however, this is site-specific and dependent on the
are no defined onshore or offshore areas. In our study, the topography of the breeding ground. For example, in areas with
predicted distribution of non-calf pods fell along a north-easterly steep shoreline gradients, such as Madagascar and Hawaii,
axis, very close to shore in the north-eastern part of the bay close mother–calf pairs are more common in shallower waters (Ersts
to Fraser Island, and further offshore (10–15 km) in the central and Rosenbaum 2003) with gradients observed at 100 m or less
part of the bay. In Hervey Bay, distance from shore is not (Currie et al. 2018). In areas where shallow waters extend
correlated with deeper waters, such that the observed distribution offshore, mother–calf distribution is more appropriately
may not be driven by either distance from shore or water depth, described as their distance from shore. In Brazil, females and
but rather a complex interaction between behavioural and their dependent calves displayed a preference for areas up to
biological requirements. 10 km from shore (Félix and Botero-Acosta 2011). In Hervey
While segregation by water depth and distance to shore was Bay, our study supports these findings, with predicted calf pod
not evident in our study, the spatial distribution of calf pods in distribution along the sheltered coast of Fraser Island.
Hervey Bay is consistent with previous findings indicating that Although the trend for mother–calf pairs to prefer shallow,
the shallow, sheltered waters of Platypus Bay provide an protective water on breeding grounds was also observed in
important habitat for mother–calf pairs (Franklin et al. 2011). Hervey Bay, it is important to note the unique geography of the
Similar habitat preferences have also been observed for bay and the use of the area as a migratory resting site, not a
mother–calf pairs on their breeding grounds in the Dominican breeding ground. Since this study found that depth and
Republic (Mattila et al. 1994), Madagascar (Ersts and distance to shore were not significant predictors of habitat
Rosenbaum 2003), Brazil (Morete et al. 2007), Ecuador (e.g. preferences, the unique components of this specific region
Félix and Botero-Acosta 2011), Peru (Guidino et al. 2014), provide an opportunity to look at other factors that influence
Central America (Rasmussen et al. 2007), and Hawaii (e.g. mother–calf distribution.
Smultea 1994; Craig et al. 2014). In general, mother–calf pairs Several hypotheses have been suggested to explain habitat
tend to favour waters less than 50 m deep (e.g. Mattila et al. 1994; preference of mother–calf pods on their winter breeding grounds,24 Australian Mammalogy S. H. Stack et al.
including: (1) decreased predation pressure (Chittleborough Residency time
1953; Smultea 1994; Corkeron and Connor 1999), (2) reduced Braithwaite et al. (2015) carried out a modelling study examining
exposure to rough sea conditions (Whitehead and Moore 1982; the energetic requirements for female humpback whales
Elwen and Best 2004; Félix and Botero-Acosta 2011), migrating with a nursing calf. Their model showed that to
(3) conservation of energy (Whitehead and Moore 1982; minimise energy expenditure during migration, lactating females
Elwen and Best 2004), and/or (4) facilitation of social need to rest for 24–35 days and travel for 55–66 days (Braithwaite
stratification, thereby reducing harassment and risk of injury et al. 2015). These numbers align well with what is observed in
to calves from sexually active males (e.g. Whitehead and Hervey Bay, with females having somewhat shorter residency
Moore 1982; Smultea 1994; Craig et al. 2002, 2014; Ersts and times than males. Human activity has the potential to impact
Rosenbaum 2003). It is likely a combination of all four of these humpback whales in this resting area, causing them to be
explanations that describe the observed habitat distribution displaced from their resting ground without achieving adequate
of mother–calf pairs in Hervey Bay. However, since Hervey energetic benefits or by causing lactating females to engage in
Bay is a migratory stopover, not a calving site, it is used by behaviours that allocate energy away from nursing their calves. It
humpback whale females with older calves. Cartwright and is unknown whether current levels of human activity in Hervey
Sullivan (2009) showed that older calves, like the ones seen in Bay present levels of disturbance significant enough to impact
Hervey Bay, spend more time at rest or circling at the surface this population of humpback whales. Having baseline data on the
of the ocean. In Hervey Bay, energy conservation is likely a residency times of male and female humpback whales in this
key driver in habitat selection, given that whales may be more resting ground will be valuable as we monitor this population’s
vulnerable to increases in energy use during periods of resting status and recovery.
(Braithwaite et al. 2015). Given the unique usage of this
area as a migratory stopover, key drivers of habitat distribution Limitations of this study
may be more fine-scaled compared with larger breeding
grounds. These results are bound by the limitations of data collected
In the broader sense, differential migratory timing appears to opportunistically aboard a whale-watching vessel. While data
be one tactic that female humpback whales with a calf utilise to collected on a platform of opportunity can be very useful to
reduce energetic costs associated with male harassment (Craig evaluate species density and relative abundance to determine their
et al. 2003). By arriving as one of the last groups to Hervey Bay, spatial and temporal distribution (e.g. Henrys 2005; Kiszka et al.
mother–calf pairs’ arrival coincides with the approximate 2007; MacLeod et al. 2008; De Boer 2013), there are inherent
departure time of mature males (Craig et al. 2003). Although biases in search effort. Departing from Urangan Harbour, whale
mature males exhibit a preference for females without a calf, in watches are likely to limit their effort to where they first sight
order to maximise their reproductive success, they may also seek whales, which is typically in the lower portion of Hervey Bay, and
mating opportunities with maternal females (Craig et al. 2002). therefore would not always continue to travel into the middle of
In Hervey Bay, mother–calf pairs presumably tuck closely along the bay or towards the northern tip of Fraser Island. This means
the west coast of Fraser Island to reduce their interaction with that the southern portion of Hervey Bay was travelled more
mature males and to minimise energy expenditure. This coastal heavily than the northern or central areas. Given that the analysis
protection affords mothers the opportunity to spend a large conducted was to determine whether mother–calf pod distribution
amount of time nursing their calves and reduce the increased is influenced by environmental variables within the study area, it
energetic costs associated with being escorted by males (Craig was appropriate to summarise monthly counts for pods with and
et al. 2014). Conversely, our modelled prediction of non-calf without calves per grid cell for the entire 12-year period to ensure
pods supports the notion that females with the highest good spatial and temporal coverage of the area and therefore
reproductive potential (i.e. non-lactating adult females) are minimise search effort biases.
found in a different location than lactating females, thus driving
mature males towards the north-easterly axis of the bay to Management implications and recommendations
maximise reproductive potential (Craig et al. 2014). Lactating The newly sanctioned ‘immersive whale watching’ program in
mothers are particularly vulnerable to disturbance while in a Hervey Bay lacks a strong scientific assessment of the
resting ground because if these whales have to use energy to sustainability of such activities on humpback whales belonging
avoid a source of disturbance, that action diverts energy away to the Southern Hemisphere Breeding Stock E. This study
from lactation in mothers and therefore growth in calves provides a historical baseline against which comparison can be
(Braithwaite et al. 2015). Without the energetic deficits made in the future to determine whether whales are changing
associated with postpartum malnutrition and lactation, non-calf their distribution and/or residency in Hervey Bay. The timing of
pods are solely constrained by a lack of food and the need this study is crucial as it covers the period leading up to the
to subsist on stored energy reserves (Craig et al. 2003). Thus, introduction of a new form of tourism which has the potential to
they are not restricted to a specific area of the bay to help alter behavioural activity and energy use in this important resting
facilitate energetic conservation; rather, their fine-scale habitat ground. Further research is needed to assess the long-term
distribution appears to be conspecific-driven by the location of repercussions of swimming with whales as a form of tourism,
the highest mating opportunities. While whales in Hervey Bay and we are continuing to monitor and research this topic as a
are migrating southward to their feeding grounds, they can also follow-up to the current study.
be involved in activities associated with mating, i.e. competition Given the results of this study, mother–calf pairs may be
pods (Corkeron 1995). the most vulnerable to human-related disturbance in the bayDistribution of humpback whales in Hervey Bay Australian Mammalogy 25
compared with other pod types, due to their preferential habitat References
distribution along Fraser Island’s protected western coast. While Andriolo, A., Kinas, P. G., Engel, M. H., Martins, C. C. A., and Rufino, A. M.
regulations prohibit allowing swimmers to enter the water with a (2010). Humpback whales within the Brazilian breeding ground:
calf present, these whales are still subject to vessel traffic. Fraser distribution and population size estimate. Endangered Species Research
Island is also a popular tourist destination with many boats 11, 233–243. doi:10.3354/esr00282
transiting along the western shoreline after departing from Anon. (2014). Swimming with whales trial to start this winter. Fraser Coast
Urangan Harbour (Fig. S1). The parts of Platypus Bay that are Chronicle. Available at: https://www.frasercoastchronicle.com.au/news/
preferred by mother–calf pairs overlap with areas of high vessel swimming-whales-gets-tick-approval/2331323/?ref=hs [accessed 8
traffic from commercial whale-watching and recreational March 2018].
Braithwaite, J. E., Meeuwig, J. J., and Hipsey, M. R. (2015). Optimal
vessels. In other areas of the world, ‘swim-with’ activities have
migration energetics of humpback whales and the implications of
resulted in habitat displacement (e.g. Östman-Lind et al. 2004,
disturbance. Conservation Physiology 3(1), cov001 doi:10.1093/
Danil et al. 2005), altered activity budgets, and increased area conphys/cov001
avoidance (e.g. Samuels and Bejder 2004; Lundquist et al. 2008). Bryden, M. M., Corkeron, P. J., and Slade, R. W. (1989). Humpback whales
Given the importance of the bay for humpback whales on their (Megaptera novaeangliae) in Hervey Bay, Queensland 1988. Report to
southern migration and the known impacts of ‘swim-with’ the Australian National Parks and Wildlife Service, Canberra.
activities on cetaceans, understanding current patterns of habitat Calambokidis, J., and Barlow, J. (2004). Abundance of blue and humpback
use is a prerequisite for effective management of newly whales in the eastern North Pacific estimated by capture–recapture and
introduced anthropogenic activities (e.g. Félix and Botero- line-transect methods. Marine Mammal Science 20, 63–85. doi:10.1111/
Acosta 2011; Cartwright et al. 2012). j.1748-7692.2004.tb01141.x
Calambokidis, J., Falcone, E. A., Quinn, T. J., Burdin, A. M., Clapham,
Platypus Bay is part of the Great Sandy Marine Park, which is
P. J., Ford, J. K. B., Gabriele, C. M., LeDuc, R., Mattila, D., Rojas-
divided into management zones. Within the Park there are existing
Bracho, L., Straley, J. M., Taylor, B. L., Urban R, J., Weller, D.,
regulations that apply to both vessels and swimmers when they are Witteveen, B. H., Yamaguchi, M., Bendlin, A., Camacho, D., Flynn,
near a whale or dolphin, including approach distances and speed K., Havron, A., Huggins, J. and Maloney, N. (2008). SPLASH:
restrictions within the caution zones; however, there are no Structure of populations, levels of abundance and status of humpback
additional special management measures currently in place. There whales in the North Pacific. Final report for Contract AB133F-03-RP-
are regulations for swimming with whales to which commercial 00078, US Department of Commerce Western Administrative Center,
operators must adhere that are strict compared with those in other Seattle, Washington. Available at: https://faunalytics.org/wp-content/
regions of the world – most notably banning swimmers from uploads/2015/05/SPLASH-contract-Report-May08.pdf [accessed 5
entering the water in the presence of a calf, requiring the use of a April 2019].
mermaid line, and banning swimmers from entering the water Cartwright, R., Gillespie, B., LaBonte, K., Mangold, T., Venema, A., Eden,
when whales are within 100 m of the vessel (Fraser Coast Industry K., and Sullivan, M. (2012). Between a rock and a hard place: habitat
selection in female–calf humpback whale (Megaptera novaeangliae)
Code of Practice 2018).
pairs on the Hawaiian breeding grounds. PLoS One 7,
e38004doi:10.1371/journal.pone.0038004
Conclusions
Cartwright, R., and Sullivan, M. (2009). Behavioral ontogeny in humpback
The aim of this study was to provide baseline information on whale (Megaptera novaeangliae) calves during their residence in
humpback whale distribution in Hervey Bay in order to effectively Hawaiian waters. Marine Mammal Science 25, 659–680. doi:10.1111/
evaluate how whales may alter their use of this resting ground j.1748-7692.2009.00286.x
in response to anthropogenic activities. Managing wildlife Chaloupka, M., Osmond, M., and Kaufman, G. (1999). Estimating seasonal
populations requires empirical data to determine which abundance trends and survival probabilities of humpback whales in
Hervey Bay (east coast Australia). Marine Ecology Progress Series 184,
environmental and oceanographic features (e.g. water depth,
291–301. doi:10.3354/meps184291
distance to nearest shore) influence the distribution of a population
Chittleborough, R. G. (1953). Aerial observations on the humpback whale,
within a specific area. This information is vital to ensure that Megaptera nodosa (Bonnaterre), with notes on other species. Australian
human activities in the area, particularly the newly introduced Journal of Marine and Freshwater Research 4, 219–228. doi:10.1071/
swim-with-whale operations, are managed effectively. Continued MF9530219
research resulting in adaptive management actions will ensure the Chittleborough, R. G. (1965). Dynamics of two populations of the
long-term viability of Hervey Bay as an important habitat for the humpback whale, Megaptera novaeangliae (Borowski). Australian
eastern Australian humpback whale population. Journal of Marine and Freshwater Research 16, 33–128. doi:10.1071/
MF9650033
Conflicts of interest Clapham, P. J., and Baker, C. S. (2008). Whaling, modern. In ‘Encyclopedia
of Marine Mammals’ (Eds W. F. Perrin, B. Wursig, and J. G.
The authors declare no conflicts of interest.
M. Thewissen.) pp. 1328–1332. (Academic Press: San Diego.)
Constantine, R., Steel, D., Allen, J., Anderson, M., Andrews, O., Baker, C. S.,
Acknowledgements
Beeman, P., Burns, D., Charrassin, J.-B., Childerhouse, S., Double, M.,
We thank Pacific Whale Foundation’s members and supporters for providing Ensor, P., Franklin, T., Franklin, W., Gales, N., Garrigue, C., Gibbs, N.,
the funding necessary to conduct this study. Our gratitude goes to Andrew Harrison, P., Hauser, N., Hutsel, A., Jenner, C., Jenner, M.-N., Kaufman,
Ellis and Scott Whitcombe for their logistical support in Hervey Bay and to G., Macie, A., Mattila, D., Olavarria, C., Oosterman, A., Paton, D., Poole,
Rachael Nidiffer, Jaimi Raveneau, Suzie Vallance, Emmanuelle Martinez, M., Robbins, J., Schmitt, N., Stevick, P., Tagarino, A., Thompson, K., and
and numerous research interns for their assistance with data collection. Thank Ward, J. (2014). Remote Antarctic feeding ground important for east
you to two anonymous reviewers for providing guidance that has greatly Australian humpback whales. Marine Biology 161, 1087–1093.
improved this manuscript. doi:10.1007/s00227-014-2401-226 Australian Mammalogy S. H. Stack et al.
Corkeron, P. J. (1995). Humpback whales (Megaptera novaeangliae) in Franklin, T. (2012). The social and ecological significance of Hervey Bay,
Hervey Bay, Queensland: behaviour and responses to whale-watching Queensland for eastern Australian humpback whales (Megaptera
vessels. Canadian Journal of Zoology 73, 1290–1299. doi:10.1139/ novaeangliae). Ph.D. thesis, Southern Cross University, Lismore, New
z95-153 South Wales.
Corkeron, P. J., and Connor, R. C. (1999). Why do baleen whales migrate? Franklin, T., Franklin, W., Brooks, L., Harrison, P., Baverstock, P., and
Marine Mammal Science 15, 1228–1245. doi:10.1111/j.1748-7692.1999 Clapham, P. (2011). Seasonal changes in pod characteristics of eastern
.tb00887.x Australian humpback whales (Megaptera novaeangliae), Hervey Bay
Corkeron, P. J., Brown, M., Slade, R. W., and Bryden, M. M. (1994). 1992–2005. Marine Mammal Science 27(3), E134–E152. doi:10.1111/
Humpback whales, Megaptera novaeangliae (Cetacea: Balaenopteridae), j.1748-7692.2010.00430.x
in Hervey Bay, Queensland. Wildlife Research 21, 293–305. doi:10.1071/ Franklin, W., Franklin, T., Brooks, L., Gibbs, N., Childerhouse, S., Smith, F.,
WR9940293 Burns, D., Paton, D., Garrigue, C., Constantine, R., Poole, M. M., Hauser,
Coughran, D. and Gales, N. (2010). An unusual peak in recorded mortalities N., Donoghue, M., Russell, K., Mattila, D. K., Robbins, J., Oosterman,
of humpback whales in Western Australia: normal stochastic variability A., Leaper, R., Harrison, P., Baker, S., and Clapham, P. (2012). Antarctic
or a regional indication of carrying capacity? Report to the International waters (Area V) near the Balleny Islands are a summer feeding area for
Whaling Commission, SC/62/SH24. some eastern Australian (E1 breeding group) humpback whales
Craig, A. S., Herman, L. M., and Pack, A. A. (2002). Male mate choice and (Megaptera novaeangliae). Journal of Cetacean Research and
male–male competition coexist in the humpback whale (Megaptera Management 12, 321–327.
novaeangliae). Canadian Journal of Zoology 80, 745–755. doi:10.1139/ Fraser Coast Industry Code of Practice (2018). Immersive whale interactions
z02-050 in the Great Sandy Marine Park. Fraser Coast Tourism and Events,
Craig, A. S., Herman, L. M., Gabriele, C. M., and Pack, A. A. (2003). Special Publication, Queensland.
Migratory timing of humpback whales (Megaptera novaeangliae) in the Geoscience Australia (2013). Bathymetry Raster Data Set. Geoscience
central North Pacific varies with age, sex and reproductive status. Australia, Canberra.
Behaviour 140, 981–1001. doi:10.1163/156853903322589605 Guidino, C., Llapapasca, M. A., Silva, S., Alcorta, B., and Pacheco, A. S.
Craig, A. S., Herman, L. M., Pack, A. A., and Waterman, J. O. (2014). Habitat (2014). Patterns of spatial and temporal distribution of humpback whales
segregation by female humpback whales in Hawaiian waters: avoidance at the southern limit of the southeast Pacific breeding area. PLoS One
of males? Behaviour 151, 613–631. doi:10.1163/1568539X-00003151 9(11), e112627doi:10.1371/journal.pone.0112627
Currie, J. C., Stack, S. H., McCordic, J. A., and Roberts, J. (2018). Utilizing Henrys, B. P. (2005). Spatial distance sampling modeling of cetaceans
occupancy models and platforms-of-opportunity to assess area use of observed from platforms of opportunity. M.Sc. Dissertation, University
mother–calf humpback whales. Open Journal of Marine Science 08, of St Andrews, Scotland.
276–292. doi:10.4236/ojms.2018.82014 Higby, L. K., Stafford, R., and Bertulli, C. G. (2012). An evaluation of ad hoc
Danil, K., Maldini, D., and Marten, K. (2005). Patterns of use of Maku’a presence-only data in explaining patterns of distribution: cetacean
Beach, O’ahu, Hawai’i, by spinner dolphins (Stenella longirostris) and sightings from whale-watching vessels. International Journal of Zoology
potential effects of swimmers on their behavior. Aquatic Mammals 31, 2012, 1–5. doi:10.1155/2012/428752
403–412. doi:10.1578/AM.31.4.2005.403 Kaufman, G. D., Smultea, M. A., and Forestell, P. H. (1987). Use of lateral
body pigmentation patterns for photographic identification of east
Dawbin, W. H. (1997). Temporal segregation of humpback whales during
Australian (Area V) humpback whales. Cetus 7, 5–13.
migration in Southern Hemisphere waters. Memoirs of the Queensland
Museum 42, 105–138. Kiszka, J., Macleod, K., Van Canneyt, O., Walker, D., and Ridoux, V. (2007).
Distribution, encounter rates, and habitat characteristics of toothed
De Boer, M. N. (2013). Elusive marine mammals explored – charting under-
cetaceans in the Bay of Biscay and adjacent waters from platform-of-
recorded areas to study the abundance and distribution of cetaceans using
opportunity data. ICES Journal of Marine Science 64, 1033–1043.
multi-method approaches and platforms of opportunity. Ph.D. Thesis,
doi:10.1093/icesjms/fsm067
Wageningen University, Wageningen, Netherlands.
Leaper, R., Fairbarns, R., Gordon, J., Hiby, A., Lovell, P., and Papastavrou,
Department of Environment and Heritage (2005). Humpback whale recovery
V. (1997). Analysis of data collected from a whalewatching operation to
plan 2005–2010. Department of Environment and Heritage, Canberra.
assess relative abundance and distribution of the minke whale
Elwen, S. H., and Best, P. B. (2004). Female southern right whales,
(Balaenoptera acutorostrata) around the Isle of Mull, Scotland. Report of
Eubalaena australis: are there reproductive benefits associated with their
the International Whaling Commission 47, 505–511.
distribution off South Africa? Marine Ecology Progress Series 269,
Lundquist, D. (2007). Behavior and movements of southern right whales:
289–295. doi:10.3354/meps269289
effects of boats and swimmers. Ph.D. Thesis, Texas A&M University,
Ersts, P. J., and Rosenbaum, C. (2003). Habitat preference reflects social Texas, USA.
organisation of humpback whales (Megaptera novaeangliae) on a Lundquist, D., Sironi, M., Würsig, B., and Rowntree, V. (2008). Behavioural
wintering ground. Journal of Zoology 260, 337–345. doi:10.1017/ responses of southern right whales to simulated swim-with-whale
S0952836903003807 tourism at Peninsula Valdes, Argentina. Journal of Cetacean Research
ESRI (2017). ‘ArcGIS Desktop: Release 10.’ (Environmental Systems and Management 60, 1–15.
Research Institute: Redlands, CA.) Machernis, A. F., Powell, J. R., Engleby, L. K., and Spradlin, T. R. (2018). An
Félix, F., and Botero-Acosta, N. (2011). Distribution and behaviour of updated literature review examining the impacts of tourism on marine
humpback whale mother calf pairs during the breeding season off mammals over the last fifteen years (2000–2015) to inform research and
Ecuador. Marine Ecology Progress Series 426, 277–287. doi:10.3354/ management programs. US Department of Commerce, NOAA. NOAA
meps08984 Technical Memorandum NMFS-SER-7.
Forestell, P. H., Chaloupka, M., and Kaufman, G. D. (2003). Migratory Macleod, K., Fairbairns, R., Gill, A., Fairbairns, B., Gordon, J., Blair-Myers,
characteristics of humpback whales (Megaptera novaeangliae) in C., and Parsons, E. C. (2004). Seasonal distribution of minke whales
Hervey Bay and the Whitsunday Islands, Queensland, Australia: Balaenoptera acutorostrata in relation to physiography and prey off the
1993–1999. Final report to the Environment Protection Agency, Isle of Mull, Scotland. Marine Ecology Progress Series 277, 263–274.
Queensland Parks and Wildlife Service, Brisbane. doi:10.3354/meps277263Distribution of humpback whales in Hervey Bay Australian Mammalogy 27
MacLeod, C. D., Weir, C. R., Santos, M. B., and Dunn, T. E. (2008). in-hervey-bay-gets-green-light-after-threeyear-trial [accessed 19 March
Temperature-based summer habitat partitioning between white-beaked 2018].
and common dolphins around the United Kingdom and Republic of R Core Team (2017). R: A language and environment for statistical
Ireland. Journal of the Marine Biological Association of the United computing. R Foundation for Statistical Computing, Vienna, Austria.
Kingdom 88, 1193–1198. doi:10.1017/S002531540800074X URL: https://www.R-project.org/
Mattila, D. K., Clapham, P. J., Vasquez, O., and Bowman, R. S. (1994). Rankin, R. W., Maldini, D. A., and Kaufman, G. R. (2013). Bayesian estimate
Occurrence, population composition, and habitat use of humpback of Australian humpback whale calving interval under sparse resighting
whales in Samana Bay, Dominican Republic. Canadian Journal of rates: 1987 -2009. Journal of Cetacean Research and Management 13,
Zoology 72, 1898–1907. doi:10.1139/z94-258 109–121.
Morete, M. E., Bisi, T. L., and Rosso, S. (2007). Temporal pattern of Rasmussen, K., Palacios, D. M., Calambokidis, J., Saborio, M. T., Rosa,
humpback whale (Megaptera novaeangliae) group structure around L. D., Secchi, E. R., Steiger, G. H., Allen, J. M., and Stone, G. (2007).
Abrolhos Archipelago breeding region, Bahia, Brazil. Journal of the Southern Hemisphere humpback whales wintering off Central America:
Marine Biological Association of the United Kingdom 87, 87–92. insights from water temperature into the longest mammalian migration.
doi:10.1017/S0025315407054616 Biology Letters 3, 302–305. doi:10.1098/rsbl.2007.0067
Noad, M. J., Dunlop, R. A., Paton, D., and Cato, D. H. (2011a). Absolute and Ridout, M., and Demetrio, C. (1992). Generalized linear models for positive
relative abundance estimates of Australian east coast humpback whales count data. Revista de Matemática e Estatística 10, 139–148.
(Megaptera novaeangliae). Journal of Cetacean Research Management. Rose N, Weinrich M, Iníguez M, Finkle M (2005). Swim-with-whales
Sp Iss 3, 243–252. tourism – an updated review of commercial operations. Report to the IWC
Noad, M. J., Dunlop, R. A., Paton, D., and Kniest, H. (2011b). Abundance Scientific Committee No SC/57/WW6.
estimates of the east Australian humpback whale population: 2010 survey Samuels, A., and Bejder, L. (2004). Chronic interaction between humans and
and update. IWC Report SC/63/SH22. free-ranging bottlenose dolphins near Panama City Beach, Florida.
O’Connor, O. S., Campbell, R., Cortez, H., and Knowles, T. (2009). Whale Journal of Cetacean Research and Management 6, 69–77.
watching worldwide: tourism numbers, expenditures and expanding Smultea, M. A. (1994). Segregation by humpback whale (Megaptera
economic benefits. A special report from the International Fund for novaeangliae) cows with a calf in coastal habitat near the island of
Animal Welfare, IFAW and Economists at Large, Yarmouth, MA, USA. Hawaii. Canadian Journal of Zoology 72, 805–811. doi:10.1139/
Östman-Lind, J., Driscoll-Lind, A., and Rickards, S. (2004). Delphinid z94-109
abundance, distribution and habitat use off the western coast of the island Stoeckl, N., Smith, A., Newsome, D., and Lee, D. (2005). Regional economic
of Hawai’i. Southwest Fisheries Science Center Administrative Report dependence on iconic wildlife tourism: case studies for Monkey Mia and
LJ-04-02C, La Jolla, CA, USA. Hervey Bay. Journal of Tourism Studies 16, 69–81.
Oviedo, L., and Solís, M. (2008). Underwater topography determines critical Suzacq, L. D. L. P. (2007). Changes in abundance and distribution of
breeding habitat for humpback whales near Osa Peninsula, Costa Rica: humpback whales, Megaptera novaeangliae, in Hervey Bay Marine
implications for Marine Protected Areas. Revista de Biología Tropical Park, Australia, based on aerial surveys conducted in 1992 and 2004.
56, 591–602. M.Sc. Thesis, University of South Florida, Florida, USA.
Paterson, R. A. (1991). The migration of humpback whales (Megaptera Vang, L. (2002). Distribution, abundance and biology of Group V humpback
novaeangliae) in east Australian waters. Memoirs of the Queensland whales (Megaptera novaeangliae): a review. The State of Queensland
Museum 30, 333–341. Environmental Protection Agency, Conservation Management Report,
Peake, S. (2011). An industry in decline? The evolution of whale-watching Queensland.
tourism in Hervey Bay, Australia. Tourism in Marine Environments 7, Whitehead, H. (1983). Structure and stability of humpback whale groups off
121–132. doi:10.3727/154427311X13195453162651 Newfoundland. Journal of Cetacean Research and Management 61,
Polansky, L., and Robbins, M. M. (2013). Generalized additive mixed models 1391–1397.
for disentangling long-term trends, local anomalies, and seasonality in Whitehead, H., and Moore, M. J. (1982). Distribution and movements of
fruit tree phenology. Ecology and Evolution 3, 3141–3151. doi:10.1002/ West Indian humpback whales in winter. Canadian Journal of Zoology
ece3.707 60, 2203–2211. doi:10.1139/z82-282
Queensland Department of Environment and Science (2018). Great Sandy Williams, R., Hedley, S. L., and Hammond, P. S. (2006). Modeling distribution
Marine Park. Available at: https://www.npsr.qld.gov.au/parks/great- and abundance of Antarctic baleen whales using ships of opportunity.
sandy-marine/faq.html [accessed 21 August 2018]. Ecology and Society 11(1), art1doi:10.5751/ES-01534-110101
Queensland Department of the Premier and Cabinet (2017). Swimming with Wood, S., and Scheipl, F. (2017). gamm4: Generalized Additive Mixed
whales in Hervey Bay gets green light after three year trial. Available at: Models using ‘mgcv’ and ‘lme4’. R-package version 0.2–5. Available at:
http://statements.qld.gov.au/Statement/2017/9/10/swimming-with-whales- https://CRAN.R-project.org/package=gamm4
www.publish.csiro.au/journals/amYou can also read