Ecological niche divergence associated with species and populations differentiation in Erythrophleum (Fabaceae, Caesalpinioideae)
←
→
Page content transcription
If your browser does not render page correctly, please read the page content below
Plant Ecology and Evolution 152 (1): 41–52, 2019
https://doi.org/10.5091/plecevo.2019.1543

                                                                                                                   REGULAR PAPER

     Ecological niche divergence associated with species and populations
       differentiation in Erythrophleum (Fabaceae, Caesalpinioideae)
         Anaïs-Pasiphaé Gorel1,*, Jérôme Duminil2, 3, 4, Jean-Louis Doucet1 & Adeline Fayolle1

1
 Terra Teaching and Research Center, Forest is life, Gembloux Agro-Bio Tech, Université de Liège, Passage des Déportés, 5030 Gembloux,
Belgium
2
 Evolutionary Biology and Ecology, CP160/12, Faculté des Sciences, Université Libre de Bruxelles, 50 Av. F. Roosevelt, 1050 Brussels,
Belgium
3
 DIADE, IRD, Univ Montpellier, 911 Avenue Agropolis, BP 64501, 34394 Montpellier, France
4
 Bioversity International, Forest Genetic Resources and Restoration Programme, Sub-Regional Office for Central Africa, P.O. Box 2008
Messa, Yaoundé, Cameroon
*Author for correspondence: anais.gorel@uliege.be

          Background and aims – The isolation of populations inside forest refugia during past climate changes has
          widely been hypothesized as a major driver of tropical plant diversity. Environmental conditions can also
          influence patterns of diversity by driving divergent selection leading to local adaptation and, potentially,
          ecological speciation. Genetic and phylogenetic approaches are frequently used to study the diversification
          of African tree clades. However, the environmental space occupied by closely related species or intra-
          specific gene pools is barely quantified, though needed to properly test hypotheses on diversification
          processes.
          Methods – Using species distribution models, we determined the bioclimatic constraints on the distribution
          of closely related species and intra-specific gene pools. Our study model, Erythrophleum (Fabaceae –
          Caesalpinioideae), is a tropical tree genus widespread across Africa, and vastly investigated for genetics.
          Here, we combined the available phylogenetic data with information on niche divergence to explore the
          role of ecology into diversification at the species and gene pool levels.
          Key results – Ecological speciation through climate has probably played a key role in the evolution of the
          Erythrophleum species. The differential climatic niche of the species indicated adaptive divergence along
          rainfall gradients, that have probably been boosted by past climate fluctuations. At the gene pool level,
          past climate changes during the Pleistocene have shaped genetic diversity, though within Erythrophleum
          suaveolens, adaptive divergence also occurred.
          Conclusions – We believe that ecological speciation is a key mechanism of diversification for tropical
          African tree species, since such climatic niche partition exist among many other genera. Modelling the
          environmental niche of closely related taxa, and testing for niche differentiation, combined with divergence
          dates offered new insights on the process of diversification.

          Key words – Ecological divergence, ecological speciation, Erythrophleum, forest refuge hypothesis, gene
          pools, local adaptation, MaxEnt Algorithm, niche divergence, rainfall gradients, African tropical trees.

© 2019 The Authors. This article is published and distributed in Open Access under the terms of the Creative Commons Attribution
License (CC BY 4.0), which permits use, distribution, and reproduction in any medium, provided the original work (author and source)
is properly cited.
Plant Ecology and Evolution is published by Meise Botanic Garden and the Royal Botanical Society of Belgium
ISSN: 2032-3913 (print) – 2032-3921 (online)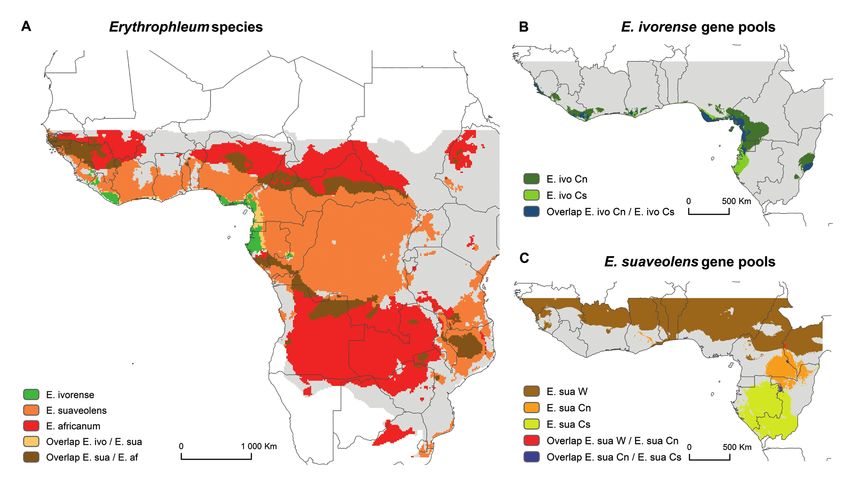
Pl. Ecol. Evol. 152 (1), 2019
INTRODUCTION a coastal savanna corridor about 100 km wide separating the
two Subcentres. Erythrophleum suaveolens is widespread
In the tropics, and specifically in Africa, the spatial pat- across tropical Africa, being distributed from the entire
terns of species diversity (Lönnberg 1929, Mayr & O’Hara Guineo-Congolian Centre to the Zambezian Centre, with the
1986, Sosef 1994, Linder 2014) and of intra-specific genetic notable exception of the wet forest areas that are occupied by
diversity (Hardy et al. 2013, Duminil et al. 2013) have fre- E. ivorense (Duminil et al. 2010). Erythrophleum africanum
quently been interpreted in the light of past climate changes. is broadly present in the Sudanian and Zambezian Centres
The forest refuge hypothesis postulates that climate-driven and Transition Zones around the Guineo-Congolian Centre.
expansions and contractions of lowland forests during gla-
In the Upper and Lower Guinean Subcentres, a strong spatial
cial periods, especially during the last glacial episode of the
genetic structure, mainly parapatric, has been demonstrated
Pleistocene (i.e. 120000 to 12000 years BP), led to diver-
within both E. ivorense and E. suaveolens (Duminil et al.
sification (Mayr & O’Hara 1986, Sosef 1994, Hardy et al.
2013). The contraction of forests inside refugia during the 2013, fig. 1B). Analyses of demographic reconstruction and
glacial maxima would have driven allopatric speciation or, at molecular dating suggest that the divergence between gene
least, genetic differentiation between fragmented populations pools was contemporaneous of the Pleistocene climatic cy-
(Maley 1996). Hosting a high number of endemic species, cles (Duminil et al. 2015), congruent with the forest refuge
areas such as hilly and mountainous regions, have been pro- hypothesis. However, the possible role of adaptive diver-
posed as candidate forest refugia (e. g. Sosef 1994). gence at the inter-specific level or as a complementary mech-
anism at the intra-specific level still needs to be investigated.
Environmental conditions can affect the inter- and intra-
specific diversity by driving divergent selection on traits Using species distribution models (SDMs) we determined
(Nosil 2012). Natural selection may contribute to ecological the bioclimatic constraints on the distribution of the Eryth-
divergence both in presence or absence of geographic isola- rophleum species across tropical Africa, and of E. ivorense
tion between populations (Graham et al. 2004, Simões et al. and E. suaveolens gene pools in the Upper and Lower Guin-
2016). At regional scale, ecological divergence between re- ean Subcentres. We combined the available phylogenetic data
lated species have already been supported for animals (Losos with information on ecological niche divergence to explore
et al. 2003, Graham et al. 2004, Knouft et al. 2006, Blair et the role of ecology into diversification. We specifically tested
al. 2013) and for plants (Schnitzler et al. 2012, Dauby et al. whether the adaptation to specific climatic conditions played
2014). In tropical Africa, there is a strong support of the role a role in the distribution and diversification. The adaptation
of climatic gradients as drivers of diversity. Rainfall repre- in response to climate is expected to result in species/pools
sents the most important environmental gradient at both pairs adapted to different habitat and presenting clear climatic
regional and continental scales and has been demonstrated niche divergence (Graham et al. 2004).
to determine species distribution (Swaine 1996, Bongers et
al. 1999) and floristic composition in forests (Fayolle et al.
METHODS
2014) and savannas (Fayolle et al. 2019).
Genetic and phylogenetic approaches are frequently used Occurrence data
to study the diversification of African tree clades (Hardy et
al. 2013), but the environmental space occupied by conge- We used two sets of occurrence data at the species and at
neric species or intra-specific gene pools is, however, bare- the gene pool levels. At the species level, a total of 606 geo-
ly quantified (but see Couvreur et al. 2011 for Isolona and referenced occurrence data (E. ivorense, n = 150, E. sua-
Monodora, Holstein & Renner 2011 for Coccinia). Quanti- veolens, n = 206 and E. africanum, n = 250, fig. 1A) were
fying the ecological divergence between related species or available from herbarium databases [Conservatoire et Jardin
gene pools is fundamental to properly support the role of botaniques de la Ville de Genève (CJB) and the South Afri-
ecology into diversification (Graham et al. 2004). At species can National Biodiversity Institute (SANBI)]. These samples
level, ecological divergence is one of the baseline evidence cover the whole range of each species. At the gene pool level,
needed to support a case of ecological speciation (Rundell 148 georeferenced occurrence data were provided from a ge-
& Price 2009, Nosil 2012). At gene pool level, ecological di- netic dataset (Duminil et al. 2013) for the two rainforest spe-
vergence provides an ecological basis for the assertion that cies, E. suaveolens and E. ivorense in the Upper and Lower
environmental variation may be driving local adaptation. Guinean Subcentres. The genetic samples covered only a re-
In this study, we investigated the diversification process- stricted part of the species range. Duminil et al. (2013) iden-
es between species and gene pools within Erythrophleum tified three gene pools for E. ivorense and three gene pools
(Fabaceae, Caesalpinioideae). Erythrophleum is a pan- for E. suaveolens. Within each species, the gene pools were
tropical tree genus represented by four parapatric species in distributed in West Africa (E. ivo W and E. sua W respective-
tropical Africa: Erythrophleum ivorense A.Chev, E. suaveo- ly for E. ivorense and E. suaveolens), in the northern part of
lens (Guill. & Perr.) Brenan, E. africanum Harms (Gorel et central Africa (E. ivo Cn and E. sua Cn, respectively) and in
al. 2015, fig. 1A) and E. lasianthum Corbishley (not studied the southern part of central Africa (E. ivo Cs and E. sua Cs,
here, restricted range in South-East Africa). Erythrophleum respectively, fig. 1B). Before modelling, we trimmed the oc-
ivorense is restricted to wet evergreen forest in the southern currences data so that only one point was kept per grid cell of
parts of the Upper and Lower Guinean Subcentres of the 1 km2. After trimming, the low number of unique occurrence
Guineo-Congolian Centre (White 1978, 1983) with a dis- available for E. ivo W (n < 5) prevented the modelling of its
junct distribution, being absent from the arid Dahomey Gap, potential distribution.
42Gorel et al., Ecological niche divergence in the Erythrophleum genus
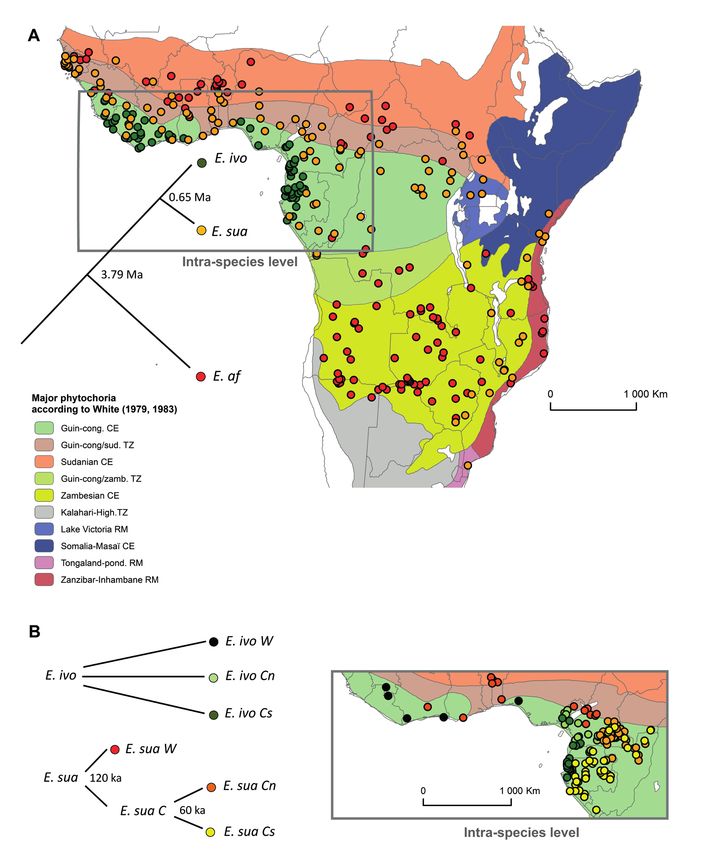
Figure 1 – Schematic cladograms and distribution of tropical African Erythrophleum species (A) and gene pools (B). The SDMs of the
species E. ivorense (E. ivo, n = 150), E. suaveolens (E. sua, n = 206), E. africanum (E. af, n = 250) were built for sub-Saharan Africa with
occurrence data provided by herbarium samples. The SDMs of the gene pools were built for the Upper Guinean Subcentre (West Africa)
and the Lower Guinean Subcentre (Atlantic Central Africa) with occurrence data from a genetic dataset (Duminil et al. 2013) and provided
by the authors. Occurrence of gene pools were available for West Africa E. ivorense (E. ivo W, n = 23), northern Central Africa E. ivorense
(E. ivo Cn, n = 60), southern Central Africa E. ivorense (E. ivo Cs, n = 48), West Africa E. suaveolens (E. sua W, n = 40), northern Central
Africa E. suaveolens (E. sua Cn, n = 247) and southern Central Africa E. suaveolens (E. sua Cs, n = 87). Occurrence data overlaid on a base
map showing the boundaries of the major phytochoria according to White (1983; Mollweide projection) with abbreviations corresponding
to Centre of Endemism (CE), Regional Mosaic (RM) and Transition Zone (TZ). Dates of divergence according to Duminil et al. (2015) are
indicated on the cladograms.
43Pl. Ecol. Evol. 152 (1), 2019
Environmental data Quantifying niche overlap and conservatism
To characterize the environmental space used by the species We quantified and tested the niche conservatism or diver-
and gene pools, we gathered the 19 Bioclim variables and gence among pairs of related species and gene pools. Pairs
one altitudinal layer at the resolution of 10 arc minute for dis- have been constructed by minimizing the phylogenetic and
tribution models at the species level across the whole tropi- the geographic distances. Niche overlap among pairs was
cal Africa and of 2.5 arc minute for distribution models at the estimated using the Schoener’s D statistic (Schoener 1968,
gene pool level across the Upper and Lower Guinean Sub- Warren et al. 2008) with the ‘PhyloClim’ package (Heibl &
centres (Hijmans et al. 2005). To reduce collinearity between Calenge 2011). The value of D ranges between 0, when two
species/gene pools have no niche overlap, and 1, when the
environmental variables and the risk of overfitting, we used a
two species/gene pools share the same environmental space.
subset of nine weakly correlated variables (rPearson < 0.70, the
Pearson correlation table is given in electronic appendix 1). To evaluate niche conservatism between related species
The nine variables retained were altitude (alt, in m), annual and gene pools, two randomization tests were run: the niche
mean temperature (Bio1, in °C × 10), isothermality (Bio3, identity test and the niche similarity test (the latter is also
called “background test”, Warren et al. 2008). For the iden-
unit-less), temperature annual range (Bio7, in °C × 10), an-
tity tests, 100 pseudoreplicates were created from the pooled
nual precipitation (Bio12, in mm), precipitation seasonality localities for each pair of species/gene pool and D values
(Bio15, in mm), precipitation of driest quarter (Bio17, in were calculated for each of the pseudoreplicate models. The
mm), precipitation of warmest quarter (Bio18, in mm) and distribution of these values was then compared to the D val-
precipitation of coldest quarter (Bio19, in mm). ues calculated from the actual niche models for that species/
gene pool pairs in the niche overlap test. The null hypothesis
Species distribution modelling is that the two species/gene pools have equivalent ecological
niches and is expected to be met only if both species/gene
To model the environmental niche of the species and gene pool tolerate exactly the same environmental conditions and
pools, we used the MaxEnt algorithm (Phillips et al. 2006) have an equivalent set of environmental condition available
within the R environment (R version 3.2.3, R Core Team, to them (Warren et al. 2008).
Vienna, Austria). To reduce the influence of bias in the spa- The similarity test allows testing for niche conservatism
tial sampling of occurrence data we used the weighted-tar- or divergence that cannot be explained by regional similari-
get group approach (Anderson 2003). The weighted-target ties or differences in the habitat available to each species or
group approach consists in selecting background data from gene pool (Warren et al. 2008). For each species/gene pool
points that reflect a sample selection bias similar to that of pair, the niche model for the focal species/gene pool is com-
the occurrence data. We used as background, occurrence data pared to a series of pseudoreplicate models generated by ran-
from herbarium and genetic samples of species others than domly sampling the available habitat (also called the “back-
Erythrophleum. Data from herbarium samples were down- ground”) of its related species/gene pool. The distribution of
loaded from the GBIF database (http://www.gbif.fr) and in- the D values calculated for each pseudoreplicate model was
cluded all the records available for Angiosperms in Africa. compared to the D value calculated for the actual data. The
Data from genetic samples (Hardy et al. 2013) were kindly available habitat of a species/gene pool is defined as the area
provided by the “Plant population genetics and community that is within the dispersal capabilities, either in the present
diversity in tropical rainforests” group (Université Libre de day or through the relevant past (Peterson 2011). To approxi-
Bruxelles, Belgium). mate the available habitat, we used a set of circular buffers
of increasing diameters around occurrence data (50, 100 and
We conducted species- and gene pool-specific tuning for 200 km around occurrence data for species and 25, 50, and
the three species and for the five gene pools studied using the R 100 km around occurrences data for gene pools with R pack-
package ‘ENMeval’ (Muscarella et al. 2014). We built SDMs age ‘rgeos’, Bivand & Rundel 2014). The null hypothesis of
with regularization multipliers ranging from 0.5 to 3 (incre- the similarity test is that measured niche overlap between
ment 0.5) and from 4 to 6 (increment 1) and with six different species or gene pools is explained by regional similarities or
feature-class combinations (L, LQ, H, LQH, LQHP, LQHPT; differences in available habitat. Rejection of the null hypoth-
where L corresponds to linear, Q to quadratic, H to hinge, P esis indicates that the observed niche differentiation between
to product and T to threshold). The Akaike Information Cri- species or gene pools is a function of habitat selection rather
terion (AIC) was used for model selection. The performance than simply an artifact of the environmental differences be-
of the selected models was evaluated using four criteria, the tween the available habitats (Warren et al. 2008).
Minimum Training Presence omission rate (ORmtp), the True
Skill Statistic (TSS, Allouche et al. 2006), the AUCtest and the RESULTS
AUCdiff. The AUCtest corresponds to the threshold-independ-
ent metric Area Under the receiver operating characteristic Potential distribution of Erythrophleum species and gene
Curve (Hanley & McNeil 1982). The AUCdiff corresponds to pools
the difference between AUC values based on training locali- For all distribution models, at the species and at the gene
ties and AUCtest (Warren & Seifert 2011). These criteria were pool level, the discrimination between environmental condi-
obtained using the ‘checkerboard2’ approach of data parti- tions of occurrence localities from those of background lo-
tioning (Muscarella et al. 2014). calities was good (table 1). For evaluating the robustness of
44Gorel et al., Ecological niche divergence in the Erythrophleum genus
Table 1 – Performance of SDMs selected based on AIC for each Erythrophleum species and gene pool.
Five indicators were used to assess the SDM performance. Abbreviations correspond to AUCtest: Area Under the receiver operating
characteristic Curve calculated with a test sample; AUCdiff: the difference between AUC values based on training localities and AUCtest; ORmtp:
the Minimum Training Presence Omission Rate; TSS: the True Skill Statistic. The feature class is given for each SDM with abbreviations
corresponding to L: linear, Q: quadratic, H: hinge. RM corresponds to the Regularization Multiplier. For gene pools, abbreviations correspond
to: E. ivo W: West Africa E. ivorense; E. ivo Cn: northern Central Africa E. ivorense; E. ivo Cs: southern Central Africa E. ivorense; E. sua W:
West Africa E. suaveolens; E. sua Cn: northern Central Africa E. suaveolens; and E. sua Cs: southern Central Africa E. suaveolens.
Species Gene pools
E. ivorense E. suaveolens E. africanum E. ivo Cs E. ivo Cn E. sua Cs E. sua Cn E. sua W
FC LQ LQ LQ LQ LQH LQHP LQ LQ
RM 0.5 2.5 6 1 3 1 1 6
AUCtest 0.94 0.71 0.71 0.91 0.84 0.78 0.90 0.91
AUCdiff 0.03 0.06 0.07 0.05 0.06 0.08 0.02 0.01
ORmtp 0.05 0.03 0.01 0.16 0.06 0.12 0.09 0.08
TSS 0.93 0.44 0.33 0.64 0.78 0.52 0.83 0.87
an ENM, AUC values greater than 0.9 are considered to be ence that extended along the coast. The potential distributions
“very good” at describing a population’s distribution, while of E. sua W, E. sua Cn and E. sua Cs were largely distinct
AUC values of 0.7–0.9 are considered to be “good”, and less (fig. 2C). E. sua W spanned the Upper Guinean Subcentre,
than 0.7 are classified as being “uninformative” (Baldwin the Dahomey Gap and the northern part of the Lower Guin-
2009). Here, the AUC values for all models ranged from 0.71 ean Subcentre. In central Africa, the potential distribution
to 0.94 (four models with an AUC equal or higher than 0.90). of E. sua Cn was mainly localized in south east Cameroon
Examination of TSS values also yielded high predictive ac- whereas E. sua Cs was restricted to Gabon and Republic of
curacies. AUCdiff and ORMTP values were low (range of 0.01 the Congo.
to 0.08 and 0.01 to 0.16, respectively) indicating relatively
few model overfittings. The features of the selected models Climatic constraints on the distribution of
were mostly linear and quadratic (table 1). Erythrophleum species and gene pools
At the species level, the modelled potential distribution
for each species accurately predicted the observed species’ The distribution of the three Erythrophleum species was
distribution (fig. 2A). The potential distribution of E. ivo- mainly constrained by annual precipitation, annual tempera-
rense was restricted to the evergreen forests in the Upper and ture range, precipitation of driest quarter and altitude (table
Lower Guinean Subcentres and thus showed an interruption 2 and electronic appendix 2). Annual precipitation and an-
in the Dahomey gap. Erythrophleum suaveolens had a wide nual temperature range explain together more than 40% of
potential distribution that extended over the entire Guineo- the distribution of each species (table 2). Overall, E. suaveo-
Congolian Centre, with the exception of the area occupied lens and E. africanum were found in the same range of an-
by E. ivorense, and the adjacent Transition Zones (Guineo- nual precipitation (optimum close to 1690 mm for E. suaveo-
Congolian/Zambezian and the Guineo-Congolian/Sudanian). lens and 1700 mm for E. africanum), whereas E. ivorense
The model did not predict a high probability of presence of was found at higher annual precipitation (optimum close
E. suaveolens in the Zambezian Centre except in southern to 3900 mm). Erythrophleum ivorense and E. suaveolens
Tanzania and northern Mozambique. The potential distribu- showed an optimum suitability at low annual temperature
tion of E. suaveolens was also largely distinct from that of range (close to 8°C) while E. africanum occurs in sites with
E. africanum except in the Guinean-Congolese/Sudanian high annual temperature range (close to 30°C, table 2). The
and Guinean-Congolese/Zambezian Transition Zones where distribution of E. ivorense and E. suaveolens was also con-
the distributions overlapped. The potential distribution of strained by elevation and showed an optimum at relatively
E. africanum was restricted to the savannas of the Sudanese low altitudes (between 0 and 400 m). Precipitation of the dri-
and Zambezian Centres and to the Transition Zones around est quarter was an important constraint on the distribution of
the Guineo-Congolian Centre. E. africanum with highest suitability at values close to 0 mm,
At the gene pool level, the models suggest overlapping corresponding to an extreme dry season (table 2).
potential distributions for the E. ivorense gene pools (fig. 2B) In the Upper and Lower Guinean Subcentres, the distri-
but distinct potential distributions for the E. suaveolens gene bution of E. ivorense and E. suaveolens gene pools showed
pools (fig. 2C). The E. ivo Cn potential distribution covered contrasting responses to the environment (table 2, electronic
almost the whole distribution of E. ivorense and extended to appendix 2). Precipitation of the warmest quarter was the
the geographic area occupied by E. ivo W. The potential dis- most important constraint on the potential distribution of
tribution of E. ivo Cs was restricted to the low coastal plain E. ivo Cs and E. sua W (64.7% and 80.7% respectively with
of the Gabon estuary with a relative low probability of pres- high permutation values) and to a lesser extent on the distri-
45Pl. Ecol. Evol. 152 (1), 2019
Table 2 – Contribution (C in %) and permutation (P in %) of the eight retained environmental variables to model the distribution
of each species and gene pool.
A very low percentage of permutation indicates that the model did not depend heavily on the variable. For each species/pool, the three most
important environmental variables, i.e. with highest contribution and with a permutation score at least 5%, are shown in bold. For gene pools,
abbreviations correspond to: E. ivo W: West Africa E. ivorense; E. ivo Cn: northern Central Africa E. ivorense; E. ivo Cs: southern Central
Africa E. ivorense; E. sua W: West Africa E. suaveolens; E. sua Cn: northern Central Africa E. suaveolens; and E. sua Cs: southern Central
Africa E. suaveolens.
Species Gene pools
Environmental variables E. ivorense E. suaveolens E. africanum E. ivo Cs E. ivo Cn E. sua Cs E. sua Cn E. sua W
C = 0.0 C = 5.3 C = 0.0 C = 0.3 C=0 C = 1.5 C = 3.2 C=0
Annual mean temperature
P = 5.3 P = 11.0 P = 0.0 P=0 P=0 P = 11.1 P = 18.6 P=0
C = 0.3 C = 0.0 C = 0.2 C=0 C=0 C = 3.5 C = 40.3 C=0
Isothermality
P = 2.5 P = 0.0 P = 5.1 P=0 P=0 P = 4.8 P=0 P=0
C = 33.0 C = 33.9 C = 26.3 C = 26 C = 36 C = 7.5 C=0 C=0
Annual temperature range
P = 13.1 P = 12.8 P = 31.3 P = 43.3 P = 46.5 P = 3.2 P = 0.7 P=0
C = 29.9 C = 23.9 C = 18.1 C = 2.3 C = 17.2 C = 0.6 C = 17.5 C=0
Annual precipitation
P = 40.9 P = 32.7 P = 18.4 P=0 P=5 P = 3.8 P = 33 P=0
C = 3.6 C = 4.0 C = 0.2 C=0 C = 0.2 C = 1.2 C = 22.9 C=0
Precipitation seasonality
P = 7.8 P = 6.2 P = 0.2 P=0 P=0 P = 4.4 P = 29 P=0
C = 1.4 C = 0.5 C = 50.1 C=0 C = 27.1 C = 0.9 C = 3.5 C = 19.3
Precipitation of driest
quarter
P = 6.7 P = 2.7 P = 42.2 P=0 P=0 P=0 P = 1.9 P = 39.7
C = 16.1 C = 6.0 C = 3.5 C = 64.7 C=0 C = 15.5 C = 2.5 C = 80.7
Precipitation of warmest
quarter
P = 0.4 P = 9.0 P = 2.8 P = 32.3 P=0 P = 26.7 P = 4.7 P = 60.3
C = 2.9 C = 1.4 C = 0.6 C=0 C = 8.4 C = 62.2 C = 0.5 C=0
Precipitation of coldest
quarter
P = 3.3 P = 0.2 P = 0.0 P=0 P = 29.4 P = 40 P=6 P=0
C = 12.8 C = 25.0 C = 1.0 C = 6.6 C = 11.2 C=7 C = 9.6 C=0
Elevation
P = 20.1 P 25.3 P = 0.0 P = 24.4 P = 19.1 P = 6.1 P = 6.1 P=0
bution of E. sua Cs (15.5%; table 2). The presence probability Niche overlap and conservatism among Erythrophleum
of E. ivo Cs and E. sua Cs increased with precipitation of species and gene pools
the warmest quarter (respectively optimum close to 1070 mm Pairs of species/gene pools showed varying degrees of niche
and optimum when Bio18 was superior to 570 mm) while overlap, from limited overlap (D = 0.09) between E. sua W
the probability of E. sua W decreased (optimum close to 65 and E. sua Cn to high overlap (D = 0.53 and 0.47) between
mm). Annual temperature range was an important environ- E. ivo Cn and E. ivo Cs, and between E. suaveolens and
mental factor constraining the distribution of both E. ivo Cs E. africanum (table 3).
and E. ivo Cn (respectively 26% and 36% of contribution, For all the species and gene pool pairs, the null hypoth-
table 2) with highest suitability at values close to 8°C (elec- esis of the identity test (p < 0.001) was rejected. The species/
gene pools did not tolerate exactly the same environmental
tronic appendix 2). The precipitation seasonality (22.9%)
conditions and/or had not equivalent set of environmental
and annual precipitation (17.5%) together shape the potential conditions available to them. Although these results could
distribution of E. sua Cn (table 2). Areas with precipitation reflect ecological divergence, they might also simply re-
seasonality around 20 mm and with an annual precipitation flect the fact that species/gene pools are exposed to different
of 850 mm showed highest suitability. available habitats.
46Gorel et al., Ecological niche divergence in the Erythrophleum genus
The null hypothesis of the similarity test was rejected at diversity, though within E. suaveolens, adaptive divergence
species level and for the E. suaveolens gene pools (table 3), most probably also occurred.
thus indicating that the observed niche differentiation be- Ecological speciation has probably played a key role in
tween the species and the E. suaveolens gene pools was a the evolution of African Erythrophleum species. Climatic
function of habitat selection rather than simply an artifact of niches of the related species tended to be less similar than ex-
the environmental differences between the available habitats. pected by chance and provided evidence for adaptive diver-
On the contrary, the similarity tests indicated that the niche gence (Graham et al. 2004, Warren et al. 2008). The climate,
of the E. ivorense gene pools tended to be more similar than and specifically annual precipitation and annual temperature
expected by chance and provided an evidence for niche con- range, strongly constrained the distribution of the species and
servatism (table 3). One comparison shifted from similar to our results confirmed the affinity of E. ivorense for wet forest
divergent niches with buffer size: the niche of E. sua W vs. E. conditions, the huge ecological amplitude of E. suaveolens
sua Cn were significantly more similar until the 50 km scale, across moist and dry forests, and the association of E. afri-
but significantly less similar at the 100 km scales (table 3). canum with savannas. The traits and growth rates previously
observed among Erythrophleum species are consistent with
an ecological sorting along an aridity gradient. The savanna
DISCUSSION species, E. africanum, associated with the driest habitats, has
the smallest leaves (6.5 × 3.5 cm), the highest wood density
In Africa, only few studies characterized the relationship (0.852 ± 0.036 g/cm3) and the lowest growth rates (0.15 cm/
between the distribution of sister plant species and climate year, see Gorel et al. 2015 for a review on Erythrophleum
(but see Dransfield & Uhl 2008, Blach-Overgaard et al. species in Africa). These traits characterize drought-tolerant
2010, Holstein & Renner 2011, Couvreur et al. 2011). Stud- tropical tree species (Markesteijn & Poorter 2009). In con-
ies on intra-specific diversity are even less common. Here, trast, the wet forest species, E. ivorense shows the opposite
we explored the role of ecology into diversification of the suite of traits and the highest growth rates (leaves: 8.5 ×
Erythrophleum genus in tropical Africa. We specifically in- 4 cm; wood density: 0.774 ± 0.058 g/cm3; growth rates: 0.65
vestigated the climatic constraints on the distribution at the ± 0.50 cm/year).
species and gene pool levels. At the species level, our results The climate-constrained distribution of the species as-
provide baseline evidence to support a case of climate-driven sociated with the estimated divergence dates (Duminil et
ecological speciation. At the gene pool level, past climate al. 2015) argue for past climate changes promoting eco-
changes during the Pleistocene have probably shaped genetic logical speciation. Past climate changes are expected to fa-
Figure 2 – Potential distributions for Erythrophleum species (A), E. ivorense (B) and E. suaveolens gene pools (C). Suitable areas were
identified for the three species and the five gene pools using a suitability threshold that was identified by maximizing the sum of the sensitivity
(true positive rate) and specificity (true negative rate). Overlap between pairs of species and pools are also given.
47Table 3 – Niche overlap and similarity between pairs of Erythrophleum species and gene pools.
48
Niche overlap (D) and results of the similarity tests with P-values (P) are given for each species pair and for different background definitions (25, 50, 100 and 200 km buffers). D is the
Schoener’s D similarity metric. Dcomp is the Schoener’s D metric calculated to compare the overlap between the SDM of each species and its own null model, which illustrate how
environmental heterogeneity increases with the distance of occurrence points for each species (for the method see Nakazato et al. 2010). For gene pools, abbreviations correspond to:
E. ivo W: West Africa E. ivorense; E. ivo Cn: northern Central Africa E. ivorense; E. ivo Cs: southern Central Africa E. ivorense; E. sua W: West Africa E. suaveolens; E. sua Cn: northern
Central Africa E. suaveolens; and E. sua Cs: southern Central Africa E. suaveolens. More/less similar indicate that niches are more/less similar than expected by chance (null model). ns:
not significant (P > 0.05).
25 km buffer 50 km buffer 100 km buffer 200 km buffer
Pl. Ecol. Evol. 152 (1), 2019
Niche
Dcomp Similarity Dcomp Similarity Dcomp Similarity Dcomp Similarity
Overlap (D)
E. ivorense – Less similar Less similar Less similar
0.90 ± 0.01 PGorel et al., Ecological niche divergence in the Erythrophleum genus
vour adaptive divergence by driving reproductive isolation forest refuge hypothesis. Interestingly, the genetic differen-
between fragmented populations in distinct environments tiation within E. ivorense has been identified to be lower than
(Rundle & Nosil 2005, Nosil 2012) or also, in the case of the genetic differentiation within E. suaveolens (Duminil
new climates moving as a front across landscapes, by in- et al. 2013, 2015). To interpret these results, Duminil et al.
creasing the opportunity of individuals to adapt to new con- (2015) suggested that the distribution of E. ivorense has been
ditions (Donoghue & Edwards 2014). For these reasons, the less fragmented than that of E. suaveolens, either because
slightly warmer climates of the early Pliocene (until ~3.2 glacial refugia of E. ivorense were closer to each other and/
Ma, Zachos et al. 2001) could have boosted the divergence or were separated for a shorter period than that of E. suaveo-
of E. africanum from the common ancestor of E. suaveolens lens. The uniform environmental conditions occupied by the
and E. ivorense. Between E. suaveolens and E. ivorense, the gene pools of E. ivorense can also be an alternative expla-
divergence date is concomitant with the Pleistocene climatic nation to the lower genetic differentiation. E. ivorense is a
cycles (c. 650 ka, Duminil et al. 2015) i.e. the climate-driven wet-forest specialist while E. suaveolens is more generalist,
contractions of forests inside refuges. Speciation between the distributed across multiple environments. Indeed, specialist
two forest species is probably due to the combined action of species are more likely to suffer from resources limitation
the isolation of populations into forest refuges and the ad- and are more susceptible to environmental changes and lo-
aptation to contrasting environments (Vanzolini & Williams cal extinction during climate changes (Sexton et al. 2017).
1981, Damasceno et al. 2014). Erythrophleum ivorense may have been able to survive only
Within species, the gene pools are distributed in con- in a very narrow range of environmental conditions during
trasted climate for E. suaveolens, and at contrasted altitude past forest fragmentation (i.e. in environmentally similar
for E. ivorense (electronic appendix 2), however, a general refuges) and isolated populations were therefore not been
conclusion on the role of ecology into genetic diversification subjected to divergent selection. In contrast, the huge eco-
is more difficult to picture out. The climate-driven contrac- logical amplitude of E. suaveolens could have contributed
tions of forests inside refuges during the Pleistocene have to the survival of populations inside refuges with distinct
probably shaped intra-species genetic diversity (Hardy et environmental conditions, as shown by Rolland & Salamin
al. 2013, Duminil et al. 2015), though within E. suaveolens, (2016) for animals and theoretically developed by Sexton et
adaptive divergence also occurred. Within E. suaveolens, the al. (2017). Then, divergent selection induced local adaptation
climatic niches of the gene pools tended to be less similar and genetic diversification between populations, which was
than expected by chance, providing evidence for ecological boosted by the absence of gene flow due to spatial isolation
divergence (Graham et al. 2004, Warren et al. 2008). E. sua- (Rundle & Nosil 2005).
veolens gene pools are distributed along rainfall gradients: at
one end, the West African gene pool (E. sua W), is found in Ecological speciation along rainfall gradients is probably
the more arid habitats, and at the other end the southern gene a key mechanism in the diversification of the tropical Afri-
pool (E. sua Cs) occupied higher rainfall habitats. In north- can flora, since equivalent patterns of niche partitioning exist
ern Cameroon, the genetic discontinuity between the Central within many other genera, such as Diospyros (White 1978),
and the West African gene pools of E. suaveolens is located Afzelia (Donkpegan 2017) and Guibourtia (Tosso 2018). At
between the Guineo-Congolian Centre and the Guineo-Con- the intra-species level, though we believe that the E. suaveo-
golian/Sudanian Transition Zone (White 1983) and corre- lens gene pools in the Upper and Lower Guinean Subcentres
sponds to a steep ecological transition. The northern limit of grow under strongly different environmental conditions, the
the southern gene pool (E. sua Cs) correspond to the climatic expanding distribution of gene pools recolonizing from dif-
hinge as defined by Suchel (1990), where the sunny dry sea- ferent forest refugia might have obscured the similarity tests
son in the north and the cloudy one in the south (Philippon (Graham et al. 2004, Guisan & Thuiller 2005). In contrast,
et al. accepted 2018), less harsh for plants, have already been niche conservatism can be found potentially due to the fact
hypothesized as driver of floristic diversification (Suchel that a crucial ecological dimension was not included among
1990, Gonmadje et al. 2012). We noted that, according to the variables tested (Graham et al. 2004, Guisan & Thuiller
similarity tests, the E. sua W vs. E. sua Cn niche comparison 2005). Defining niches along relevant environmental axes
shifted from similar to divergent with buffer size. At fine and is a challenge and our results strongly depend on the envi-
medium scales, the two gene pools occupy similar habitats, ronmental factors we have tested. For instance, even if cli-
but at larger scales (100 km buffer size) the available habitat mate and specifically rainfall has been found as a main driver
is more suitable for E. sua W than the locations where E. sua of floristic diversity in multiple studies (Engelbrecht et al.
Cn is found and vice versa. This result may be explained by 2007, Maharjan et al. 2011, Sterck et al. 2014, Gaviria et al.
the poor resolution of the bioclim variables at a local scale 2017), conclusions about the role of climate in the diversifi-
(< 50 km) which may be not sufficient to discriminate be- cation processes within Erythrophleum may be confounded
tween the two habitats (Deblauwe et al. 2016). This might by the correlations between climate and other environmental
also indicate significant niche divergence, contingent upon factors, as soil fertility (Swaine 1996) and mycorrhizal as-
the assumption that 100 km is a reasonable estimate of the sociation (Gerz et al. 2018). To valid ecological divergence
dispersal potential of E. suaveolens over the relevant past between the species and gene pools, additional observations
period (perhaps since the last glacial episode c. 115–10 ka, on their differential abilities to survive and reproduce in dif-
Peterson 2011). ferent local environmental conditions, possibly including the
Within E. ivorense, the similarity tests support niche con- experimental quantification of drought tolerance, would be
servatism, rejecting ecological divergence and supporting the useful (Engelbrecht et al. 2007).
49Pl. Ecol. Evol. 152 (1), 2019
SUPPLEMENTARY DATA diversification. Frontiers in Genetics 5: 1–12. https://doi.
org/10.3389/fgene.2014.00353
Supplementary data are available in pdf at Plant Ecology Dauby G., Duminil J., Heuertz M., Koffi G.K., Stévart T., Hardy
and Evolution, Supplementary Data Site (https://www.ingen- O.J. (2014) Congruent phylogeographical patterns of eight tree
taconnect.com/content/botbel/plecevo/supp-data) and con- species in Atlantic Central Africa provide insights into the past
sist of: (1) Pearson correlation coefficients between the 19 dynamics of forest cover. Molecular Ecology 23: 2299–2312.
Bioclim variables and the altitude; and (2) response curves https://doi.org/10.1111/mec.12724
to the 8 retained environmental variables for each species, Deblauwe V., Droissart V., Bose R., Sonké B., Blach‐Overgaard A.,
E. ivorense gene pools and E. suaveolens gene pools. Svenning J.‐C., Wieringa J.J., Ramesh B.R., Stévart T., Cou-
vreur T.L.P. (2016) Remotely sensed temperature and precipita-
tion data improve species distribution modelling in the tropics:
ACKNOWLEDGEMENTS Remotely sensed climate data for tropical species distribution
models. Global Ecology and Biogeography 25: 443–454. htt-
We thank the curators and directors of the herbaria CJB and ps://doi.org/10.1111/geb.12426
SANBI and the “Plant population genetics and community
Donkpegan A.S.L. (2017) Histoire évolutive du complexe Afzelia
diversity in tropical rainforests” group (Université Libre de
Smith (Leguminosae - Caesalpinioideae) dans les écosystèmes
Bruxelles, Belgium) who kindly provided the occurrence forestiers et savanicoles en Afrique tropicale. PhD Thesis, Uni-
data. Further thanks are due to Ghislain Vieilledent (France), versity of Liège, Liège, Belgium.
Olivier Hardy (Belgium) and Dakis-Yaoba Ouédraogo (Bel- Donoghue M.J., Edwards E.J. (2014) Biome shifts and niche evo-
gium) who provided helpful comments on preliminary ver- lution in plants. Annual Review of Ecology, Evolution, and
sions. The manuscript has been kindly edited by Prof. Mike Systematics 45: 547–572. https://doi.org/10.1146/annurev-ecol-
Swaine (United Kingdom). Financial support of the NGO sys-120213-091905
Nature+ (Belgium) is gratefully acknowledged. This re- Dransfield J., Uhl N.W. (2008) Genera palmarum: the evolution and
search was supported by Gembloux Ago-Bio Tech, Univer- classification of palms. Kew, Royal Botanic Gardens.
sity of Liege. Duminil J., Heuertz M., Doucet J.-L., Bourland N., Cruaud C., Ga-
vory F., Doumenge C., Navascués M., Hardy O.J. (2010) Cp-
REFERENCES DNA-based species identification and phylogeography: appli-
cation to African tropical tree species. Molecular Ecology 19:
Allouche O., Tsoar A., Kadmon R. (2006) Assessing the accuracy 5469–5483. https://doi.org/10.1111/j.1365-294X.2010.04917.x
of species distribution models: prevalence, kappa and the true Duminil J., Brown R.P., Ewédjè E.-E.B., Mardulyn P., Doucet J.-
skill statistic (TSS). Journal of Applied Ecology 43: 1223–1232. L., Hardy O.J. (2013) Large-scale pattern of genetic differen-
https://doi.org/10.1111/j.1365-2664.2006.01214.x tiation within African rainforest trees: insights on the roles of
Anderson R.P. (2003) Real vs. artefactual absences in species distri- ecological gradients and past climate changes on the evolution
butions: tests for Oryzomys albigularis (Rodentia: Muridae) in of Erythrophleum spp (Fabaceae). BMC Evolutionary Biology
Venezuela. Journal of Biogeography 30: 591–605. https://doi. 13: 195. https://doi.org/10.1186/1471-2148-13-195
org/10.1046/j.1365-2699.2003.00867.x Duminil J., Mona S., Mardulyn P., Doumenge C., Walmacq F.,
Baldwin R.A. (2009) Use of Maximum Entropy Modeling in Wild- Doucet J.-L., Hardy O.J. (2015) Late Pleistocene molecular dat-
life Research. Entropy 11: 854–866. https://doi.org/https://doi. ing of past population fragmentation and demographic changes
org/10.3390/e11040854 in African rain forest tree species supports the forest refuge hy-
Bivand R., Rundel C. (2014) rgeos: Interface to Geometry Engine - pothesis. Journal of Biogeography 42: 1443–1454. https://doi.
Open Source (‘GEOS’). Available from: https://rdrr.io/cran/ org/10.1111/jbi.12510
rgeos/ [accessed 4 Feb. 2019]. Engelbrecht B.M.J., Comita L.S., Condit R., Kursar T.A., Tyree
Blach-Overgaard A., Svenning J.-C., Dransfield J., Greve M., M.T., Turner B.L., Hubbell S.P. (2007) Drought sensitivity
Balslev H. (2010) Determinants of palm species distributions shapes species distribution patterns in tropical forests. Nature
across Africa: the relative roles of climate, non-climatic envi- 447: 80–82. https://doi.org/10.1038/nature05747
ronmental factors, and spatial constraints. Ecography 33: 380– Fayolle A., Swaine M.D., Bastin J.-F., Bourland N., Comiskey J.A.,
391. https://doi.org/10.1111/j.1600-0587.2010.06273.x Dauby G., Doucet J.-L., Gillet J.-F., Gourlet-Fleury S., Hardy
Blair M.E., Sterling E.J., Dusch M., Raxworthy C.J., Pearson R.G. O.J., Kirunda B., Kouamé F.N., Plumptre A.J. (2014) Patterns
(2013) Ecological divergence and speciation between lemur of tree species composition across tropical African forests. Jour-
(Eulemur) sister species in Madagascar. Journal of Evolution- nal of Biogeography 41: 2320–2331. https://doi.org/10.1111/
ary Biology 26: 1790–1801. https://doi.org/10.1111/jeb.12179 jbi.12382
Bongers F., Poorter L., Van Rompaey R.S.A.R., Parren M.P.E. Fayolle A., Swaine M.D., Aleman J, et al. (2019) A sharp floristic
(1999) Distribution of twelve moist forest canopy tree species discontinuity revealed by the biogeographic regionalization of
in Liberia and Côte d’Ivoire: response curves to a climatic gra- African savannas. Journal of Biogeography 46: 454–465. htt-
dient. Journal of Vegetation Science 10: 371–382. https://doi. ps://doi.org/10.1111/jbi.13475
org/10.2307/3237066 Gaviria J., Turner B.L., Engelbrecht B.M.J. (2017) Drivers of tree
Couvreur T.L.P., Forest F., Baker W.J. (2011) Origin and global di- species distribution across a tropical rainfall gradient. Eco-
versification patterns of tropical rain forests: inferences from a sphere 8: e01712. https://doi.org/10.1002/ecs2.1712
complete genus-level phylogeny of palms. BMC Biology 9: 44. Gerz M., Guillermo Bueno C., Ozinga W.A., Zobel M., Moora M.
https://doi.org/10.1186/1741-7007-9-44 (2018) Niche differentiation and expansion of plant species are
Damasceno R., Strangas M.L., Carnaval A.C., Rodrigues M.T., associated with mycorrhizal symbiosis. Journal of Ecology 106:
Moritz C. (2014) Revisiting the vanishing refuge model of 254–264. https://doi.org/10.1111/1365-2745.12873
50Gorel et al., Ecological niche divergence in the Erythrophleum genus
Gonmadje C.F., Doumenge C., Sunderland T.C.H., Balinga M.P.B., Mayr E., O’Hara R.J. (1986) The biogeographic evidence support-
Sonké B. (2012) Analyse phytogéographique des forêts ing the Pleistocene forest refuge hypothesis. Evolution 40: 55–
d’Afrique Centrale: le cas du massif de Ngovayang (Camer- 67. https://doi.org/10.2307/2408603
oun). Plant Ecology and Evolution 145: 152–164. https://doi. Muscarella R., Galante P.J., Soley-Guardia M., Boria R.A., Kass
org/10.5091/plecevo.2012.573 J.M., Uriarte M., Anderson R.P. (2014) ENMeval: An R pack-
Gorel A-P., Fayolle A., Doucet J-L. (2015) Écologie et gestion des age for conducting spatially independent evaluations and esti-
espèces multi-usages du genre Erythrophleum (Fabaceae-Cae- mating optimal model complexity for Maxent ecological niche
salpinioideae) en Afrique (synthèse bibliographique). Biotech- models. Methods in Ecology and Evolution 5: 1198–1205. htt-
nologie, Agronomie, Société et Environnement 19: 415–429. ps://doi.org/10.1111/2041-210X.12261
Graham C.H., Ron S.R., Santos J.C., Schneider C.J., Moritz C. Nakazato T., Warren D.L., Moyle L.C. (2010) Ecological and geo-
(2004) Integrating phylogenetics and environmental niche graphic modes of species divergence in wild tomatoes. Ameri-
models to explore speciation mechanisms in dendrobatid frogs. can Journal of Botany 97: 680–693. https://doi.org/10.3732/
Evolution 58: 1781–1794. https://doi.org/10.1554/03-274 ajb.0900216
Guisan A., Thuiller W. (2005) Predicting species distribution: of- Nosil P. (2012) Ecological Speciation. Oxford, Oxford
fering more than simple habitat models. Ecology Letter 8: 993– University Press. https://doi.org/10.1093/acprof:oso
1009. https://doi.org/10.1111/j.1461-0248.2005.00792.x bl/9780199587100.001.0001
Hanley J.A., McNeil B.J. (1982) The meaning and use of the Peterson A.T. (2011) Ecological niche conservatism: a time-struc-
area under a receiver operating characteristic (ROC) curve. tured review of evidence. Journal of Biogeography 38: 817–
Radiology 143: 29–36. https://doi.org/10.1148/radiolo- 827. https://doi.org/10.1111/j.1365-2699.2010.02456.x
gy.143.1.7063747 Philippon N., Cornu G., Monteil L., Gond V., Moron V., Pergaud
Hardy O.J., Born C., Budde K., et al. (2013) Comparative phylo- J., Sèze G., Bigot S., Camberlin P., Doumenge C., Fayolle A.,
geography of African rain forest trees: A review of genetic Ngomanda A. (accepted 2018) The light-deficient climates of
signatures of vegetation history in the Guineo-Congolian re- Western Central African evergreen forests. Environmental Re-
gion. Comptes Rendus Geoscience 345: 284–296. https://doi. search Letters. https://doi.org/10.1088/1748-9326/aaf5d8
org/10.1016/j.crte.2013.05.001 Phillips S.J., Anderson R.P., Schapire R.E. (2006) Maximum en-
Heibl C., Calenge C. (2011) phyloclim: Integrating phylogenetics tropy modeling of species geographic distributions. Ecologi-
and climatic niche modelling. R Package. Available from: htt- cal Modelling 190: 231–259. https://doi.org/10.1016/j.ecolmo-
ps://rdrr.io/cran/phyloclim/ [accessed 20 Sep. 2010]. del.2005.03.026
Hijmans R.J., Cameron S.E., Parra J.L., Jones P.G., Jarvis A. (2005) R Core Team (2015) R: A language and environment for statistical
Very high resolution interpolated climate surfaces for global computing. Vienna, Austria, R Foundation for Statistical Com-
land areas. International Journal of Climatology 25: 1965–1978. puting. Available from: https://www.R-project.org/ [accessed
https://doi.org/10.1002/joc.1276 15 Dec. 2015].
Holstein N., Renner S.S. (2011) A dated phylogeny and collection Rolland J., Salamin N. (2016) Niche width impacts vertebrate di-
records reveal repeated biome shifts in the African genus Coc- versification. Global Ecology and Biogeography 25: 1252–
cinia (Cucurbitaceae). BMC evolutionary biology 11: 28. htt- 1263. https://doi.org/10.1111/geb.12482
ps://doi.org/10.1186/1471-2148-11-28 Rundle H.D., Nosil P. (2005) Ecological speciation. Ecology Letters
Knouft J.H., Losos J.B., Glor R.E., Kolbe J.J. (2006) Phylogenetic 8: 336–352. https://doi.org/10.1111/j.1461-0248.2004.00715.x
analysis of the evolution of the niche in lizards of the Anolis sa- Rundell R.J., Price T.D. (2009) Adaptive radiation, nonadaptive
grei group. Ecology 87: S29–S38. https://doi.org/10.1890/0012- radiation, ecological speciation and nonecological specia-
9658(2006)87[29:PAOTEO]2.0.CO;2 tion. Trends in Ecology & Evolution 24: 394–399. https://doi.
Linder H.P. (2014) The evolution of African plant diversity. Fron- org/10.1016/j.tree.2009.02.007
tiers in Ecology and Evolution 2: 38. https://doi.org/10.3389/ Schnitzler J., Graham C.H., Dormann C.F., Schiffers K., Linder
fevo.2014.00038 H.P. (2012) Climatic niche evolution and species diversification
Lönnberg E. (1929) The development and distribution of the Af- in the Cape flora, South Africa. Journal of Biogeography 39:
rican fauna in connection with and depending upon climatic 2201–2211. https://doi.org/10.1111/jbi.12028
changes. Arkiv för zoologi 21A: 1–33. Schoener T.W. (1968) The Anolis lizards of Bimini: resource parti-
Losos J.B., Leal M., Glor R.E., et al. (2003) Niche lability in the tioning in a complex fauna. Ecology 49: 704–726. https://doi.
evolution of a Caribbean lizard community. Nature 424: 542– org/10.2307/1935534
545. https://doi.org/10.1038/nature01814 Sexton J.P., Montiel J., Shay J.E., Stephens M.R., Slatyer R.A.
Maharjan S.K., Poorter L., Holmgren M., Bongers F., Wieringa J.J., (2017) Evolution of Ecological Niche Breadth. Annual Review
Hawthorne W.D. (2011) Plant functional traits and the distribu- of Ecology, Evolution, and Systematics 48: 183–206. https://
tion of West African rain forest trees along the rainfall gradi- doi.org/10.1146/annurev-ecolsys-110316-023003
ent: functional taits affect species distribution. Biotropica 43: Simões M., Breitkreuz L., Alvarado M., et al. (2016) The evolving
552–561. https://doi.org/10.1111/j.1744-7429.2010.00747.x theory of evolutionary radiations. Trends in Ecology & Evolu-
Maley J. (1996) The African rain forest-main characteristics of tion 31: 27–34. https://doi.org/10.1016/j.tree.2015.10.007
changes in vegetation and climate from the Upper Creta- Sosef M.S.M. (1994) Refuge begonias: taxonomy, phylogeny, and
ceous to the Quaternary. Proceedings of the Royal society of historical biogeography of Begonia Sect. Loasibegonia and
Edinburgh section B 104: 31–73. https://doi.org/10.1017/ Sect. Scutobegonia in Relation to Glacial Rain Forest Refuges
S0269727000006114 in Africa. Wageningen Agricultural University Papers, Studies
Markesteijn L., Poorter L. (2009) Seedling root morphology and in Begoniaceae 5. Wageningen, Wageningen Agricultural Uni-
biomass allocation of 62 tropical tree species in relation to versity.
drought- and shade-tolerance. Journal of Ecology 97: 311–325. Sterck F., Markesteijn L., Toledo M., Schieving F., Poorter L.
https://doi.org/10.1111/j.1365-2745.2008.01466.x (2014) Sapling performance along resource gradients drives
51Pl. Ecol. Evol. 152 (1), 2019
tree species distributions within and across tropical forests. Warren D.L., Seifert S.N. (2011) Ecological niche modeling in
Ecology 95: 2514–2525. https://doi.org/10.1890/13-2377.1 Maxent: the importance of model complexity and the perfor-
mance of model selection criteria. Ecological Applications 21:
Suchel J.B. (1990) Les modalités du passage du régime climatique
335–342. https://doi.org/10.1890/10-1171.1
boréal au régime climatique austral dans le sud-ouest camer-
ounais. Cahiers du Centre de Recherche de Climatologie 13: White F. (1978) The taxonomy, ecology and chorology of African
63–76. Ebenaceae I. The Guineo-Congolian species. Bulletin du Jar-
din botanique national de Belgique 48: 245–358. https://doi.
Swaine M.D. (1996) Rainfall and soil fertility as factors limiting org/10.2307/3667933
forest species distributions in Ghana. Journal of Ecology 84: White F. (1983) The vegetation of Africa, a descriptive memoir to
419–428. https://doi.org/10.2307/2261203 accompany the UNESCO/AETFAT/UNSO vegetation map of
Tosso D.F. (2018) Evolution et adaptation fonctionnelle des arbres Africa. Paris, UNESCO.
tropicaux: le cas du genre Guibourtia Benn. PhD Thesis, Uni- Zachos J., Pagani M., Sloan L., Thomas E., Billups K. (2001)
versity of Liège, Liège, Belgium. Trends, rhythms, and aberrations in global climate 65 Ma to
Vanzolini P.E., Williams E.E. (1981) The vanishing refuge: a mech- present. Science 292: 686–693. https://doi.org/10.1126/sci-
anism for ecogeographic speciation. Papéis Avulsos de Zoolo- ence.1059412
gia 34: 251–255.
Warren D.L., Glor R.E., Turelli M. (2008) Environmental niche Manuscript received 13 Sep. 2018; accepted in revised version 4
equivalency versus conservatism: quantitative approaches Feb. 2019.
to niche evolution. Evolution 62: 2868–2883. https://doi.
org/10.1111/j.1558-5646.2008.00482.x Communicating Editor: Alexandra Ley.
52You can also read