Spatiotemporal co-occurrence and overlap of two sympatric mongoose species in an urban environment
←
→
Page content transcription
If your browser does not render page correctly, please read the page content below
Journal of Urban Ecology, 2020, 1–9

                                                                              doi: 10.1093/jue/juaa013
                                                                              Research article

Spatiotemporal co-occurrence and overlap of two
sympatric mongoose species in an urban environment

                                                                                                                                                         Downloaded from https://academic.oup.com/jue/article/6/1/juaa013/5857627 by guest on 28 October 2020
Nadine Elizabeth Cronk                              * and Neville Pillay
School of Animal, Plant and Environmental Sciences, University of the Witwatersrand, Private Bag 3, WITS,
Johannesburg 2050, South Africa
*Corresponding author. E-mail: nadinecronk@gmail.com

Submitted: 16 November 2019; Received (in revised form): 19 March 2020. Accepted: 23 April 2020

Abstract
Small carnivores are becoming increasingly common in urban areas. What has received less attention is whether and how
resource partitioning among sympatric species in urban areas facilitates their coexistence. We examined the spatial, tem-
poral and combined spatiotemporal occurrence and overlap of co-existing yellow mongoose Cynictis penicillata and slender
mongoose Galerella sanguinea in an urban estate in South Africa. The reserve comprised two parts, an Eco-Estate where hu-
man residential and natural areas are interspersed and wildlife has greater contact with people, and a Nature Estate, where
contact is reduced by palisade fencing between people and natural areas. Using photographic data from camera traps col-
lected over 11 consecutive months, we found a moderate level of spatial overlap between the mongoose species.
Differences between the species occurred at a finer habitat scale: yellow mongooses were more common in open habitats
located near human residents whereas the slender mongooses were more common in covered areas further away from hu-
man residents. The detection probability of the yellow mongoose, however, was greater than that of the slender mongoose,
and the occupancy probability of the slender mongoose was reduced in the presence of the yellow mongoose. Although
both species demonstrated bimodal diurnal peaks in activity, they varied in their active periods, with temporal overlap be-
ing greater during colder than warmer months. No complete spatiotemporal overlap (occurrence in the same place at the
same time/within a 10-min period) occurred. This may have been as a result of the difference in detection and occupancy
probabilities of the two species. Resource availability (food), however, appears to influence the different habitat selection,
space use, and activity patterns of yellow and slender mongoose in the study area. Therefore, we conclude that partitioning
along the spatial and somewhat on the temporal dimensions aids in the coexistence of these mongoose species in an urban
environment.

Key words: camera trap, coexistence, slender mongoose spatiotemporal, urban areas, yellow mongoose

Introduction
                                                                              animals which can thrive in urban habitats (Newsome et al.
Rapid expansion of urban areas poses a number of risks to ani-                2010; Plumer, Daviso, and Saarma 2014; Wong and Candolin
mals (Newsome et al. 2010; Bateman and Fleming, 2012), and                    2015).
can lead to an increase in habitat fragmentation, which                          Carnivores are becoming increasingly prevalent in urban
decreases the level of natural habitats available to animals                  areas by exploiting the opportunities available there (Wong and
(Dudus et al. 2014; Scott et al. 2014). Nevertheless, the absence            Candolin 2015; Poessel, Gese, and Young 2017). Those thriving
of natural predators and an increased availability of natural and             in urban environments tend to be diet generalists, small to me-
alternative food resources makes urban areas attractive to some               dium sized, tolerate and habituate to humans and exploit

C The Author(s) 2020. Published by Oxford University Press.
V
This is an Open Access article distributed under the terms of the Creative Commons Attribution Non-Commercial License (http://creativecommons.org/
licenses/by-nc/4.0/), which permits non-commercial re-use, distribution, and reproduction in any medium, provided the original work is properly cited.
For commercial re-use, please contact journals.permissions@oup.com

                                                                                                                                                1
2 | Journal of Urban Ecology, 2020, Vol. 6, No. 1
anthropogenic resources (Dudus et al. 2014; Scott et al. 2014). sunset (Maddock and Perrin 1993). Yellow mongoose occur in
For example, the stone marten Martes foina and red fox Vulpes open grassland and scrub habitats (Skinner and Chimimba
vulpes are perhaps the best adapted for urban life, exhibiting 2005), and are not common in dense bush and woodland areas
flexibility in their diet (e.g. anthropogenic items) as well as hav- (Mbatyoti 2012). Conversely, slender mongoose are more promi-
ing a considerably high occurrence in, and use of, urban resi- nent in dense covered thicket and woodland/forest areas
dential areas (Prigioni et al. 2008; Plumer, Daviso, and Saarma (Ramesh and Downs 2014), and are not common in open grass-
2014; Scott et al. 2014). Other species well adapted to urban land (Rapson, Goldizen, and Seddon 2012). Presently, both spe-
areas are the coyote Canis latrans (Murray et al. 2015; Poessel, cies inhabit and coexist in urban areas in South Africa (Cronk
Gese, and Young 2017), kit fox Vulpes macrotis (Newsome et al. and Pillay 2018), but nothing is known about the temporal activ-
2010) and Eurasian badger Meles meles (Bateman and Fleming ity and space use of these species in an urban environment.
2012). An increase in the occurrence of carnivores in urban We conducted our research in the Meyersdal Nature Area
areas presents the opportunity of morphologically and ecologi- (South Africa) that was divided into two parts: an Eco-Estate
cally similar species overlapping in their resource use. Yet, how where wildlife utilize household gardens and corridors between
these species coexist in urban areas has received little houses, and a Nature Estate, where houses are separated from
Downloaded from https://academic.oup.com/jue/article/6/1/juaa013/5857627 by guest on 28 October 2020
attention. wildlife by fences, reducing contact with humans and homes.
Niche differentiation theory emphasizes that a degree of re- Within the Meyersdal Nature Area, we investigated the spatial
source partitioning (spatial, temporal or dietary) between sym- and temporal occurrence and overlap of yellow and slender
patric species must occur in order to avoid niche overlap and mongooses through camera trap surveillance. In addition, we
the consequent interspecific competition (Pianka 1974; Kylafis specifically investigated whether or not both species were uti-
and Loreau 2011; Lesmeister et al. 2015; Ribeiro 2016). The food, lizing the same spaces at the same time (spatiotemporal over-
space and time dimensions, either individually or in combina- lap). Furthermore, camera traps aided in assessing broad
tion, are considered the foremost resources partitioned to pro- habitat use and the distance from, and utilization of, the human
mote coexistence of sympatric species (Prigioni et al. 2008; residential areas within these estates for both species. We had
Ramesh et al. 2012; Frey et al. 2017). Resource partitioning along four predictions:
the spatial niche, such as in habitat selection, is regarded as the 1. Mongoose species would segregate in the spatial niche: (i) both
principal dimension of differentiation, while temporal parti- species would utilize distinct micro-habitat types, in accordance
tioning (after diet) is considered rare (Schoener 1974; Cavallini with the niche differentiation theory—yellow mongoose would
and Nel 1995). occur more commonly in open areas and slender mongoose in
Variation in the temporal niche can include species differing dense covered areas; (ii) yellow mongoose would occur more
in the timing and level of activity, or in overall diel-activity (e.g. frequently near human residences compared with slender mon-
diurnal vs. nocturnal). For example, grey foxes Urocyon cinereoar- goose, since yellow mongoose are more habituated to humans
genteus occur at lower densities and are less active in areas at (pers. obs.); slender mongoose would occur more frequently in
times when coyote activity was greater (Lesmeister et al. 2015). the natural areas further from human residents. 2. Mongoose
Dholes Cuon alpinus segregated from leopards Panthera pardus species would overlap in the temporal niche: (i) since both mongoose
and tigers Panthera tigris by being primarily diurnal, possibly to species are diurnal, we predicted both species will have similar
avoid competition with the mainly nocturnal felids (Karanth activity patterns and therefore show temporal overlap in activ-
et al. 2017). Similarly, in the spatial niche, species segregate by ity. 3. Seasonal variation in the spatial and/or temporal niche: the
selecting different habitats, largely influenced by the availability less favourable conditions during the colder season may lead to
of resources (e.g. food and resting sites; Dudu s et al. 2014; both species utilizing larger areas and adjusting their activity to
Lesmeister et al. 2015). For example, the stone marten and red differing environmental conditions in search of resources, and
fox differed in habitat selection in an urban area in Poland: thus may show greater overlap in activity and/or space use in
stone martens were located in, and appeared better adapted to, the colder compared with the warmer season. 4. No combined
areas closer to city centres where resting sites were almost ex- spatiotemporal overlap: the occurrence of both species in the
clusively in buildings. In contrast, red foxes selected habitats same place at the same time was not expected since the two
closer to the urban borders, where resting sites are favourable, species were predicted to segregate along either the spatial or
but still providing access to anthropogenic items (Dudu s et al. the temporal niche, thereby facilitating coexistence (Karanth
2014). In addition, habitat use niche overlap in a peri-urban area et al. 2017) in the Meyersdal Nature Area.
in Portugal was high between the Eurasian badger and red fox,
but they exhibited different feeding habits which enabled their
coexistence (Ribeiro 2016). Despite previous research on re- Methods
source partitioning, the spatiotemporal co-occurrence of spe- Study site
cies is poorly understood (Lesmeister et al. 2015).
Here, we present the first study on the spatiotemporal co- Field work took place from May 2015 to March 2016 in the
occurrence and overlap of two herpestid mongoose species, the Meyersdal Nature Area (composed of ecological residential
yellow Cynictis penicillata and the slender Galerella sanguinea, in a estates) in Johannesburg, South Africa. The climate in the area
small urban reserve in South Africa. The yellow mongoose is is warm and temperate, with an average annual temperature of
primarily insectivorous and the slender mongoose is an oppor- 16 C, and average precipitation of 723 mm. The warmest tem-
tunistic carnivore (Nel and Kok 1999; Graw, Lindholm, and peratures occur in December-February (average min. of 14 C
Manser 2016; Cronk and Pillay 2018). Both species are diurnal in and average max. of 26 C) and the coldest in July (average min.
non-urban habitats (Mbatyoti 2012; Graw, Lindholm, and of 3 C and average max. of 19 C). We sampled two adjacent
Manser 2016). Yellow mongoose are active during the day be- study areas, namely the Meyersdal Eco-Estate (26 170 10.400 S
tween sunrise and sunset (Cavallini and Nel 1995; Mbatyoti 28 050 14.700 E; 480 ha) and the Meyersdal Nature Estate
2012), while the slender mongoose reportedly exhibits a slight (26 170 32.100 S 28 050 23.200 E; 300 ha). Wildlife occur on both
peak in activity before sunset and ceases activity just after estates but more frequently come into contact with people inSpatiotemporal co-occurrence and overlap of two sympatric mongoose species | 3
the Eco-Estate, which is residentially built-up and interspersed Nichols 2004) to estimate the occupancy and detection probabil-
with natural areas. The residential area within the Nature ities of the yellow and slender mongoose in the two estates. The
Estate is separated from the natural area by palisade fencing intention was solely to ascertain whether the presence or detec-
which is permeable to mongoose (Cronk and Pillay 2018). The tion of one species influences the presence or detection of the
dominant vegetation in the area is a grassveld vegetation type, other species. The two-species occupancy models were used to
predominantly grasses including thatching grass Hyparrhenia investigate the spatial co-occurrence between the two mon-
hirta and red grass Themeda triandra, with dense tree cover on goose species while accounting for imperfect detection
the borders, housing a wide range of small and large verte- (MacKenzie, Bailey, and Nichols 2004). Taking all camera trap
brates. Yellow and slender mongoose are the most abundant capture histories for the entire study period, we followed the
carnivores in both estates and, from observations, the yellow methods for a single season-two-species occupancy model (no
mongoose is more prevalent than the slender mongoose (Cronk separation of cold/warm sampling periods), with no categorical
and Pillay 2018). Potential predators of mongoose within these or continuous covariates included in the analysis. We created
estates included black backed jackal Canis mesomelas and black two species capture histories (1 per estate) organized in a matrix
eagles Ictinaetus malaiensis, both sparsely occurring. with 66 sites (rows) by 14 periods (columns; camera trap repli-
Downloaded from https://academic.oup.com/jue/article/6/1/juaa013/5857627 by guest on 28 October 2020
cate days per site) in the Eco-Estate and Nature Estate, respec-
tively. A recording of 0 represented neither species were
Camera trap surveillance
R
present, 1 represented when only the yellow mongoose was
We used motion triggered infrared Bushnell EssentialV camera present, 2 represented when only the slender mongoose was
traps equipped with high powered batteries and 32GB memory present and 3 when both species were detected (MacKenzie,
cards, ensuring a minimum of 1-week uninterrupted data col- Bailey, and Nichols 2004). We drew inference about the two spe-
lection. The use of camera traps is advantageous since it incurs cies’ patterns of occupancy from the species interaction factor
very minimal environmental disturbance and is a non-invasive (SIF; u). Values of u < 1 suggested the two species occur together
method of data collection (Rovero et al. 2014). Three camera less often than chance (i.e. potential avoidance), and u > 1 sug-
traps were placed at various locations (hereafter referred to as gested the two species occur together more often than chance.
camera sites) in both the Eco-Estate and Nature Estate (total of When u ¼ 1 the two species were considered to be spatially in-
six cameras). Camera traps were attached to rigid surfaces dependent (Richmond, Hines, and Beissinger 2010; Chen et al.
(rocks/trees) 0.5 1.0 m off the ground, and positioned so the 2019).
field of view included an active wildlife trail (Jenks et al. 2011;
Rovero et al. 2014). The understory plant growth was cleared at Spatial occurrence and spatial overlap
camera sites to avoid impeding the camera view. Statistical analyses were conducted using R Statistical Software
The cameras were set to capture two consecutive photo- (www.r-project.org, R version 3.4.3). Because of differences in
graphs at each trigger, and a delay period of 1 s was set between duration of sampling per season, we categorized sampling peri-
triggers to ensure multiple captures of any rapid movement of a ods as colder (autumn/winter; March to August) and warmer
mongoose. All cameras were active 24 h a day, and no bait was (spring/summer; September to February) months to reflect
used to lure the mongooses. Camera traps were checked once a South Africa’s seasons in all analyses. A t-test was used to ana-
week to change memory cards, change batteries and to ensure lyse the number of independent captures to establish which
that they were fully functional and had not been tampered species occurred more frequently in both estates. Photographic
with. Camera traps remained at a single location (camera site) rate (number of captures per number of trap days) can be used
for 2 weeks, before being moved to a new camera site 200 m to estimate species abundance (Bowkett, Rovero, and Marshall
away. In order to minimize autocorrelation between camera 2008; Jenks et al. 2011; Rovero et al. 2014). We calculated the rel-
trap hit rate and the greatest mongoose occurrence in their core ative abundance index (RAI) for each species in the study area
home ranges (the areas around dens where activity level is to evaluate differences in the abundance of the two species,
greatest), we ensured no camera traps were placed at the which may affect the number of photographs captured. RAI was
known mongoose dens. We recorded the date, time and the calculated by taking the sum of all independent captures for
mongoose species present from each photograph captured. each species multiplied by 100 and divided by the total number
Since individual mongooses could not be distinguished, any of camera trap days (occurrence per species per 100 trap days;
consecutive captures within a 10 min time frame were consid- Jenks et al. 2011).
ered as a single occurrence (i.e. the same mongoose; Norris, We used two approaches to analyse spatial occurrence of
Michalski, and Peres 2010). The following was also recorded for the mongooses. Firstly, a logistic regression model (glm in R) us-
each camera site: GPS location; approximate distance to human ing absence/presence data was used to analyse occurrence of
residents in metres (using QGIS 3.2.3); and vegetation/habitat each species at each camera site in order to determine whether
characteristics surrounding the camera sites. Habitat character- they are using the same areas and which factors (estate, spe-
istics were classified as open grassland (large open areas domi- cies, habitat and distance) influenced their occurrence.
nated by grasses) or bushy/tree covered (areas dominated by Secondly, we assessed the number of occurrences of each spe-
tree cover or dense bushes). This information aided in assessing cies per camera site (dependent variable) in order to compare
broad habitat type use as well as relative use of residential areas the extent of use of each camera site between species. We used
as a proxy for access to, and potential use of, anthropogenic the bestNormalize package in R (Peterson and Cavanaugh 2019)
items. to transform the dependent variable. A linear mixed effects
model (lmer in R) was used to assess significant predictors of
Data analysis the number of occurrences of the two mongoose species on
camera trap footage. The analyses comprised first order and in-
Two-species occupancy modelling teraction effects of the following predictor variables: species;
We used two-species occupancy modelling using the pro- season (colder/warmer months); habitat category (open/covered
gramme PRESENCE version 12.39 (MacKenzie, Bailey, and vegetation type); and distance to human residents (continuous4 | Journal of Urban Ecology, 2020, Vol. 6, No. 1
covariate); estate was included as a random factor. We derived
several candidate models from the global model (Grueber et al.
2011), including all of the abovementioned independent varia-
bles. Using model averaging, we ranked the models based on
the Akaike’s Information Criterion with small sample adjust-
ment (AICc) using the R package MuMin (Barton 2009). We se-
lected the model with the lowest AICc value as the best fit
model (Burnham and Anderson 1998; Grueber et al. 2011), which
included species, distance to human residents, habitat category
and the speciesdistance and specieshabitat interactions. The
best fit model did not include season or interactions with sea-
son, and these are hence not described. We used emmeans
(Lenth and Herve 2019) for post hoc analysis of significant pre-
dictors, and the significant interactions involving fixed effects,
Downloaded from https://academic.oup.com/jue/article/6/1/juaa013/5857627 by guest on 28 October 2020
and emtrends to analyse the significant interaction involving
the distance covariate.
We used Pianka’s Index (Krebs 1989) of overlap to assess the
overall spatial overlap between species at camera trap sites
(Ribeiro 2016), as well as whether spatial overlap varied between
cold and warm months. The index ranges from 0 (no overlap) to
1 (complete overlap).
Activity patterns and temporal overlap
We used the R package ‘overlap’ to obtain pair-wise temporal
overlap coefficients (D; Meredith and Ridout 2014) to assess the
activity profiles and temporal overlap between the two mon-
goose species, using the time stamp data from camera trap foot-
age. In this analysis, we compared the activity of the yellow and
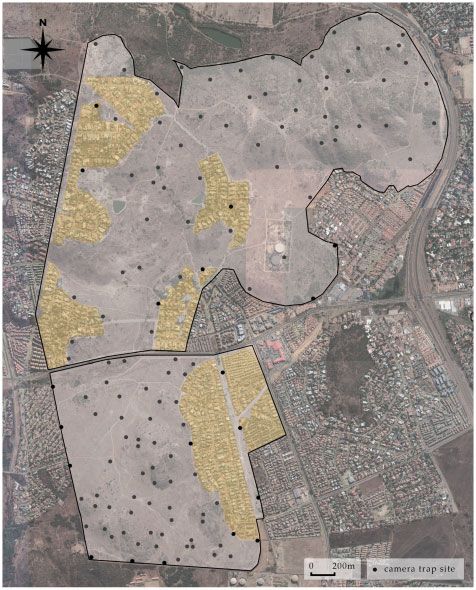
Figure 1: Aerial map of the sampled Meyersdal Nature Area showing the 66 cam-
slender mongoose for the entire study duration (both estates) era trap sites located in the Eco-Estate and Nature Estate; human residences
and compared activity between colder and warmer months. within the estates are shaded in yellow.
Temporal overlap of activity patterns was estimated using the
kernel density estimation following the methods proposed by
(PB¼0.717 6 0.138). At sites where both species were present, de-
Ridout and Linkie (2009). We selected a smoothing parameter of
tection probability was considerably lower (rA¼0.344 6 0.022).
1.0 since the size of the smallest sample size was >75 (Meredith
The probability of slender mongoose occupancy was greater
and Ridout 2014). The overlap coefficient (D) ranges from 0, indi-
when the yellow mongoose was absent (psiBa¼0.971 6 0.041)
cating no overlap, to 1, indicating complete overlap (Frey et al.
than when the yellow mongoose was present
2017).
(psiBA¼0.666 6 0.061) at a site. Overall, individual species detec-
tion probabilities were lower in the Nature Estate
Results (PA¼0.930 6 0.008; PB¼0.378 6 0.035) compared with the Eco-
Estate. However, at sites where both species were present
We sampled 66 sites with differing vegetation and distances to
(rA¼0.577 6 0.031), detection probability was greater in the Eco-
human residents in both the Eco-Estate and Nature Estate
Estate (Table 2). Like the Eco-Estate, the occupancy probability
(n ¼ 132 in total; Fig. 1). A total of 1494 photographs of mongoose
of slender mongoose was also greater when the yellow mon-
were obtained in the Eco-Estate and 1374 in the Nature Estate
goose was absent (psiBa¼0.666 6 0.061) than when the yellow
(Table 1). Yellow mongooses occurred significantly more fre-
mongoose was present (psiBA¼0.666 6 0.061) at a site.
quently in photographs than slender mongooses in both the
SEM denotes the estimates standard error. Conf. int. denotes
Eco-Estate (mean6SE: yellow 19.53 6 2.96; slender 3.11 6 0.99;
the upper and lower 95% confidence interval range. psiA denotes
t130¼5.26, P < 0.001) and Nature Estate (yellow 19.18 6 2.39; slen-
occupancy probability of the dominant species (yellow mon-
der 1.64 6 0.39; t130¼7.23, P < 0.001). For relative abundance for
goose). psiBA denotes occupancy probability of the subordinate
the entire study area, yellow mongooses were detected 138.25
species (slender mongoose) when the dominant is present. psiBa
times and slender mongoose 17.05 times (per 100 trap days;
denotes occupancy probability of the subordinate species in the
Jenks et al. 2011). Detection was slightly lower during the
absence of the dominant species. pA denotes the probability of
warmer months (133.06 and 16.67 times) than during the colder
detecting the dominant species, given the absence of the subor-
months (145.77 and 17.33 times) for both yellow and slender
dinate. pB denotes the probability of detecting the subordinate,
mongoose, respectively.
given the absence of the dominant. rA denotes the probability of
detecting the dominant, given both are present. rBA denotes the
Detection and occupancy probability probability of detecting the subordinate, given both are present
Generally, the detection and occupancy probabilities were and the dominant is detected. rBa denotes the probability of
greater for yellow mongoose than slender mongoose (Table 2). detecting the subordinate species, given both are present and
In the Eco-Estate, the detection probability of yellow mongoose the dominant is not detected. u denotes the SIF.
(PA¼0.935 6 0.018) was greater when the slender mongoose was The SIF was lower than 1 in both the Eco-Estate (u ¼ 0.977)
absent, and vice versa for the detection probability of the slen- and Nature Estate (u ¼ 0.748) indicating potential segregation or
der mongoose when the yellow mongoose was absent avoidance rather than spatial co-occurrence. SIF was, however,Spatiotemporal co-occurrence and overlap of two sympatric mongoose species | 5
Table 1: Number of independent photographs of yellow and slender mongooses in open and closed cover categories during different seasonal
periods in the two Meyersdal estates
Habitat category Months Eco-Estate Nature Estate
Yellow mongoose Slender mongoose Yellow mongoose Slender mongoose
Open Cold 453 5 563 3
Warm 576 9 453 11
Covered Cold 113 117 63 47
Warm 147 74 187 47
Total 1289 205 1266 108
Table 2: Co-occurrence model estimates and beta estimates of occu- Table 3: Logistic regression analysis of the predictors of absence/
Downloaded from https://academic.oup.com/jue/article/6/1/juaa013/5857627 by guest on 28 October 2020
pancy (psi) and detection probabilities (P and r) of the yellow and presence of yellow and slender mongoose occurring at camera sites
slender mongoose in the two Meyersdal estates in the two Meyersdal estates
Parameters Estimate (SEM) 95% CI b Estimate (SEM) Predictor b SE b Wald’s v2 df P eb (odds ratio)
Co-occurrence in the eco-estate Estate 4.60 0.296 2.438 1 0.118 0.631
psiA 0.953 (0.029) 0.848–0.986 2.998 (0.653) Species 1.908 0.313 43.501 16 | Journal of Urban Ecology, 2020, Vol. 6, No. 1
40 (a) (b) (c)
yellow mongoose 0.25 Δ = 0.74 Δ = 0.80 Δ = 0.66
slender mongoose
0.20
Number of photographs
Density
30 0.15
0.10
0.05
20
0.00
6:00 12:00 18:00 6:00 12:00 18:00 6:00 12:00 18:00
10 Time
Figure 4. Temporal overlap of yellow (solid line) and slender (dashed line) mon-
goose activity patterns within the Meyersdal area for the (a) entire study period,
0
(b) colder and (c) and warmer months. The overlap coefficient (D) is the area un-
der the minimum of two density estimates indicated by the grey area below
Open Covered curves.
Habitat category
Downloaded from https://academic.oup.com/jue/article/6/1/juaa013/5857627 by guest on 28 October 2020
Figure 2. The mean number of photographs (6SE) recorded for yellow and slen-
der mongoose in the open and closed habitat categories in the Meyersdal During the colder months, activity for both species appeared
estates. to start slightly later in the morning, and concluded earlier in
the evening in comparison to the warmer months. Bimodal
120 peaks in activity were present in both species during the colder
yellow mongoose slender mongoose
months, with the first peak being later in the morning in slender
100 mongooses compared with yellow mongooses and a second
similar peak in activity later in the afternoon in both species
Number of photographs
80 (Fig. 4b). During the warmer months, slender mongoose activity
peaked earlier in the morning and then again later in the morn-
60 ing, but the overall peak in activity in the morning was greater
in the yellow mongooses (Fig. 4c). The activity of both species
40 peaked again in the later afternoon, being greater and earlier in
the yellow mongoose. Overall, yellow mongooses had reduced
20 activity around midday, noticeably more so during the warmer
months than during the colder months. Slender mongooses
0
were comparatively more active at these times, particularly dur-
ing the colder months. During the warmer months, however,
-20
-200 0 200 400 600 800 1000 1200 the slender mongooses first showed a decrease in activity
Distance (m) around midday, and then an increase earlier in the afternoon
compared with the yellow mongooses. Temporal overlap in ac-
Figure 3. The number of photographs recorded for yellow and slender mongoose tivity was greater during the colder period (D0.80, CI ¼
at various distances (in metres) from human residents in the Meyersdal estates.
0.79 0.87) compared with the warmer period (D0.66, CI ¼
0.63 0.74).
slope of 2780.055 (lower confidence limit¼0.061; upper confi-
dence limit¼0.049), while conversely, there was a positive
Spatiotemporal overlap
slope of 0.006 (0.0002; 0.012) for slender mongoose (Fig. 3). The
overall Pianka’s overlap index for space use in the Meyersdal There were no instances of co-occurrence of yellow and slender
area was 0.55; overlap was greater during the colder period mongooses in the same image at the same time. We then con-
(0.66) than during the warmer period (0.37). sidered images captured within a 0 10 min time frame (i.e. one
species in an image, followed by the other species in a consecu-
tive image captured within 10 min), and found 21 such occur-
Activity patterns and temporal overlap
rences overall (19 in the Eco-Estate and 2 in the Nature Estate),
The diurnal start and end activity times (based on the occur- constituting a total of only 1.41% of all photographs captured
rence on camera trap photographs) of yellow mongooses were over the entire study period; all of these taken during winter/au-
06:29 6 00:28, 18:19 6 00:37 (mean6SE) and that of slender mon- tumn months.
gooses were 05:48 6 00:45, 18:01 6 01:11 (Fig. 4a). Yellow mon-
gooses demonstrated a typical bimodal peak activity pattern,
one peak between 10:00 and 11:00 and another between 16:00
Discussion
and 17:00. Slender mongooses exhibited similar bimodal activ- We investigated the spatial and temporal occurrence and over-
ity patterns but their activity was greater closer to sunrise lap of yellow and slender mongooses in an urban setting.
(6:00) with the first peak occurring later in the morning, and Overall, yellow mongoose had a higher detection probability
their activity decreased later in the evenings compared with than slender mongoose, and the occupancy of slender mon-
yellow mongooses. Interestingly, while yellow mongooses goose at sites was greater when the yellow mongoose was ab-
showed greatly reduced activity during the hottest periods of sent. Yellow mongooses were more common in open habitats
the day (midday), slender mongooses showed no measurable located near human residents, and slender mongooses were
decrease in activity at these times generally. Temporal overlap more common in covered areas further away from residents,
in the overall activity patterns between yellow and slender and consequently these differences account for the moderate
mongoose was D0.74 (CI¼0.71 0.79). level of overlap measured (Pianka’s index ¼ 0.55). TemporalSpatiotemporal co-occurrence and overlap of two sympatric mongoose species | 7
overlap was relatively high, but the two species varied in peak these mongoose species at differing distances from human resi-
activity periods. There were no occurrences of complete spatio- dents did not differ between seasons.
temporal overlap. We discuss below how food resources mainly The higher detection probability in the yellow mongoose
may influence these observed differences in habitat selection, may have accounted for why the frequency of the number of
space use, and activity patterns of the two sympatric mongoose photographs recorded for the yellow mongoose was far greater
species. than that of the slender mongoose. The demonstration of a neg-
While several studies have failed to identify strict habitat use ative association of occupancy in both estates (i.e. occupancy of
differences among co-existing carnivores (Gompper et al. 2016), slender mongoose being far greater when yellow mongoose was
our study does suggest that both mongoose species utilize dif- absent) may be indicative of spatial avoidance (or segregation),
ferent habitat types. Habitat use by carnivores is strongly af- and suggests different site preferences (therefore inferring dif-
fected by the availability and abundance of food resources fering habitat preferences the likelihood of occurring at the dif-
(Pedrini, Prigioni, and Volcan 1995). While yellow mongooses ferent distances from human residents) between the two
occur in a wide range of habitats (Mbatyoti 2012), it prefers open species (Richmond, Hines, and Beissinger 2010). Since the SIFs
and short grassland vegetation habitats (Skinner and Chimimba were lower than 1 in the Meyersdal are (and in conjunction with
Downloaded from https://academic.oup.com/jue/article/6/1/juaa013/5857627 by guest on 28 October 2020
2005), which was also evident in our study, as predicted. With the supporting results from our spatial occurrence analyses),
increasing shrub cover, there was a consequent reduction in the we assume that the yellow and slender mongoose are exhibit-
abundance of insects, the main food sources of yellow mon- ing some sort of spatial avoidance or segregation (Richmond,
goose (Nel and Kok 1999; Blaum and Rossmanith 2010). The Hines, and Beissinger 2010; Chen et al. 2019).
greater occurrence of yellow mongoose in open habitat types Studies assessing temporal overlap have largely focussed on
may be due to the favourable conditions for obtaining prey, species which vary in their diel cycles, such as being either diur-
since previous research in this study area showed that insects nal or nocturnal (Gerber, Karpanty, and Randrianantenaina
form the main part of their diet (Cronk and Pillay 2019). The 2012; Ramesh et al. 2012; Lesmeister et al. 2015; Frey et al. 2017;
open habitats dominated by grassland type vegetation might Karanth et al. 2017), and some report shifts or subtle changes in
activity as an adaptation to competition avoidance, habitat dis-
also provide conditions conducive for underground denning (Le
turbances or resource availability (Norris, Michalski, and Peres
Roux et al. 2016); these underground dens were frequently oc-
2010; Lesmeister et al. 2015; Frey et al. 2017). For example, ring-
curring in the study area (personal observation).
tailed mongoose Galidea elegans and broad-striped mongoose
As predicted, slender mongoose occurrence was greater in
Galidictis fasciata, which share a similar diet, segregate tempo-
covered areas. While several biotic factors limit the distribution
rally by being primarily active during dusk/day and night, re-
and space use of species, slender mongooses are reportedly not
spectively (Gerber, Karpanty, and Randrianantenaina 2012).
limited by rainfall and vegetation type and also have a tolerance
However, in the same study, in the presence of a larger competi-
for a range of habitat types (Smithers 1983; Maddock 1988).
tor, the small Indian civet Viverricula indica, ring-tailed mon-
Nonetheless, other studies indicate that slender mongooses
goose avoided dusk activity, the preferred activity period of the
prefer covered areas with rocky outcrops and associated tree
civet, and the activity of the ring-tailed mongoose was vastly
cover, which also supports high densities of their rodent prey
greater at dusk in sites where the civet did not occur (Gerber,
(Rood and Waser 1978; Smithers 1983; Ramesh and Downs
Karpanty, and Randrianantenaina 2012).
2014), which was also a main component in their diets in the
In contrast to the species above, the activity patterns of yel-
study area (Cronk and Pillay 2019). The use of cover might also
low and slender mongoose were strictly diurnal in our study.
provide protection from aerial predators, as reported in other
Complete overlap between the two species was potentially re-
small viverrids (Taylor 1975). However, while a pair of resident
duced by species differences in activity peaks, possibly due to
black eagles occurred at Meyersdal, other large birds of prey
differing foraging times. Maddock (1988) suggested that differ-
were not common here, and incidents of mongoose predation ences in the activity of prey consumed by similar species should
by raptors were not known in the study area. Another reason also be considered in the timing of activities, which may also fa-
for the differences in habitat use could be competitive exclu- cilitate coexistence. The activity of the main prey of the mon-
sion. The larger of two competing carnivore species is typically goose in our study area needs to be confirmed to test whether
superior (Lesmeister et al. 2015) and subordinate carnivores prey activity drives mongoose activity. In addition, since slender
may shift their habitat use to avoid competition (Mattisson mongoose activity was significantly greater in covered areas,
et al. 2011). Maddock (1988) showed that slender mongooses and the lack of reduced activity during the warmest times of the
generally avoided open habitats, occurring in covered areas to midday period (compared with the considerable decrease in ac-
avoid interactions with the larger Egyptian mongoose Herpestes tivity in yellow mongooses during this time period) may be due
ichneumon, since both species compete for the same food source. to their occurrence in covered areas that provide shade.
Slender mongooses are only slightly smaller than yellow mon- Temporal overlap was slightly higher during the colder months
goose, so body size alone cannot adequately explain the differ- than the warmer months, and this may be due to adjusting ac-
ences in habitat use. tivity times to obtain favourable prey.
Yellow mongooses actively exploit anthropogenic resources Niche partitioning appears evident by the lower spatial over-
and are more habituated to humans (Cronk and Pillay 2018), lap between species in the Meyersdal area, thereby permitting
which may account for their greater presence near human resi- greater temporal overlap. Taylor (1986) suggested that species
dents in comparison to slender mongooses. The majority of overlap is reduced by differences in activity patterns, where for-
slender mongoose occurrences were located at sites furthest aging at different times may segregate species, which may be
away from residents, despite relative ease of access to anthro- evident in our study too; an additional assessment of activity
pogenic food and other resources. This is possibly due to sites profiles of both species in this study area, noting timing of for-
near residents being more open than covered, consequently be- aging, may provide further evidence of this.
ing more regularly used by yellow mongoose. Contrary to our We specifically investigated spatiotemporal overlap by
prediction, habitat selection and the number of occurrences of assessing instances of yellow and slender mongoose occurring8 | Journal of Urban Ecology, 2020, Vol. 6, No. 1
in the same place at the same time (or within 10 min of each Blaum, N., and Rossmanith, E. (2010) ‘Shrub Pattern Affects
other). As expected, this was not common. The fact that there Reproductive Success in the Yellow Mongoose (Cynictis penicil-
were no instances of occurrence in the same place at the same lata)’, in U. Schmiedel and N. Jürgens (eds) Biodiversity in
time, and only few instances of occurrences within a 10-min pe- Southern Africa. Volume 2: Patterns and Processes at Regional Scale,
riod (1.41% of all occurrences, all of these during colder months), pp. 184–7. Göttingen & Windhoek: Klaus Hess Publishers.
suggests that resource partitioning, either along the spatial and/ Bowkett, A. E., Rovero, F., and Marshall, A. R. (2008) ‘The Use of
or temporal niche, is evident. In contrast, in a previous study in Camera-Trap Data to Model Habitat Use by Antelope Species
the same population, individuals of both species fed on a reed- in the Udzungwa Mountain Forests, Tanzania’, African Journal
buck Redunca arundinum carcass at the same time in winter of Ecology, 46: 479–87.
(Cronk and Pillay 2018). Even so, the majority of these joint feed- Burnham, K. P., and Anderson, D. R. (1998) Practical Use of the
ing occurrences resulted in slender mongooses aggressively vo- Information-Theoretic Approach, in Model Selection and
calizing and lunging towards yellow mongooses, chasing them Inference, pp. 75117. New York, NY: Springer.
away after a short period. This suggests that under certain con- Cavallini, P., and Nel, J. A. J. (1995) ‘Comparative Behaviour and
ditions, e.g. an abundance of food resources at a large carcass Ecology of Two Sympatric Mongoose Species (Cynictis penicillata
Downloaded from https://academic.oup.com/jue/article/6/1/juaa013/5857627 by guest on 28 October 2020
during winter, spatiotemporal overlap is possible for short peri- and Galerella pulverulenta)’, South African Journal of Zoology, 30: 46–9.
ods. In addition, from our occupancy modelling, however, we Chen, L. et al. (2019) ‘Combined Effects of Habitat and
could infer that the lower detection probability of the slender Interspecific Interaction Define co-Occurrence Patterns of
mongoose, as well as the effect of yellow mongoose presence Sympatric Galliformes’, Avian Research, 10: 29.
on slender mongoose occupancy may also account for why this Cronk, N. E., and Pillay, N. (2018) ‘Food Choice and Feeding on
combined spatiotemporal overlap is not common. Carrion in Two African Mongoose Species in an Urban
In conclusion, we showed that in an urban estate, the spatio- Environment’, Acta Ethologica, 21: 127–36.
temporal ecology of small co-existing carnivores is potentially Cronk, N., and (2019) ‘Dietary Overlap of Two Sympatric
influenced by food resources. While combined spatiotemporal African Mongoose Species in an Urban Environment’,
overlap has not been widely assessed in coexistence studies, it Mammalia, 83: 428–38.
has been reported that segregation or overlap along the com- Dudu s, L. et al. (2014) ‘Habitat Selection by Two Predators in an
bined spatiotemporal niche does not necessarily emulate the Urban Area: The Stone Marten and Red Fox in Wrocław (SW
findings of spatial and temporal overlap separately (Karanth Poland)’ Mammalian Biology, 79: 71–6.
et al. 2017), which was also observed in this study. The likeli- Frey, S. et al. (2017) ‘Investigating Animal Activity Patterns and
hood of access to and the potential to exploit anthropogenic Temporal Niche Partitioning Using Camera-Trap Data:
items appears to influence whether resource partitioning along Challenges and Opportunities’, Remote Sensing in Ecology and
the spatial (including differing habitat and site use) or temporal Conservation, 3: 123–32.
niche is more apparent in yellow and slender mongooses in this Gerber, B. D., Karpanty, S. M., and Randrianantenaina, J. (2012)
urban setting, but with low combined spatiotemporal overlap. ‘Activity Patterns of Carnivores in the Rain Forests of
Future studies should conduct an assessment of prey availabil- Madagascar: Implications for Species Coexistence’, Journal of
ity and distribution in conjunction with spatial and temporal Mammalogy, 93: 667–76.
occurrence of yellow and slender mongooses. Gompper, M. E. et al. (2016) ‘Differential Habitat Use or Intraguild
Interactions: What Structures a Carnivore Community?’, PloS
Data availability One, 11: e0146055.
Graw, B., Lindholm, A. K., and Manser, M. B. (2016)
The datasets generated and/or analysed during the current ‘Female-Biased Dispersal in the Solitarily Foraging Slender
study are available from the corresponding author upon Mongoose, Galerella sanguinea, in the Kalahari’, Animal
request. Behaviour, 111: 69–78.
Grueber, C. E. et al. (2011) ‘Multimodel Inference in Ecology and
Acknowledgements Evolution: Challenges and Solutions’, Journal of Evolutionary
Biology, 24: 699–711.
We are grateful to the environmental management of the
Jenks, K. E. et al. (2011) ‘Using Relative Abundance Indices from
Meyersdal Eco-Estate, Mrs Odette Campbell, and Meyersdal
Camera-Trapping to Test Wildlife Conservation
Nature Estate, Mr Deon Oosthuizen, for allowing us access
Hypotheses—An Example from Khao Yai National Park’,
to and use of the respective study sites.
Tropical Conservation Science, 4: 113–31.
Karanth, K. U. et al. (2017) ‘Spatio-temporal Interactions
Funding Facilitate Large Carnivore Sympatry across a Resource
Gradient’, Proceedings of the Royal Society B: Biological Sciences,
Funding was provided by the National Research Foundation
284:20161860.
(Grant No. 87769) and the University of the Witwatersrand.
Krebs, C. J. (1989) Ecological Methodology. New York: University of
Conflict of interest statement. None declared. Columbia, Harper Collins Publishers.
Kylafis, G., and Loreau, M. (2011) ‘Niche Construction in the Light
of Niche Theory’, Ecology Letters, 14: 82–90.
References Lenth, R., and Herve, M. (2019) Emmeans: Estimated Marginal
Barton, K. (2019) MuMIn: Multi-Model Inference. R package ver- Means, Aka Least-Square Means. R package version 1.1. 2.
sion 1.43. 6. https://CRAN.R-project.org/package¼MuMIn Le Roux, A. et al. (2016) A Conservation Assessment of Cynictis
Bateman, P. W., and Fleming, P. A. (2012) ‘Big City Life: penicillata, in M. F. Child et al. (eds) The Red List of Mammals of
Carnivores in Urban Environments’, Journal of Zoology, 287: South Africa, Swaziland and Lesotho. South Africa: South African
1–23. National Biodiversity Institute and Endangered Wildlife Trust.Spatiotemporal co-occurrence and overlap of two sympatric mongoose species | 9
Lesmeister, D. B. et al. (2015) ‘Spatial and Temporal Structure of a Poessel, S. A., Gese, E. M., and Young, J. K. (2017) ‘Environmental
Mesocarnivore Guild in Midwestern North America’, Wildlife Factors Influencing the Occurrence of Coyotes and Conflicts in
Monographs, 191: 1–61. Urban Areas’, Landscape and Urban Planning, 157: 259–69.
MacKenzie, D. I., Bailey, L. L., and Nichols, J. D. (2004) Prigioni, C. et al. (2008) ‘Differential Use of Food and Habitat by
‘Investigating Species Co-occurrence Patterns When Species Sympatric Carnivores in the Eastern Italian Alps’, Italian Journal
Are Detected Imperfectly ’, Journal of Animal Ecology, 73: 546–55. of Zoology, 75: 173–84.
Maddock, A. H. (1988) ‘Resource Partitioning in a Viverrid Ramesh, T. et al. (2012) ‘Spatio-Temporal Partitioning among
Assemblage’, PhD thesis, University of Natal, Large Carnivores in Relation to Major Prey Species in Western
Pietermaritzburg, RSA. Ghats’, Journal of Zoology, 287: 269–75.
, and Perrin, M. R. (1993) ‘Spatial and Temporal Ecology of , and Downs, C. T. (2014) ‘Modelling Large Spotted Genet
an Assemblage of Viverrids in Natal, South Africa’, Journal of (Genetta tigrina) and Slender Mongoose (Galerella sanguinea)
Zoology, 229: 277–87. Occupancy in a Heterogeneous Landscape of South Africa’,
Mattisson, J. et al. (2011) ‘Temporal and Spatial Interactions be- Mammalian Biology, 79: 331–7.
tween an Obligate Predator, the Eurasian Lynx (Lynx Lynx), and Rapson, S. A., Goldizen, A. W., and Seddon, J. M. (2012) ‘Species
Downloaded from https://academic.oup.com/jue/article/6/1/juaa013/5857627 by guest on 28 October 2020
a Facultative Scavenger, the Wolverine (Gulo gulo)’, Canadian Boundaries and Possible Hybridization between the Black
Journal of Zoology, 89: 79–89. Mongoose (Galerella nigrata) and the Slender Mongoose (Galerella
Mbatyoti, O. A. (2012) ‘Spatio-temporal Ecology of the Yellow sanguinea)’, Molecular Phylogenetics and Evolution, 65: 831–9.
Mongoose Cynictis penicillata in the Great Fish River Reserve Ribeiro, S. M. (2016) ‘Ecology of Carnivorous Species in Urban
(Eastern Cape, South Africa)’, Doctoral dissertation, University Ecosystems: Are They Adapted?’, Master thesis, The
of Fort Hare. University of Coimbra, Portugal.
Meredith, M., and Ridout, M. (2014) ‘Package ‘overlap’: Estimates Richmond, O. M., Hines, J. E., and Beissinger, S. R. (2010)
of Coefficient of Overlapping for Animal Activity Patterns’, ‘Two-Species Occupancy Models: A New Parameterization
Version 0.2. 4. Applied to Co-occurrence of Secretive Rails’, Ecological
Murray, M. et al. (2015) ‘Greater Consumption of Protein-Poor Applications, 20: 2036–46.
Anthropogenic Food by Urban Relative to Rural Coyotes Ridout, M. S., and Linkie, M. (2009) ‘Estimating Overlap of
Increases Diet Breadth and Potential for Human–Wildlife Daily Activity Patterns from Camera Trap Data’, Journal
Conflict’, Ecography, 38: 1235–42. of Agricultural, Biological, and Environmental Statistics, 14:
Nel, J. A. J., and Kok, O. B. (1999) ‘Diet and Foraging Group Size in 322–37.
the Yellow Mongoose: A Comparison with the Suricate and the Rood, J. P., and Waser, P. M. (1978) ‘Slender
Bat-Eared Fox’, Ethology Ecology & Evolution, 11: 25–34. Mongoose, Herpestes-Sanguineus, In the Serengeti’, Carnivore, 1: 54–8.
Newsome, S. D. et al. (2010) ‘Stable Isotopes Evaluate Rovero, F. et al. (2014) ‘Estimating Species Richness and
Exploitation of Anthropogenic Foods by the Endangered San Modelling Habitat Preferences of Tropical Forest Mammals
Joaquin Kit Fox (Vulpes macrotis mutica)’, Journal of Mammalogy, from Camera Trap Data’, PloS One, 9: e103300.
91: 1313–21. Schoener, T. W. (1974) ‘Resource Partitioning in Ecological
Norris, D., Michalski, F., and Peres, C. A. (2010) ‘Habitat Patch Size Communities’, Science, 185: 27–39.
Modulates Terrestrial Mammal Activity Patterns in Amazonian Scott, D. M. et al. (2014) ‘Changes in the Distribution of Red Foxes
Forest Fragments’, Journal of Mammalogy, 91: 551–60. (Vulpes vulpes) in Urban Areas in Great Britain: Findings and
Pedrini, P., Prigioni, C., and Volcan, G. (1995) ‘Use of Trophic Limitations of a Media-Driven Nationwide Survey’, PLoS One, 9:
Resources and Forest Habitats by the Genus Martes in e99059.
Adamello-Brenta Park (Central Italian Alps)’, Hystrix, 7: Skinner, J. D., and Chimimba, C. T. (2005) The Mammals of the
1–2. Southern African Sub-Region. Cambridge: Cambridge University
Peterson, R. A., and Cavanaugh, J. E. (2019) ‘Ordered Quantile Press.
Normalization: A Semiparametric Transformation Built for the Smithers, R. H. N. (1983) The Mammals of the Southern African
Cross-Validation Era’, Journal of Applied Statistics, 1–16. Sub-Region. Pretoria: University of Pretoria.
Pianka, E. R. (1974) ‘Niche Overlap and Diffuse Competition’, Taylor, M. E. (1975) ‘Herpestes sanguineus’, Mammalian Species, 65:
Proceedings of the National Academy of Sciences , 71: 2141–5. 1–5.
Plumer, L., Daviso, J., and Saarma, U. (2014) ‘Rapid Urbanization (1986) ‘The Biology of the Four-Toed Mongoose Bdeogale
of Red Foxes in Estonia: Distribution, Behaviour, Attacks on crassicauda’, Cimbebasia, 8: 187–93.
Domestic Animals, and Health-Risks Related to Zoonotic Wong, B. B., and Candolin, U. (2015) ‘Behavioral Responses to
Diseases’, PloS One, 9: e115124. Changing Environments’, Behavioral Ecology, 26: 665–73.You can also read