Relation of X-ray activity and rotation in M dwarfs and predicted time-evolution of the X-ray luminosity - St Andrews ...
←
→
Page content transcription
If your browser does not render page correctly, please read the page content below
Astronomy & Astrophysics manuscript no. AA201937408corr                                                                                  c ESO 2020
                                              April 8, 2020

                                                               Relation of X-ray activity and rotation in M dwarfs
                                                             and predicted time-evolution of the X-ray luminosity⋆
                                                                     E. Magaudda1 , B. Stelzer1,2 , K. R. Covey3 , St. Raetz1 , S. P. Matt4 , and A.Scholz5

                                                    1
                                                        Institut für Astronomie und Astrophysik, Eberhard-Karls Universität Tübingen, Sand 1, D-72076 Tübingen, Germany
                                                    2
                                                        INAF- Osservatorio Astronomico di Palermo, Piazza Parlamento 1, 90134 Palermo, Italy
                                                    3
                                                        Department of Physics & Astronomy, Western Washington University, Bellingham WA 98225-9164, USA
                                                    4
                                                        University of Exeter, Department of Physics & Astronomy, Physics Bldg., Stocker Road, Exeter EX4 4QL, UK
                                                    5
                                                        SUPA, School of Physics & Astronomy, University of St Andrews, North Haugh, St Andrews, KY169SS, UK
arXiv:2004.02904v1 [astro-ph.SR] 6 Apr 2020

                                                    Received 24 December 2019 / Accepted 30 March 2020

                                                                                                                   ABSTRACT

                                                    The relation of activity to rotation in M dwarfs is of high astrophysical interest because it provides observational evidence of the stellar
                                                    dynamo, which is poorly understood for low-mass stars, especially in the fully convective regime. Previous studies have shown that the
                                                    relation of X-ray activity to rotation consists of two different regimes: the saturated regime for fast-rotating stars and the unsaturated
                                                    regime for slowly rotating stars. The transition between the two regimes lies at a rotation period of ∼ 10 d. We present here a sample
                                                    of 14 M dwarf stars observed with XMM-Newton and Chandra, for which we also computed rotational periods from Kepler Two-
                                                    Wheel (K2) Mission light curves. We compiled X-ray and rotation data from the literature and homogenized all data sets to provide
                                                    the largest uniform sample of M dwarfs (302 stars) for X-ray activity and rotation studies to date. We then fit the relation between
                                                    Lx − Prot using three different mass bins to separate partially and fully convective stars. We found a steeper slope in the unsaturated
                                                    regime for fully convective stars and a nonconstant Lx level in the saturated regime for all masses. In the Lx /Lbol − RO space we
                                                    discovered a remarkable double gap that might be related to a discontinuous period evolution. Then we combined the evolution of
                                                    Prot predicted by angular momentum evolution models with our new results on the empirical Lx − Prot relation to provide an estimate
                                                    for the age decay of X-ray luminosity. We compare predictions of this relationship with the actual X-ray luminosities of M stars with
                                                    known ages from 100 Myr to a few billion years. We find remarkably good agreement between the predicted Lx and the observed
                                                    values for partially convective stars. However, for fully convective stars at ages of a few billion years, the constructed Lx −age relation
                                                    overpredicts the X-ray luminosity because the angular momentum evolution model underpredicts the rotation period of these stars.
                                                    Finally, we examine the effect of different parameterizations for the Rossby number (RO ) on the shape of the activity-rotation relation
                                                    in Lx /Lbol − RO space, and we find that the slope in the unsaturated regime and the location of the break point of the dual power-law
                                                    depend sensitively on the choice of RO .
                                                    Key words. stars: low-mass – stars: activity – stars: rotation – stars: magnetic field – X-rays: stars

                                              1. Introduction                                                              that are cooler and darker than their surroundings, called star
                                                                                                                           spots. In these regions the magnetic pressure is so high that it
                                              Late-type stars emit X-rays from their outermost atmospheric                 overcomes the gas pressure and consequently inhibits the heat
                                              layer. This is called the corona. The layer consists of a magneti-           transport by convection. As an observable consequence, the light
                                              cally confined plasma with temperatures of up to several million             curve displays a periodic brightness modulation caused by the
                                              Kelvin. The stellar corona was first observed in the Sun and is              rotation of the dark spots (Eaton & Hall 1979; Bopp & Evans
                                              thought to be heated by the release of magnetic energy through               1973). With space-based missions such as Kepler and its suc-
                                              a dynamo mechanism. For G-type stars, convection in the outer                cessor K2, we can therefore measure the stellar rotation period
                                              envelope together with differential rotation generates magnetic              (Prot ) and detect the photometric variations because the magnet-
                                              activity through an αΩ-dynamo mechanism (Parker 1955). The                   ically active regions continuously cross the visible hemisphere
                                              amount of magnetic energy that is released in the corona de-                 as the star rotates. The outer two atmospheric layers, the chro-
                                              creases over the stellar lifetime. This is a result of rotational spin-      mosphere and the corona, can be analyzed with optical, UV, and
                                              down that leads to decreased dynamo efficiency. The spin-down                X-ray observations (Güdel 2004; Durney et al. 1993).
                                              is driven by mass loss that interacts with the magnetic field. Stel-
                                              lar rotation and magnetism thus form a complex feedback sys-                     Main-sequence stars with M⋆ . 0.35 M⊙ (Chabrier & Küker
                                              tem.                                                                         2006), corresponding roughly to spectral types equal to or later
                                                  From the observations of the Sun, it is known that activity              than M3.5, have fully convective interiors. They therefore lack
                                              has distinct observable manifestations in each atmospheric layer.            the tachocline observed in solar-type stars, which invalidates
                                              The photosphere on a magnetically active star contains regions               the αΩ-dynamo mechanism. Possible alternative magnetic pro-
                                                                                                                           cesses are an α2 -dynamo or a turbulent dynamo mechanism, for
                                                ⋆
                                                   The collection of all updated data from the literature is listed in     which the dependence on rotation has not yet been settled.
                                              Table A.1, also available in electronic form at the CDS via anony-
                                              mous ftp to cdsarc.u-strasbg.fr (130.79.128.5) or via http://cdsweb.u-           An observational way to indirectly examine the underlying
                                              strasbg.fr/cgi-bin/qcat?J/A+A/.                                              stellar dynamo that causes the magnetic activity in solar- and
                                                                                                                                                                        Article number, page 1 of 15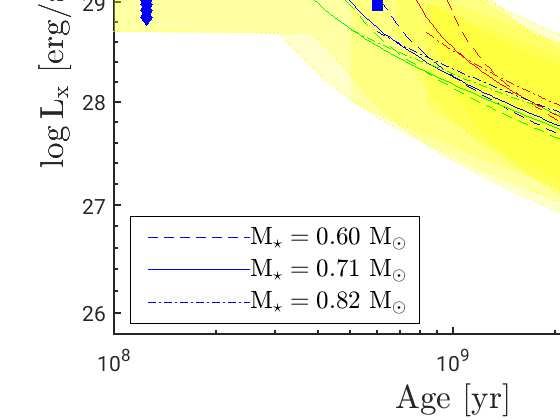
A&A proofs: manuscript no. AA201937408corr

later-type stars is to study the relation of coronal activity to ro-    rotation and coronal activity. In Sect. 4 we describe our analy-
tation. This relation is typically expressed in terms of the X-ray      sis of the new XMM-Newton and Chandra observations, and in
luminosity (Lx ) as a function of the rotational period (Prot ), or     Sect. 5 we present our selection and study of the rotation periods
alternatively, in terms of the ratio between the stellar X-ray and      derived for the stars with new X-ray data. Sect. 6 contains the
bolometric luminosities ( LLbolx ) as a function of the Rossby num-     results of the observed relation of rotation to activity in terms of
ber (RO ). This variable is a dimensionless number defined as the       Lx − Prot and Lx /Lbol − RO , and our construction of the Lx −age
ratio between Prot and the convective turnover time (τconv ), the       relation with help of the spin-down models. A summary and dis-
time needed for a convective cell to rise to the surface. Because       cussion of our results is presented in Sect. 7, followed by our
τconv is not an observable parameter, the use of RO introduces a        conclusions and the outlook for further development in Sect. 8.
model dependence or requires an ad hoc description.
     Previous studies of the activity-rotation relation have shown      2. Sample selection
two different regimes. In particular, for fast-rotating stars, the X-
ray activity does not depend on the rotation (saturated regime),        We observed 14 M-dwarf stars with XMM-Newton or Chandra.
while on the other hand, the X-ray activity of slowly rotat-            The sample was extracted from the stars of the Superblink proper
ing stars declines with increasing rotational period (unsatu-           motion catalog by Lépine & Gaidos (2011) (henceforth LG11)
rated regime). Pallavicini et al. (1981) were the first to study        that have K2 rotation period measurements. The LG11 catalog
the coronal X-ray emission as a function of v sin i for a sam-          is an all-sky list of 8889 M dwarfs (SpT= K7 to M6) brighter
ple of stellar spectral type (O3 to M). Later, Pizzolato et al.         than J = 10 mag and within 100 pc. Rotation periods have been
(2003) studied the coronal X-ray emission and stellar rota-             determined for the LG11 stars in the K2 fields of campaigns C0
tion in late-type main-sequence stars with X-ray data from the          to C4 by Stelzer et al. (2016), and the periods of the LG11 stars
ROSAT satellite and calculated Prot from v sin i measurements.          located in successive K2 campaigns were measured by us using
All v sin i values have been translated into Prot upper limits be-      the same methods (Raetz et al. 2020, AN subm.). For the X-ray
cause of the unknown inclination of the stellar systems, and            observations obtained for the present study, we predominantly
only two M dwarf stars were located in the unsaturated regime.          selected stars with long rotation periods (Prot > 10 d). Our new
Therefore the relation remained poorly constrained. Since               XMM-Newton and Chandra sample covers periods of 0.6 to 79 d.
then, Wright et al. (2011); Wright & Drake (2016); Stelzer et al.           Together with the 14 new stars, we here present the whole
(2016); Wright et al. (2018) and González-Álvarez et al. (2019)         sample from the previous literature on the X-ray activity-
have studied the X-ray activity-rotation relation of M dwarfs           rotation relation of M dwarfs based on photometric periods, that
based on photometric Prot , collecting much more information            is, Wright et al. (2011); Wright & Drake (2016); Stelzer et al.
about the empirical connection between rotation and X-ray emis-         (2016); Wright et al. (2018), and González-Álvarez et al.
sion.                                                                   (2019). The total sample we consider consists of 302 M dwarfs.
                                                                        To obtain a homogeneous sample, we applied some updates
     Because stellar rotation slows down throughout the main-           to the parameters of the stars from the literature. In the next
sequence life of a star, the dynamo efficiency also decreases           section we describe our updating procedure together with the
over time. This entails a decrease in X-ray luminosity. The joint       determination of the stellar parameters for our new sample of 14
evolution of rotation and activity is encoded in the empirical          stars with K2 rotation periods and deep X-ray observations.
rotation-activity relation. Direct observations of the age decay
of rotation and X-ray emission are hampered for M dwarfs by
the lack of stars with known age. Direct observations of the            3. Sample properties
age decay of rotation and X-ray emission are difficult to obtain
for M dwarfs with known ages of 1 Gyr or older. The avail-              In this section we explain the method we used to compute dis-
ability of precise light curves from the Kepler/K2 mission, cou-        tances and stellar parameters for the 14 new X-ray observations
pled with targeted or serendipitous X-ray observations, has en-         (henceforth “our sample") and for all literature samples we list in
abled detailed studies of the relation of age, rotation, and ac-        Sect. 2. Throughout the paper we refer to the “full sample" when
tivity in several ∼600 Myr benchmark open clusters (i.e., Prae-         we consider the 14 new observations together with the 288 stars
sepe & Hyades, Douglas et al. 2014,Núñez et al. 2015; M37,              from the literature. First, we evaluated Gaia-DR2 parallaxes to
Núñez et al. 2017), but the rotation periods and activity mea-          obtain updated distances (henceforth dgaia ). Gaia-DR2 contains
sures required to calibrate models of angular momentum evo-             spurious astrometric solutions (Arenou et al. 2018), therefore it
lution are only now becoming available for M dwarfs in clus-            is important to consider quality flags. To do so, we examined the
ters older than 1 Gyr (i.e., NGC 752; Agüeros et al. 2018). For         available Gaia parallaxes for all samples using the filters pro-
this reason, angular momentum evolution models for M dwarfs             vided by Lindegren et al. (2018) in their Appendix C. For the
(Matt et al. 2015) have not been calibrated for stars beyond the        stars without Gaia parallax or stars that are not validated by the
ages of the Hyades (∼ 600 Myr). Spin-down models can be used            quality flags, we calculated photometric distances (henceforth
combined with the empirical rotation-activity relation to predict       dphot ). To this end, we made use of photometric magnitudes from
the long-term evolution of stellar X-ray emission, however.             the USNO CCD Astrograph (UCAC4)1 and the Two Micron All-
                                                                        Sky Survey (2MASS) catalogs and applied the empirical relation
     In this work, we present an updated relation of X-ray activ-
                                                                        from Stelzer et al. (2016) to calculate the absolute magnitude in
ity to rotation in M dwarf stars and predict their Lx −age relation.
                                                                        the K band (MKs ) from V −J. We then used MKs together with the
In Sect. 2 we introduce the sample of M dwarfs that we stud-
                                                                        observed apparent magnitude in K band (Ks ) to derive the photo-
ied, which includes new X-ray observations from Chandra and
                                                                        metric distances. When we compared the two distance estimates,
XMM-Newton, and new rotation periods from the K2 mission as
                                                                        we identified 37 stars (∼ 12%) for which dGaia ≥ 2 · dphot , and
well as a collection of the samples studied in the previous litera-
                                                                        for these cases, we adopt the photometric distance throughout.
ture. In Sect. 3 we describe how we derived the stellar parameters
and how we updated the literature sample to provide the largest         1
                                                                          We verified that the UCAC4 Vmag are reliable by comparing them
and most homogeneous database to date for studies of M-dwarf            with the Gaia-to-Vmag conversion from Jao et al. (2018).

Article number, page 2 of 15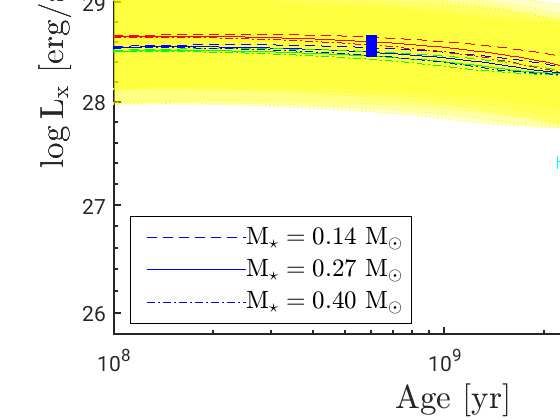
Magaudda et al.: Relation of X-ray activity to rotation in M dwarfs

There are no stars for which the Gaia distance is significantly            0.1 − 2.0 keV, in order to obtain the X-ray luminosity in the 0.1 −
smaller than the photometric distance. The FLAGD column in                 2.4 keV band, we returned to the ROSAT catalogs. In particular,
Tables 1 and A.1 shows the results of the applied distance qual-           we extracted the count rates from the bright (BSC: Voges et al.
ity criteria.                                                              1999) and faint (FSC: Voges et al. 2000) source catalogs and the
    The first number indicates the Lindegren et al. (2018) filter          second ROSAT All-Sky Survey Point Source Catalog (2RXS:
(1 means that it is validated, and 0 that it is not validated), and        Boller, Th. et al. 2016). These were converted into X-ray flux
the second number indicates our own condition (1 means that                using the conversion factor (CF = 5.771 · 10−12 erg/cm2/cts)
the Gaia distance is adopted, and 0 that the photometric distance          obtained with the count-rate simulator WebPIMMS2 for a 1T-
is adopted). FLAGD = 11 means that both quality criteria are               APEC model with kT = 0.5 keV and NH = 1019 cm−2 . The tem-
satisfied and we adopted Gaia parallaxes.                                  perature value is derived from computingf the mean coronal tem-
                                                                           perature for the stars from our new XMM-Newton and Chandra
                                                                           sample that have enough counts for the spectrum to be extracted
      0.9                                                                  (see Sect. 4.3), for which we find an average of 0.51 ± 0.03 keV.
                                                                                The uncertainties of the X-ray luminosities were calculated
      0.8                                                                  with error propagation, using the variance formula for the uncer-
                                                                           tainties of the X-ray fluxes and distances. Wright et al. (2011)
      0.7                                                                  provided no uncertainties on the X-ray measurements, therefore
                                                                           we applied the mean percentage value of the X-ray flux error
      0.6                                                                  measured for the other samples, which is ≈15%.
                                                                                We list in Table A.1 our updated results for the X-ray lu-
      0.5                                                                  minosities of the 288 stars from the literature. We also pro-
                                                                           vide (in Col.7) the rotation period adopted from these pre-
      0.4                                                                  vious studies. In particular, Wright et al. (2011) selected only
                                                                           photometric Prot from the literature, Wright & Drake (2016)
      0.3
                                                                           and Wright et al. (2018) used rotation measurements from the
                                                                           MEarth Project, which means that they were mostly in the
      0.2
                                                                           slow-rotator regime. Stelzer et al. (2016) have determined the
                                                                           Prot for the LG11 stars in the K2 field of campaigns C0 toC4,
      0.1
            2   2.5   3     3.5     4       4.5     5     5.5     6        and González-Álvarez et al. (2019) analyzed time-series of high-
                                                                           resolution spectroscopy taking Prot from activity indicators, that
                                                                           is, the CaII H&K and Hα spectral lines.
Fig. 1: Stellar masses as a function of Vmag − Jmag for all 302                 To illustrate the different samples, we show in Fig. 2 the up-
stars analyzed in this work. We distinguish stars for which we             dated relation of X-ray activity to rotation by combining all pre-
adopted Gaia distances (black filled circles) and those for which          vious literature samples with our own data, listed in Tables 1 and
we adopted photometric distances (green filled triangles) follow-          A.1. For this plot the convective turnover times, τconv , were cal-
ing the criteria described in Sect. 3.                                     culated using the empirical calibration by Wright et al. (2018).

                                                                           4. X-ray data analysis
    We used the empirical relations from Mann et al. (2015) and
Mann et al. (2016) to calculate stellar parameters. In particular,         As explained above, we worked in the ROSAT energy band (0.1-
we obtained stellar masses (M⋆ ) and radii (R⋆ ) from MKs , the            2.4 keV) for consistency with most previous works. The results
effective temperature (T eff ) from V − J and J − H, the bolometric        from the analysis of X-ray data for the new sample of 14 stars
correction (BCKs ) from V − J, and the bolometric lumonosity               obtained with Chandra and XMM-Newton are listed in Table 2.
Lbol from BCKs . We list the stellar parameters fot the 14 new             In the following we describe the analysis of these observations.
observations in Table 1 and those for the literature sample in
Table A.1. In Fig. 1 we show the relation between M⋆ and V −
                                                                           4.1. XMM-Newton: EPIC
J we found for the full sample. We note that according to our
V − J versus SpT calibration (Stelzer et al. 2016), stars with V −         Four of the 14 new observations were obtained with XMM-
J < 3 mag are K-type stars. For the sake of simplicity, we do              Newton. We analyzed these 4 observations with the XMM-
not distinguish these objects, but we recall that the full sample          Newton Science Analysis System (SAS)3 17.0 pipeline. Af-
comprises ≈15% of K-type stars.                                            ter data extraction, we filtered the event lists of EPIC/pn and
    Because we updated the distances for the literature samples,           EPIC/MOS. We extracted the light curve for the whole detec-
we had to recalculate the X-ray luminosity (Lx ). In order to              tor, and then we determined the good time intervals using the
have a uniform data sample, we computed the Lx adopting the                count rate ≤ 0.4 cts/s and count rate ≤ 0.35 cts/s as threshold
ROSAT energy band (0.1 − 2.4 keV) used in Wright et al. (2011),            for EPIC/pn and EPIC/MOS, respectively. We further filtered
Wright & Drake (2016), and Wright et al. (2018) for the full               our data for pixel pattern (PATTERN=0), event energies greater
sample. Of the objects in Wright et al. (2011) we took only the            than 0.15 keV, and quality flag (FLAG=0). We performed source
                                                                 2
                                                                           detection using the SAS pipeline edetect_chain in the ROSAT

field stars, and we scaled the published Lx values with ddWr+11
                                                             new
                                                                    ,
where dnew is our new distance from Table A.1 and dWr+11 is                energy band (0.15-2.4 keV) simultaneously for EPIC/pn and
the distance used by Wright et al. (2011). For the stars from              2
                                                                             Count-rate simulator PIMMS:
Wright & Drake (2016) and Wright et al. (2018), we calculated              https://cxc.harvard.edu/toolkit/pimms.jsp
Lx from the fluxes listed in Wright et al. (2018) with our new             3
                                                                             SAS Data Analysis Threads:
distances. Because González-Álvarez et al. (2019) listed Lx for            https://www.cosmos.esa.int/web/xmm-newton/sas-threads

                                                                                                                  Article number, page 3 of 15
A&A proofs: manuscript no. AA201937408corr
Table 1: Stellar parameters of the 14 M dwarfs with new X-ray and rotation data.
L
K2 EPIC ID MKs M⋆ R⋆ Mbol log10 bol
L⊙
T eff V − J Prot D FLAGD 1
[mag] [M⊙ ] [R⊙ ] [mag] [K] [mag] [d] [pc]
201718613 7.01±0.06 0.31±0.01 0.31±0.01 9.75±0.07 -2.00±0.03 3260±89 4.23 78.70 12.72±0.42 00
212560714 5.54±0.03 0.54±0.01 0.52±0.02 8.04±0.05 -1.31±0.02 3906±93 2.76 27.57 36.00±0.05 11
214787262 6.63±0.04 0.37±0.01 0.36±0.01 9.33±0.05 -1.83±0.02 3382±80 3.93 43.70 27.82±0.07 11
201659529 6.58±0.03 0.37±0.01 0.36±0.01 9.28±0.05 -1.81±0.02 3355±80 3.95 44.24 23.39±0.05 11
202059222 6.76±0.05 0.35±0.01 0.34±0.01 9.48±0.06 -1.89±0.02 3308±80 4.08 71.95 26.27±0.61 00
202059188 6.75±0.04 0.35±0.01 0.34±0.01 9.52±0.05 -1.91±0.02 3179±81 4.44 0.69 28.74±0.07 11
202059195 6.37±0.04 0.40±0.01 0.39±0.01 9.12±0.05 -1.74±0.02 3311±82 4.23 42.79 34.61±0.10 11
202059210 4.47±0.06 0.72±0.02 0.71±0.02 6.97±0.07 -0.89±0.03 3926±84 2.81 17.40 54.37±0.24 11
201364753 5.30±0.03 0.58±0.01 0.56±0.02 7.82±0.05 -1.23±0.02 3854±87 2.86 9.19 40.96±0.09 11
202059198 5.81±0.02 0.50±0.01 0.47±0.01 8.39±0.04 -1.45±0.02 3727±99 3.14 26.93 23.30±0.03 11
210579749 5.51±0.02 0.55±0.01 0.52±0.02 8.10±0.04 -1.34±0.02 3643±83 3.27 11.16 17.24±0.01 11
214269391 4.95±0.02 0.64±0.01 0.62±0.02 7.44±0.05 -1.08±0.02 3900±101 2.76 19.56 17.66±0.01 11
203869467 4.68±0.04 0.69±0.01 0.67±0.02 7.17±0.06 -0.97±0.02 3951±84 2.73 47.58 39.07±0.94 00
201717791 4.59±0.04 0.7±0.01 0.69±0.02 7.10±0.05 -0.94±0.02 3873±90 2.84 14.40 46.45±0.13 11
1
FLAGD is the quality criteria we used to select the distance. The first column represents the quality flag of Gaia
parallaxes from Lindegren et al. (2018) (1 means that it is validated, and 0 that it is not validated), the second column
shows our criteria for the comparison between Gaia and photometric distances, explained in Sect. 3 (1 means that the
Gaia distance is adopted, and 0 that the photometric distance is adopted). We used Gaia parallaxes if FLAGD = 11.
31 -2
30
-3
29
-4
28
27
Wright et al. 2011
-5 Wright et al. 2011
Wright et al. 2016 Wright et al. 2016
Wright et al. 2018 Wright et al. 2018
26 Stelzer et al. 2016
Stelzer et al. 2016
Gonzalez-Alvarez et al. 2019 Gonzalez-Alvarez et al. 2019
-6 This work
This work
25
0.1 1 10 100 10-3 0.01 0.1 1
Fig. 2: Left: Relation of activity to rotation in L x − Prot space. The color scale is based on the origin of the sample, as explained in
the inset. Right: Same as the left panel, but for L x /Lbol vs. Rossby number.
EPIC/MOS. Our lower energy threshold is slightly different from 4.2. Chandra
that of the ROSAT band. This is based on the fact that the rec-
ommended low-energy cutoff for XMM-Newton is at 0.15 keV. The Chandra data analysis was carried out with the CIAO
However, we quantified how much the count rate would differ if package4. We started our analysis with the new pipeline chan-
we included the counts between 0.10 − 0.15 keV, and it would dra_repro, which automatically reprocesses the event list by
be only ≈ 2% greater. The extraction of spectra and light curves reading data from the standard data distribution and creating a
was performed considering a source region of 40′′ centered on new bad pixel file and a new level 2 event file. After this, we cre-
the source position with an adjacent source-free circular back- ated an exposure-corrected image for CCD_ID = 7 of our ACIS-
ground region three times greater. We created the response ma- S observations in the ROSAT energy band (0.1 to 2.4 keV), and
trix and ancillary response for the spectral analysis with the SAS we determined the point spread function (PSF) map of the image
tools RMFGEN and ARFGEN, and we rebinned the spectrum in with mkpsfmap, choosing 100% of the enclosed counts fraction
order to have at least five counts for each background-subtracted (ecf=1.0). At this point, we proceeded with the source detection
spectral channel. with the wavdetect algorithm, which takes into account the PSF
map, the exposure time, and a significance detection threshold,
4
The CIAO package is developed by the Chandra X-Ray Center for
analyzing data from the Chandra X-ray Telescope, it can be down-
loaded from http://cxc.harvard.edu/ciao/
Article number, page 4 of 15Magaudda et al.: Relation of X-ray activity to rotation in M dwarfs
Table 2: X-ray journal of observations together with the results from the analysis explained in Sects. 4 and 6.3. The RO,C&S and RO,B
columns are the RO numbers from the normalized τconv relations by Cranmer & Saar (2011) and Brun et al. (2017) for stars with
T eff > 3300 K (see Sect. 6.3 for more details). The last column (RO,W ) shows the RO number by Wright et al. (2018).
Lx
K2 EPIC ID Mission Obs. ID Obs. Date Exp. Time Rate log(L x ) log Lbol
RO,C&S RO,B RO,W
[ks] [·10−3 counts/s] [erg /s]
201718613 XMM-Newton 0820460101 2018-06-11 18.0 47.20±2.20 27.03±0.03 -4.54±0.96 – – 0.96
212560714 XMM-Newton 0820460201 2018-07-02 33.6 3.33±0.57 26.78±0.07 -5.48±0.09 0.29 0.37 0.80
214787262 XMM-Newton 0820460301 2019-03-31 45.5 25.15±1.27 27.44±0.02 -4.30±0.10 0.35 0.30 0.64
201659529 XMM-Newton 0843430401 2019-07-14 23.1 12.07±1.05 26.97±0.04 -4.79±0.09 0.35 0.31 0.65
202059222 Chandra 17724 2015-12-07 14.7 < 0.24A&A proofs: manuscript no. AA201937408corr
Table 3: X-ray spectral parameters with 1 σ uncertainties computed with the error pipeline provided in the XSPEC software package.
K2 EPIC ID kT 1 log (EM1 ) kT 2 log (EM2 ) χ2 d.o.f. T mean
[keV] [cm−3 ] [keV] [cm−3 ] [keV]
201718613 0.17±0.03 48.54±0.07 0.73±0.05 48.49±0.07 0.8 69 0.44±0.03
214787262 0.31±0.02 50.17±0.05 1.29±0.21 49.77±0.12 1.1 37 0.59±0.06
EPIC 201718613 models by Matt et al. (2015) to construct the time-evolution of
0.1
the X-ray luminosity of M dwarfs. As we explained in Sect. 1,
EPIC/PN
previous studies showed two different regimes of the rotation-
EPIC/MOS1
0.01
EPIC/MOS2
activity relation, the saturated regime for fast-rotating stars with
Prot ≤ Protsat and the unsaturated regime for slowly rotating stars
10-3
with Prot > Protsat . The convective turnover time rescales the
sample by decreasing the horizontal spread in the unsaturated
10-4
regime and shifting the break point between the saturated and un-
2 saturated regime; normalizing the X-ray luminosity by the stel-
lar bolometric luminosity decreases the vertical spread in both
1 regimes, making the distinction of the two regimes more pro-
nounced in the L x /Lbol − RO space.
0 In Fig. 4 we show the full sample, plotted with a color-scale
representing the stellar mass. Arrows denote upper limits. Three
-1 of these undetected sources come from our new X-ray data and
seven are from Wright et al. (2018) (see Tables 2 and A.1 for
-2
0.3 0.5 1 2 3 5 10 more details). The best parameters for characterizing the relation
between activity and rotation have long been debated. Here we
EPIC 214787262
study both the L x − Prot and L x /Lbol − RO relation in Sects. 6.1
0.1 and 6.3, respectively.
Observed Data
0.01
6.1. X-ray luminosity versus rotation period
10-3
The observed activity-rotation relation in L x − Prot space (Fig. 4
10 -4 top panel) shows a large vertical spread, amounting to ≈2 dex, in
the saturated and unsaturated regime. Moreover, the X-ray activ-
ity in the saturated regime does not seem to show a constant max-
1 imum value, but the Lx level instead appears to decrease from a
maximum at the shortest rotation periods, declining toward the
breaking point into the unsaturated regime. For this reason, our
0
approach is based on a broken power-law fit for the two regimes.
In particular, our fitting method requires three steps. We
-1 first use a Bayesian approach to infer the maximum likelihood
parameters for a dual power law in the Lx versus Prot space.
0.3 0.5 1 2 3
Our implementation of this dual power-law model is based on
routines originally developed by Douglas et al. (2014) for use
Fig. 3: EPIC X-ray spectra together with the best-fitting thermal with the emcee Markov chain Monte Carlo (MCMC) package
APEC model (dashed line) for the two XMM-Newton observa- (Foreman-Mackey et al. 2013) to infer the maximum likelihood
tions with sufficient counts for spectral analysis. In particular, a parameters of the model. In detail, the dual power-law fit is cal-
simultaneously multifit for EPIC/pn and EPIC and MOS spectra culated as shown in Eq. 2,
of EPIC 201718613 and a single fit, again with two temperatures,
for EPIC/pn data for EPIC 214787262 are shown. β
if Prot ≤ Prot,sat
C sat Protsat
(2)
Lx = ,
Cunsat Pβrotunsat if Prot > Prot,sat
ues published by Stelzer et al. (2016), Raetz et al. (2020a, AN
submitted), and Raetz et al. (2020).. where Cn = (L xn /Pβrotn ), with n = (sat,unsat).
In our first iteration, likelihoods of each potential model are
calculated using flat priors in each parameter (2 d < Prot,sat <
6. Relation of activity, rotation, and age 50 d; -4 < β sat < 2; -5 < βunsat < 1), and allowing for a nui-
sance parameter to account for underestimated (multiplicative)
In this section we discuss the relation of X-ray activity, rota- errors. We infer maximum likelihood parameters by comparing
tion, and age based on the full sample as is defined in Sect. 3. each potential model output to the subset of the full sample with
We use the result combined with angular momentum evolution reliable detections (i.e., excluding nondetections from this first
Article number, page 6 of 15Magaudda et al.: Relation of X-ray activity to rotation in M dwarfs
MCMC-based inference of the dual power-law fit, but forcing
the slope in the unsaturated regime to remain within 0.02 of the
0.8
value identified by the Cenken routine.
30 The results inferred from this three-step fitting process are
0.7 shown in Fig. 5, and tabulated for reference in Table 4. As a
result of this procedure, we found maximum likelihood param-
29
0.6 eters for a dual power-law fit to the full mass range of β sat =
−0.14 ± 0.10, βunsat = −2.25 ± 0.02, and Prot,sat = 8.5 ± 1.0 d. We
28 0.5 quantify for the first time that the X-ray luminosity in the sat-
urated regime is not constant but shows a small negative slope,
27
0.4 that is, a decrease in Lx for higher Prot . However, the uncertain-
ties of βsat indicate that this finding is tentative, with a signifi-
0.3 cance at the ∼ 1σ level for the full global fit.
26
0.2
31
0.1 1 10 100
30
-2
0.8
29
0.7
-3
28
0.6
-4 27
0.5
0.4 26
-5
0.3
25
0.1 1 10 100
-6 0.2
-3 0.01 0.1 1
10
Fig. 5: Two-component fit (see Eq. 2) to the activity-rotation re-
lation for the full sample (see Sect. 6.1 for the fitting procedure).
Fig. 4: Relation of activity to rotation for all 302 stars we an-
alyzed, displayed with a color code for the stellar mass. Top:
Relation in X-ray luminosity vs. rotation period space. Bottom: Figure 4 clearly shows systematic trends with stellar mass. In
Relation in terms of the ratio between X-ray and bolometric lu- particular, the saturated Lx level decreases for lower M⋆ and the
minosities as a function of Rossby number. Prot,sat turnover point is higher for lower M⋆ . In order to search
for differences in the activity-rotation relation of partially and
fully convective stars, we therefore split the sample into three
stellar mass ranges: lower, medium, and higher stellar masses.
iteration) using 256 walkers that each take 10,000 steps in their We used the results from Jao et al. (2018), who assigned the tran-
MCMC chain. We discard the first half of each chain to allow sition to fully convective stars to MKs = 6.7 mag (dashed black
the solutions to burn in, and measure the maximum likelihood line in Fig. 6); this corresponds to V − J ≈ 4 mag. This approach
values of each parameter as the median value of the remaining is justified a posteriori by the fact that at MKs > 6.7 mag there are
samples; we calculate 1σ uncertainties as half the distance be- mostly objects from Wright & Drake (2016) and Wright et al.
tween the 16th and 84th percentiles of the resulting posterior (2018), where only M3 and later stars are included. Compar-
distribution. In practice, the latter nuisance parameter converged ing Fig. 6 to the empirical relation between SpT and V − J
quite closely to 1, suggesting that the adopted uncertainties are from Stelzer et al. (2016), we found that V − J = 4 mag cor-
appropriately close to their true values, therefore we do not re- responds to SpT∼M3.5. Based on the comparison of MKs , V − J,
port these values further. M⋆ , and SpT, we therefore locate the fully convective transi-
In order to take the upper limits properly into account, in tion at M⋆ = 0.4 M⊙ . In order to split the full sample into
the next step we fit only the unsaturated regime, where all three M⋆ bins, we considered our fully convective mass tran-
upper limits are located, using the Cenken method provided sition and then subdivided the partially convective sample into
by the R-statistics package to calculate the Akritas-Theil-Sen two mass ranges. In particular, the three stellar mass ranges are
(Akritas et al. 1995) nonparametric slope to the full censored (1) 0.14 M⊙ ≤ M⋆ ≤ 0.40 M⊙, (2) 0.40 M⊙ ≤ M⋆ ≤ 0.60 M⊙ ,
dataset. To define the onset of the unsaturated regime in terms and (3) 0.60 M⊙ ≤ M⋆ ≤ 0.82 M⊙. The number of stars in each
of Prot , we used the result from the MCMC analysis in the pre- mass bin is given in Table 4. We recall that the highest mass bin
vious step. To ensure that our measurement of the slope in the also comprises late K-type stars.
saturated regime was not unduly influenced by the omission of We separately investigated the relation of activity to rotation
nondetections from the first MCMC fit, we then repeated the in these three mass ranges by applying the same fitting proce-
Article number, page 7 of 15A&A proofs: manuscript no. AA201937408corr
Table 4: Results from fitting the relation of activity to rotation in Lx − Prot space for the full sample and three mass ranges (see Eq.
2 for more details).
log Lx,sat (Prot = 1 d)
Mass range N⋆ βsat βunsat Prot,sat
[d] [erg/s]
Full Sample 302 -0.14±0.10 -2.25±0.02 8.5±1.0 29.11±0.11
M⋆ > 0.6M⊙ 113 -0.17±0.14 -2.27±0.02 5.2±0.7 29.56±0.13
0.4M⊙ ≤ M⋆ ≤ 0.6M⊙ 102 -0.39±0.13 -2.26±0.02 11.8±2.0 29.10±0.16
M⋆ < 0.4M⊙ 87 -0.19±0.11 -3.52±0.02 33.7±4.5 28.54±0.20
6.2. X-ray luminosity vs age
4
X-ray activity and rotation are both known to undergo significant
change during the stellar lifetime. Lx decays by a factor 1000
5 from the pre-main sequence (PMS) to the main-sequence (MS)
(Preibisch & Feigelson 2005), for instance, presumably because
the dynamo efficiency decreases. The rotation periods are ob-
6 served to decrease during PMS contraction, starting from an ini-
tially broad distribution with Prot ∼ 0.5 to 10 d (depending on
stellar mass; Irwin et al. 2011). The further evolution of the ro-
7 tation rate during the MS life is thought to be ruled by angular
Wright et al. 2011
momentum loss mediated by magnetic winds (Kawaler 1988).
Wright et al. 2016
Different wind models have been developed to predict the rota-
Wright et al. 2018
8 Stelzer et al. 2016
tional evolution, see Matt et al. (2015) and Garraffo et al. (2018)
Gonzalez-Alvarez et al. 2019 for M stars, for example. However, no theory exists that quanti-
This work fies the decay in X-ray luminosity during the MS evolution, and
9 the lack of field M dwarfs with known age has impeded an ob-
2 2.5 3 3.5 4 4.5 5 5.5 6 servational study of the Lx −age relation for ages beyond that of
open clusters such as the Hyades.
Fig. 6: Color-magnitude diagram for the full sample. The dashed 6.2.1. Predicted relation of X-ray luminosity to age
black line shows the transition to fully convective stars at MKs >
6.7 mag, according to Jao et al. (2018). Here we predict the time-evolution of the X-ray emission by
combining the observed Lx − Prot relation from Sect. 6.1 with
the spin-down models (Prot − age) from Matt et al. (2015). We
perform this analysis individually for the three mass bins con-
sidered in Sect. 6.1. We calculated the rotation periods for stars
with mass equal to the edges and the mean of the three mass
bins, using the model of Matt et al. (2015), starting from an age
of 5 Myr and evolving to an age of 10 Gyr. Because our observed
dure we used above. In Fig. 7 we show the results of our fit- Lx − Prot relations refer to a range of masses (see Table 4), we
ting analysis for the three mass ranges. For each mass range extracted the Prot evolution from the angular momentum evolu-
the saturated regime has a nonconstant X-ray activity level. The tion model for the central mass of the bin, as well as for the mass
slope βsat for the high-mass range is flatter than the slope for of the lower and the upper boundaries. This allowed us to take
the low-mass range. The slope in the intermediate-mass range the mass spread within each of our three mass bins into account.
is the steepest. Nonetheless, the slope in the saturated regime The rotational evolution depends on the initial rotation period
is independently detected at the 1σ level in all three mass bins, (Prot,in ) of the star, which is not a unique value (see our discus-
which raises the statistical significance of this result above the sion above), as is known from observations in regions of star for-
1σ confidence in the global fit. We confirmed the result found mation. We therefore took this spread in the boundary conditions
by Pizzolato et al. (2003) that the breaking point Prot,sat moves into account, and we investigated three different initial values for
to longer periods with decreasing stellar mass. In the unsaturated the rotation periods. These led to three tracks for given M⋆ .
regime the slopes are similar (βunsat ≈ −2.2) for the higher and Our procedure for deriving an Lx −age relation, carried out
the intermediate mass range, but the lowest mass range shows a for each of the three mass bins from Sect. 6.1 separately, is the
much steeper decline of Lx with Prot (βunsat, calculated at Prot = 1 d from 5 Myr to 10 Gyr the rotation periods from the Matt et al.
with the fit procedure. From this we see that the X-ray activity (2015) model using Prot,in = 1.54, 5.51 and 8.83 d for the initial
level in the saturated regime displays a continuous decrease to- period. We thus obtained a total of nine tracks for the age evolu-
ward later SpT (also observed by Stelzer et al. 2016, on a much tion of the rotation period and three tracks for the three values of
smaller sample). Prot,in , and this for each of three masses. We show these tracks in
Article number, page 8 of 15Magaudda et al.: Relation of X-ray activity to rotation in M dwarfs
31
30
29
28
27
26
25
0.1 1 10 100
31
30
29
28
27
26
25
0.1 1 10 100
31
30
29
28
27
26
25
0.1 1 10 100
Fig. 7: On the left: Results of the activity-rotation relation fitting for the three mass ranges considered in this work. On the right:
Retrieved Lx -age relation from angular evolution models for the same mass bins together with M dwarfs with known ages from
the literature by Wright et al. (2011) (blue points) and Veyette & Muirhead (2018) (squared cyan). The yellow region shows the
vertical Lx −spread from the standard deviation of the observed Lx − Prot relation. Three different initial rotation periods are shown:
Prot,1 = 1.54 d (red line), Prot,2 = 5.51 d (blue line), and Prot,3 = 8.83 d (green line). In the predicted Lx −age relation we show the
model for the central mass bin (solid line), together with the lower and upper mass boundaries (dashed and dotted line, respectively).
Fig. A.1. Then we calculated the Lx value corresponding to each Prot value from the appropriate best-fit relation given in Table 4.
Article number, page 9 of 15A&A proofs: manuscript no. AA201937408corr
To consider the vertical spread observed in the saturated and un- Wright et al. (2011) are plotted in Fig. 7, using the stellar masses
saturated regimes of Lx versus Prot , we assign the observed Lx they computed using V − Ks magnitudes.
standard deviation to the constructed X-ray luminosities in each Our constructed Lx -age relation places the Pleiades M dwarfs
mass range. in the saturated regime and the Hyades M dwarfs as well, except
In the right panel of Fig. 7 we show our constructed Lx − age for the highest mass bin (M⋆ = 0.6 to 0.8 M⊙), where the age of
relation for each mass bin and for the three initial period values. the Hyades corresponds to the turnover point between saturated
The computed vertical spread is shown as the yellow region. The and unsaturated regime. Interestingly, both open clusters span
standard deviation in the predicted Lx is generally larger than the full spread of X-ray luminosities inferred from the Matt et al.
the difference in tracks that is due to the different initial rates or (2015) rotational evolution tracks and the observed Lx − Prot re-
different masses within the same mass bin. lation of field M dwarfs (yellow region in Fig. 7).
The field M dwarfs from Veyette & Muirhead (2018) span
ages from ∼ 4 to 9 Gyr and masses within the range of our two
6.2.2. Comparison to observations
lower-mass bins. At a given age and mass, this sample presents a
The validity of the relation for the age-decay of X-ray luminosity spread in X-ray luminosity of more than an order of magnitude.
that we constructed from the spin-down models and the empiri- None of these stars has M⋆ > 0.6 M⊙ , corresponding to our high-
cal relation of X-ray activity to rotation can be tested with stars mass bin. While the intermediate-mass stars (M⋆ = 0.4−0.6 M⊙)
of known age and X-ray luminosity. Such samples are notori- fall within the predicted range of Lx (yellow zone in Fig. 7),
ously sparse in the M-dwarf regime. We took three such sam- the fully convective stars (M⋆ < 0.4 M⊙) are clearly underlumi-
ples from the literature: M stars in the Pleiades (125 Myr), in the nous with respect to the prediction of our Lx -age relation. Our
Hyades (∼ 600 Myr), and field M dwarfs with individual ages procedure overpredicts the X-rays of the fully convective field
determined from a chemo-kinematic study. The X-ray luminosi- M dwarfs because the spin-down model provides rotation pe-
ties of these objects are plotted over the predicted Lx −age rela- riods that are faster than observed for these stars (as noted in
tion in the right panel in Fig. 7. Matt et al. 2015).
The X-ray luminosities of the Pleiades and Hyades werere
extracted from Wright et al. (2011), observed in the 0.1−2.4 keV 6.3. Fractional X-ray luminosity versus Rossby number
band. Wright et al. (2011) provide a list of stars with detected X-
ray emission for both clusters, but no upper limits for stars with As described in Sect. 3, we computed the τconv for the full sam-
X-ray luminosities below the detection limit. They computed Lx ple using the relation by Wright et al. (2018), which is valid over
with the adopted distance equal to 133 pc for stars in the Pleiades the range 1.1 < V − Ks < 7.0. To investigate if this empiri-
and 46 pc for stars in the Hyades. cal τconv scale is consistent with theoretical values, we also con-
Field stars were taken from Veyette & Muirhead (2018), structed the Lx /Lbol -RO relation for the τconv parameterizations
who determined individual ages for 11 nearby planet-hosting M of Cranmer & Saar (2011) and Brun et al. (2017). The relation
dwarfs using a combination of kinematics and chemical evolu- between τconv and T eff of Cranmer & Saar (2011) is the result
tion. First we calculated the distances and stellar parameters for of a parameterized fit of 1D stellar structure models. Brun et al.
these stars as described in Sect. 2 for the rotation-activity sam- (2017) presented the fluid Rossby number as a function of M⋆
ple. Then we searched for X-ray detections of these stars in the and Ω⋆ computed with 3D stellar models based on mixing length
ROSAT FSC (Voges et al. 2000), the ROSAT BSC (Voges et al. theory, and Wright et al. (2018) derived τconv empirically as a
1999), and the 3XMM-DR8 catalog (Rosen 2016). For the six function of V − Ks color from a study of the Lx /Lbol − RO
stars that we were able to identify with a source in one of the relation for fully convective stars. Because the relations from
above catalogs, we derived the X-ray luminosities from the cat- Cranmer & Saar (2011) and Brun et al. (2017) are calibrated
aloged count rates in the same manner in which we treated the only for partially convective stars, we excluded from the analysis
stars from González-Álvarez et al. (2019) (see Sect. 3). For the in Lx /Lbol - RO space all stars with T eff < 3300 K, corresponding
remaining five stars, we estimated the upper limit on Lx based on to M⋆ < 0.4M⊙ . It is important to note that the different scal-
the ROSAT All-Sky Survey (RASS). Specifically, we extracted ing laws for τconv result in different values for the Sun. Therefore
the RASS exposure time at the location of each of the stars from we normalized the three relations in order to obtain a fixed so-
the exposure maps available from the ROSAT webpage at the lar value. We scaled the Cranmer & Saar (2011) and Brun et al.
Max-Planck-Institut für extraterrestrische Physik7 . Then we ob- (2017) parameterization to the one by Wright et al. (2018), tak-
tained the individual upper limit count rates from the estimated ing the ratio between τconv for the Sun as normalization factor.
RASS sensitivity limit shown as lower envelope in the plot that In particular, we computed the solar τconv by Cranmer & Saar
shows the RASS count rate versus exposure time in Fig. 4 of (2011) using T eff,⊙ = 5778 K (Brandenburg et al. 2017) and
Stelzer et al. (2013). In Table 5 we list all derived parameters the solar τconv by Wright et al. (2018) with (V − K)⊙ = 1.5
for the stars from Veyette & Muirhead (2018) that are relevant mag8 . Because Brun et al. (2017) provide RO already normal-
for our purpose. These are the age with its uncertainty extracted ized to the solar mass and rotation rate, we computed the so-
from Veyette & Muirhead (2018) (Col. 2), the adopted distance lar τconv using Prot,⊙ = 24.5 d (Brandenburg et al. 2017). In Ta-
derived from the quality criteria as defined in Sect. 3 (Col. 3, all ble 2 and A.1 we list for each star the three RO values from
Gaia distances are reliable for this sample, FLAGD = 11), the the different relations for τconv . In Fig. 8 we show how Lx /Lbol
stellar mass (Col. 4), and the X-ray instrument and luminosity in versus RO changes according to the different adopted τconv pa-
the 0.1 − 2.4 keV band (Cols. 5 and 6). rameterizations. The Lx /Lbol - RO relation with the Wright et al.
Each star from Veyette & Muirhead (2018) is plotted on (2018) and Cranmer & Saar (2011) τconv values are similar, but
the right side of Fig. 7 in the respective panel corresponding the Brun et al. (2017) parameterization is shifted toward higher
to its individual stellar mass. Pleiades and Hyades stars from RO values and has a smaller spread in the unsaturated regime.
7 8
http:xray.mpe.mpg.de/cgi-bin/rosat/rosat-survey http://mips.as.arizona.edu/~cnaw/sun.html
Article number, page 10 of 15Magaudda et al.: Relation of X-ray activity to rotation in M dwarfs
Table 5: Relevant parameters for the sample of M dwarfs from Veyette & Muirhead (2018). FLAGD are not listed because all Gaia
parallaxes are reliable for this sample (see text in Sect. 6.2.2).
Name Age D M⋆ X-ray catalog log (Lx )
[Gyr] [pc] [M⊙ ] [erg/s]
GJ 176 8.8+2.5
−2.8 9.473±0.006 0.47±0.02 RASS/FSC 27.38±0.13
GJ 179 4.6+3.5
−2.4 12.360±0.009 0.33±0.01 RASSA&A proofs: manuscript no. AA201937408corr
Here we likely probe the rotation-independent decrease in X- We applied the same fitting procedure used for the Lx −
ray emission in late-M dwarfs that has been ascribed to poor Prot relation to Lx /Lbol − RO , and we identified the follow-
coupling between matter and magnetic field in the increasingly ing interesting results: (1) all calibrations provide a decrease
neutral atmospheres at the bottom of the MS and the ensuing in Lx /Lbol in the saturated regime, (2) the parameterization by
shut-off of activity (Mohanty et al. 2002) probably caused by Brun et al. (2017) yields a much steeper βunsat slope with a break-
the increasing electrical resistivity in such cool atmospheres. We ing point at higher RO than those from Cranmer & Saar (2011)
confirmed past results by Pizzolato et al. (2003) for which the and Wright et al. (2018) parameterizations, and (3) there is a re-
breaking point between the two power laws occurs at higher Prot markable double gap in Lx /Lbol − RO space with a scarcity of
as M⋆ decreases. However, in our several times larger sample, objects slightly above and below Lx /Lbol ∼ 10−4 (e.g., the right
the values we find for the turnover points are much higher than panel in Fig. 2) that is difficult to explain as an observational
those presented in their historical study. bias.
The nonconstant X-ray emission level in the saturated regime As discussed above, Reiners et al. (2014) previously ob-
was first noted by Reiners et al. (2014) in terms of Lx /Lbol . As served a slope in the saturated regime in Lx /Lbol − RO . They
possible explanation, they suggested a property of the dynamo or examined a sample in a broad mass range (M⋆ ≤ 1.4M⊙ ) and
a residual mass-dependence in the saturated regime. We see the found a slope βsat = −0.16. In our M dwarf sample we find a
negative slope in each of the three mass bins we examined (see, slightly steeper βsat slope for all three τconv parameterizations
e.g., the left panel in Fig. 7). The likely cause therefore is some (see Table 6). While above, based on Lx − Prot , we argued that
rotation dependence of the dynamo even for these fast rotators. the existence of this slope is not a mass effect (because we see it
We measured a steeper slope in the unsaturated regime for stars in different mass bins), its actual steepness may depend on mass.
with M⋆ < 0.4 M⊙ (fully convective stars). For the slope in the unsaturated regime, βunsat , we find signifi-
We used our best-fit parameters of the activity-rotation rela- cantly different results from the three Rossby parameterizations.
tion to construct the Lx −age relation using spin-down models by Wright et al. (2011) studied the Lx /Lbol − RO relation for par-
Matt et al. (2015). In the time-evolution tracks for a given nar- tially convective stars, finding RO,sat = 0.16 ± 0.03, βunsat = −2.7,
row mass range at a certain mass-dependent point, the evolution and (Lx /Lbol )sat = −3.13. When the Cranmer & Saar (2011) and
of different initial periods starts to diverge. This is not visible Wright et al. (2018) calibrations are used, our slope in the un-
in the Lx −age relation as long as the stars remain saturated, but saturated regime is substantially smaller than that value (βunsat ≃
when they drop out of saturation and Lx starts to decrease, the −2), while Brun et al. (2017) yields a significantly larger slope
tracks with different initial periods also diverge in Lx −age space. (βunsat = −2.9). This latter parameterization also yields a much
However, the range of our predicted Lx for different initial Prot higher value for the break-point RO,sat than Cranmer & Saar
at given age and mass (i.e., the tracks in the right panel in Fig. 7) (2011) and Wright et al. (2018) and than the historical result by
is much smaller than the Lx −spread we inferred from the ob- Wright et al. (2011). The Lx /Lbol −Rossby relation constructed
served relation of X-ray activity to rotation (yellow region in with the Brun et al. (2017) Rossby numbers visibly produces the
Fig. 7). Therefore we cannot distinguish the X-ray evolution of smallest scatter of the data points, suggesting that it best rep-
stars with different initial rotation periods. resents the presumed universal mass-dependent parameter that
By comparing our constructed Lx −age relation to stars with rules the activity-rotation relation, and which is usually identi-
known age, we found that the Hyades stars in our high-mass bin ( fied with the convective turnover time.
0.6−0.8 M⊙; corresponding to late-K to early-M SpT) are located We speculate that the remarkable gap we found in Lx /Lbol −
at the onset of the unsaturated regime in the Lx −age relation. The RO space might be associated with a phase of stalled rota-
rotation periods of the Hyades in that mass range are (∼10−20 d; tional evolution followed by an episode of rapid spin-down,
Douglas et al. 2019), which is roughly consistent with the Prot at which has recently been discussed in rotation studies of open
which the transition from the saturated to the unsaturated regime clusters and solar-type field stars by Curtis et al. (2019) and
takes place. Moreover, our result shows that the Pleiades and Metcalfe & Egeland (2019). In these works the rotation-age re-
Hyades stars span the full range of Lx in the saturated regime, lation is studied for G- and K-type stars. According to these
suggesting that the scatter of X-ray luminosity at a given rotation studies, stalling seems to last longer for lower stellar masses.
period has no evolutionary component from the zero-age MS on- This period stalling might lead to a pile-up of objects before the
wards. Because the model by Matt et al. (2015) fails to produce transition to the unsaturated regime, and combined with subse-
the known long rotation periods (50 d) for M dwarfs, our model quent rapid spin-down, a gap around the breaking point in the
overpredicts the X-ray luminosity of fully convective field stars relation of activity to rotation. We clearly see two such gaps in
in our constructed relation of X-ray to age. This explains why in the Lx /Lbol − RO space. Moreover, the bottom panel of Fig. 4
the fully convective bin the field M stars with gigayear-ages are demonstrates that this gap is present in different masses. If the
located below the Lx expected from our relation. evolution of the rotation period is responsible for these gaps, we
We investigated for the first time, to our knowledge, how would expect to see them in Lx − Prot space. There is some ev-
adopting different τconv parameterizations can affect the shape idence for two sparsely populated regions around log Lx ∼ 28.2
of the Lx /Lbol − RO relation. We performed this comparison erg/s and log Lx ∼ 27.2 erg/s. The upper region occurs at peri-
for the Rossby numbers of Cranmer & Saar (2011), Brun et al. ods of Prot ∼ 10..30 d, corresponding to the period gap in the
(2017), and Wright et al. (2018), which originate from differ- M⋆ − Prot diagram of large samples from the Kepler mission
ent approaches and have different ranges of validity. In partic- (McQuillan et al. 2014). While this coincidence is intriguing, the
ular, the relation of Cranmer & Saar (2011) is valid only for “X-ray gap” and the search for its origin require further investi-
stars with T eff ≥ 3300 K, Brun et al. (2017) can be applied gation.
to a wide range of stellar masses (from 0.4 M⊙ to 1.2 M⊙ ), The relation of activity to rotation can be also studied by an-
and the relation of Wright et al. (2018) is valid over 1.1 mag < alyzing the emission of typical chromospheric spectral lines. For
V − Ks < 7.0 mag. Therefore, the stars we considered in our in- instance, Newton et al. (2017) analyzed the activity from the Hα
vestigation of Lx /Lbol − RO are the 242 out of the full sample that emission in LHα /Lbol −RO space by applying a broken power-law
fulfill all these conditions. fit. They calculated the Rossby numbers with the τconv parame-
Article number, page 12 of 15Magaudda et al.: Relation of X-ray activity to rotation in M dwarfs
terization from Wright et al. (2011), therefore their results are References
not directly comparable with ours. Agüeros, M. A., Bowsher, E. C., Bochanski, J. J., et al. 2018, ApJ, 862, 33
Akritas, M. G., Murphy, S. A., & Lavalley, M. P. 1995, JASA, 90
Arenou, F., Luri, X., Babusiaux, C., et al. 2018, A&A, 616, A17
8. Conclusions and outlook Boller, Th., Freyberg, M. J., Trümper, J., et al. 2016, A&A, 588, A103
Bopp, B. W. & Evans, D. S. 1973, MNRAS, 164, 343
The collected and updated database of this work reduced the Brandenburg, A., Mathur, S., & Metcalfe, T. S. 2017, ApJ, 845, 79
observational biases in the relation of X-ray activity to rota- Brun, A. S., Strugarek, A., Varela, J., et al. 2017, ApJ, 836, 192
tion. This leads to a series of interesting results, including (1) Chabrier & Küker. 2006, A&A, 446, 1027
Cranmer, S. R. & Saar, S. H. 2011, ApJ, 741, 54
a nonconstant saturated level of the X-ray emission, (2) a signif- Curtis, J. L., Agüeros, M. A., Douglas, S. T., & Meibom, S. 2019, ApJ, 879, 49
icant steepening of the slope in the unsaturated regime for fully Douglas, S. T., Agüeros, M. A., Covey, K. R., et al. 2014, ApJ, 795, 161
convective stars, (3) possible “regions of avoidance” in the Lx Douglas, S. T., Curtis, J. L., Agüeros, M. A., et al. 2019, ApJ, 879, 100
and Lx /Lbol distribution that might be related to a discontinu- Durney, B. R., De Young, D. S., & Roxburgh, I. W. 1993, Solar Physics, 145,
ous period evolution, and (4) the dependence of the shape of the 207
Eaton, J. A. & Hall, D. 1979, ApJ, 227, 907
Lx /Lbol −RO relation on the assumptions made for the convective Foreman-Mackey, D., Hogg, D. W., Lang, D., & Goodman, J. 2013, PASP, 125,
turnover time. We moreover predicted for the first time the evo- 306
lution of M-dwarf X-ray emission for ages beyond ∼ 600 Myr, Garraffo, C., Drake, J. J., Dotter, A., et al. 2018, ApJ, 862, 90
that is, after the stars drop out of saturation. A focus of future González-Álvarez, Micela, G., Maldonado, J., et al. 2019, A&A, 624, A27
Güdel, M. 2004, Astron. Astrophys. Rev., 12, 71
studies should be the transition between saturated and unsatu- Irwin, J., Berta, Z. K., Burke, C. J., et al. 2011, ApJ, 727, 56
rated regimes of the rotation-activity relation, which is crucial Jao, W.-C., Henry, T. J., Gies, D. R., & Hambly, N. C. 2018, ApJ, 861, L11
for anchoring the dual power-law fit and to quantify the “X-ray Kawaler, S. D. 1988, ApJ, 333, 236
gap”. Unprecedentedly large samples can be expected from the Lépine, S. & Gaidos, E. 2011, AJ, 142, 138
All-Sky missions TESS and eROSITA, which yield Prot up to 20 d Lindegren, L., Hernández, J., Bombrun, A., et al. 2018, A&A, 616, A2
Mann, A. W., Feiden, G. A., Gaidos, E., Boyajian, T., & Braun, K. V. 2015, ApJ,
and X-ray measurements 20 times deeper than ROSAT. These 804, 1
missions will be particularly useful to address these questions. Mann, A. W., Feiden, G. A., Gaidos, E., Boyajian, T., & von Braun, K. 2016,
ApJ, 819, 87
Acknowledgements. EM was supported by the Bundesministerium für
Wirtschaft und Energie through the Deutsches Zentrum für Luft- und Raumfahrt Matt, S. P., Brun, A. S., Baraffe, I., Bouvier, J., & Chabrier, G. 2015, ApJ, 799,
e.V. (DLR) under grant number FKZ 50 OR 1808. SPM is supported by L23
the European Research Council, under the European Union’s Horizon 2020 McQuillan, A., Mazeh, T., & Aigrain, S. 2014, ApJS, 211, 24
research and innovation program (agreement No. 682393, AWESoMeStars). Metcalfe, T. S. & Egeland, R. 2019, ApJ, 871, 39
AS’s work is supported by the STFC grant no. ST/R000824/1. This research Mohanty, S., Basri, G., Shu, F., Allard, F., & Chabrier, G. 2002, ApJ, 571, 469
made use of observations obtained with XMM-Newton, an ESA science mission Newton, E. R., Irwin, J., Charbonneau, D., et al. 2017, ApJ, 834, 85
with instruments and contributions directly funded by ESA Member States Núñez, A., Agüeros, M. A., Covey, K. R., et al. 2015, ApJ, 809, 161
and NASA. The scientific results reported in this article are also based on Núñez, A., Agüeros, M. A., Covey, K. R., & López-Morales, M. 2017, ApJ, 834,
observations made by the Chandra X-ray Observatory. We would especially 176
like to thank A. Vanderburg for his public release of the analysed K2 light Pallavicini, R., Golub, L., Rosner, R., et al. 1981, ApJ, 248, 279
curves. Funding for the K2 mission is provided by the NASA Science Mission Parker, E. N. 1955, ApJ, 122, 293
directorate. We also thank the anonymous referee for useful suggestions. Pizzolato, N., Maggio, A., Micela, G., Sciortino, S., & Ventura, P. 2003, A&A,
397, 147
Preibisch, T. & Feigelson, E. D. 2005, ApJS, 160, 390
Raetz, S., Stelzer, B., Damasso, M., & Scholz, A. 2020, arXiv e-prints,
arXiv:2003.11937
Reiners, A., Schüssler, M., & Passegger, V. M. 2014, ApJ, 794
Rosen, S. 2016, VizieR Online Data Catalog, IX/47
Stelzer & Neuhäuser. 2001, A&A, 377, 538
Stelzer, B., Damasso, M., Scholz, A., & Matt, S. P. 2016, MNRAS, 463, 1844
Stelzer, B., Marino, A., Micela, G., López-Santiago, J., & Liefke, C. 2013, MN-
RAS, 431, 2063
Vanderburg, A. & Johnson, J. A. 2014, PASP, 126, 948
Veyette, M. J. & Muirhead, P. S. 2018, ApJ, 863, 166
Voges, W., Aschenbach, B., Boller, T., et al. 1999, A&A, 349, 389
Voges, W., Aschenbach, B., Boller, T., et al. 2000, IAU Circ., 7432, 3
Wright, N. J. & Drake, J. J. 2016, Nature, 535, 526
Wright, N. J., Drake, J. J., Mamajek, E. E., & Henry, G. W. 2011, ApJ, 743
Wright, N. J., Newton, E. R., Williams, P. K., Drake, J. J., & Yadav, R. K. 2018,
MNRAS, 479, 2351
Zechmeister, M. & Kürster, M. 2009, A&A, 496, 577
Article number, page 13 of 15You can also read