Flexible Use of Urban Resources by the Yellow Mongoose Cynictis penicillata - MDPI
←
→
Page content transcription
If your browser does not render page correctly, please read the page content below
animals
Article
Flexible Use of Urban Resources by the Yellow
Mongoose Cynictis penicillata
Nadine Elizabeth Cronk *             and Neville Pillay
 School of Animal, Plant and Environmental Sciences, University of the Witwatersrand, Johannesburg,
 Private Bag 3, WITS 2050, South Africa
 * Correspondence: nadinecronk@gmail.com

 Received: 20 June 2019; Accepted: 12 July 2019; Published: 16 July 2019

 Simple Summary: Many species have become locally extinct because of urbanization.
 However, many thrive in urban areas because they originally have, or they have acquired, features that
 enable them to exploit urban areas. We studied the ecology of the urban yellow mongoose, a recent urban
 dweller in parts of South Africa. We investigated the diet, space use and activity habits of yellow mongooses,
 and whether they exploit residential gardens. Similar to their non-urban counterparts, yellow mongooses
 in urban areas fed on insects, particularly in spring/summer. The presence of human food items, small
 mammals and birds in scats increased during autumn/winter, when insects are known to be less abundant.
 Camera trap footage revealed that, similar to their non-urban counterparts, yellow mongooses in urban
 areas were more prevalent in open habitats, and showed an early morning, late afternoon diurnal activity
 pattern. These urban mongooses were more frequently near human residences than at sites further away.
 Their home range size was considerably smaller than that of non-urban mongooses and overlapped more
 with human residents during autumn/winter than during spring/summer. Overall, the urban yellow
 mongooses displayed characteristics similar to non-urban mongooses, particularly in their diet, habitat use
 and activity patterns. Yet, they modified their diet by including human food, occurred in gardens, and had
 smaller home ranges, indicating modifications for urban life.

 Abstract: Several species are negatively impacted by urbanization, while others thrive in urban areas
 by exploiting anthropogenic habitats matching their pre-existing niche preferences, or by modifying
 their behavior for urban life. We studied the ecology of a recent urban resident, the yellow mongoose,
 in an urban ecological estate in South Africa. We assessed urban dwelling yellow mongooses’ diet,
 spatial and temporal occurrence, home range size, and whenever possible, compared our findings
 to the published literature on their non-urban conspecifics. Additionally, we evaluated occurrence
 overlap with residential gardens. Similar to their non-urban counterparts, scat analyses revealed
 that yellow mongooses in urban areas fed mainly on insects, particularly during spring/summer.
 In the colder months, anthropogenic items, small mammals and birds in scats increased. Camera
 trap surveys showed that the mongooses were common in open habitats, similar to previous studies,
 and exhibited a species-typical bimodal diurnal activity pattern. The occurrence of these mongooses
 was greater near human residences than at sites further away. Home range sizes were considerably
 smaller than those of non-urban mongoose. Mongoose occurred in residential gardens, more so
 during the colder months. The urban yellow mongooses’ diet, habitat preference and activity patterns
 were similar to non-urban conspecifics. Nonetheless, the exploitation of anthropogenic food sources,
 occurrence in residential gardens and smaller home range sizes showed that they respond flexibly to
 urbanization, and these modifications might aid in their success in urban areas.

 Keywords: anthropogenic food sources; diet; habitat; home range; urbanization; yellow mongoose

Animals 2019, 9, 447; doi:10.3390/ani9070447                                     www.mdpi.com/journal/animals
Animals 2019, 9, 447                                                                                 2 of 13

1. Introduction
     Habitat fragmentation and the loss of natural habitats is a leading cause of the decline in wildlife
populations worldwide [1,2]. Urbanization is a primary factor contributing to this fragmentation,
and severely altered environmental conditions are largely attributed to the increasing human population
and concurrent urban expansion [3,4]. However, urban areas, including large cities, provide an
overabundance of anthropogenic resources, as well as a concurrent reduction in natural predators [5,6],
potentially providing shelter for urban wildlife. As a result, several studies have shown how species
prosper in urban areas, particularly small to medium sized meso-carnivores [4,7–10]. These studies
have shown how different aspects of animal biology are modified, such as being flexible in diet,
activity and space use, aiding in the success of some wildlife in urban environments. Nevertheless,
few have considered a multi-variable assessment of an urban species’ biology.
     Urbanization affects carnivores in several ways. The diets of urbanized carnivores typically
include a combination of vertebrate and invertebrate prey, and often plant material, and they also
tend to exploit available anthropogenic resources [7,9,10]. For example, in the red fox Vulpes vulpes,
anthropogenic items dominate stomach contents, particularly in individuals sampled closer to city
centers [11]. Similarly, scats of martens Martes spp. in urban areas contain a high proportion of human
garbage, while martens in non-urban areas feed mainly on insects [8]. Habitat use of animals inhabiting
urban areas is concurrently also largely influenced by the abundance and availability of preferred food
resources [9,12]. An animal’s home range size is affected by population density, and larger home range
sizes are generally correlated with smaller population densities [3]. In urban areas, with the increased
resource availability and reduced predation, species are able to attain higher population densities [1,6];
numerous studies have shown that home range sizes of animals are greatly reduced in urban areas,
largely attributed to both the increase in population densities and greater resource availability [4,13,14].
Urbanization also impacts activity patterns, particularly in larger carnivores, as a mechanism of
temporal avoidance of conflict with humans [9]. For example, Beckman et al. [15] showed that black
bears Ursus americanus in urban areas were less active and changed to being nocturnal; both these
behaviors were attributed to available anthropogenic food sources and direct human disturbances.
Similarly, tigers Panthera tigris exhibited lower activity levels in areas where they overlapped spatially
with humans [16].
     Urban expansion is inexorable, and we can predict an ever-increasing number of wild animal
occurrences in urban areas worldwide. It is, therefore, crucial to understand the ecology of urban species,
particularly with the goal of introducing effective management plans should the need arise [4,13].
Our focus here is on the yellow mongoose Cynictis penicillata, a small carnivore widely distributed
in southern Africa, most commonly in open grassland habitats. Free-living yellow mongooses in
southern Africa have been extensively studied, including many aspects of their ecology. They are
diurnal and largely solitary foraging insectivores, but also commonly consume small mammal and
avian prey. The species lives in groups of 2–13 individuals, and has evolved cooperative breeding.
Mating begins in July, with a gestation period of approximately two months. Home range size is
estimated as a mean of 70 ha (male home ranges being typically larger than females), and is dependent
on population density of the study areas [17–21]. Reported sightings in close proximity to urban areas
date back to 1999 [22], and the yellow mongoose is now a common urban resident, but research into
the ecology of urban populations is a recent development [23,24].
     We investigated the diet, spatial occurrence, activity patterns, and home range of the yellow
mongooses in urban Johannesburg (South Africa), and compared these results to those of mongooses
in non-urban environments in the literature. The aims of our study were to (1) describe how yellow
mongooses exploit an urban environment; and (2) establish whether the yellow mongooses have a
different eco-type in urban than non-urban environments. Our multi-pronged approach allowed us
to consider whether one or several ecological characteristics were modified because of urbanization,
and whether certain characteristics were retained from a non-urban existence, potentially making
them pre-adapted to an urban setting. Overall, we expected that the yellow mongooses have modified
Animals 2019, 9, 447 3 of 13
their diet, space use and activity by incorporating available anthropogenic resources to exploit urban
areas. The yellow mongooses in non-urban areas show strong seasonality in their diet as a response to
food availability. We tested whether such seasonality is dampened in urban areas, where resources
(e.g., food, shelter) are more predictable and constant all year round. We also investigated whether this
seasonality is also dampened in space use and activity, factors that have not been studied in non-urban
yellow mongooses.
2. Materials and Methods
2.1. Study Site
This study took place from March 2015 to April 2018. Field work took place in an urban ecological
estate, Meyersdal, Johannesburg, South Africa (26◦ 170 10.4”S 28◦ 050 14.7”E). The climate in the area
is warm and temperate, with an average annual temperature of 16 ◦ C, and average precipitation of
723 mm. The warmest temperatures occur in December–February (average minimum of 14 ◦ C and
average maximum of 26 ◦ C) and the coldest in July (average minimum of 3 ◦ C and average maximum
of 19 ◦ C). The estate (480 ha) consists of residential development interspersed with natural areas
dominated by grassland vegetation, with dispersed areas of tree cover and undulating rocky hills [25].
Numerous outdoor trails for recreational use are located throughout the entire estate, and wildlife also
occur in close proximity to human residences and utilize gardens and corridors between residential
houses. Several small to large sized mammal game species occur here, as well as numerous smaller
mammals, such as rock hyraxes Procavia capensis, porcupines Hystrix africaeaustralis and spotted genets
Genetta genetta. Potential competitors of yellow mongooses include feral and domestic cats Felis catus,
slender mongooses Galerella sanguinea and black backed jackals Canis mesomelas, although yellow
mongooses are the most abundant carnivore (estimated at 30–40 individuals per 100 ha; pers. obs.).
Predators of the yellow mongooses are mostly jackals and a breeding pair of black eagles Ictinaetus
malaiensis. Yellow mongooses are also found in neighboring Johannesburg south twons, such as
Rosettenville and Alberton, which surround Meyersdal.
2.2. Diet
Yellow mongoose diet was assessed through scat sample analysis. Fresh scat samples were collected
from 10 sampling sites (Figure S1), once a month, from March 2015 to March 2016. Total sample size
was 1300 scats collected over the entire study period (13 collection periods). Yellow mongoose scats
were identified on the basis of their odor and appearance and were easily located at middens near
denning sites, characterized by underground dens in the open grassland or in rock crevices above- and
belowground. Scat samples were morphologically analyzed using the protocol described by Cronk
and Pillay [24]. The contents of scats were categorized into five types: plants, invertebrates (insects),
mammals, birds, and anthropogenic. Previous studies have reported that yellow mongooses feed on
amphibians and reptiles, but none were identified in scat samples in this study. To identify common
prey items, a sub-sample of 200 scat samples was further analyzed and remains of invertebrates,
mammalian and avian prey taxa were morphologically identified to appropriate taxonomic levels
(order and family) using reference catalogues, and the assistance of relevant specialists at the University
of the Witwatersrand.
The prevalence and relative importance of food categories in the diet were quantified by using
two index methods: (1) frequency of occurrence (F.O.), calculated by dividing the total frequency of a
food category by the total number of scats analyzed, and expressed as a percentage; and (2) percent
occurrence (P.O.), calculated by dividing the occurrence of a food category by the total number of
occurrences of all food categories, and expressed as a percentage [26]. F.O. and P.O. were used since
both use the presence, rather than the volume, of diet items to compare items of varying levels of
digestibility (e.g., bones versus soft human food; [9]). Moreover, these two methods have been used in
previous studies, allowing for inter-study comparisons [24]. Plants present in scats were dominated byAnimals 2019, 9, 447 4 of 13
grasses and leaves. These items do not form part of the yellow mongooses’ diet, and their presence in
the scat was attributed to indirect ingestion when consuming other food [17]. Therefore, plants were
excluded from the calculation of percent occurrence to avoid overrepresentation of their importance in
the yellow mongoose’s diet.
2.3. Spatial Occurrence and Activity Patterns
We used camera trap surveillance to assess the spatial and temporal occurrence of yellow
mongooses throughout the estate. Three motion triggered Bushnell Essential® camera traps were
used over the sampling period of May 2015 to March 2016. These were attached to rigid surfaces
(rocks/trees/poles) and angled to maximize field of view of wildlife trails. Camera traps were active
24 h a day, and remained at a site for a 2-week period before being moved to a new site approximately
200 m away; no bait was used and camera traps were not placed at known mongoose dens. Camera
traps were never placed in the same area in a season but were sometimes placed in close proximity
to previous sites in different seasons. Cameras were checked once a week to change batteries and
memory cards.
A total of 66 sites were sampled throughout the study period (Figure S1). At each site, we recorded
the GPS coordinates, the relative distance to human residences (in meters), and the vegetation cover
(open: areas dominated by open fields of grasses; or closed: areas dominated by tree cover or dense
bushes); these variables aided in identifying relative use of residential areas (as a proxy for access to and
potential use of anthropogenic resources) as well as micro-habitat type use. From photographs obtained
where a yellow mongoose was present, we recorded the date and time of occurrence; consecutive
captures of yellow mongooses within a 10 min time frame were considered as a single occurrence
(i.e., the same individual; [27]). Time stamp data were used to generate the yellow mongooses’
activity patterns.
2.4. Home Range and Residential Overlap
Trapping, collaring, and tracking of two male and two female mongooses took place from March
2016 to May 2017. We used single door humane animal traps (80 × 29 × 33 cm galvanized wire mesh)
placed at four different sites in different regions of the estate (at least 1 km apart), in an attempt to avoid
capturing individuals that were likely to congregate in social groups (resulting in spatial correlation
between individual mongooses). Traps were camouflaged, baited with off-cut deli meats, and set
out in the early morning before mongoose activity was expected to start. Traps were checked every
hour to reduce the stress caused by captivity. Trapped yellow mongoose were immobilized using
a 0.06 mL/kg Medatomidine and 6 mg/kg Ketamine, which was administered intramuscularly by a
registered veterinarian. We recorded standard weights and body measurements before fitting a GPS
collar. Collars were manufactured by Africa Wildlife Tracking (HAWK-UHF device, AWT CC, Pretoria,
South Africa), weighed between 65 and 85 g, and were designed with an easy release point that required
minimal stress to break when snagged (i.e., repetitive pulling by mongoose would break the collar).
To maximize battery life, collars were programmed to record GPS coordinates (hereafter referred to as
fixes) every 3 h during daylight hours (between 5 a.m. and 7 p.m.), to coincide with yellow mongoose
activity; the 3 h interval accounted for potential spatial auto-correlation between fixes. Once the collar
was fitted, the mongoose was returned to the trap, and an anesthetic reversal of 0.3 mg/kg Atipamezole
was administered. The veterinarian monitored when the mongoose was mobile again in order to assess
whether there was any discomfort or distress from the collar. The collared mongoose was subsequently
released at the site of capture.
To collect data from the collars, collared individuals were located by means of the triangulation
method, using a hand-held H antenna (AWT CC, 433 MHz), and a portable VHF receiver
(HAWK 433 MHz transceiver, AWT CC). Each collar had a reception range of ±1 km, and data
could be downloaded from within a ±50 m range of a collared mongoose. Tracking took place on foot.
All GPS locations were automatically stored on the collar which required a single download from theAnimals 2019, 9, 447 5 of 13
receiver every 2 weeks. The receiver was connected to a computer and GPS coordinates were then
downloaded for later analysis.
Home range size was defined by the area navigated by each collared mongoose while engaging
in different activities. Home range size was established using minimum convex polygon (MCP) and
kernel density estimates (KDE) methods for comparison with previous studies. Furthermore, GPS data
were plotted to establish occurrence of mongooses within residential gardens, as a proxy for potential
access to, and use of human provided food resources. We assessed the overlap with human residences,
defined as the percentage of GPS locations found within residential gardens [7].
2.5. Data Analyses
All data were recorded in, and graphs generated, using Microsoft Excel® (Microsoft Corporation,
2007). All statistical analyses were conducted using R Statistical Software (www.r-project.org, R version
3.4.3). For diet and spatial occurrence data analyses, sampling periods were divided into four
seasons according to South Africa’s weather patterns: Colder seasons—autumn (March–May)
and winter (June–August); and warmer seasons—spring (September–November) and summer
(December–February).
2.5.1. Diet
A generalized linear model (coded glm), with a Poisson distribution and log link function,
was used to identify the significant predictors of percent occurrence (dependent variable). The model
comprised of single and first order interaction effects between food category and season as fixed
effects. We used the lsmeans function in R to perform post-hoc tests to interpret significant outcomes.
Additionally, we illustrated seasonal variation graphically by comparing percent occurrence of each
food category per month.
2.5.2. Spatial Occurrence and Activity Patterns
We recorded the total number of occurrences of yellow mongoose at each site. Using a generalized
linear model (coded glm), we analyzed whether the fixed effects—(1) distance relative to
residences (in meters; as a continuous predictor), (2) cover (open/closed) and (3) season
(autumn/winter/spring/summer)—had a significant effect on the number of photographs captured
of yellow mongoose (dependent variable). We used the lsmeans function in R to perform Tukey
post-hoc tests to interpret significant fixed effects. Furthermore, activity profiles comparing the colder
(autumn and winter) and warmer (spring and summer) seasons were generated using time stamp data
from all photographs obtained. To visualize the data graphically, we used the R package ‘overlap’ and
the function ‘overlapEst’ (type = Dhat4, smoothing constant adjust = 1) to obtain pair-wise temporal
overlap coefficients (∆; [28,29]), in order to identify seasonal variation in activity patterns. Temporal
overlap of activity patterns between cold and warm seasons was estimated using kernel density
estimation in R following the methods proposed by Ridout and Linkie [29] (where c = 1). The overlap
coefficient generated (∆) ranges from 0, indicating no overlap, to 1, indicating complete overlap [30].
2.5.3. Home Range and Residential Overlap
All GPS fixes (location error estimate of 2–3 m) were downloaded from the receiver and recorded
on a spreadsheet. We established the home range size for each mongoose by calculating 50%, 95% and
100% isopleths, according to MCP and KDE (h = href) methods in R using the package adehabitatHR [31].
For the 100% KDE, the model did not converge and, subsequently, unrealistically large home range
sizes were generated; these were not included in analyses (see [32]). A minimum of 50 GPS fixes
are required to estimate the home range size of yellow mongooses [20]. However, Balmforth [32]
reported that home range sizes stabilise within the range of 100–250 GPS fixes, which was achieved
for each mongoose in this study for the estimation of overall home range size. Because of the
small number of mongooses collared, we qualitatively compared home range sizes between femaleAnimals 2019, 9, 447 6 of 13
and male mongooses. We descriptively compared home range sizes by season sampled for each
mongoose separately by grouping the months sampled for each individual into seasons. In addition,
overlap with human residences (as a percentage of GPS locations found within residential gardens) was
compared between seasons to establish variation in use of residential gardens per individual mongoose.
Kernel density estimate home range images (showing utilization distribution of the 50% and 90%
isopleths) were generated using R, and graphically represented using Quantum GIS (QGIS 3.2 Bonn;
http://www.qgis.org).
3. Results
3.1. Diet
An analysis of the 1300 scat samples indicated a variety of food items present in the yellow
mongoose diet (Table 1). Invertebrates ranked first as the most frequently occurring components in
the scat, followed by anthropogenic items, mammals and then birds, according to two methods of
analysis (Table 1). Plant material (mostly grass) was present in a large proportion of scat samples,
but we attributed this to indirect ingestion. The sub-sample analysis to identify components of each
prey food category identified Isoptera (termites; 70.1%) and Orthoptera (grasshoppers and crickets;
53.5%), Rodentia (mice and rats, such as Rhabdomys spp. and Otomys irroratus; 82.5%) and Columbidae
(doves and pigeons; 85.7%) as the main insect, mammal and bird taxa present in scats, respectively
(Table S1). Anthropogenic items included garbage (foil, hard and soft plastics) and chicken eggs shells.
Results of the generalized linear model indicated that percent occurrence was significantly affected
by food category (χ2 3 = 328.54, p < 0.001) and the food category × season interaction (χ2 9 = 25.76,
p = 0.002); season alone was not a significant predictor of percent occurrence (χ2 3 = 0.23, p = 0.972).
Table 1. Number of occurrences (n), frequency of occurrence (F.O.), percent occurrence (P.O.) and rank
for each food category present in yellow mongoose scat (n = 1300); rank 1 being the highest ranking
and 5 being the lowest.
Food Category n F.O. Rank P.O. Rank
Invertebrates 943 72.54 1 65.62 1
Anthropogenic 260 20.00 3 18.09 2
Mammals 186 14.31 4 12.94 3
Birds 48 3.69 5 3.34 4
Plant material 731 56.23 2 * *
* = percent occurrence for plant material was excluded to prevent overrepresentation of its importance in
mongoose diet.
During autumn, invertebrate presence in scat gradually decreased while bird, mammal and
anthropogenic item presence increased (Figure 1). During winter, bird and anthropogenic item
occurrence in scat increased, while invertebrate and mammals prey occurrence decreased. During spring
and summer, when temperatures increased, the occurrence of birds, mammals and anthropogenic
items in scats gradually decreased while invertebrate occurrence increased considerably (Figure 1).
The greatest seasonal variation was apparent in the occurrence of anthropogenic items and invertebrates
in the scat: During winter, the occurrence of insect material in scats greatly decreased, while concurrent
use of anthropogenic items increased during this period, whereas during summer, insect presence in
scats was at its greatest and anthropogenic item occurrence was lower than during winter (Table S2).Animals 2019, 9, 447 7 of 13
Animals 2019, 9, x 7 of 13
100 Insects Mammals Birds Anthropogenic
Occurrence (%) 80 Autumn Winter Spring Summer
60
40
20
0
Mar May Jul Sep Nov Jan Mar
Month (March 2015 - March 2016)
Monthly
Figure 1.Figure percent occurrence
1. Monthly (%) expressing
percent occurrence seasonal variation
(%) expressing seasonalin variation
occurrenceinofoccurrence
different food
of different
categories in yellow
food mongoose
categories scatmongoose
in yellow in the Meyersdal estate.
scat in the Meyersdal estate.
3.2. Spatial Occurrence and Activity Patterns
3.2. Spatial Occurrence and Activity Patterns
A total of 1289 independent photographs of yellow mongoose were captured by the camera traps
A total of 1289 independent photographs of yellow mongoose were captured by the camera traps
(Table 2). The mean number of photographs (±SE) captured per site was 20 ± 3, and the mean distance
(Table 2). The mean number of photographs (±SE) captured per site was 20 ± 3, and the mean distance
from human residences for the camera trap sites was 357.57 m ± 38.4 m, with the closest site at 11.08 m
from human residences for the camera trap sites was 357.57 m ± 38.4 m, with the closest site at 11.08
and the furthest site at 1073.63 m (Table S3). Results of the statistical analyses indicated that distance
m and the furthest site at 1073.63 m (Table S3). Results of the statistical analyses indicated that
from human residences (χ2 1 = 35.17, p < 20.001) and cover (χ2 1 = 15.12, 2p < 0.001) were significant
distance from human residences (χ 1 = 35.17, p < 0.001) and cover (χ 1 = 15.12, p < 0.001) were significant
predictors of the number of photographs captured; season was not a significant predictor (χ2 3 = 1.91,2
predictors of the number of photographs captured; season was not a significant predictor (χ 3 = 1.91,
p = 0.594). The overall model fit was F(1,64) = 22.87, p < 0.001, with an R2 of 0.542 (adjusted R2 = 0.50).
p = 0.594). The overall model fit was F(1,64) = 22.87, p < 0.001, with an R of 0.54 (adjusted R2 = 0.50).
Post-hoc tests revealed that more photographs of yellow mongoose were captured at distances closer
Post-hoc tests revealed that more photographs of yellow mongoose were captured at distances closer
to human residences (p < 0.001), and yellow mongoose occurred significantly more at sites where the
to human residences (p < 0.001), and yellow mongoose occurred significantly more at sites where the
vegetation cover was classified as open vegetation than at sites classified as closed vegetation cover
vegetation cover was classified as open vegetation than at sites classified as closed vegetation cover
(p < 0.001; Figure S2).
(p < 0.001; Figure S2).
Table 2. Number of independent photographs of yellow mongooses in open and closed cover categories
Table 2. Number of independent photographs of yellow mongooses in open and closed cover
(n = number of sites for each cover category) during different seasons in the Meyersdal estate.
categories (n = number of sites for each cover category) during different seasons in the Meyersdal
estate. Category of Cover
Season Total
Open (n = 32) Closed (nof
Category = 34)
Cover
Autumn
Season
205 (5)Open (n = 32) 8 (4) Closed (n = 34)
213
Total
Winter 248 (8) 105 (10) 353
Autumn 205 (5) 8 (4)
213
Spring 279 (9) 77 (12) 356
Summer Winter 297 (10) 248 (8) 70 (8) 105 (10) 367
353
Total Spring 1029 279 (9) 260 77 (12) 1289
356
Summer 297 (10) 70 (8) 367
Total 1029 260 1289
Temporal data collected from camera traps revealed that yellow mongooses were primarily
diurnal, with a mean start and end active time of 06:29 ± 00:28 and 18:19 ± 00:37 (±SE). Mongooses
Temporal data collected from camera traps revealed that yellow mongooses were primarily
also exhibited bimodal peaks in activity, first between 10:00 and 11:00 and second between 16:00 and
diurnal, with a mean start and end active time of 06:29 ± 00:28 and 18:19 ± 00:37 (±SE). Mongooses
17:00 (Figure 2). We compared the activity patterns between colder and warmer seasons (Figure 2)
also exhibited bimodal peaks in activity, first between 10:00 and 11:00 and second between 16:00 and
and found a high overlap coefficient (∆ = 0.859). The activity patterns were largely similar between
17:00 (Figure 2). We compared the activity patterns between colder and warmer seasons (Figure 2)
the two periods, and mongooses maintained similar bimodal peaks in activity with slight variation
and found a high overlap coefficient (Δ = 0.859). The activity patterns were largely similar between
in the start, end and peak activity times. During the warmer seasons (characterized by an earlier
the two periods, and mongooses maintained similar bimodal peaks in activity with slight variation
in the start, end and peak activity times. During the warmer seasons (characterized by an earlierAnimals 2019, 9, 447 8 of 13
Animals 2019, 9, x 8 of 13
sunrise and later sunset), mongooses were active from earlier in the morning (as early as 06:28 a.m. as
sunrise and later sunset), mongooses were active from earlier in the morning (as early as 06:28 a.m.
opposed to 07:40 a.m. during the colder seasons), and there was a decrease in activity during midday
as opposed to 07:40 a.m. during the colder seasons), and there was a decrease in activity during
(when temperatures reached their maximum) and an increase in activity in the later afternoon/early
midday (when temperatures reached their maximum) and an increase in activity in the later
evening (when temperatures are cooler). During the colder seasons (later sunrise and earlier sunset),
afternoon/early evening (when temperatures are cooler). During the colder seasons (later sunrise and
activity was greater during midday and lower later in the afternoon.
earlier sunset), activity was greater during midday and lower later in the afternoon.
Colder
0.20 Warme
Δ = 0.859
0.15
Density
0.10
0.05
0.00
0:00 6:00 12:00 18:00 24:00
Time
FigureFigure
2. The2.activity
The activity patterns
patterns of yellow
of yellow mongooses
mongooses duringduring the colder
the colder seasons
seasons (autumn
(autumn and winter;
and winter;
solid solid line)warmer
line) and and warmer seasons
seasons (spring
(spring and summer;
and summer; dotted dotted line)
line) in theinMeyersdal
the Meyersdal
estate.estate. The overlap
The overlap
coefficient
coefficient between
between the periods
the periods (Δ) equals
(∆) equals the area
the area below below
both both
curvescurves shaded
shaded grey grey
in thisin figure,
this figure,
expressing seasonal overlap and variation in activity
expressing seasonal overlap and variation in activity patterns. patterns.
3.3. Home Range
3.3. Home and Residential
Range Overlap
and Residential Overlap
MeanMean
(±SE)(±SE)
tracking duration
tracking of the
duration offour collared
the four mongooses
collared mongooseswas 134
was(13.31) daysdays
134 (13.31) and the
andmean
the mean
number of GPS fixes recorded was 385 (47.41; Table 3). The mean (±SE) home range size
number of GPS fixes recorded was 385 (47.41; Table 3). The mean (±SE) home range size of the males of the males
was was
14.6114.61
ha (±4.48)
ha (±4.48)andand
13.37 ha (±4.61)
13.37 andand
ha (±4.61) of females
of femaleswaswas7.16 haha
7.16 (±0.26)
(±0.26)and
and6.50
6.50haha(±0.27),
(±0.27), for
for MCP 95% and KDE 95%, respectively. Male home range sizes were generally larger
MCP 95% and KDE 95%, respectively. Male home range sizes were generally larger than female home than female
homerange
rangesizes
sizesaccording
according to
to both
both estimates
estimatesatatallallisopleth
isoplethlevels (Table
levels S4).S4).
(Table Mapping
Mappingof home ranges
of home ranges
indicated there was no overlap between these collared individuals (Figure
indicated there was no overlap between these collared individuals (Figure 3). 3).
Table 3. Home range sizes from MCP and KDE estimates of individual male (m) and female (f) yellow
Table 3. Home range sizes from MCP and KDE estimates of individual male (m) and female (f) yellow
mongoose (mass in grams), and tracking duration, in days, in the Meyersdal estate.
mongoose (mass in grams), and tracking duration, in days, in the Meyersdal estate.
Tracking Home Range Size (ha)
Home Range Size (ha)
Mongoose Capture
Mongoose
Identity
Duration Tracking Duration
MCP KDE KDE
DateCapture Date MCP
Identity (no. Fixes) (no. Fixes)
50% 95% 50% 100%95% 100%
50% 50%95% 95%
m1 (750)20-Mar-16
m1 (750) 20-Mar-16
110 (299) 110
2.77(299) 10.13 2.77 16.17
10.13 16.17
2.32 2.32
8.76 8.76
f1 (892)
f1 (892)20-Mar-16 113 (309)
20-Mar-16 1.63(309)
113 7.42 1.63 8.937.42 1.43
8.93 6.76
1.43 6.76
m2 (768) 152 (445)
m2 (768)4-Sept-164-Sept-16 5.99(445)
152 19.09 5.99 26.09
19.09 4.76
26.09 17.98
4.76 17.98
f2 (686) 20-Nov-16 162 (486) 1.81 6.9 8.57 1.69 6.23
f2 (686) 20-Nov-16 162 (486) 1.81 6.9 8.57 1.69 6.23The seasonal home range sizes showed similar patterns for both estimates; the smallest home
range sizes occurred in spring, and the largest during autumn for the two females, and the smallest
during winter and the largest during summer for the males (Table S5). Statistical analysis of seasonal
home range size could not be done due to the limitation in data collected for each individual (home
range
Animals size
2019, of each mongoose was not sampled in all seasons), and must be considered with some
9, 447 9 of 13
circumspection.
f1
m2
f2
m1
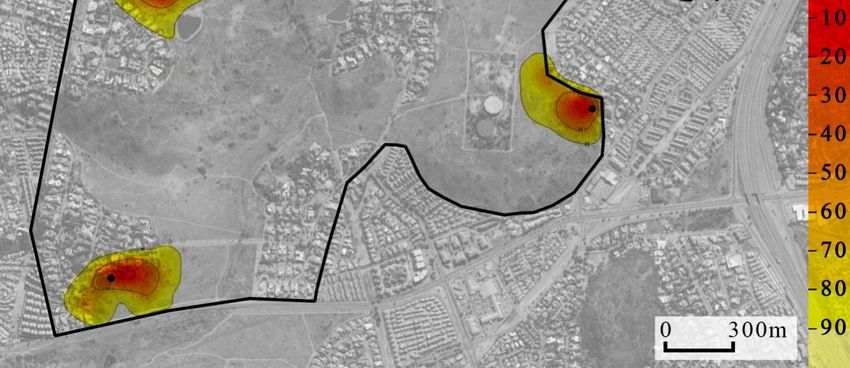
Figure 3. Location
Location utilization
utilization density
density (by
(by the kernel method) of four yellow mongooses overlaid on
an aerial photograph of the Meyersdal estate. More
More red
red shows
shows core
core use
use areas,
areas, while
while the
the more yellow
shows wider area of use and extends to the 95% home range use; black dots indicate
indicate den
den location.
location.
Thethe
For seasonal home
overlap withrange
humansizes showed similar
residences, patterns
percentage GPSforoverlap
both estimates; the smallest home
was proportionately range
similar for
sizes
all occurred in
mongooses; spring,was
overlap andlowest
the largest
at theduring autumn and
50% isopleth for the two females,
greatest and the
at the 100% smallest
isopleth during
(Figure 4).
winter
The twoand the had
males largest during
greater summer
overlap withfor the males
human (Table S5).
residences, whichStatistical
could beanalysis of seasonal
attributed home
to their larger
range size
home could
range not As
sizes. be done due to theof
a percentage limitation in data collected
GPS locations recordedfor each
for individual
each (home
individual, therange size
average
of each mongoose
percentage overlapwaswithnot sampled in
residential all seasons),
gardens at eachand must level
isopleth be considered
was 3.31% with some
(50%), circumspection.
15.49% (95%) and
18.53For the overlap
(100%). For twowithindividuals,
human residences, percentage
home range GPSwith
overlap overlap was proportionately
residential gardens appearedsimilar for all
to be
mongooses;
greater duringoverlap
winterwas lowest
than duringat the 50% isopleth
autumn, and forand
onegreatest at the
individual the100% isopleth
overlap was(Figure
greater4). The two
in autumn
malesinhad
than greater
spring overlap with
and summer (Tablehuman
S6). residences, which could be attributed to their larger home
range sizes. As a percentage of GPS locations recorded for each individual, the average percentage
overlap with residential gardens at each isopleth level was 3.31% (50%), 15.49% (95%) and 18.53 (100%).
For two individuals, home range overlap with residential gardens appeared to be greater during winter
than during autumn, and for one individual the overlap was greater in autumn than in spring and
summer (Table S6).Animals 9, 447
2019,2019,
Animals 9, x 10 of
10 13
of 13
40 50% 95% 100%
Percentage overlap (%)
30
20
10
0
m1 f1 m2 f2
Mongoose ID
Figure 4. Percentage GPS location overlap with human residential gardens of two male (m1, m2) and
Figure 4. Percentage GPS location overlap with human residential gardens of two male (m1, m2) and
two female (f1, f2) yellow mongooses for different home range isopleth levels in the Meyersdal estate.
two female (f1, f2) yellow mongooses for different home range isopleth levels in the Meyersdal estate.
4. Discussion
4. Discussion
We We investigated
investigated the ecology
the ecology of urban-living
of urban-living yellow mongooses.
yellow mongooses. We analyzedWe analyzed
the main the main
components
components
of their of their diet, type
diet, micro-habitat micro-habitat
use, activitytypepatterns,
use, activityhome patterns,
range home size and range size and
overlap with overlap
human with
human residences, as well as compared how some of these
residences, as well as compared how some of these variables varied seasonally. No such studies havevariables varied seasonally. No such
studies have
previously been previously
conducted on been conducted
other mongoose on other
species mongoose
in an urban species in an urban setting.
setting.
Scat analysis of these urban yellow mongooses showed diets similarto
Scat analysis of these urban yellow mongooses showed diets similar toprevious
previousstudiesstudies onon non-
urban yellow mongooses, with insect (being the most prevalent),
non-urban yellow mongooses, with insect (being the most prevalent), mammal, and bird prey mammal, and bird prey present
[17]. [17].
present In theInurban
the urban yellow mongoose
yellow mongoose scat,scat,
anthropogenic
anthropogenic items items occurred
occurred moremore than thanother
other food
categories after insects. As reported previously in studies of
food categories after insects. As reported previously in studies of non-urban yellow mongoose non-urban yellow mongoose (e.g., [18]),
their
(e.g., diet
[18]), also
their varied
diet seasonally,
also varied particularly
seasonally, for the
particularly for invertebrates
the invertebrates andand anthropogenic
anthropogenic item
item food
foodcategories,
categories,where whereinsect
insectpresence
presence was greater in
was greater insummer
summerthan thanininwinterwinter and and anthropogenic
anthropogenic items
items
presence was greater in winter than in summer. We observed
presence was greater in winter than in summer. We observed that, as temperatures decreased, mammal that, as temperatures decreased,
andmammal and avian in
avian occurrences occurrences
scat increased in scat increased
while insects while insects
decreased, anddecreased,
anthropogenicand anthropogenic
items increased items
increased more than mammals and birds during this period.
more than mammals and birds during this period. These results emphasize the importance of humanThese results emphasize the importance
of human
foods in yellow foods in yellow
mongoose diet mongoose
in the studydiet in particularly
area, the study area, during particularly
less favorableduring coldless favorable
periods, whencold
theperiods,
availability when the availability
of their main food (i.e., of their main
insects) is food
reduced(i.e.,[18].
insects) is reducedin[18].
Unfortunately, Unfortunately,
dietary analysis of in
urban animals, only indigestible items are identified, and any other items that are easilyitems
dietary analysis of urban animals, only indigestible items are identified, and any other that are
digested
easily digested (e.g., bread) are not normally accounted for [33].
(e.g., bread) are not normally accounted for [33]. Since we were able to identify only human garbage inSince we were able to identify only
human
scat, garbage
we propose theinusescat,of we propose
human foodthe may usebeofunderrepresented
human food mayinbeour underrepresented
study. in our study.
In the urban estate, yellow mongooses occurred more often
In the urban estate, yellow mongooses occurred more often at sites with open vegetation cover, at sites with open vegetation cover,
similar
similar to their
to their non-urban
non-urban counterparts
counterparts [21]; we[21];
did not wefind
didanynotseasonal
find any seasonal
influences oninfluences on spatial
spatial occurrence.
Habitat selection and use by carnivores is largely influenced by the abundance and availability of foodand
occurrence. Habitat selection and use by carnivores is largely influenced by the abundance
availability
resources [12]. Forof yellow
food resources
mongooses,[12]. openFor yellow
habitat mongooses,
represents favorable open habitatforrepresents
conditions favorable
obtaining insects,
conditions
its main for obtaining
prey, which are most insects,
abundant itsinmain
openprey, which
grassland are[18,19].
areas most abundant in open open
Animals utilizing grassland areas
habitats
should be better able to detect potential risk, and therefore in urban areas (typically considered to have in
[18,19]. Animals utilizing open habitats should be better able to detect potential risk, and therefore
urbanvegetation
reduced areas (typically
cover),considered
these species to have
may reduced
have a highervegetation
tolerancecover),for these
human species may have
disturbance andamayhigher
tolerance
habituate for human
to humans disturbance
[34], which may and may
also behabituate
the case here.to humans [34], which
In particular, yellowmaymongooses
also be the case in ourhere.
In particular, yellow mongooses in our study area tolerate humans
study area tolerate humans [23]. The number of photographs captured of yellow mongooses was far [23]. The number of photographs
captured
greater at sitesof located
yellow mongooses
closer to human was far greater atinsites
residences the located closer to human
estate. Similarly, residences
stone martens have in greater
the estate.
Similarly, stone martens have greater occurrence closer to urban
occurrence closer to urban centers (i.e., a greater human presence) and also have a greater occurrence centers (i.e., a greater human
of
presence) and also have a greater occurrence of anthropogenic items
anthropogenic items in their diets [7,8]. Therefore, we suggest that meso-carnivores that occur near to in their diets [7,8]. Therefore,
andwe suggest
tolerate humanthat residences
meso-carnivores that occur
have access near to andfood
to anthropogenic tolerate
items. human residences have access to
anthropogenic food items.
Urban carnivores, typically medium–large carnivores, show shifts in activity patterns, which is
Urban carnivores,
largely attributed to temporal typically
avoidancemedium–large
of humans carnivores, show shifts
[1,9,15]. In contrast, the in activity
yellow patterns,in
mongooses which
our is
largely attributed to temporal avoidance of humans [1,9,15]. In contrast, the yellow mongooses in ourAnimals 2019, 9, 447 11 of 13
study maintained the same diurnal activity patterns, including seasonal variation in active periods,
to those of their non-urban counterparts [21,35]. We suggest three reasons for this similarity. (1) The
yellow mongooses’ tolerance for humans (without any negative consequences) might encourage their
use of human residential spaces in daylight. (2) It is possible that the activity of the mongooses’ primary
prey, invertebrates, shape their activity profile. (3). It is also likely that the smaller carnivores in urban
areas are not persecuted or are more cryptic and hence retain their diurnal behavior whereas larger
carnivores, which can pose a threat to humans, change their activity pattern to avoid persecution.
We investigated the home ranges of radio-collared individuals using two methods of analysis:
MCP and KDE. In comparison to previous studies (focusing specifically on previously reported MCP
95%, 100% and KDE 95%), these analyses showed that the home range sizes of yellow mongooses in
urban areas (average of 11.92 ha) was greatly reduced compared to their non-urban counterparts from
studies using similar methods (average home range size of 38.41 ha; [21,32,35,36]). Numerous studies
have reported reduced home range sizes of carnivores in urban areas, attributed to the increase in
both population density and resource availability (e.g., [4,13,14]). The population density of yellow
mongooses in the estate (30–40/100 ha) was greater than those reported in the non-urban populations in
previous studies (for example, 6–7/100 ha reported by [35]; and 4–14/100 ha reported by [21,36]). We do
not know whether the reduced home range sizes of yellow mongooses in our study (approximately 69%
reduction in home range size) was the result of increased population density and/or increased resource
availability, and requires further study. Similar to these previous studies, home range sizes of the two
males were larger than those of the two females. Overall, home range sizes were smaller during the
breeding period (winter and spring) than in the non-breeding period (summer and autumn; [21,32]).
Seasonal variation in overall home range size of non-urban yellow mongooses has not been described,
and was therefore not considered in this study.
The home ranges of the yellow mongooses overlapped with residential gardens. Their occurrence
in residential gardens is likely due to habituation people and also the ease of access to anthropogenic
resources (such as bird feeders, garbage bins and pet food; [1]). While not statistically assessed,
the overlap with residential gardens was greatest during colder seasons. This would be expected,
since urban animals are reported to supplement their diet in winter with anthropogenically provided
foods [1], which are more likely to be found within residential gardens.
5. Conclusions
Yellow mongooses are recent inhabitants of urban areas in South Africa due to rapid urbanization
in the country. We used a multi-pronged approach to provide a comprehensive assessment of
the mechanisms the species uses to exploit urban areas. The yellow mongooses demonstrated
largely similar characteristics of diet, habitat use and activity patterns to that of their non-urban
counterparts. Yet, they clearly exploited anthropogenic resources, which likely represents habituation
and acclimatization to urban areas, and showed tolerance of human residents, use of residential
gardens, and overall smaller home range sizes, which generally suggests behavioral modifications.
Thus, it appears that they have capitalized on their pre-existing adaptations to exploit urban areas and
have responded flexibly to urbanization, providing evidence of behavioral adaptation to an urban
environment. We do not know whether the changes between urban and non-urban mongoose are due
to isolation and genetic change, or simply because of habituation to people. The results of this study
warrant further investigation of yellow mongooses in other urban areas, including an assessment of
other environmental parameters (e.g., resource availability and distribution) for a better understanding
of the habits of this urban meso-carnivore.
Supplementary Materials: The following are available online at http://www.mdpi.com/2076-2615/9/7/447/s1,
Figure S1: Aerial map of the Meyersdal estate showing the 10 scat sample collection sites (triangles) and the 66
camera trap sites (diamonds); human residences within the estate are highlighted in yellow, Figure S2: The number
of photographs of yellow mongooses captured on camera traps at different distances from human residences in
open or closed vegetation cover in the Meyersdal estate, Table S1: Frequency of occurrence of various animalAnimals 2019, 9, 447 12 of 13
remains, identified to appropriate taxonomic levels (order and family), present in a subsample of scats (n = 200) of
yellow mongooses in the Meyersdal estate, Table S2: Outcomes of the pair-wise comparisons for the lsmeans
of the season and food categories (lsmeans post-hoc analysis output from R statistics), Table S3: Camera trap
site information for the 66 sites sampled within the Meyersdal estate, Table S4: Comparison of male and female
yellow mongoose home range sizes (mean ±SE; range), based on two estimates (MCP and KDE) for the 50%,
95% and 100% isopleth level in the Meyersdal estate. No estimates were possible for the KDE 100% isopleth,
Table S5: Seasonal home range sizes, based on two estimates (MCP and KDE), of female (f) and male (m) yellow
mongooses in the Meyersdal estate, Table S6: Seasonal percentage of total GPS locations (n = number of GPS
locations) overlapping with human residential gardens, of female (f) and male (m) yellow mongooses in the
Meyersdal estate.
Author Contributions: Conceptualization, N.E.C. and N.P.; Data curation, N.E.C.; Formal analysis, N.E.C. and
N.P.; Funding acquisition, N.P.; Investigation, N.E.C.; Methodology, N.E.C. and N.P.; Project administration,
N.E.C.; Visualization, N.E.C.; Writing—original draft, N.E.C.; Writing—review & editing, N.E.C. and N.P.
Funding: Funding was provided by the National Research Foundation (Funder Id: 10.13039/501100001321,
grant no.: 87769) South Africa and the University of the Witwatersrand.
Acknowledgments: We are grateful to the environmental management of the Meyersdal Eco-Estate,
Odette Campbell, for allowing us access to and use of the estate and study sites; James Harrison for assistance
with insect identification; and Jill Drake for her veterinary assistance with the collaring. All sample collection,
animal capture and handling procedures were approved by the Animal Ethics and Screening of the University of
the Witwatersrand (2015/06/22/A; 2015/08/37/B).
Conflicts of Interest: The authors declare that they have no conflict of interest.
References
1. Bateman, P.W.; Fleming, P.A. Big city life: Carnivores in urban environments. J. Zool. 2012, 287, 1–23.
[CrossRef]
2. Duduś, L.; Zalewski, A.; Kozioł, O.; Jakubiec, Z.; Król, N. Habitat selection by two predators in an urban
area: The stone marten and red fox in Wrocław (SW Poland). Mamm. Biol. 2014, 79, 71–76. [CrossRef]
3. Gould, N.P.; Andelt, W.F. Effect of anthropogenically developed areas on spatial distribution of island foxes.
J. Mammal. 2013, 94, 662–671. [CrossRef]
4. Šálek, M.; Drahníková, L.; Tkadlec, E. Changes in home range sizes and population densities of carnivore
species along the natural to urban habitat gradient. Mammal Rev. 2015, 45, 1–14. [CrossRef]
5. Newsome, S.D.; Garbe, H.M.; Wilson, E.C.; Gehrt, S.D. Individual variation in anthropogenic resource use in
an urban carnivore. Oecologia 2015, 178, 115–128. [CrossRef]
6. Wong, B.B.; Candolin, U. Behavioral responses to changing environments. Behav. Ecol. 2015, 26, 665–673.
[CrossRef]
7. Herr, J. Ecology and Behaviour of Urban Stone Martens (Martes foina) in Luxembourg. Ph.D. Thesis,
University of Sussex, Brighton, UK, 2008.
8. Prigioni, C.; Balestrieri, A.; Remonti, L.; Cavada, L. Differential use of food and habitat by sympatric
carnivores in the eastern Italian Alps. Ital. J. Zool. 2008, 75, 173–184. [CrossRef]
9. Murray, M.; Cembrowski, A.; Latham, A.D.M.; Lukasik, V.M.; Pruss, S.; St Clair, C.C. Greater consumption of
protein-poor anthropogenic food by urban relative to rural coyotes increases diet breadth and potential for
human–wildlife conflict. Ecography 2015, 38, 1235–1242. [CrossRef]
10. Young, A.; Márquez-Grant, N.; Stillman, R.; Smith, M.J.; Korstjens, A.H. An investigation of red fox
(Vulpes vulpes) and Eurasian badger (Meles meles) scavenging, scattering, and removal of deer remains:
Forensic implications and applications. J. Forensic Sci. 2015, 60, S39–S55. [CrossRef]
11. Contesse, P.; Hegglin, D.; Gloor, S.; Bontadina, F.; Deplazes, P. The diet of urban foxes (Vulpes vulpes) and the
availability of anthropogenic food in the city of Zurich, Switzerland. Mamm. Biol. 2004, 69, 81–95. [CrossRef]
12. Pedrini, P.; Prigioni, C.; Volcan, G. Use of trophic resources and forest habitats by the genus Martes in
Adamello-Brenta Park (Central Italian Alps). Hystrix Ital. J. Mammal. 1995, 7, 1–2.
13. Gehrt, S.D.; Brown, J.L.; Anchor, C. Is the urban coyote a misanthropic synanthrope? The case from Chicago.
Cities Environ. 2011, 4, 3. [CrossRef]
14. Walton, Z.; Samelius, G.; Odden, M.; Willebrand, T. Variation in home range size of red foxes Vulpes vulpes
along a gradient of productivity and human landscape alteration. PLoS ONE 2017, 2, e0175291. [CrossRef]
[PubMed]Animals 2019, 9, 447 13 of 13
15. Beckmann, J.P.; Berger, J. Rapid ecological and behavioural changes in carnivores: The responses of black
bears (Ursus americanus) to altered food. J. Zool. 2003, 261, 207–212. [CrossRef]
16. Carter, N.H.; Shrestha, B.K.; Karki, J.B.; Pradhan, N.M.B.; Liu, J. Coexistence between wildlife and humans at
fine spatial scales. Proc. Natl. Acad. Sci. USA 2012, 109, 15360–15365. [CrossRef] [PubMed]
17. Avenant, N.L.; Nel, J.A.J. Comparison of the diet of the yellow mongoose in a coastal and a Karoo area. S. Afr.
J. Wild. Res. 1992, 22, 89–93.
18. Nel, J.A.J.; Kok, O.B. Diet and foraging group size in the yellow mongoose: A comparison with the suricate
and the bat-eared fox. Ethol. Ecol. Evol. 1999, 11, 25–34. [CrossRef]
19. Blaum, N.; Rossmanith, E.; Fleissner, G.; Jeltsch, F. The conflicting importance of shrubby landscape structures
for the reproductive success of the yellow mongoose (Cynictis penicillata). J. Mammal. 2007, 88, 194–200.
[CrossRef]
20. Le Roux, A. Communication in the Yellow Mongoose, Cynictis penicillata. Ph.D. Thesis, University of
Stellenbosch, Stellenbosch, South Africa, 2007.
21. Mbatyoti, O.A. Spatio-temporal Ecology of the Yellow Mongoose Cynictis Penicillata in the Great Fish River
Reserve. Master’s Thesis, University of Fort Hare, Eastern Cape, South Africa, 2012.
22. Le Roux, A.; Balmforth, Z.; Mbatyoti, O.A.; Bizani, M.; Avenant, N.L.; Cavallini, P.; Do Linh San, E. A Conservation
Assessment of Cynictis Penicillate; The Red List of Mammals of South Africa, Swaziland and Lesotho; South
African National Biodiversity Institute and Endangered Wildlife Trust: Pretoria, South Africa, 2017.
23. Cronk, N.E.; Pillay, N. Food choice and feeding on carrion in two African mongoose species in an urban
environment. Acta Ethol. 2018, 21, 127–136. [CrossRef]
24. Cronk, N.; Pillay, N. Dietary overlap of two sympatric African mongoose species in an urban environment.
Mammalia 2019. [CrossRef]
25. Meyersdal Eco-Estate. Available online: http://www.meyersdaleco.co.za/ (accessed on 6 March 2019).
26. Mewada, T.P. Index of relative importance of the dietary pro- portions of sloth bear. Not. Sci. Biol. 2015, 7, 281.
[CrossRef]
27. Norris, D.; Michalski, F.; Peres, C.A. Habitat patch size modulates terrestrial mammal activity patterns in
Amazonian forest fragments. J. Mammal. 2010, 91, 551–560. [CrossRef]
28. Meredith, M.; Ridout, M. Package ‘Overlap’: Estimates of Coefficient of Overlapping for Animal Activity Patterns,
Version 0.2.4; 2014. Available online: http://CRAN.R-project.org/package=overlap (accessed on 9 July 2019).
29. Ridout, M.S.; Linkie, M. Estimating overlap of daily activity patterns from camera trap data. J. Agric. Biol.
Envir. Stat. 2009, 14, 322–337. [CrossRef]
30. Frey, S.; Fisher, J.T.; Burton, A.C.; Volpe, J.P. Investigating animal activity patterns and temporal niche partitioning
using camera-trap data: Challenges and opportunities. Remote Sens. Ecol. Conserv. 2017, 3, 123–132. [CrossRef]
31. Calenge, C. The package adehabitat for the R software: A tool for the analysis of space and habitat use by
animals. Ecol. Model. 2006, 197, 516–519. [CrossRef]
32. Balmforth, Z.E. The Demographics, Spatial Structure and Behaviour of the Yellow Mongoose, Cynictis
penicillata, with Emphasis on Cooperative Breeding. Ph.D. Thesis, University of Sussex, Brighton, UK, 2004.
33. Allen, B.L.; Carmelito, E.; Amos, M.; Goullet, M.S.; Allen, L.R.; Speed, J.; Gentle, M.; Leung, L.K.P. Diet
of dingoes and other wild dogs in peri-urban areas of northeastern Australia. Sci. Rep. 2016, 6, 23028.
[CrossRef] [PubMed]
34. Samia, D.S.; Nakagawa, S.; Nomura, F.; Rangel, T.F.; Blumstein, D.T. Increased tolerance to humans among
disturbed wildlife. Nat. Commun. 2015, 6, 8877. [CrossRef]
35. Cavallini, P. Spatial organization of the yellow mongoose Cynictis penicillata in a coastal area. Ethol. Ecol.
Evol. 1993, 5, 501–509.
36. Le Roux, A.; Cherry, M.I.; Manser, M.B. The effects of population density and sociality on scent marking in
the yellow mongoose. J. Zool. 2008, 275, 33–40. [CrossRef]
© 2019 by the authors. Licensee MDPI, Basel, Switzerland. This article is an open access
article distributed under the terms and conditions of the Creative Commons Attribution
(CC BY) license (http://creativecommons.org/licenses/by/4.0/).You can also read