Superficial Slow Rhythms Integrate Cortical Processing in Humans
←
→
Page content transcription
If your browser does not render page correctly, please read the page content below

www.nature.com/scientificreports

                        OPEN          Superficial Slow Rhythms Integrate
                                      Cortical Processing in Humans
                                      Milan Halgren 1, Daniel Fabó2, István Ulbert3,4, Joseph R. Madsen5, Lorand Erőss4,6,
                                      Werner K. Doyle7, Orrin Devinsky7, Donald Schomer8, Sydney S. Cash1 & Eric Halgren9
Received: 30 August 2017
                                      The neocortex is composed of six anatomically and physiologically specialized layers. It has been
Accepted: 23 January 2018             proposed that integration of activity across cortical areas is mediated anatomically by associative
Published: xx xx xxxx                 connections terminating in superficial layers, and physiologically by slow cortical rhythms. However,
                                      the means through which neocortical anatomy and physiology interact to coordinate neural activity
                                      remains obscure. Using laminar microelectrode arrays in 19 human participants, we found that most
                                      EEG activity is below 10-Hz (delta/theta) and generated by superficial cortical layers during both
                                      wakefulness and sleep. Cortical surface grid, grid-laminar, and dual-laminar recordings demonstrate
                                      that these slow rhythms are synchronous within upper layers across broad cortical areas. The phase
                                      of this superficial slow activity is reset by infrequent stimuli and coupled to the amplitude of faster
                                      oscillations and neuronal firing across all layers. These findings support a primary role of superficial slow
                                      rhythms in generating the EEG and integrating cortical activity.

                                      The human brain must coordinate and organize the activity of billions of neurons. Cortical oscillations, by rhyth-
                                      mically modulating neural activity, are a likely mechanism for accomplishing this1,2. Although the relationship
                                      of cortical rhythms to behavioral states has been studied for nearly a century, scientists still search for unifying
                                      principles governing neocortical oscillations. One commonly accepted principle is that slow rhythms coordinate
                                      activity across widespread neuronal pools, whereas fast rhythms mediate local processing3,4. Furthermore, slow
                                      and fast rhythms have been hypothesized to enact feedback and feedforward processes, respectively5,6. Parallel
                                      with this functional hypothesis, superficial cortical layers are anatomically structured to mediate global asso-
                                      ciative processing due to their lateral connectivity, feedback connections, and diffuse thalamocortical matrix
                                      afferents7–10. This allows superficial cortical layers to sample activity from many cortical areas simultaneously
                                      and modulate local processing accordingly. Synthesizing these two theories suggests that low frequency rhythms
                                      might be generated in superficial cortical layers, coordinate activity over broad cortical areas and modulate higher
                                      frequency local activity in deeper cortical laminae. However, no systematic relationship has yet been detailed
                                      between oscillatory activity and cortical layers in humans, and the relationship between cortical oscillations in
                                      specific layers and those across the surface remains unexplored.
                                          To measure in vivo cortical oscillations with high spatiotemporal precision, we performed intracranial elec-
                                      troencephalography (iEEG) in 19 patients with medically intractable epilepsy. Recordings were for the most part
                                      spontaneous, including both sleep and waking, but also included task-related activity in 3 patients. To determine
                                      how cortical oscillations varied across cortical areas and layers, we combined recordings from macroelectrodes
                                      placed horizontally on the cortical surface (ECoG) with recordings from microelectrodes inserted vertically, or
                                      perpendicular to the cortical surface (laminar electrodes) in frontal, temporal and parietal association cortices11.
                                      Recording vertically and laterally simultaneously allowed us to assess the characteristics of oscillations at different

                                      1
                                        Department of Neurology, Epilepsy Division, Massachusetts General Hospital, Harvard Medical School, Boston,
                                      MA, 02114, USA. 2Epilepsy Centrum, National Institute of Clinical Neurosciences, Budapest, Hungary. 3Institute of
                                      Cognitive Neuroscience and Psychology, Research Center for Natural Sciences, Hungarian Academy of Science,
                                      Budapest, Hungary. 4Péter Pázmány Catholic University, Faculty of Information Technology and Bionics, Budapest,
                                      Hungary. 5Departments of Neurosurgery, Boston Children’s Hospital and Harvard Medical School, Boston, MA,
                                      02115, USA. 6Department of Functional Neurosurgery, National Institute of Clinical Neurosciences, Budapest,
                                      Hungary. 7Comprehensive Epilepsy Center, New York University School of Medicine, New York, NY, 10016, USA.
                                      8
                                        Department of Neurology, Beth Israel Deaconess Medical Center, Boston, MA, 02215, USA. 9Departments of
                                      Neurosciences and Radiology, Center for Human Brain Activity Mapping, University of California at San Diego,
                                      La Jolla, CA, 92093, USA. Sydney S. Cash and Eric Halgren contributed equally to this work. Correspondence and
                                      requests for materials should be addressed to M.H. (email: milan.n.halgren@gmail.com)

        SCIENtIfIC REports | (2018) 8:2055 | DOI:10.1038/s41598-018-20662-0                                                                                1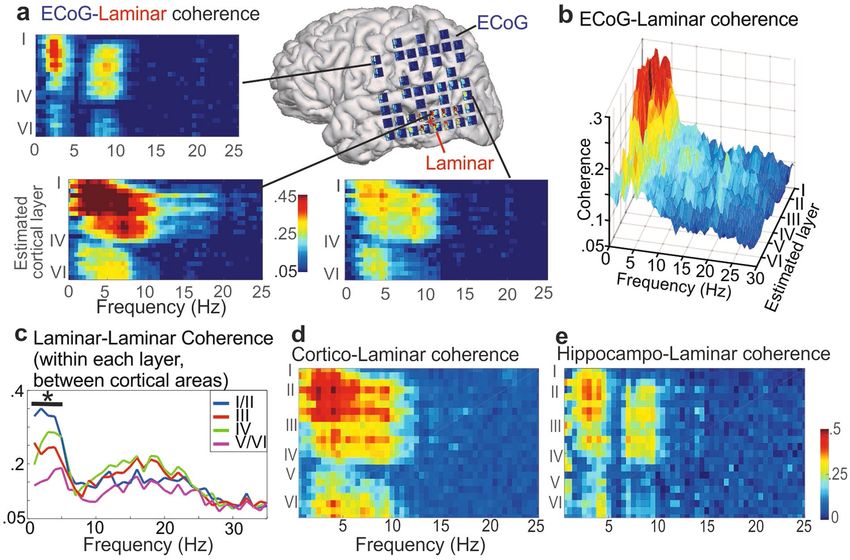
www.nature.com/scientificreports/

                              depths within the grey matter, and to examine the relationships between activity in specific cortical laminae to
                              those measured on the cortical surface in distal and proximal regions.

                              Results
                              Distribution of Local Field Potential gradients (LFPg) of different frequencies across layers. To
                              determine which cortical layers generate different EEG frequencies, we measured the LFPg in multiple corti-
                              cal layers simultaneously using the vertical microelectrode array. Differential recording between contacts at 150
                              micron centers strongly attenuates volume conduction from distant sources, thus assuring that activity is locally
                              generated12,13. Spectral content of the resulting LFPg was estimated using the Fast Fourier Transform at each cor-
                              tical depth. Normalizing within each frequency across channels allowed us to measure the relative contribution of
                              each cortical layer to different frequency bands. A striking finding was that delta and theta oscillations (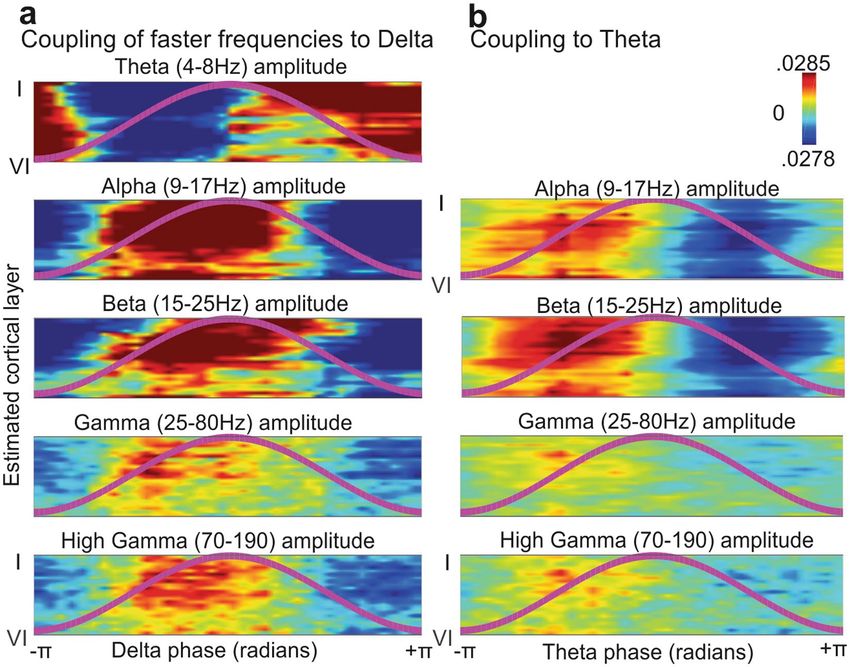
www.nature.com/scientificreports/

                              Figure 1. Slow rhythms are generated in superficial cortical layers. (a) A schematic of an implanted laminar
                              array and surface ECoG contact in a single patient, overlying a histological section taken from an implantation
                              site. The laminar array comprises 24 contacts on 150 µ centers. Each bipolar Local Field Potential gradient
                              (LFPg) recording measures activity from one layer of a single cortical domain. In contrast, the ECoG
                              grid measures activity averaged across all layers from multiple cortical domains (Scale bar: 1 mm). The
                              microelectrode reference scheme is illustrated in Supplementary Fig. 1. (b) Approximate location of laminar
                              implantation in 19 patients. Implants could be in either hemisphere. (c) Overall distribution of spectral power
                              across cortical layers. Spontaneous LFPg power was z-normalized across layers to correct for 1/f scaling, and
                              averaged across 16 subjects for sleep and wakefulness, using 1-Hz Gaussian frequency smoothing. Individual
                              subject data is shown in Supplementary Fig. 2. (d) Normalized power spectral density during wake recordings
                              only. Note that delta/theta band activity is still focally generated in superficial cortical layers. (e) Normalized
                              power spectral density using current source density (CSD) instead of the local field potential gradient (LFPg).
                              Delta/theta oscillations are still localized to superficial layers. (f) Raw data from simultaneous ECoG and
                              laminar recordings during sleep and wakefulness. Note that delta/theta activity is strongest in superficial layers
                              during both states.

SCIENtIfIC REports | (2018) 8:2055 | DOI:10.1038/s41598-018-20662-0                                                                                 3
www.nature.com/scientificreports/

                              Figure 2. Superficial slow rhythms are coherent across cortical layers and areas. (a) Coherence as a function of
                              frequency and distance between cortical regions, measured with bipolar ECOG derivations, and averaged across
                              4 subjects. (b) Coherence as a function of frequency and distance between cortical layers, measured with bipolar
                              laminar derivations. (c) Coherence between specific layers in delta/theta band. Individual subject data is shown
                              in Supplementary Fig. 3B. B-C are grand averages across 16 subjects. Significance by distance, frequency and
                              layer for panels a, b and c is shown in Supplementary Fig. 4.

                              lead, a significant increase in delta power did occur mostly in deep cortex, but the increase in delta ITPC as well as
                              the time-domain response were predominantly supragranular. This is consistent with the evoked response being
                              due to a phase-reset rather than an additive response21,22. Complete single subject results and significances are
                              plotted in Supplementary Fig. 8.

                              Discussion
                              We used multiscale recordings to define the distribution and coherence of field potential generation across dif-
                              ferent cortical layers and areas in humans. A consistent finding across all 19 subjects was that slow (delta/theta)
                              rhythms were generated in and coherent throughout the superficial layers of the cortex, and were coupled to high
                              frequency activity in all layers. In three subject, these rhythms were found to be reset by infrequent stimuli. These
                              findings have practical implications for the neural basis of extracranial EEG as well as the physiology of the cortex
                              and the integration of neural activity.
                                  EEG is a mainstay of clinical neurology and the most widely used method for monitoring brain activity with
                              millisecond precision23,24. Our results shed light on its genesis, suggesting that the human EEG consists mainly of
                              relatively slow and coherent activity generated in the superficial cortical lamina correlated with presumed firing
                              in all layers.
                                  The strength of a given cortical layer’s contribution to the scalp EEG depends on the a) power and b) coher-
                              ence of its currents throughout the cortical mantle25. Our study used microelectrode recordings to characterize
                              the power of EEG activity at different cortical depths and frequencies, and a combination of micro and macroelec-
                              trodes to characterize its coherence. Laminar array recordings which densely sampled all cortical layers indicated
                              that over 70% of LFPg power is below 10 Hz, and is generated in the upper 20% of the cortex. This finding is in
                              contrast to some prior laminar recording studies which emphasized deep sources26. However, those studies used
                              referential recordings in which deep channels were contaminated by volume conduction from more superficial
                              sources13,27.
                                  Furthermore, we demonstrated that the slow rhythms measured in a single cortical location with a laminar
                              probe or ECoG contact were coherent throughout superficial layers. This was proven indirectly by measuring
                              the coherence between ECoG recordings and laminar LFPg, then directly by measuring the coherence between
                              two simultaneously recorded laminar probes. In both cases, superficial slow LFPg was significantly coherent

SCIENtIfIC REports | (2018) 8:2055 | DOI:10.1038/s41598-018-20662-0                                                                               4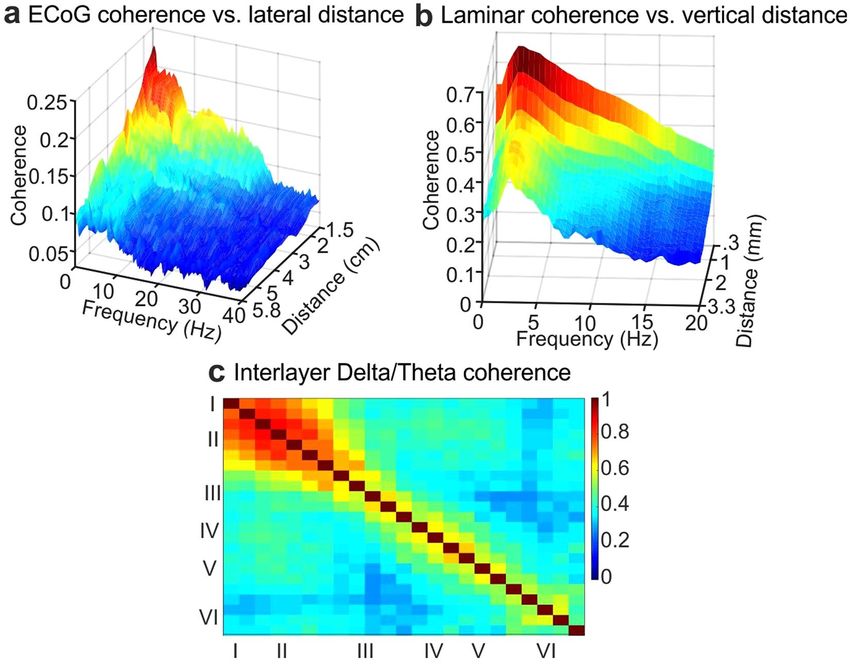
www.nature.com/scientificreports/

                              Figure 3. Slow rhythms in superficial cortical layers are coherent with other cortical areas. (a) Coherence
                              (frequency vs. cortical depth) of individual ECoG contacts with the laminar probe in a single awake participant.
                              There are high levels of delta/theta coherence in contacts as far as primary motor cortex. ECoG contact spacing
                              is 1 cm. Data from 3 additional subjects is shown in Supplementary Fig. 5. (b) Average coherence (n = 4)
                              between a laminar probe and all ECoG (surface) contacts as a function of depth and frequency. Significant
                              ECoG-Laminar coherence was found most consistently within low-frequencies and superficial layers. (c)
                              Average coherence (n = 3) within layers between two simultaneously recorded laminar arrays. The asterisk
                              indicates that coherence between very superficial contacts (approximate layers I/II) was significant within all
                              3 subjects from 1–5 Hz. (d) Coherence between the neocortical laminar array and an example cortical SEEG
                              bipolar macroelectrode. (e) Coherence between the laminar array and a bipolar macroelectrode recording
                              within the head of the hippocampus. Single subject. Statistical comparisons for panels b, d and e are shown in
                              Supplementary Fig. 6. In all cases, coherence is significant at low frequencies in upper layers.

                              throughout the cortex. Thus, the slow waves generated across the cortical surface would be expected to summate
                              in propagating extracranially25. In summary, laminar and ECoG recordings provide synergistic evidence for high
                              amplitude, coherent delta/theta activity in superficial layers generating much of the spontaneous scalp EEG.
                                   The concentration of delta/theta activity in upper layers was present across all 19 subjects, in parietal, fron-
                              tal and temporal lobes, in both hemispheres, and generalized across behavioral state and frequencies. While
                              only associative cortex was sampled here, some results in animals suggest that these rhythms extend to primary
                              sensory areas13,20. They may also be more prominent in associative cortex due to its relatively slower processing
                              timescale28,29 and in higher primates because of their expanded supragranular cortex30. Although our focus was
                              on delta, and more of our recordings were from sleep than waking when these frequencies have maximum power,
                              we found a similar concentration of power in upper layers during wakefulness. The presence of waking delta is
                              consistent with previous iEEG reports31.
                                   Although the dominance of superficial activity throughout the cortex may lead one to posit that this is a bio-
                              physical effect (and not due to neural activity per se), we can find no plausible biophysical factors which could
                              explain our results. While differences in impedance could cause systematic laminar biophysical differences in the
                              LFPg, impedance spectra are uniform across cortical layers32. Differences in dendritic diameter could also cause
                              differences in the LFPg between layers, as apical dendritic shafts can act as low-pass filter33. However, low-pass
                              filtering would only explain differences in high frequency power between layers, and not the concentration of
                              delta/theta in superficial cortex. Furthermore, similar results were found using current-source-density analysis.
                              These considerations suggest that our finding that low frequency LFPg is largest in superficial layers reflects its
                              local generation, rather than biophysical factors.
                                   Our analysis was not confined to sinusoidal oscillations but included all spontaneous activity in the recorded
                              epochs. It may be that specific oscillatory trains which are clearly distinguished from background activity could
                              be concentrated in layers other than superficial, and indeed some sleep recordings displayed what appeared to

SCIENtIfIC REports | (2018) 8:2055 | DOI:10.1038/s41598-018-20662-0                                                                              5
www.nature.com/scientificreports/
Figure 4. Superficial slow oscillations are coupled to faster frequencies across all layers. (a) Phase of ongoing
delta in superficial layers is tightly coupled to the amplitude of faster frequencies in all layers. Amplitude was
normalized within each contact and frequency band, and then averaged across all subjects and states. Each
panel represents phase on the X-axis, cortical layer on the Y-axis and average amplitude of a given frequency
in color. The overlying line shows delta phase. (b) Same as A, but for coupling of superficial theta phase to
amplitude of higher frequencies in all layers.
be spindle activity maximal in middle layers. However, consistent with our findings, previous work has found
predominantly superficial CSD activity underlying spontaneous large single34 or repeated2,22 waves in the delta/
theta band.
Interestingly, we rarely noticed prominent alpha oscillations in our resting state data. While this appears to
be in conflict with the notion that alpha is the brain’s dominant resting state rhythm (and thus ubiquitous in the
neocortex), these claims are mostly based on scalp EEG recordings susceptible to volume conduction12,35. Indeed,
spatially focal ECoG recordings find that alpha is largely restricted to parietal and occipital cortices36. Our sparse
coverage of these areas (Fig. 1b), in addition to not performing an eye-closure task, could explain why we infre-
quently recorded alpha rhythms.
Superficial slow activity was preferentially phase locked to unexpected sounds, consistent with these rhythms
consolidating stimuli into a global cognitive context. Importantly, delta power did not increase relative to infre-
quent stimuli, demonstrating that the evoked response was due to the phase-reset of ongoing delta oscillations
rather than a separate potential. The laminar distribution of delta/theta activity during the task was the same
as that of spontaneous slow rhythms, as had been noted previously22. The latency and waveform of the evoked
response generated by this delta/theta phase reset suggests that superficial slow rhythms contribute to the P3b,
associated with cognitive integration across multiple associative cortical regions37,38. These results are consistent
with CSD studies which found that later activity influenced by cognitive variables was largely superficial39, as well
as previous recordings of task-related delta activity in iEEG40,41.
The transmembrane currents underlying superficial delta/theta LFPg may arise from either voltage-gated
or ligand-gated channels42. One plausible voltage-gated candidate are H currents, which are most known for
contributing to spindle activity but can also generate lower frequency oscillations43. Interestingly, the density of
H-currents on the dendrites of layer Vb pyramidal cells has been found to increase dramatically in more super-
ficial layers44. Alternatively, the slow rhythms we observed may be generated by ligand-gated receptors such as
NMDA and GABA-B receptors, which have the long timescales necessary to generate slow activity and are also
predominantly in superficial cortical layers45. On the circuit level, thalamocortical matrix afferents terminate pri-
marily in upper layers and could mediate the transcortical coherence we observed via their diffuse, modulatory
projections10,46. In addition, cortico-cortical association fibers terminate mainly in upper layers and would also
be expected to contribute to coherence between areas7–9,47.
SCIENtIfIC REports | (2018) 8:2055 | DOI:10.1038/s41598-018-20662-0 6www.nature.com/scientificreports/
Figure 5. Superficial slow rhythms are phase-reset by infrequent stimuli in an auditory oddball task. (a) The
average time-domain difference of the LFPg response to infrequent and frequent stimuli (infrequent-frequent)
reveals a significant difference in superficial layers at ~400–800 ms after the stimulus in a representative subject.
Black lines outline the cluster of channels and time points in which this effect was significant (Nonparametric
permutation cluster test, p < 0.01) (b) Slow activity (www.nature.com/scientificreports/
risks and were told that they had no obligation to participate in the study, and that their choice not to participate
would not affect their clinical care in any way.
Electrodes. To sample from each cortical layer simultaneously, each laminar array had 24 contacts with 40 µm
diameters and 150 µm center-to-center spacing. Each laminar probe spanned the cortical depth with a length of
3.5 mm and diameter of 0.35 mm (Fig. 1a,b)11. Laminar electrodes were of two kinds. The more common ‘surface’
laminar arrays (17 of 19 patients) were inserted perpendicular to the cortical surface under visual control. In
order to consistently position the surface laminar arrays relative to cortical layers, a silicone sheet was attached
perpendicular to the top of the array anchoring it to the cortical surface. Sheet position was maintained by surface
tension and the overlying ECoG array and dura. Thus, physical constraints resulted in the first contact being cen-
tered ~150 µ below the pial surface, and the 24th contact at ~3600 µ below the pial surface. The correspondence of
channels to layers was extrapolated from previous measurements of laminar width in human cortex30. Channels
1, 4, 9, 14, 16 and 21 were the approximate centers of layers I-VI, respectively.
The other type of laminar electrode, the ‘depth’ laminar (2 of 19 patients), was inserted through the lumen
of the clinical depth electrodes so as to extend past the clinical tip by ~5 mm, and the clinical electrodes were
implanted ~5 mm less deep than they would otherwise have been. Thus, their placement with respect to corti-
cal laminae was less certain, based upon co-registered MRI/CT and confirmed with basic physiological meas-
ures, notably the presence of high gamma and/or multiunit activity which is confined to gray matter. Physical
constraints determined whether the lead approached the cortical ribbon from the white matter or the pia. In 2
patients with surface laminars, it was possible to confirm placement using histology. One such patient (Subject
14) is shown in Fig. 1a. In this patient, delta/theta power was concentrated in supragranular cortex, more specifi-
cally layers I/II (contacts 1–5), as was seen in all other patients (Supplementary Fig. 2).
Macroelectrodes included electrocorticographic (ECoG) grids (2 mm diameter, 1 cm pitch) and depth elec-
trodes, also known as stereo-EEG (SEEG). The signals were originally recorded with a relatively inactive, clinical
reference. This referencing scheme was used for calculating coherence between the laminar array and ECoG
contacts. Prior to the computation of coherence between ECoG contacts, a bipolar montage was used wherein
each channel was referenced to its right-side neighbor (Supplementary Fig. 1). Structural MRI or CT with the
electrodes in place, aligned with preoperative MRI, was used to identify the position of SEEG and ECoG con-
tacts52,53. Neighboring pairs of contacts in the hippocampal or cortical gray matter were referenced to each other.
Recordings. Local field potential recordings from the laminar microelectrode arrays were sampled at
2000 Hz with an online low-pass filter of 500 Hz. Each laminar contact was referenced to its neighbor, yielding
the potential gradient. Potential gradient (the first spatial derivative) rather than current-source-density (CSD)
(the second spatial derivative) was used for several reasons. Previous studies have shown that using this reference
scheme largely eliminates volume conduction and provides a very local measure of cortical activity12. Due to the
high sensitivity of the second spatial derivative to noise, eliminating spurious sources and sinks requires heavily
smoothing the signal prior to taking the derivative. This spatial smoothing would attenuate the laminar precision
that CSD is intended to reveal. Furthermore, because the second spatial derivative is estimated using a three to
five point approximation, a single faulty contact could necessitate the removal of 3 or more signals, a significant
amount of the laminar depth. Lastly, modeling and empirical studies have shown that the potential gradient and
CSD both yield similar spatial localization12,13. To ensure that our findings were independent of analysis tech-
nique, we also found the power spectral density at multiple cortical depths using CSD (Fig. 1e) with the five-point
approximation11. This yielded very similar results to the potential gradient.
Epoch selection. All data were visually inspected for movement, pulsation and machine artifacts. The data
was also screened for epileptic activity such as interictal discharges and pathological delta by a board certified
electroencephalographer. Laminar arrays with significant amounts of artifactual or epileptiform activity, and/or
insufficient technical quality, were rejected prior to further analysis. All epochs with artefactual or epileptiform
activity from accepted arrays were also excluded from analyses. Despite these measures, contamination due to
epilepsy was a concern due to placement of the surface arrays in a location that had a high likelihood of being
subsequently resected. Because depth laminars were integrated with the clinical probes they could be placed in
locations which were suspected of being involved in the seizure but with less certainty than the surface laminars.
Thus, as a further check, we compared the strength of superficial delta/theta oscillations in spontaneous activ-
ity recorded from laminar probes whose recordings exhibited interictal spikes (N = 6) versus laminar probes
which did not record any interictal spikes in the examined epochs (N = 10). Restricting analysis to the epochs
without interictal spikes in all participants, we found no significant difference in normalized delta/theta power
(Wilcoxon Rank Sum, p = 0.64); in fact, mean delta/theta power differed between groups bywww.nature.com/scientificreports/
Spectral Analysis. All analysis was performed in MATLAB using custom and FieldTrip functions55. In each
participant, the Fourier Transform was calculated in 10 second epochs on the zero-meaned data after a single
Hanning taper was applied. The power spectrum was then Z-normalized across channels/within each frequency
band in order to determine the relative power of different oscillations in different layers. The normalized fre-
quency spectra of faulty channels (an average of 3 per probe) were linearly interpolated from the normalized
frequency spectra of good channels above and below on the laminar probe. For instance, if channel 2 was defec-
tive, its power spectrum would be replaced by the average of channels 1 and 3’s power spectra, However, note that
subjects 2, 3, 7, 8, 9 and 16 (depicted in Supplementary Fig. 2) had no interpolated channels yet still had delta/
theta activity concentrated in superficial cortex. Linear interpolation of bad channels in the time domain prior to
the FFT yielded artificially low high frequency power due to phase cancellation.
Coherence. The coherence between zero-meaned time series x and y was defined as
Sxy
Coh(x , y ) =
Sxx Syy (1)
where Sxy is the cross-spectral density between x and y and Sxx is the autospectral density of x. Because small num-
bers of epochs can lead to spurious coherence, recorded epochs were subsampled into two second epochs prior to
the calculation of auto/cross spectra23,56.
To find the statistical significance of coherence values (Figs 2, 3), we used a non-parametric trial shuffling pro-
cedure23. Within each subject, we shuffled the temporal order of two second epochs for each channel 100 times
and for each shuffle recomputed all coherencies. We used this distribution of coherencies, generated under the
null hypothesis of no temporal relationship between channels, to z-score the real coherencies of each channel pair,
giving us single subject z-scores for each pair of contacts and frequency. Unless otherwise specified, coherence
was deemed significant if its p-value was < 0.05, Bonferroni Corrected. More specifically, we set the critical value
at 0.05/the number of channel by channel combinations within each subject. For instance, if a given subject had
23 functioning laminar contacts, significance would be set at 0.05/((23*22)/2). This procedure was applied within
subjects, and then the consistency of the effect across subjects was plotted as the proportion of subjects which had
significant coherence for each channel pair and frequency (Supplementary Figs 4, 6).
To determine how coherence varies across the cortical surface or between ECoG contacts, pairs of contacts
were sorted by the Euclidean distance between them on the pial surface. Then, the average coherence was found
over all pairs of contacts at a given distance. Due to varying intercontact distances present in each subject’s elec-
trode configurations, the average coherence vs. distance matrix for each participant (not the raw time-domain
data) was linearly interpolated at every 0.2 cm before averaging across participants. To determine how coherence
varied perpendicular to the cortical surface, the same procedure was applied to the laminar microelectrode array
without interpolation.
To assess the significance of average coherence at various intercontact distances and frequencies (Fig. 2), we
iteratively computed the average coherence vs. distance map as described above (within subjects) after shuffling
trials, and then used these maps (created under a null hypothesis of no temporal relationship between channels)
to z-score the real coherence vs. distance map rather than the coherencies per se (Supplementary Fig. 5).
Simultaneous ECoG and Laminar recordings were available in four participants, two made from awake partic-
ipants and two from sleeping participants. The coherence was measured between each pair of ECoG and laminar
contacts. The average coherence between each laminar contact and the 20 closest grid contacts was used for plot-
ting and statistical testing. All recordings showed high coherence between grid and superficial laminar contacts
in the delta/theta band.
In one participant, coherence was calculated between a bipolar referenced SEEG lead within the hippocampal
head and a simultaneously recorded laminar array. The coherence between each laminar signal and the bipolar
referenced hippocampal lead was compared to the average coherence between the laminar array and an SEEG
lead with two contacts in temporal neocortex (Fig. 3c,d). Although cortico-cortical coherence is higher in mag-
nitude, both are significantly coherent within the same bands.
In three participants, two laminar arrays spaced one centimeter apart were recorded from simultaneously.
One of these participants was awake during the recording, two were asleep. The coherence between each pair
of laminar contacts was calculated, and then averaged within putative cortical layers. All participants displayed
significant coherence in superficial contacts and low frequencies.
Phase – Amplitude – Coupling. To determine the effects of superficial slow rhythms on cortical activity, we
used Tort’s Modulation Index19 with a non-parametric trial shuffling procedure to assess significance. First, the
data was split into two second epochs. Then, each trial was filtered within the frequency bands of interest using
a fourth-order IIR Butterworth Filter. The first and last 100 ms of data were removed to eliminate edge artifacts.
Then, the analytic signal z(t) was found by applying the Hilbert Transform to the Local Field Potential gradient
(LFPg) of each channel. In each recording, the contact with the highest power in the modulating/lower frequency
band was used as the ‘phase index’ for determining modulation of power in other channels. All such contacts
were within the 5 closest to the laminar entry (i.e. superficial channels). Only epochs with high Hilbert amplitude
values for the modulating frequency (top 50%) were analyzed further. The phase series φ(t) of the phase index
channel was found by taking the angle of the analytic signal, and the amplitude A(t) of every channel was found
by taking the real component of the analytic signal. φ(t) was then reordered from −π to +π, and A(t) for every
other channel and frequency was reordered using the same permutation vector. Amplitude was then averaged
within 36 bins of phase (i.e. 10 degrees) and normalized by the sum over bins, yielding φ. The modulation index
(MI) was then calculated as
SCIENtIfIC REports | (2018) 8:2055 | DOI:10.1038/s41598-018-20662-0 9www.nature.com/scientificreports/
Dkl (φ, u)
MI (ϕ) =
log(36) (2)
for each channel and frequency pair, where Dkl is the Kullback-Leibler divergence, u is the uniform distribution
(i.e. no relationship between amplitude and phase) and log(36) is the natural logarithm of the number of phase
bins19. Dkl was computed as log(36) – H(P), where H(P) was the distribution’s Shannon’s Entropy.
To determine the statistical significance of these MI values, we generated a reference distribution under the
null hypothesis of a random relationship between amplitude and phase by iteratively shuffling the phase series (by
splitting the phase series into two epochs and swapping their order) and recalculating the MI for each shuffled
dataset. The mean and variance of these null hypothesis derived MIs at each channel and frequency were used to
determine the z-score of the actual MIs at each channel and modulating/modulated frequency pair, with signifi-
cance set at p < 0.05, Bonferroni Corrected (the critical value was set at 0.05/14, 14 being number of modulating/
modulated frequency pairs, within each subject). The percentage of subjects with a significant MI between each
pair of channels and modulating/modulated frequencies was then plotted within states (Supplementary Fig. 7).
This analysis indicated a significant modulation of high frequency amplitude by delta and theta -phase through-
out the cortical depth within subjects as well as states (p < 0.05, Bonferroni Corrected).
Auditory Oddball Task. A standard auditory oddball paradigm allowed us to assess the cognitive correlates
of superficial slow activity. Stimuli consisted of frequent (80%) tones, infrequent target (10%) tones and infre-
quent novel (10%) sounds with a stimulus onset asynchrony of 1600 ms. High (600 Hz) or low (140 Hz) tones as
targets were counterbalanced across blocks. The participant was asked to silently count and report the number of
target tones in each block. To determine significance, a nonparametric permutation cluster test was applied to the
differences in the time-domain, delta/theta analytic amplitude and inter-trial phase clustering (ITPC) between
frequent tones and novel sounds, as well as between frequent tones and infrequent tones23. The same procedure
was applied to find significant differences in ITPC, delta amplitude and the LFPg. First, a reference distribution
for each channel and time point under the null hypothesis was estimated by shuffling the trial labels between each
condition 500 times, and then calculating the average difference between (shuffled) target and filler trials at each
channel x time point. This yielded the mean and standard deviation of inter-condition differences under the null
hypothesis of no difference between conditions. The actual difference between conditions was z-scored using this
non-parametric reference distribution. To correct for multiple comparisons, we z-scored each matrix of differ-
ences between shuffled conditions and recorded the size of each contiguous cluster of channel x time points which
had p < 0.05. This yields a distribution of cluster sizes of significantly different points under the null hypothesis,
and the 99th percentile of this set of cluster sizes was used as a threshold for cluster significance. Finally, this
cluster size threshold was then applied to the original, real Z-scored difference matrix of channel x time points
between conditions to determine significance corrected for multiple comparisons23.
For ITPC, the entire dataset was filtered from 1–3 Hz, as the time-domain response had a period of ~500 ms.
To calculate the inter-trial phase clustering value (ITPC) and determine if the P3 stemmed from a phase reset,
we then applied the Hilbert Transform to our dataset and took its angle to find the instantaneous delta phase at
each point in time. The phase at each channel and time point was then represented as a complex vector in the
unit circle using Euler’s Identity formula eiθ where θ is delta phase. The ITPC was then calculated as the length of
the average phase vector across trials, yielding an ITPC value bound by 0 (no consistency) and 1 (perfect consist-
ency)23. To determine whether or not there was a difference in delta amplitude between conditions, we found the
Hilbert amplitude of the filtered data. Significant differences in ITPC (as assessed with the above nonparametric
statistics) were found between frequent tones and novel sounds in one subject, and between frequent and infre-
quent tones in two others23.
For visualization of the single-trial data (Fig. 5c) a 10-trial Gaussian smoothing window was applied. A 40-ms
wide Gaussian (σ = 4 ms) smoothing of the overlaid time-domain response was also plotted.
Data availability. Data and code will be made available upon reasonable request to the degree it is possible
given participant consent constraints and HIPAA requirements.
References
1. Buzsáki, G. & Draguhn, A. Neuronal Oscillations in Cortical Networks. Sci. 304, 1926–1929 (2004).
2. Csercsa, R. et al. Laminar analysis of slow wave activity in humans. Brain 133, 2814–2829 (2010).
3. Destexhe, A., Contreras, D. & Steriade, M. Spatiotemporal Analysis of Local Field Potentials and Unit Discharges in Cat Cerebral
Cortex during Natural Wake and Sleep States. J. Neurosci. 19, 4595–4608 (1999).
4. Von Stein, A. & Sarnthein, J. Different frequencies for different scales of cortical integration: From local gamma to long range alpha/
theta synchronization. Int. J. Psychophysiol. 38, 301–313 (2000).
5. Buffalo, Ea, Fries, P., Landman, R., Buschman, T. J. & Desimone, R. Laminar differences in gamma and alpha coherence in the
ventral stream. Proc. Natl. Acad. Sci. USA 108, 11262–7 (2011).
6. van Kerkoerle, T. et al. Alpha and gamma oscillations characterize feedback and feedforward processing in monkey visual cortex.
Proc. Natl. Acad. Sci. 111, 14332–14341 (2014).
7. Pucak, M., Levitt, J., Lund, J. & Lewis, D. Patterns of intrinsic and associational circuitry in monkey prefrontal cortex. J. Comp.
Neurol. 376, 614–630 (1996).
8. Douglas, R. J. & Martin, K. A. C. Neuronal Circuits of the Neocortex. Annu. Rev. Neurosci. 27, 419–451 (2004).
9. Larkum, M. E., Senn, W. & Lüscher, H.-R. Top-down Dendritic Input Increases the Gain of Layer 5 Pyramidal Neurons. Cereb.
Cortex 14, 1059–1070 (2004).
10. Rubio-Garrido, P., Pérez-De-Manzo, F., Porrero, C., Galazo, M. J. & Clascá, F. Thalamic input to distal apical dendrites in neocortical
layer 1 is massive and highly convergent. Cereb. Cortex 19, 2380–2395 (2009).
11. Ulbert, I., Halgren, E., Heit, G. & Karmos, G. Multiple microelectrode-recording system for human intracortical applications. J.
Neurosci. Methods 106, 69–79 (2001).
SCIENtIfIC REports | (2018) 8:2055 | DOI:10.1038/s41598-018-20662-0 10www.nature.com/scientificreports/
12. Kajikawa, Y. & Schoeder, E. How local is the local field potential? Neuron 72, 847–858 (2012).
13. Haegens, S. et al. Laminar Profile and Physiology of the α Rhythm in Primary Visual, Auditory, and Somatosensory Regions of
Neocortex. J. Neurosci. 35, 14341–52 (2015).
14. Bonjean, M. et al. Interactions between Core and Matrix Thalamocortical Projections in Human Sleep Spindle Synchronization. J.
Neurosci. 32, 5250–5263 (2012).
15. Piantoni, G., Halgren, E. & Cash, S. S. The contribution of thalamocortical core and matrix pathways to sleep spindles. Neural
Plasticity 2016 (2016).
16. Arnulfo, G., Hirvonen, J., Nobili, L., Palva, S. & Palva, J. M. Phase and amplitude correlations in resting-state activity in human
stereotactical EEG recordings. Neuroimage 112, 114–127 (2015).
17. Ninomiya, T., Dougherty, K., Godlove, D. C., Schall, J. D. & Maier, A. Microcircuitry of agranular frontal cortex: contrasting laminar
connectivity between occipital and frontal areas. J. Neurophysiol. 113, 3242–3255 (2015).
18. Fell, J. & Axmacher, N. The role of phase synchronization in memory processes. Nat Rev Neurosci 12, 105–118 (2011).
19. Tort, A. B. L., Komorowski, R., Eichenbaum, H. & Kopell, N. Measuring Phase-Amplitude Coupling Between Neuronal Oscillations
of Different Frequencies. J. Neurophysiol. 104, 1195–1210 (2010).
20. Lakatos, P. et al. An oscillatory hierarchy controlling neuronal excitability and stimulus processing in the auditory cortex. J.
Neurophysiol. 94, 1904–1911 (2005).
21. Fell, J. et al. Neural Bases of Cognitive ERPs: More than Phase Reset. J. Cogn. Neurosci. 16, 1595–1604 (2004).
22. Halgren, E. et al. Laminar profile of spontaneous and evoked theta: Rhythmic modulation of cortical processing during word
integration. Neuropsychologia 76, 108–124 (2015).
23. Cohen, M. X. Analyzing Neural Time Series Data: Theory and Practice. (The MIT Press, 2014).
24. Cohen, M. X. Where Does EEG Come From and What Does It Mean? Trends in Neurosciences 40, 208–218 (2017).
25. Musall, S., von Pfostl, V., Rauch, A., Logothetis, N. K. & Whittingstall, K. Effects of Neural Synchrony on Surface EEG. Cereb. Cortex
24, 1045–1053 (2014).
26. Petsche, H., Pockberger, H. & Rappelsberger, P. On the search for the sources of the electroencephalogram. Neuroscience 11, 1–27
(1984).
27. Kajikawa, Y. & Schroeder, C. E. Generation of field potentials and modulation of their dynamics through volume integration of
cortical activity. J. Neurophysiol. 113, 339–351 (2015).
28. Honey, C. J. et al. Slow Cortical Dynamics and the Accumulation of Information over Long Timescales. Neuron 76, 423–434 (2012).
29. Murray, J. D. et al. A hierarchy of intrinsic timescales across primate cortex. Nat. Neurosci. 17, 1661–3 (2014).
30. Hutsler, J. J., Lee, D.-G. & Porter, K. K. Comparative analysis of cortical layering and supragranular layer enlargement in rodent
carnivore and primate species. Brain Res. 1052, 71–81 (2005).
31. Sachdev, R. N. S. et al. Delta rhythm in wakefulness: evidence from intracranial recordings in human beings. J. Neurophysiol. 114,
1248–1254 (2015).
32. Logothetis, N. K., Kayser, C. & Oeltermann, A. In vivo measurement of cortical impedance spectrum in monkeys: implications for
signal propagation. Neuron 55, 809–23 (2007).
33. Lindén, H., Pettersen, K. H. & Einevoll, G. T. Intrinsic dendritic filtering gives low-pass power spectra of local field potentials. J.
Comput. Neurosci. 29, 423–444 (2010).
34. Cash, S. S. et al. The Human K-Complex Represents an Isolated Cortical Down-State. Science (80-.). 324, 1084–1087 (2009).
35. Jensen, O. & Mazaheri, A. Shaping functional architecture by oscillatory alpha activity: gating by inhibition. Front. Hum. Neurosci.
4, 186 (2010).
36. Groppe, D. M. et al. Dominant frequencies of resting human brain activity as measured by the electrocorticogram. Neuroimage 79,
223–233 (2013).
37. Halgren, E., Marinkovic, K. & Chauvel, P. Generators of the late cognitive potentials in auditory and visual oddball tasks.
Electroencephalogr. Clin. Neurophysiol. 106, 156–164 (1998).
38. Soltani, M. & Knight, R. T. Neural origins of the P300. Critical reviews in neurobiology 14, 199–224 (2000).
39. Wang, C., Ulbert, I., Schomer, D. L., Marinkovic, K. & Halgren, E. Responses of Human Anterior Cingulate Cortex Microdomains
to Error Detection, Conflict Monitoring, Stimulus – Response Mapping, Familiarity, and Orienting. J. Neurosci. 25, 604–613 (2005).
40. Nacher, V., Ledberg, A., Deco, G. & Romo, R. Coherent delta-band oscillations between cortical areas correlate with decision
making. Proc. Natl. Acad. Sci. 110, 15085–15090 (2013).
41. Szczepanski, S. M. et al. Dynamic Changes in Phase-Amplitude Coupling Facilitate Spatial Attention Control in Fronto-Parietal
Cortex. PLoS Biol. 12, e1001936 (2014).
42. Murakami, S., Hirose, A. & Okada, Y. C. Contribution of ionic currents to magnetoencephalography (MEG) and
electroencephalography (EEG) signals generated by guinea-pig CA3 slices. J. Physiol. 553, 975–85 (2003).
43. McCormick, Da & Bal, T. Sleep and arousal: thalamocortical mechanisms. Annu. Rev. Neurosci. 20, 185–215 (1997).
44. Kole, M. H. P., Hallermann, S. & Stuart, G. J. Single Ih Channels in Pyramidal Neuron Dendrites: Properties,
Distribution, and Impact on Action Potential Output. J. Neurosci. 26, 1677 LP–1687 (2006).
45. Eickhoff, S. B., Rottschy, C. & Zilles, K. Laminar distribution and co-distribution of neurotransmitter receptors in early human
visual cortex. Brain Struct. Funct. 212, 255–267 (2007).
46. Jones, E. G. Thalamic circuitry and thalamocortical synchrony. Philos. Trans. R. Soc. B Biol. Sci. 357, 1659–1673 (2002).
47. Burke, S. N. et al. Differential encoding of behavior and spatial context in deep and superficial layers of the neocortex. Neuron 45,
667–674 (2005).
48. Ray, S., Crone, N. E., Niebur, E., Franaszczuk, P. J. & Hsiao, S. S. Neural Correlates of High-Gamma Oscillations (60–200 Hz) in
Macaque Local Field Potentials and Their Potential Implications in Electrocorticography. J. Neurosci. 28, 11526–11536 (2008).
49. Canolty, R. T. et al. High Gamma Power Is Phase-Locked to Theta Oscillations in Human Neocortex. Science (80-.). 313, 1626–1628
(2006).
50. Larkum, M. A cellular mechanism for cortical associations: an organizing principle for the cerebral cortex. Trends Neurosci. 36,
141–151 (2013).
51. Jiang, H., Bahramisharif, A., van Gerven, M. A. J. & Jensen, O. Measuring directionality between neuronal oscillations of different
frequencies. Neuroimage 118, 359–367 (2015).
52. Yang, A. I. et al. Localization of dense intracranial electrode arrays using magnetic resonance imaging. Neuroimage 63, 157–165
(2012).
53. Dykstra, A. R. et al. Individualized localization and cortical surface-based registration of intracranial electrodes. Neuroimage 59,
3563–3570 (2012).
54. Blume, W. T. Drug effects on EEG. J. Clin. Neurophysiol. 23, 306–311 (2006).
55. Oostenveld, R., Fries, P., Maris, E. & Schoffelen, J.-M. FieldTrip: Open Source Software for Advanced Analysis of MEG, EEG, and
Invasive ElectrophysiologicalData. Comput. Intell. Neurosci. 2011, 1–9 (2011).
56. Rosenberg, J. R., Amjad, A. M., Breeze, P., Brillinger, D. R. & Halliday, D. M. The Fourier approach to the identification of functional
coupling between neuronal spike trains. Prog. Biophys. Mol. Biol. 53, 1–31 (1989).
SCIENtIfIC REports | (2018) 8:2055 | DOI:10.1038/s41598-018-20662-0 11www.nature.com/scientificreports/
Acknowledgements
The authors thank Terrence Sejnowski, Erica Johnson, Emília Tóth, Lopes Da Silva, Arnold Mandell, Bjorn
Merker, J.F. Bartscher, Qianqian Deng, ChunMao Wang, Adam Niese, and Ksenija Marinković for commentary,
feedback and/or technical support. This work was supported by the National Institutes of Health Grants
R01-MH-099645, R01-EB-009282, R01-NS-062092, K24-NS-088568, the U.S. Office of Naval Research Grant
N00014-13-1-0672, the MGH Executive Council on Research, Hungarian National Brain Research Program
grant KTIA_13_NAP-A-IV/1-4,6, EU FP7 600925 NeuroSeeker, and Hungarian Government grants KTIA-NAP
13-1-2013-0001, OTKA PD101754.
Author Contributions
S.C., E.H. and I.U. conceived of the study. I.U., J.M., L.E., S.C., E.H., D.F., O.D. and W.K.D. collected the data. M.H.
performed the analysis. M.H., S.C. and E.H. wrote the paper. All authors discussed and edited the manuscript.
Additional Information
Supplementary information accompanies this paper at https://doi.org/10.1038/s41598-018-20662-0.
Competing Interests: The authors declare that they have no competing interests.
Publisher's note: Springer Nature remains neutral with regard to jurisdictional claims in published maps and
institutional affiliations.
Open Access This article is licensed under a Creative Commons Attribution 4.0 International
License, which permits use, sharing, adaptation, distribution and reproduction in any medium or
format, as long as you give appropriate credit to the original author(s) and the source, provide a link to the Cre-
ative Commons license, and indicate if changes were made. The images or other third party material in this
article are included in the article’s Creative Commons license, unless indicated otherwise in a credit line to the
material. If material is not included in the article’s Creative Commons license and your intended use is not per-
mitted by statutory regulation or exceeds the permitted use, you will need to obtain permission directly from the
copyright holder. To view a copy of this license, visit http://creativecommons.org/licenses/by/4.0/.
© The Author(s) 2018
SCIENtIfIC REports | (2018) 8:2055 | DOI:10.1038/s41598-018-20662-0 12You can also read