KERALA - VADAKKUMNATHAN TEMPLE IN THRISSUR, KERALA - IBEF

Page created by Heather Banks
 
CONTINUE READING
KERALA - VADAKKUMNATHAN TEMPLE IN THRISSUR, KERALA - IBEF
KERALA

         VADAKKUMNATHAN TEMPLE IN THRISSUR, KERALA
                                                           March 2021
                         For updated information, please visit www.ibef.org
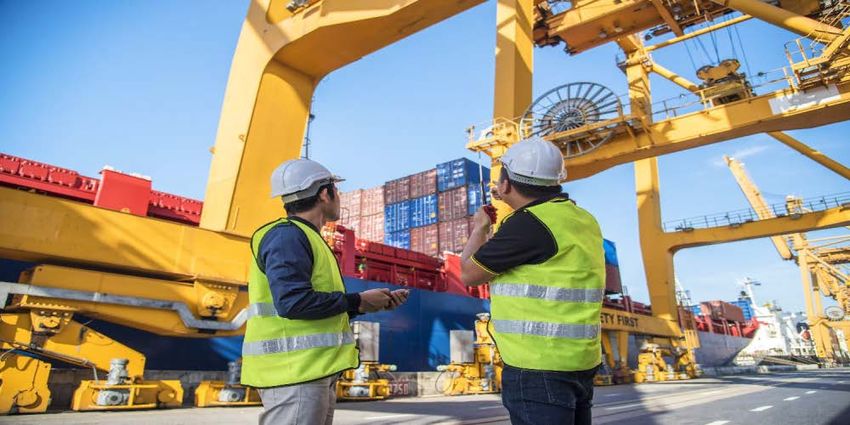
KERALA - VADAKKUMNATHAN TEMPLE IN THRISSUR, KERALA - IBEF
Table of Contents

        Executive Summary           3

        Introduction                5

        Economic Snapshot           10

        Physical Infrastructure     16

        Social Infrastructure       24

        Industrial Infrastructure   27

        Key Sectors                 33

        Key Procedures & Policies   39

        Appendix                    49

 2
KERALA - VADAKKUMNATHAN TEMPLE IN THRISSUR, KERALA - IBEF
Executive summary (1/2)

                     Cultural diversity and well-developed tourism sector
      1                  Kerala is known as God’s own country. It is one of the few states to have marketed its natural beauty successfully
                          to the leisure tourism sector. The state’s unique heritage and cultural diversity have helped attract tourists from
                          the world over.

                     Highest literacy and sex ratio
      2                  In December 2020, the ‘e-Keralam’ project was launched to increase internet awareness and achieve cent
                          percent e-literacy in the state.

                     Development projects
                         In December 2020, Kerala Government announced that development projects worth Rs. 10,000 crore (US$ 1.36

      3                   billion) will either be completed or launched in the state in the next 100 days. Of these, a total of 5,526 projects
                          will be completed or inaugurated, amounting to Rs. 5700 crore (US$ 774.89 million), and 646 projects worth Rs.
                          4,300 crore (US$ 584.57 million) will be launched.

 Source: Economic Review of Kerala 2014-15 and 2017-18, Kerala IT Policy, TEU’s = Twenty-foot Equivalent Unit, Ministry of Commerce and Industry, New Indian Express, State budget
 2018-19, Migration And Development Brief 27 by World Bank, Indian Port Trust.

 3
KERALA - VADAKKUMNATHAN TEMPLE IN THRISSUR, KERALA - IBEF
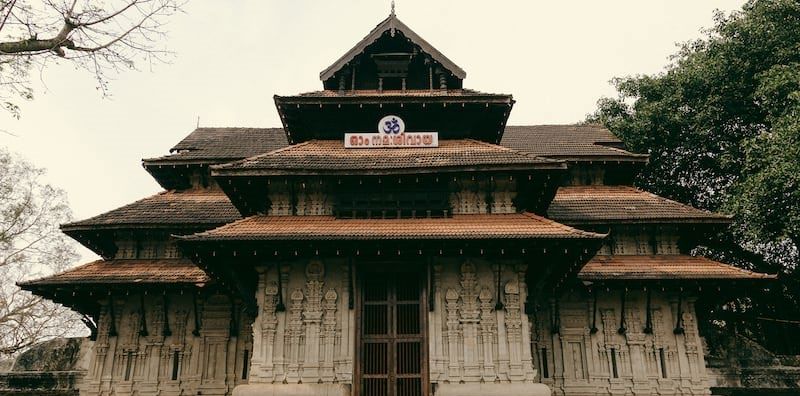
Executive summary (2/2)

                     First international container transshipment terminal
      4                  Kerala has the first international transhipment terminal in India, having a design capacity of around 4 million
                          TEUs & providing better connectivity between Kerala & other ports in India.

                     Presence of world class technology park
       5                  Kerala has been promoting knowledge-based industries such as IT/ITeS, computer hardware & biotechnology. It
                           is the first state having a technology park with CMMI level 4 quality certification & a world-class IT campus in
                           Thiruvananthapuram.

                      Cargo Traffic in Cochin Port
       6                  Cargo traffic handled by Cochin port stood at 34.03 million tonnes in FY20.

 Source: Economic Review of Kerala 2014-15 and 2017-18, Kerala IT Policy, TEU’s = Twenty-foot Equivalent Unit, Ministry of Commerce and Industry, New Indian Express, State budget
 2018-19, Migration And Development Brief 27 by World Bank, Indian Port Trust.

 4
KERALA - VADAKKUMNATHAN TEMPLE IN THRISSUR, KERALA - IBEF
INTRODUCTION

5
KERALA - VADAKKUMNATHAN TEMPLE IN THRISSUR, KERALA - IBEF
Kerala fact file

                                                                        Thiruvananthapuram

                                                                                   Capital                 860 persons per sq km               33.41 million
                                                                                                               Population density              total population

                                                                          38,863 sq.km.
                                                                            geographical area                                                16.02 million
                                                                                                                17.38 million
                                                                                                               female population             male population

                                                                                                                                               1,084
                                                                                                         administrative districts:             Sex ratio
                                                                             93.91%                                                     (females per 1,000 males)
                                                                             literacy rate                            14
     Key Insights

    Kerala is located along the coastline to the extreme south-west of the Indian peninsula, flanked by the Arabian Sea on the west and the mountains
     of the Western Ghats on the east. The state has a 580 km long coastline.

    Malayalam is the most commonly spoken language. Hindi, English and Tamil are the other languages used.

    Kochi, Kozhikode, Kollam, Thrissur, Alappuzha, Palakkad, Thalassery, Ponnani and Manjeri are some of the key cities in the state.

    There are 44 rivers flowing through Kerala, the major ones being Periyar (244 km), Bharathapuzha (209 km) and Pamba (176 km). Out of these 44
     rivers 41 are west flowing and 3 are east flowing.

  Source: Kerala at a glance, Economic Review of Kerala,2014-15, Government of Kerala website, Census 2011, Central Statistics Office

 6
KERALA - VADAKKUMNATHAN TEMPLE IN THRISSUR, KERALA - IBEF
Advantage: Kerala

            Leader in tourism                                                 Policy and
            In 2019(P), 18.30 million domestic tourists                      infrastructure support
             and 1.18 million foreign tourists arrived in
                                                                               Kerala has a wide range of fiscal and policy incentives for
             Kerala.
                                                                                businesses under the Industrial and Commercial Policy and
            BBC Travel survey has rated Kerala as the                          has well-drafted sector-specific policies.
             top favourite tourist destination among
                                                                                               In October 2020, Kerala's first and nation's
             foreign travellers.
                                                                                                twentieth mega food park was inaugurated in
                                                                                                Palakkad district. The park is expected to
                                                                                                create ~5,000 direct and indirect jobs and
                                                                                                benefit ~25,000 farmers.

 High economic growth
 •   Kerala’s gross state domestic                                                                            Rich pool of skilled labour
     product (GSDP) surged at a                                                                               •   Kerala has a large base of skilled
     CAGR of 11.72% between 2015-                                                                                 labour, making it an ideal
     16 and 2020-21.                                                                                              destination for knowledge-intensive
 •   Kerala is the leader in rubber                                                                               sectors.
     production; high demand of                                                                               •   The state has the highest literacy
     rubber has opened up immense                                                                                 rate in the country.
     opportunities for the state in the                                                                       •   It has a large pool of semi-skilled
     rubber industry.                                                                                             and unskilled labourers.

 Source: Ministry of Statistics and Programme Implementation, News articles

 7
KERALA - VADAKKUMNATHAN TEMPLE IN THRISSUR, KERALA - IBEF
State vision 2030

                                                                6 Agriculture &
     1 Industry
      Increase the share of manufacturing to
                                                                livestock
       10% of the GSDP by 2030.                                  Shift from subsistence farming to
      Sustained increase in employment in                        highly     knowledge      intensive,
       manufacturing.                                             competitive farming.
                                                                 Self sufficiency in supply of fish,
                                                    1   6         meat, milk and other dairy
                                                                  products to the local market.

     2 Transport                                                   5 Health
      Green, sustainable and                                       Increase health expenditure to
       safe transport.
                                                2           5        GSDP ratio from 0.6% in 2012 to 4-
                                                                     5% by 2027−31.
                                                                    Set up three medical cities by 2030.
                                                                    Provide health insurance cover to
                                                                     all.

     3 Energy
      Affordable and clean power to all.           3   4       4 Education
      Exploit the full potential of hydro-                          Provide high quality education
       electric generation.                                           at affordable rates.
      100% electrified households with                              Create a global brand name in
       24*7 availability.                                             education and develop into a
                                                                      knowledge hub by 2030.

 8
KERALA - VADAKKUMNATHAN TEMPLE IN THRISSUR, KERALA - IBEF
Kerala in figures

     Kerala’s Contribution to Indian Economy (2018-19)                                       Physical Infrastructure in Kerala

 GSDP     GSDP as a percentage of all states’ GSDP                                                   Installed power capacity (MW) (as of February 2021)
          India: 100.0 | Kerala: 4.02
                                                                                                     India: 379,130.41 | Kerala: 5,836.95
          GSDP growth rate** (%)                                                                     Wireless subscribers (million) (as of January 2021)
          India: 11.5 | Kerala: 11.72                                                                India: 1,163.41 | Kerala: 44.81

          Per capita GSDP* (US$)                                                                     Internet subscribers (million) (as of June 2020)
          India: 1,877.36 | Kerala: 3,329.12                                                         India: 749.07 | Kerala: 27.45

     Social Indicators
                                                                                                     National highway length (km) (as of September 2019)
                                                                                                     India: 132,499.5 | Kerala: 1,781.6
          Literacy rate (%)
          India: 77.7 | Kerala: 96.2                                                                 Major and minor ports (No.)
                                                                                                     India: 13+187 | Kerala: 1+17
           Birth rate (per 1,000 population) (2018)
           India: 20 | Kerala: 13.9                                                                  Airports (No.)
     Industrial Infrastructure
                                                                                                      India: 153 | Kerala: 4

          Operational PPP projects (No.) (December 2019)                                      Investments (as of September 2020)

          India: 1824 Kerala: 33
                                                                                                      Cumulative FDI equity inflows (From October
                                                                                                      2019 to December 2020) (US$ million)
          Exporting SEZs (No.) (as of February 2020)
          India: 240 | Kerala: 19                                                                     India: 75,351.56 | Kerala: 263.53

 PPP: Public-Private Partnership, SEZ: Special Economic Zone, SRS: Sample Registration System, * - Including Lakshadweep

 9
KERALA - VADAKKUMNATHAN TEMPLE IN THRISSUR, KERALA - IBEF
ECONOMIC SNAPSHOT

10
Economic snapshot – GSDP

                              GSDP of Kerala at current prices                                                                          Per Capita GSDP of Kerala at current prices

       140.0                                        CAGR 11.72%                                                           12    3,500                                                                                                                    300000
                                                                                                                                                                CAGR (in Rs.) 10.50%

                                                                                                         132.7

                                                                                                                                                                                                                                     3,329
                                                                                                                                                                                                                 3,234
       120.0                                                                                                                    3,000

                                                                                         125.3

                                                                                                                                                                                       3,156
                                                                                                                          10                                                                                                                             250000

                                                                                                                    9.8

                                                                                                                                                                                                                                               245,323
                                                                         110.6

                                                                                                                                                                  2,757
                                                       108.7
       100.0                                                                                                                    2,500

                                                                                                                                                                                                                           227,979
                                                                                                   8.8
                                                                                                                          8                                                                                                                              200000

                                                                                                                                            2,514
                                    94.6

                                                                                                                                                                                                 203,399
                                                                                   7.7
         80.0
                    85.9

                                                                                                                                2,000

                                                                                                                                                                            184,979
                                                                 7.0

                                                                                                                          6                                                                                                                              150000

                                                                                                                                                      164,554
                                              6.3

         60.0
                              5.6

                                                                                                                                1,500
                                                                                                                          4                                                                                                                              100000
         40.0                                                                                                                   1,000

         20.0                                                                                                             2
                                                                                                                                 500                                                                                                                     50000

          0.0                                                                                                             0
                                                                                                                                    0                                                                                                                    0
                    2015-16

                                    2016-17

                                                       2017-18

                                                                         2018-19

                                                                                         2019-20

                                                                                                         2020-21E

                                                                                                                                            2015-16

                                                                                                                                                                  2016-17

                                                                                                                                                                                       2017-18

                                                                                                                                                                                                                 2018-19

                                                                                                                                                                                                                                     2019-20
                                              US$ billion              Rs. trillion                                                                                                   US$                  Rs.
         At current prices, Kerala’s Gross State Domestic Product                                                              The state’s per capita GSDP stood at Rs. 245,323 (US$ 3,329)
          (GSDP) was about Rs. 9.78 trillion (US$ 132.7 billion) in 2020-                                                        in 2019-20.
          21.
                                                                                                                                Per capita GSDP increased at a CAGR of 10.50% between
         The state’s GSDP recorded a CAGR of 11.72% between 2015-                                                               2015-16 and. 2019-20.
          16 and 2020-21.

 Note: E - Estimate
 Source: Directorate of Economics and Statistics of Kerala, Per Capita GSDP^ - calculated using GSDP million US$/Population in million

 11
Economic snapshot – NSDP

                         NSDP of Kerala at current prices                                                                   NSDP per capita of Kerala at current prices

       120.00                           CAGR (in Rs.) 11.18%                                                     9   3,500.00                                                                        250,000
                                                                                                                                             CAGR (in Rs.) 10.63%
                                                                                                                 8
       100.00                                                                                                        3,000.00

                                                                                                104.91

                                                                                                                                                                                            221904
                                                                                                          7.73
                                                                                                                                                                                                     200,000

                                                                                                                                                                                          3,011.31
                                                                               101.14
                                                                                                                 7

                                                                                                                                                                               2,917.54
                                                           98.08

                                                                                                                                                                               205,657
                                                                                                                                                                 2,843.32
                                                                                         7.13
                                                                                                                     2,500.00
         80.00                                                                                                   6

                                                                                                                                                               183,252
                                          85.05

                                                                     6.32

                                                                                                                                                  2,477.95
                                                                                                                                                 166,246
                       77.29

                                                                                                                                                                                                     150,000
                                                    5.71

                                                                                                                                  2,262.95
                                                                                                                 5   2,000.00

                                                                                                                                 148,133
         60.00
                                 5.06

                                                                                                                 4
                                                                                                                     1,500.00                                                                        100,000
         40.00                                                                                                   3
                                                                                                                     1,000.00
                                                                                                                 2
         20.00                                                                                                                                                                                       50,000
                                                                                                                 1    500.00
          0.00                                                                                                   0       0.00                                                                        0
                       2015-16

                                          2016-17

                                                           2017-18

                                                                               2018-19

                                                                                                2019-20

                                                                                                                                 2015-16

                                                                                                                                                 2016-17

                                                                                                                                                               2017-18

                                                                                                                                                                               2018-19

                                                                                                                                                                                          2019-20
                                         US$ billion            Rs. trillion                                                                                 US$         Rs.

         At current prices, Kerala’s net state domestic product (NSDP)                                               Kerala’s per capita NSDP was Rs. 221,904 (US$ 3,011) in
          was ~Rs. 7.73 trillion (US$ 104.91 billion) in 2019-20.                                                      2019-20.
         The state’s NSDP increased at a CAGR of 11.18% between                                                      Per capita NSDP of the state expanded a CAGR of 10.63%
          2015-16 and 2019-20.                                                                                         between 2015-16 and 2019-20.

 Note: Conversion rate used as per slide 52, P ‐ Provisional Estimate‐ Q‐ Quick Estimate
 Source: “Advanced Estimates” provided by Directorate of Economics and Statistics of Kerala,

 12
Economic snapshot – % distribution of GSVA

   In 2019-20, the tertiary sector contributed 64.76% to the state’s               Visakhapatnam
                                                                                          GSVA composition
                                                                                                  port trafficby
                                                                                                              (million
                                                                                                                 sectortonnes)
    gross service value added (GSVA) at current prices, followed by the
    secondary sector contributing 24.79% and primary sector
                                                                             100%
    contributing 10.45%.                                                                                     CAGR
   The tertiary sector increased at a CAGR of 10.91% between 2015-16        90%
    and 2019-20. This was driven by storage, transport, financial and
                                                                             80%
    real estate segments.

   The secondary sector grew at an average rate of 9.28% between            70%             61.88%
                                                                                                             10.91%       64.76%
    2015-16 and 2019-20. This was led by manufacturing, construction,
                                                                             60%
    electricity, gas and water supply segments.
                                                                             50%
   The primary sector expanded at an average rate of 3.88% between
    2015-16 and 2019-20, mainly supported by growth across agriculture       40%
    and mining and quarrying segments.
                                                                             30%
                                                                                             25.14%          9.28%
                                                                                                                          24.79%
                                                                             20%

                                                                             10%
                                                                                             12.98%          3.88%        10.45%
                                                                              0%
                                                                                             2015-16                      2019-20

                                                                                    Primary Sector     Secondary Sector   Tertiary sector

 Source: Directorate of Economics and Statistics of Kerala Economic Survey

 13
Economic snapshot – FDI inflow & investments

   According to the Department for Promotion of Industry and Internal                                          FDI* equity
                                                                                                         Visakhapatnam  portinflow
                                                                                                                              traffic(US$  billion)
                                                                                                                                      (million  tonnes)
    Trade (DPIIT), the cumulative FDI inflows in Kerala were valued at
    US$ 263.53 million between October 2019 and December 2020.                                    3.50

   The state Government has sanctioned investments of US$ 100                                                                                                                            2.94
                                                                                                  3.00                                                                            0.74
    million, US$ 156 million and US$ 8.3 million for the Vizhinjam
    International Seaport project, Kochi Metro Rail Project and for land
    acquisition for Kozhikode and Thiruvananthapuram international                                2.50
    airports, respectively.
                                                                                                  2.00                                                                    0.13
   In October 2019, state attracted around Rs. 10,000 crore (US$ 1.43
    billion) investment from different investors belonging from Dubai.
                                                                                                                                                                   0.21
                                                                                                  1.50
   In 2020, ten investment intentions under IEMs worth Rs. 382 crore
    (US$ 52.70 million) have been proposed in the state.                                                                                                    0.45
                                                                                                  1.00                                              0.09
                                                                                                                                   0.07 0.23
                                                                                                         0.37               0.07
                                                                                                  0.50

                                                                                                                     0.47
                                                                                                  0.00

                                                                                                                     FY12

                                                                                                                            FY13

                                                                                                                                    FY14

                                                                                                                                             FY15

                                                                                                                                                     FY16

                                                                                                                                                            FY17

                                                                                                                                                                   FY18

                                                                                                                                                                           FY19

                                                                                                                                                                                   FY20
                                                                                                         FY01-FY11

                                                                                                                                                                                           FY01-FY20
                                                                                                                                           Annual FDI inflow

 Note: * - Including Lakshadweep, IEM - Industrial Entrepreneurs Memorandum
 Source: DPIIT - Department for Promotion of Industry and Internal Trade, Government of Kerala,

 14
Economic snapshot – Kerala’s export trends

                            Export Trend (US$ billion)                                Composition of Key Items Exported from Kerala (FY21*)

        12.00
                                                                                                                               Marine Products

        10.00                                                                                             15%
                                                               10.15
                                                 9.77                                                                          Spices

         8.00                                                                                                     11%
                                                                                                                               Petroleum Products
                                   7.31
         6.00                                                                            59%                          5%       Cashew
                                                                                                                     4%
                     4.89
         4.00
                                                                                                                               Other Rubber Products
                                                                                                                                  excpt Footwears
                                                                                                                3%
                                                                             3.00
         2.00                                                                                             2%                   Other Commodities

         0.00                                                                                                                  Others
                   2016-17       2017-18       2018-19       2019-20       2020-21*

  Exports from the state stood at US$ 3.36 billion in FY21*.

  Kerala exported two key items including marine products and spices in FY21*.

  In FY21*, the total marine products exports from Kerala accounted for US$ 511.52 million, which was 15.21% of the total exports.

 Note: * - until January 2021
 Source: Directorate General of Commercial Intelligence and Statistics (DGCIS)

 15
PHYSICAL INFRASTRUCTURE

16
Physical infrastructure – Roads

           Expenditure on road works under PMGSY in Kerala                                     Roads in Kerala
                             (US$ million)
                                                                                                Road type                                           Road length (km)
      30.00
      25.00
                                                25.57          24.10                            National highways (Up to March
      20.00                                                                                                                                                   1,782
                  21.57          21.52                                                            2019)
      15.00
      10.00                                                                   14.04
                                                                                                State highways                                              4,341.65
       5.00
       0.00
                 2014-15        2015-16        2016-17        2017-18        2018-19^
                                                                                                Major district roads                                        27,470.45

   Under the State Budget 2020-21, the government has allocated Rs.
    1,251 crore (US$ 170.5 million) towards road transport.
                                                                                              Road work completion under PMGSY
   In October 2020, Union Minister for Road Transport, Highways and
    MSMEs, Mr. Nitin Gadkari inaugurated and laid the foundation stone
                                                                                                Year                                       Road works (No)
    for 8 National Highway projects in Kerala. He announced that as part
    of Bharatmala Pariyojana, 35,000 km of National Highways are being                          2014-15                                               118
    constructed. Out of this, as part of Bharatmala Pariyojana in the state,
    1,234 km of National Highways are being built.                                              2015-16                                               155

   In February 2021, Prime Minister Mr. Narendra Modi launched the                             2016-17                                               126
    ‘Smart Roads’ project in Thiruvananthapuram that will be undertaken
                                                                                                2017-18                                               60
    at an estimated cost of Rs. 427 crore (US$ 58.91 million). It
    envisages conversion of 37 kms of existing roads to smart roads by                          2018-19                                               26
    bringing all overhead utilities underground and undertaking road and
    junction improvements.
 Note: PMGSY - Pradhan Mantri Gram Sadak Yojana
 Source: Kerala State Industrial Development Corporation Ltd.; Ministry of Road Transport & Highways, Government of Kerala, State budget 2020-21, NHAI, omms.nic.in
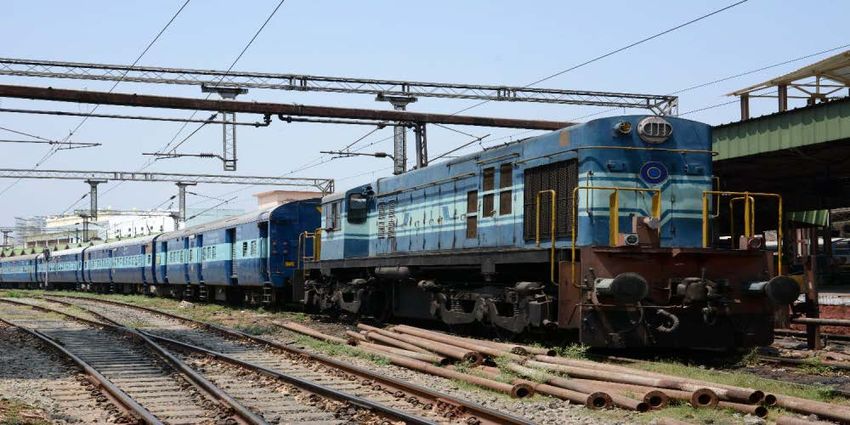
 17
Physical infrastructure – Railways

                                                                                              Kerala is well connected to other parts of the country via railways.
                                                                                               The State Government has appointed Kerala State Industrial
                                                                                               Development Corporation Ltd (KSIDC) as the nodal agency for
                                                                                               developing a project to establish a north-south High-speed Rail
                                                                                               Corridor (HSRC) to facilitate smooth and speedy passenger
                                                                                               movement between various cities and towns in the state.

                                                                                              Railway divisions in Thiruvananthapuram, Palakkad and Madurai
                                                                                               jointly carry out railway operations in Kerala.

                                                                                              As per State Budget 2020-21, new lines for Kochi Metro from Petta
                                                                                               to Thripunithura and from Jawaharlal Nehru Stadium to Kakkanad
                                                                                               Infopark are proposed at a cost of Rs. 3,025 crore (US$ 412.69
                                                                                               million).

                                                                  Source: Maps of India

 Source: Economic Review of Kerala, 2018-19, Kerala State Industrial Development Corporation Ltd, Government of Kerala, State Budget 2020-21

 18
Physical infrastructure – Airports

  Airport indicators (April-November)

                                               Aircraft movements                                      Passengers                     Freight
                                                      (in no)                                            (in no.)                     (in MT)

   Airport

                                           2019-20                 2020-21                   2019-20            2020-21     2019-20             2020-21

   Cochin                                   46,465                  12,142                   67,77,478          10,14,963   52,487              26,741

   Thiruvananthapuram                       19,213                   4,662                   26,63,899          3,81,536    18,587              10,088

    Kerala has three airports handling domestic and international flights, located at Thiruvananthapuram, Kochi and Kozhikode.

    Kannur Airport was inaugurated in December 2018, making Kerala India’s first state to have four international airports.

    In 2020-21, passenger traffic handled by the state stood at 10,14,963 from Cochin airport and 3,81,536 from Thiruvananthapuram airport.

 Source: Airports Authority of India, Kerala State Industrial Development Corporation Ltd.

 19
Physical infrastructure – Ports

  Traffic handled at Cochin Port                                                    Existing Ports

                             Cochin port trafic (million tonnes)                       Major ports             Cochin

        40.0                                                                                                Neendakara
        35.0                                                                           Intermediate ports    Alappuzha
        30.0

                                                                            34.04
                                                                                                             Kozhikode

                                                                    32.02
        25.0                                       29.14
                                      25.00

        20.0
                     22.09

        15.0                                                                                                  Vizhinjam
        10.0
                                                                                                             Valiyathura
         5.0
         0.0                                                                                                  Vadakara
                     FY16

                                     FY17

                                                   FY18

                                                                    FY19

                                                                            FY20
                                                                                                               Ponnani
                                                                                                            Thankasserry
                                                                                                            Kayamkulam
                                                                                                            Manakkodam
    Kerala has 18 ports, of which, Cochin is the major one. Furthermore,
                                                                                       Minor ports           Munambam
     there are three intermediate and 14 minor ports.
                                                                                                              Beypore
    The development activities of the port are taken care of by the                                         Thalasserry
     Department of Ports, Harbour Engineering Department and Harbour                                        Manjeswaram
     Engineering Department.                                                                                Neeleswaram
                                                                                                               Kannur
    Cargo traffic handled by Cochin port was 34.04 million tonnes in
                                                                                                              Azhikkal
     FY20.
                                                                                                             Kasaragode

 Source: Cochin Port Trust, News articles, India Port Association

 20
Physical infrastructure – Power

                                   Installed power capacity (MW)                                Breakup of installed capacity as per the source (2021)

        7,000.0
                                                                                                              6%
        6,000.0                                                                                        9%
                                                                                                                                       Thermal Power

                                                                                     5,836.95
                                                                          5,702.62
        5,000.0

                                                               5,083.37
                                                    5,074.72
                                         4,998.94

        4,000.0                                                                                                                        Hydro Power
                        4,172.00

                                                                                                                           53%
        3,000.0
                                                                                                                                       Renewable Energy
                                                                                                    32%
        2,000.0
                                                                                                                                       Nuclear Power
        1,000.0

             0.0

                                                                                     2021*
                        2016

                                         2017

                                                    2018

                                                               2019

                                                                          2020

 As of February 2021, the state had a total installed power generation capacity of 5,836.95 MW, of which 2,189.36 MW was accounted by state utilities,
  2,097.20 MW by central utilities and 1,550.39 MW by the private sector.

 As of February 2021, thermal power contributed 3066.96 MW (52.54%) to the total installed power generation capacity, followed by hydropower at
  1856.50 MW (31.80%), renewable power at 551.78 MW (9.45%) and nuclear power at 362.00 MW (6.20%).

 In February 2021, Prime Minister Mr. Narendra Modi inaugurated the 320 KV Pugalur (Tamil Nadu)-Thrissur (Kerala) power transmission project. The
  project, built at a cost of Rs. 5,070 crore, will facilitate the transfer of 2,000 MW power from the western region to meet the power needs of the state.

 In January 2021, Kochi airport commissioned two floating solar power plants with a combined capacity of 452 KWh to sustain the power needs of the
  airport.

  Note: MW- Megawatt     * - as of February 2021
  Source: State Budget 2020-21, Central Electricity Authority

 21
Physical infrastructure – Telecom

    Telecom Infrastructure (as of January 2021))                                             Performance status of Bharat Net Project

                                                                                             Service-ready GPs
     Wireless subscribers                                         44,815,439                                                            1,129
                                                                                             (November 2020)

     Wireline subscribers                                          1,255,536

     Teledensity (in%)                                               129.62

     Internet subscribers (million)                                  27.45

      As of January 2021, Kerala had an overall teledensity of 129.62%.

      According to the Telecom Regulatory Authority of India (TRAI), Kerala had 44.81 million wireless subscribers and 1.26 million wireline
       subscribers, as of January 2021.

      By end of January 2021, 14.89 million subscribers had submitted requests for mobile number portability in Kerala since its inception.

      As of June 2020, Kerala had 27.45 million internet subscribers.

 Source: Telecom Regulatory Authority of India, Ministry Of Communications And Information Technology, GP - Gram Panchayat

 22
Physical infrastructure – Urban development

 List of cities in Kerala covered under AMRUT                                                                               Cumulative expenditure (US$
                                                                                           Projects & Programmes
                                                                                                                                      million)
   Cities                                                Area (sq. km)
                                                                                           Urban Transport Improvement                 22.15
   Kochi                                                      94.88
   Kollam                                                     58.18
   Kozhikode                                                   128                         Solid Waste Management Project              4.23
   Thiruvananthapuram                                         2,192
   Thrissur                                                   101.4                        Water Supply                                14.50
   Alappuzha                                                  1,414
                                                                                           Sewage and Sanitation                       21.97
   Palakkad                                                   1,363
   Guruvayur                                                  29.66
                                                                                           Community Development Fund                  11.12
   Kannur                                                     2,961

   The Kerala urban area comprises of five Municipal Corporations and 60 Municipalities. The Kerala Sustainable Urban Development Project
    (KSUDP) is an Asian Development Bank-assisted project covering the five municipalities of Thiruvananthapuram, Kochi, Kozhikode, Kollam and
    Thrissur. The project focuses on urban infrastructure improvement, community upgrading, local Government infrastructure development and
    capacity building, and implementation assistance.

   Along with smart cities, nine cities of Kerala have also been selected for infrastructure development under the Atal Mission for Rejuvenation and
    Urban Transformation (AMRUT) scheme. As per the State Budget 2020-21, the government allocated Rs. 400 crore (US$ 54.57 million) for ‘Smart
    City Mission’ and Rs. 700 crore (US$ 95.49 million) for AMRUT.

   In February 2021, Prime Minister Mr. Narendra Modi laid the foundation stone of the integrated command and control centre, which is projected to
    be built at a cost of Rs. 94 crore (US$ 12.97 million). It is being set up to host smart solutions for Thiruvananthapuram Municipal Corporation and
    will act as a common point of action during emergency situations to facilitate coordinated action.

   In February 2021, Chief Minister Mr. Pinarayi Vijayan launched the ‘Kochi Water Metro’ project to connect the islands around the city via boats.
    The first route connecting Vyttila and Kakkanad was inaugurated with the launch.

 Source: JNNURM, Ministry of Urban Development, Business Standard, Kerala Budget 2020-21

 23
SOCIAL INFRASTRUCTURE

24
Social infrastructure – Education

                                                                                         AICTE Approved Education Statistics (2020-21)
   Kerala has the highest literacy rate among all states in the country. It
    had 12,961 schools as of FY19. Of these, 4,695 (36.22%) were
    government schools, 7,216 (55.68%) were aided schools and the                                          Undergraduate         Postgraduate        Diploma
    remaining 1,050 (8.1%) were unaided schools.

   Under the State Budget 2020-21, the government proposed Rs.                           Total
                                                                                                                  185                   196            110
                                                                                          Institutions
    20,862 crore (US$ 2.84 billion) towards education sector, of which
    Rs. 4,268 crore (US$ 582.29 million) has been allocated as
                                                                                          Total
    assistance to non-government primary schools and Rs. 2,337 crore                                            54370               18626             27281
                                                                                          Intake
    (US$ 318.84 million) has been allocated for government primary
    schools.
                                                                                          Faculties             16700               2623               446
   Kerala Government in the State Budget 2020-21 launched ‘Local
    Employment Assurance Programme’ (LEAP) to provide employment
    to 1.5 lakh people per year through local self-government institutions.                                                                       Share of total
                                                                                          Nature of schools                Student strength
   In 2020-21, Kerala had a total of 353 AICTE-approved institutes.                                                                            student strength
                                                                                          (2019-20)                           (in million)
                                                                                                                                                      (%)
   In February 2021, Chief Minister Mr. Pinarayi Vijayan inaugurated
    India’s first digital university, housed on a 10-acre campus in                       Government                             1.17                 31.4
    Technocity, Mangalapuram.
                                                                                          Government-aided                       2.16                 58.1
   In October 2020, Union Minister for Education, along with Chief
    Minister of Kerala, laid the foundation stone for the main campus and                 Unaided                                0.39                 10.5
    inaugurated Nila Campus of IIT Palakkad, Kerala.
                                                                                          Total                                  3.72                100.0

  Note: P: Provisional
 Source: State Budget 2020-21, Economic Review of Kerala 2019, Economic Survey 2018-19, Ministry of Human Resource Development

 25
Social infrastructure – Health

Health infrastructure (as of May 2020)                                                   Health indicators (2018)

                                                                                                    (1)
  Primary health centres                                           958                    Birth rate                                    13.9

                                                                                                       (1)
                                                                                          Death rate                                    7.1
  Sub-centres                                                     5,868
                                                                                                              (2)
                                                                                          Infant mortality rate                          7

  Community health centres                                         234
                                                                                         Life expectancy at birth (years) (2014-18)

  District hospitals                                                61
                                                                                          Male                                          71.4

  Sub - District Hospitals                                         373                    Female                                        76.3

  The departments that offer health services in the state & are responsible for development activities are namely, Health Services Department, Medical
   Education Department, Ayurveda Department (ISM), Ayurveda Medical Education Department, Homoeopathy Department & Homoeopathy Medical
   Education Department.

  Under the State Budget 2020-21, the government has allocated Rs. 2,440 crore (US$ 332.92 million) for urban health services and Rs. 945 crore (US$
   128.89 million) rural health services.

  As of May 2020, the state had 234 community health centres, 958 primary health centres and 5,868 sub-centres.

  In November 2020, a committee has been formed to study the assessment for setting up a COVID-19 vaccine manufacturing unit in the state.

  Note: (1)Per thousand persons, (2)Per thousand live births
  Source: Economic Review of Kerala, 2019, State Budget 2020-21, NHRM, Sample Registration System (SRS)

 26
INDUSTRIAL INFRASTRUCTURE

27
Industrial infrastructure…(1/2)

   Infrastructure                       Project description

                                         The Technopark at Thiruvananthapuram is spread over 760 acres.

                                         It currently hosts over 300 IT and ITeS companies, employing over 46,000 IT professionals.

                                         Technopark Phase-II has been declared an SEZ by the Government of India.
   Technopark
                                         The technology park is spread across 7.2 million sq. ft. built-up space (completed) and 3.5 million sq. ft. (work-in-
                                          progress)

                                         As a part of the Phase-IV, named Technocity, Technopark is developing 431 acres of land in Pallippuram, 5 km
                                          north of the main campus on the National Highway-47 to Kollam.

                                         The Infopark at Kochi is best suited for ITeS due to its proximity to the submarine optical-cable landings.
   Infopark                              The total land available with Infopark is 98.25 acres, of which 75 acres has been notified as an SEZ by the Ministry
                                          of Commerce, Government of India.

                                         Apart from the SEZs in Technopark and Infopark, the other SEZs in Kerala include the KINFRA Electronics Park
                                          SEZ in Kalamassery; a multi-product SEZ at Kochi; two port-based SEZs at Vallarpadam and Puthuvypeen at
   Special Economic Zones
                                          Kochi; a food processing SEZ near Calicut; a pulp and paper SEZ at Kottayam; and a non-conventional energy
                                          sources SEZ at Kalamassery.

 Source: http://www.technopark.org/, sezindia.nic.in

 28
Industrial infrastructure – Industrial clusters…(2/2)

  District                       Industries

  Kannur                         Handlooms, power looms, beedi

  Alappuzha                      Coir products

  Idukki                         Agriculture and forest based

  Thiruvananthapuram             Handlooms, IT

  Thrissur                       Power looms, handlooms, textile, timber, tile, canning

  Palakkad                       Power looms, sericulture

  Kollam                         Minerals and mining

  Kozhikode                      Rubber

  Wayanad                        Minerals and mining

  Kasargod                       Minerals and mining

  Kottayam                       Rubber, food products, engineering

  Ernakulam                      IT

 29
Special economic zones (SEZ)…(1/3)

                    Kerala State
                    Information                                              KSITI, Kasargod
                    Technology
                    Infrastructure Limited                            Kerala Industrial Infrastructure Development Corporation Limited (KINFRA)
                    (KSITI), Kannur

                  KINFRA, Kakkancherry

  Infopark
                                                                                                             Hindustan News Print
  Cochin Port Trust, Puthuvypeen
                                                                                                             Limited
  Cochin Port Trust, Vallapadom
  KINFRA, Kochi                                                                                              KSITI, Pallipuram

  Unitech Real Estate                                                                                        KSITI, Purakkad
  Parsavnath Developers
                                                                                                             Electronics
  Smart City Infrastructure                                                                                  Technology Park
  Carborundum Universal Limited                                                                              KINFRA
  MM Tech Towers, Alwaye                                                                                     Techno Park SEZ - I
                                                     KSITI, Kollam
  Emmar MGF, Alwaye                                                                                          Technopark
                                                                                                             Pallipuram
                                                                                                             Techno Park SEZ - II

 Source: Ministry of Commerce & Industry, Government of India,

 30
Special economic zones (SEZ)…(2/3)

  Name/Developer                                                                        Location                       Primary industry
  Cochin SEZ                                                                            Cochin                         Multi-product
  Cochin Port Trust                                                                     Vallapadom                     Port-based
  Cochin Port Trust                                                                     Puthuvypeen                    Port-based
  Infopark                                                                              Kakkanad                       IT/ITeS
  Electronics Technology Parks - Kerala                                                 Attipura                       IT/ITeS
  KINFRA                                                                                Ayiroopara                     Animation & Gaming
  KINFRA                                                                                Chelembra                      Agro-based food processing
  Electronics Technology Parks- Kerala                                                  Thiruvanthapuram               IT/ITeS

  KINFRA                                                                                Thrikkakara                    Electronics industries

  Kerala State Information Technology Infrastructure Limited                            Pallipuram                     IT/ITeS
  Electronics Technology Parks Kerala (Technopark)                                      Attipura                       IT/ITeS
  Kerala State Information Technology Infrastructure Limited                            Mulavana                       IT/ITeS
  Carborundum Universal Ltd.                                                            Thrikkakara North              Solar Photovoltaic
  Sutherland Global Services Private Limited                                            Thrikkakara North              IT/ITeS
  Kerala State Information Technology Infrastructure Limited (KSITIL)                   Pantheerankavu and Nellikode   IT/ITeS
  Infoparks Kerala                                                                      Puthencruz and Kunnathunadu    IT/ITeS
  Smart City (Kochi) Infrastructure Limited                                             Kakkanad                       IT/ITeS
  Kerala State IT Infrastructure Ltd. (KSITIL)                                          Thrissur                       IT/ITeS
  Uralungal Labour Contract Cooperative Society Limited (ULCCS LTD)                     Kozhikode                      IT/ITeS

 Source: Ministry of Commerce & Industry, Department of Commerce, SEZ: Special Economic Zone

 31
Special economic zones (SEZ)…(3/3)

 Some of formally approved SEZs in Kerala

  Name/Developer                                                                               Location                   Primary industry

  Cochin Port Trust                                                                            Vallarpadam                Port-based

  Cochin Port Trust                                                                            Puthuvypeen, Ernakulam     Port-based

                                                                                               Kazhakoottam,
  KINFRA                                                                                                                  Electronics Industries
                                                                                               Thiruvananthapuram

  Smart City (Kochi) Infrastructure Pvt Ltd                                                    Kakkanad, Ernakulam        IT/ITeS

                                                                                                Pantheerankavu
  Kerala State Information Technology Infrastructure Ltd (KSITIL)                                                         IT/ITeS
                                                                                               and Nellikode, Kozhikode

  Infoparks, Kerala                                                                            Kunnathunad, Ernakulam     IT/ITeS

  Cochin International Airport Ltd                                                             Ernakulam                  Airport-based

    Under SEZ Act, 2005, Kerala has 29 formally approved SEZs, 25 notified SEZs and 19 exporting SEZs.

 Source: Ministry of Commerce & Industry, Department of Commerce, SEZ: Special Economic Zone

 32
KEY SECTORS

33
Key sectors – Agriculture and allied sectors

                                                                                              Area and production of horticulture crops (2019-20)
   Kerala is one of the leading pepper and rubber producers in the
    country. Kerala is the leader in rubber production in the country.
    State accounted for about 78% share in the total natural rubber                                 Year                    Area (‘000 Ha)                 Production (‘000 MT)
    production in 2017-18. Natural Rubber production in Kerala stood at
    551 thousand MT during 2017-18.                                                                 Fruits                      310.36                               1731.44
                                                                                                Vegetables                      93.08                                2757.05
   Kerala can be termed as the land of spices, considering the large
    variety of spices grown in the state. Kerala is the largest producer                           Spices                       162.56                                 178.82
    of pepper in India and accounts for a lion’s share in India’s
                                                                                                 Plantation                     971.29                               5505.84
    production. Apart from pepper, other spices produced in the state
    include ginger, cardamom, nutmeg, tamarind, etc. During 2019-20                             Aromatics &
                                                                                                                                 0.01                                      0.00
                                                                                                 Medicinal
    (till Sept 19), spices export from the state stood at US$ 208.89
    million.                                                                                       Honey                          -                                        1.70

   As per the State Budget 2020-21, the government has allocated
    funds worth Rs. 1,000 crore (US$ 136.43 million) for Idukki
                                                                                                             Export of Spices from the state (US$ million)
    package/spice park and organic farming initiatives.

   In 2019-20, the total production of horticulture crops in the state                               600

    was expected to be 10219.76 thousand metric tonnes and area                                       500
                                                                                                                                 534.36
    under production was 1590.56 thousand hectares. In 2019-20, the                                   400
                                                                                                                                                               414.72
                                                                                                      300                                                                         381.70
    total production of vegetables and fruits were estimated at 2757.05                                         327.91                       327.71
                                                                                                      200
    thousand metric tonnes and 1731.44 thousand metric tonnes,
                                                                                                      100
    respectively.
                                                                                                         0

                                                                                                                  2016-17

                                                                                                                                   2017-18

                                                                                                                                                                 2019-20

                                                                                                                                                                                    2020-21
                                                                                                                                               2018-19^^
 Note: * -Production in canegur, ^^- Production in 000 bales of 170 kg
 Source: Kerala, Department of Agriculture Cooperation And Farmers Welfare, Directorate General of Commercial Intelligence and Statistics (DGCIS), State Budget 2020-21

 34
Key sectors – IT and electronics…(1/2)

   Kochi has emerged as a unique IT destination and is connected by two
                                                                                                    Export and investment from Technopark (US$ million)
    submarine cables and satellite gateways that directly support major IT
    cities, including Bengaluru. Kerala possesses a cost-effective and
    highly skilled human resource base with the lowest attrition rate (less                                                  2016-17          2017-18    2018-19
    than 5%). Around 11% of the national IT pool is contributed by skilled
    human resources from Kerala. The state also has ample availability of
    skilled and semi-skilled workers for the electronics industry.                                   Exports                 745.27           1,001.09   1,001.57
   Operational costs in the state are among the lowest in India (40%
    lower as compared to other major IT locations in India). Also,
    rental/real estate costs are lower than major IT cities in the country.                          Investments             740.80           771.14     712.41
   The state has a techno park in Thiruvananthapuram which has been
    instrumental in attracting global electronics manufacturers, an info park
    in Kochi, and a cyber park in Kozhikode As per ASSOCHAM, Kerala
    ranked 3rd in attracting the highest total investments in IT sector worth
    US$ 0.33 millon among all Indian states. Kerala also has a strong e-
    governance infrastructure and is a leading state in e-governance.

   The electronic hub proposed at Kochi is a prestigious project of the
    Government of Kerala to promote electronic hardware manufacturing
    and assembling units and R&D centres, and to support infrastructure
    for the same.

 Note: Data Taken from lok sabha, frequency of update is unknown
 Source: Kerala IT Policy 2012, Economic Review of Kerala 2019, State Annual Plan, sezindia.nic.in, State budget 2020-21, Business Standard

 35
Key sectors – IT and electronics…(2/2)

                                     Traco Cable Company Limited commenced operations in 1964. It manufactures high-quality cables and wires in
                                     technical collaboration with Kelesey Engineering Co Ltd, Canada. TRACO currently meets the needs of public sector
                                     undertakings in India such as railways and the electricity boards of various states. The company is headquartered in
       Traco Cable Co Ltd            Kochi and has factories in Ernakulam, Kannur and Thiruvalla.

                                     TELK was incorporated in 1963 under an agreement with the Government of Kerala, Kerala State Industrial
                                     Development Corporation, and Hitachi Limited, Japan. It manufactures transformers, bushings and tap changing
                                     gears. The factory and corporate office are located in Angamally, near Kochi.
        Transformers and
      Electricals Kerala Ltd         TELK provided its first 400 KV Class Transformer, 315 MVA Auto Transformer and Generator Transformer to India's
              (TELK)                 first 500 MW Thermal Unit.

                                      Founded in 1973, Keltron is a state-owned electronics enterprise, employing around 1,800 people and has 10
                                      manufacturing centres. It provides technical manpower to leading organisations such as Oil and Natural Gas
                                      Corporation Limited (ONGC). The company’s products span categories including aerospace electronics, security and
                                      surveillance systems, intelligent transportation systems, strategic electronics products, IT solutions, IT infrastructure
  Kerala State Electronics            solutions, process automation, ID card projects, power electronics, electronic components and TE units.
    Development Corp
         (Keltron)                    Keltron is headquartered in Thiruvananthapuram and has training centres in 30 locations across Kerala with a strong
                                      infrastructure spread over 700,000 sq ft of built up area.

                                     Collabera is a fast-growing, end-to-end information technology services and solutions provider, working with leading
                                     global 2,000 organisations from banking and financial services, communications, media, manufacturing, retail, energy
                                     and utilities domains. The company employs over 9,000 professionals across more than 25 offices and four world-
           Collabera                 class delivery centres in the US, the UK, India, Singapore and Philippines. The company has an office at Technopark,
                                     Thiruvananthapuram.

 Source: Company website and annual report

 36
Key sectors – Tourism

                Foreign tourist arrivals in Kerala (in million)                             Domestic tourist arrivals in Kerala (in million)

       1.4                                                                         20.0
       1.2                                                                                                                                    18.30
       1.0                                                           1.18          15.0
                               1.04           1.09            1.09                                                                15.61
                 0.98                                                                                                14.67
       0.8                                                                                               13.17
                                                                                   10.0     12.47
       0.6
       0.4
                                                                                    5.0
       0.2
       0.0                                                                          0.0
                 2015          2016           2017            2018   2019                   2015         2016        2017         2018        2019

       Popular tourist destinations in Kerala include beaches of Kovalam, Varkala, Marari, Bekal and Kannur; backwaters of Kumarakom, Alappuzha,
        Kollam, Kochi and Kozhikode; and hill stations of Ponmudi, Munnar, Wayanad and Wagamon. Kerala has a number of well-known wildlife
        reserves, including the Periyar Wildlife Sanctuary, the Eravikulam National Park, the Thattekkad Bird Sanctuary and the Parambikulam Wildlife
        Sanctuary. The State Tourism Department is developing eco-friendly, rural tourism packages in Kumarakom, Wayanad, Kovalam and Muziris
        heritage circuit.

       According to State Budget 2019-20, new project will be started for the development of tourism at Muzhuppilangad.

       Under the State Budget 2019-20, Rs. 372 crore (US$ 53.23 million) is allocated for tourism sector out of which Rs. 82 crore (US$ 11.73 million)
        is allocated for Tourism marketing and additional Rs. 132 crore (US$ 18.89 million) is allocated for developing the facilities of tourist centres.

       In November 2020, Union Minister of State (IC) for Tourism & Culture, Mr. Prahlad Singh Patel inaugurated the ‘Tourist Facilitation Centre’
        facility under the project ‘Development of Guruvayur, Kerala’, which is under ‘PRASHAD’ scheme of the Ministry of Tourism.

       In November 2020, a solar-powered miniature train was launched at Veli Tourist Village, Kerala, to transform Veli into one of the most attractive
        destinations for tourists.
 Source: State Budget 2019-20, 2018-19, Ministry of Tourism

 37
Key sectors – Fishery

   The state has a long coastline of over 580 km & innumerable water
                                                                                                    Marine fish production in Kerala (‘000 tonnes)
    bodies, generating a huge potential for inland & marine fishing &
    providing it a prominent position in fish cultivation. Kochi &
                                                                                                  800
    Neendakara are the two major fishing harbours for mechanized
                                                                                                  700
    sector and the Thankasserry fishing harbour is the only one for the

                                                                                                                                          727.51
                                                                                                                    726.01
                                                                                                  600
    traditional sector.

                                                                                                                                                                                                            609.00
                                                                                                                                                                608.72
                                                                                                  500

                                                                                                                                                                                      549.10
   Kerala’s share in the national marine fish production is around 13%.                          400
                                                                                                  300
   The budget includes schemes such as conservation & management                                 200
    of fish resources, motorisation of traditional fishing crafts & insurance                     100
    coverage to fishing implements, integrated fisheries development,                               0

                                                                                                                    2014-15

                                                                                                                                          2015-16

                                                                                                                                                                2016-17

                                                                                                                                                                                      2017-18

                                                                                                                                                                                                            2018-19
    inland fish production, fishing harbours, modernisation of fish
    markets & value addition, etc.

   In FY21 (until November 2020), exports of marine products from the
    state stood at US$ 437.30 million.                                                    Exports of marine products (US$ million) (until November 2021)

                                                                                           1200
                                                                                           1000
                                                                                            800                               969.75
                                                                                            600                                                     683.99                702.51
                                                                                            400
                                                                                                        395.96                                                                                  437.30
                                                                                            200
                                                                                              0
                                                                                                          2016-17

                                                                                                                                2017-18

                                                                                                                                                      2018-19

                                                                                                                                                                            2019-20

                                                                                                                                                                                                  2020-21
 Source: Department of Animal Husbandry, Dairying and Fisheries, Directorate General of
 Commercial Intelligence and Statistics (DGCIS)

 38
KEY PROCEDURES AND POLICIES

39
Single-window approval mechanism

   A Single-Window Clearance Mechanism (SWM) was established in              SWM structure in Kerala
    June 2000, with an aim to expedite clearances for new industrial
    projects.

   A state-level board, headed by the Chief Secretary, issues
    clearances within a time frame of 45 days to medium and large scale
    industries.                                                                          State Board          Chief
                                                                                                            Secretary
   KSIDC is the single point of contact and convenor of the state board.

   District-level boards have been constituted for issuing clearances
    required by small scale industries.

   The District Collector of each district is the Chairman and General
                                                                                        District Boards       District
    Manager of the Board; the District Industries Centre (DIC) is the                                        Collector
    convenor for such boards. The stipulated time frame for clearances
    is 60 days.

   Industrial Area Boards have been set up in various industrial areas of
    the state for the clearance of projects. An officer, not below the rank                                An officer not
    of District Collector, is Chairman of each Board, with the Designated               Industrial Area   below the rank
    Authority of the Industrial Area as Convenor. The stipulated time                       Board           of District
    frame for obtaining the clearances is 30 days.
                                                                                                             Collector

 Source: KSIDC

 40
Key investment promotion offices…(1/2)

  Agency                                         Description

                                                  The aim of the organisation is to speed up industrial growth in Kerala through infrastructure
                                                   support.

  Kerala Industrial Infrastructure Development    It operates industrial parks in various sectors.
  Corporation                                     It has three newly operational parks: Kera Park (in Thrissur), Spices Park (Idukki) and Rubber
  (KINFRA)
                                                   Park (Pathanamthitta).

                                                  KINFRA’s four upcoming projects include a marine park in Beypore, a technology park in
                                                   Ramanattukara, a food park at Wayanad and an industrial park in Palakkad.

                                                  The organisation is involved in providing technical consultancy assistance to banks by
  KITCO Limited
                                                   appraisal of projects for priority sector lending and to entrepreneurs in the Small & Medium
  (formerly, Kerala Industrial and Technical
  Consultancy Organisation Limited)                Enterprises (SMEs) sector by way of preparation of project reports and market studies and by
                                                   conducting training programmes for entrepreneurship development.

                                                  It is the implementing agency for the Department of Industries, Government of Kerala.
  Directorate of Industries and Commerce          It provides infrastructure facilities for the small scale sector by acquiring land and developing
                                                   facilities such as roads, water supply, electricity and civil works.

 41
Key investment promotion offices…(2/2)

  Agency                                     Description

                                              It provides infrastructure facilities to the small-scale sector through its major and mini industrial
                                               estates.
  Small Industries Development Corporation    It owns and operates production units, raw materials depots, industrial estates/mini industrial
                                               estates, marketing cell/emporia/centres, civil construction division, IT&TC division, export &
                                               import/project division and industrial parks.

                                              Purpose:

                                              Formed in 1961 with an objective of promoting, stimulating, financing and facilitating the
                                               development of large- and medium-scale industries in Kerala.

                                              Acts as a promotional agency, involved in catalysing the development of physical and social
  Kerala State Industrial Development          infrastructure required for the constant growth of industry.
  Corporation (KSIDC): the single-window
  clearance and monitoring agency             Composition:

                                              Consists of a group of professionals from various fields including engineering, management,
                                               finance and law.

                                              Services offered include project lending, single-window clearance, equipment purchase loans
                                               and consultancies.

 42
Contact list…(1/2)

                     Agency                            Contact information

                                                       Vikas Bhavan P O Thiruvananthapuram
                                                       Kerala-695 033
                     Directorate of Industries and     Phone: 91-471-2302 774
                     Commerce                          Fax: 91-471-2305 493
                                                       E-mail: tvm_dindust@sancharnet.in
                                                       Website: http://www.industry.kerala.gov.in/

                                                       T C XI/266, Keston Road, Kowdiar,
                                                       Thiruvananthapuram-695 003
                     Kerala State Industrial
                                                       Phone: 91-471-2318 922
                     Development Corporation Limited
                     (KSIDC)                           Fax: 91-471-2315 893
                                                       E-mail: ksidc@vsnl.com
                                                       Website: https://www.ksidc.org/

                                                       P B No 4407, Puthiya Road,
                                                       NH Bypass, Vennala, Cochin-682 028
                                                       Phone: 91-484 -4129 000 / 2805 033
                     KITCO Limited
                                                       Fax: 91-484 -2805 066
                                                       E-mail: mail@kitco.in
                                                       Website: https://www.kitco.in/

 43
Contact list…(1/2)

                     Agency                             Contact information
                                                        KINFRA HOUSE, TC 31/2312
                                                        Sasthamangalam, Thiruvananthapuram - 695 010
                     Kerala Industrial Infrastructure
                                                        Phone: +91-471-2726 585
                     Development Corporation
                     (KINFRA)                           Fax: +91-471-2724 773
                                                        E-mail: kinfra@vsnl.com
                                                        Website: http://kinfra.org/
                                                        Housing Board Building, 6th floor, Santhi Nagar, P B No 50
                                                        Thiruvananthapuram- 695 001
                     Kerala Small Industries            Phone: 91-471-2330 401, 2330 413, 2330 818,
                     Development Corporation            Fax: 91-471- 2330 904
                                                        E-mail: sidcoho@yahoo.com
                                                        Website: https://www.keralasidco.com/

 44
Key approvals required…(1/2)

      Approvals and clearances required                    Departments to be consulted               Estimated time taken (days)

                 Incorporation of the company                   Registrar of Companies

                                                        District Industries Centre for small scale
      Registration, Industrial Entrepreneurs
                                                      industries and KSIDC for large and medium
         Memorandum, Industrial Licences
                                                                        industries

                                 Allotment of land   State Department of Industries/KSIDC/KINFRA
                                                                                                       Single window clearance:
                                                             State Department of Industries,
                         Permission for land use                                                       The state’s single-window
                                                     Kerala Town and Country Planning Department
                                                                                                        facility clears investment
                                                                                                       proposals in 45 to 60 days
                                                       Kerala State Pollution Control Board and        on an average; the single-
            Environment approval for the site
                                                      Central Ministry of Environment and Forests
                                                                                                        window mechanism helps
                                                                                                           obtain all approvals
       No-objection certificate and consent                                                                 necessary for the
                                                         Kerala State Pollution Control Board
      under Water and Pollution Control Act                                                           investment proposals within
                                                                                                        the specified time frame.
       Approval of construction activity and
                                                     Kerala Town and Country Planning Department
                              building plan

                               Sanction of power         Kerala State Electricity Board (KSEB)

   Registration under State’s Sales Tax Act             Sales Tax Department, Central and State
          and Central and State Excise Act                        Excise Departments

 Source: Commissionerate of Industries

 45
Key approvals required…(2/2)

      Approvals and clearances required           Departments to be consulted        Estimated time taken (days)

           Approval for director identification     Ministry of Corporate Affairs
                                                                                                1 day
                                 number (DIN)                 (National)

                                                  Private agency authorized by the
      Approval of digital signature certificate     Ministry of Corporate Affairs              3 days
                                                              (National)

                                                   Registrar of Companies (ROC)
       Approval to reserve a company name                                                      2 days
                                                             (National)

              Stamp the company documents                  State Treasury                      5 days

        Obtain a Permanent Account Number           the Income Tax Department
                                                                                              15 days
                                    (PAN)                   (National)

      Obtain a Tax Account Number (TAN) for         the Income Tax Department
                                                                                              14 days
        income taxes deducted at the source                 (National)

       Registration of the company under the
        Shops and Establishment Act (State/              Office of Inspector                  14 days
                                  Municipal)

         Register for Value-Added Tax (VAT)        Commercial Tax Office (State)              25 days

                    Register for Profession Tax     Profession Tax Office (State)              9 days

 Source: Commissionerate of Industries

 46
Cost of doing business in Kerala

  Cost parameter                                                           Cost estimate                       Source

  Industrial land (per sq m)                                           US$ 33-190 (Cochin)                     Industry sources

  Five-star hotel                                                US$ 120-300 per room per night                Leading hotels in the state

  Office space rent (per sq ft)                                         US$ 0.6-3 per month                    Industry sources

  Residential space rent (2,000 sq ft house)                          US$ 350-750 per month                    Industry sources

                                                                 Domestic: 1.1 to 3.3 cents (US)
                                                                                                               Kerala State Electricity Regulatory Commission, as of
  Fixed Power Tariff (per kWh)                                  Commercial: 3.3 to 13 cents (US)
                                                                                                               March 2015
                                                                  Industrial: 5.5-6.9 cents (US)

  Labour (minimum wages per day)                                             US$ 6.8-15                        Ministry of Labour and Employment, Government of India

                                                                Commercial and industrial: US 22
  Water (1,000 litres)                                                                                         Kerala Water Authority
                                                                    cents to US 55 cents

 Source: Kerala Government websites and Industry sources, Ministry of Labour and Employment, Government of India, Kerala Electricity Regulatory Commission, Kerala Water Authority

 47
State acts & policies

                        Scheme for fixed floor price for vegetables
                        In October 2020, price of the floor was fixed at 20% above the cost of vegetable production.

      1                 And if the market value drops below the floor price, the produce will be bought from
                        farmers at the floor price.
                        Kerala became the first state in the country to fix the floor price for vegetables.

                        Total digitalisation of school education
                        In October 2020, as part of the state government’s efforts to improve the quality of school

      2                 education, programmes such as 'High-tech School' and 'High-tech Lab' were launched and
                        successfully integrated. Kerala became the first totally digital state in the public education
                        sector in India.

                         Vyavsaya Bhadratha Package,
                        In October 2020, the Kerala Government launched an online platform for speedy and

      3                 transparent delivery of concessions, including interest subsidies for the revival of MSMEs. The
                        portal contains all the information of the various Vyavsaya Bhadratha package programmes,
                        including financial support and concessions for MSMEs.

                        Kerala Agricultural Development Policy 2018
                        The farm lands are to be protected and should not be put for any other use than farming

      4                 activities.
                        The agriculturally potential land is to be identified and demarcated using modern
                        technologies such as remote sensing, satellite imagery, etc., and a database is to be made.

 48
APPENDIX

49
Sources

                       Data                                                                Sources

 GSDP (state)                                  Advanced Estimates” provided by Directorate of Economics and Statistics of Kerala

 Per capita GSDP figures                       Advanced Estimates” provided by Directorate of Economics and Statistics of Kerala

 GSDP (India)                                  Advanced Estimates” provided by Directorate of Economics and Statistics of Kerala

  Installed power capacity (megawatt)          Central Electricity Authority

  Wireless subscribers (No)                    Telecom Regulatory Authority of India

  Internet subscribers (million)               Telecom Regulatory Authority of India

  National highway length (km)                 NHAI & Roads and Building Department

  Major and Minor Ports (No)                   State Planning Board, Kerala

  Airports (No)                                Airports Authority of India

  Literacy rate (%)                            Census, 2011

  Birth rate (per 1,000 population)            SRS Bulletin May 2020

 Cumulative FDI equity inflows (US$ billion)   Department for Promotion of Industry and Internal Trade

  Operational PPP projects (No)                DEA, Ministry of Finance, Government of India

  Notified SEZs (No)                           SEZ India

 50
Exchange rates

  Exchange Rates (Fiscal Year)                                                 Exchange Rates (Calendar Year)

                    Year                           Rs. Equivalent of one US$               Year                 Rs. Equivalent of one US$
                  2004-05                                   44.95                          2005                          44.11

                  2005-06                                   44.28                          2006                          45.33
                  2006-07                                   45.29                          2007                          41.29
                  2007-08                                   40.24                          2008                          43.42
                  2008-09                                   45.91                          2009                          48.35
                  2009-10                                   47.42                          2010                          45.74
                  2010-11                                   45.58                          2011                          46.67
                  2011-12                                   47.95                          2012                          53.49
                  2012-13                                   54.45                          2013                          58.63
                  2013-14                                   60.50                          2014                          61.03
                  2014-15                                   61.15                          2015                          64.15
                  2015-16                                   65.46                          2016                          67.21
                  2016-17                                   67.09                          2017                          65.12
                  2017-18                                   64.45                          2018                          68.36
                  2018-19                                   69.89                          2019                          69.89
                  2019-20                                   70.49                          2020                          74.18
                  2020-21                                   72.59                         2021*                          73.69

 Note: As of February 2021
 Source: Reserve Bank of India, Average for the year

 51
Disclaimer

  India Brand Equity Foundation (IBEF) engaged Sutherland Global Services private Limited to prepare/update this presentation.

  All rights reserved. All copyright in this presentation and related works is solely and exclusively owned by IBEF, delivered during the course of
  engagement under the Professional Service Agreement signed by the Parties. The same may not be reproduced, wholly or in part in any material
  form (including photocopying or storing it in any medium by electronic means and whether or not transiently or incidentally to some other use of this
  presentation), modified or in any manner communicated to any third party except with the written approval of IBEF.

  This presentation is for information purposes only. While due care has been taken during the compilation of this presentation to ensure that the
  information is accurate to the best of Sutherland Global Services’ Private Limited and IBEF’s knowledge and belief, the content is not to be construed
  in any manner whatsoever as a substitute for professional advice.

  Sutherland Global Services Private Limited and IBEF neither recommend nor endorse any specific products or services that may have been
  mentioned in this presentation and nor do they assume any liability, damages or responsibility for the outcome of decisions taken as a result of any
  reliance placed on this presentation.

  Neither Sutherland Global Services Private Limited nor IBEF shall be liable for any special, direct, indirect or consequential damages that may arise
  due to any act or omission on the part of the user due to any reliance placed or guidance taken from any portion of this presentation.

 52
You can also read