1H 2021 Interim Results Presentation - 20 August 2021 - ESR

Page created by Vanessa Hopkins
 
CONTINUE READING
1H 2021 Interim Results Presentation - 20 August 2021 - ESR
1H 2021 Interim
Results Presentation

20 August 2021
1H 2021 Interim Results Presentation - 20 August 2021 - ESR
Disclaimer
The presentation may contain projections and forward-looking statements that reflect the Company’s current views with respect
to future events and financial performance and are subject to certain risks, uncertainties and assumptions. In some cases,
these forward-looking statements can be identified by the use of forward-looking terminology, including the terms “believe”,
“continue”, “could”, “estimate”, “forecast”, “plan”, “prepare”, “project”, “anticipate”, “expect”, “intend”, “may”, “will” or “should” or,
in each case, their negative or other variations or comparable terminology, or by discussions of strategy, plans, objectives,
goals, future events or intentions. These forward-looking statements include all matters that are not historical facts. By their
nature, forward-looking statements involve known and unknown risk and uncertainty because they relate to future events and
circumstances. Forward-looking statements are not guarantees of future performance and involve risks and uncertainties, and
actual results may differ materially from those in the forward-looking statements as a result of various factors and assumptions,
many of which are beyond the Company’s control. Prospective investors are cautioned not to rely on such forward-looking
statements. Neither the Company nor any of its affiliates, advisors, representatives or underwriters has any obligation to, nor do
any of them undertake to, revise or update the forward-looking statements contained in this presentation to reflect future events
or circumstances, except where they would be required to do so under applicable law.

This presentation material includes measures of financial performance which are not a measure of financial performance under
International Financial Reporting Standards (“IFRS”), such as Adjusted EBITDA and Core PATMI. These measures are
presented because the Company believes they are useful measures to determine the Company's financial condition and
historical ability to provide investment returns. Adjusted EBITDA and Core PATMI and any other measures of financial
performance in this presentation material should not be considered as an alternative to cash flows from operating activities, a
measure of liquidity or an alternative to net profit or indicators of the Company's operating performance on any other measure
of performance derived in accordance with IFRS. Because Adjusted EBITDA and Core PATMI are not IFRS measures, Adjusted
EBITDA and Core PATMI may not be comparable to similarly titled measures presented by other companies.

Data or information compiled by JLL has been reproduced in this presentation. While the ESR has taken reasonable care to
ensure that any data compiled by JLL and used in this presentation has been accurately reproduced, such data has not been
independently verified by the ESR, and JLL does not accept any liability in negligence or otherwise for any loss or damage
suffered by any party resulting from reliance on the information herein contained.

                                                                                                                                     1
1H 2021 Interim Results Presentation - 20 August 2021 - ESR
Contents
• 1H 2021 Key Highlights

• 1H 2021 Financial Highlights

• Industry Update

• 1H 2021 Operations Overview

• 1H 2021 Financial Overview

• New Phase Of Growth

• Outlook

• Appendix

                                 2
1H 2021 Interim Results Presentation - 20 August 2021 - ESR
1H 2021 Key Highlights
                                                             ▪ Total AUM grew by 36.9% y-o-y to an all-
                                                               time high of US$36.3 billion

                                                             ▪ Accelerating growth of Fund
                                                               Management EBITDA with
                                                               50.9% y-o-y growth

                                                             ▪ PATMI rose 60.9% y-o-y to a
                                                               record high of US$214 million

                                                             ▪ Raised US$2.5 billion with
                                                               new/upsized funds

                                                             ▪ Record development work in progress
                                                               (WIP) of US$5.5 billion, up 57% from
                                                               1H 2020

                                                             ▪ Robust leasing demand with over
                                                               1.6 million sqm space leased
                                                               across portfolio

                                                             ▪ Balance sheet strength with reduced
                                                               cost of funding and a cash position of
                                                               US$1.1 billion
        9-13 Link Way, Laverton North, Victoria, Australia                                                3
1H 2021 Interim Results Presentation - 20 August 2021 - ESR
1H 2021 Financial Highlights

    Total Segmental                                                Total                                                          Core
                  +38.6%                                                                             +60.9%                                +37.7%
    EBITDA                                                         PATMI                                                          PATMI1

  US$415m                                                       US$214m                                                         US$167m
    Total                                                          Net Debt/
    AUM                               +36.9%
                                                                   Total Assets
                                                                                                    +7.4pp                        Cash     -25.3%

  US$36.3b                                                       30.6%                                                          US$1.1b
  ▪ Accelerating business performance across all three business segments despite the
    continued impact of COVID-19

  ▪ Achieved record AUM of US$36.3 billion with accelerating growth in Fund Management
    EBITDA (50.9% y-o-y growth)

  ▪ Disciplined capital management with strong cash position, diversified and lower cost of
    funding

  ▪ Ability to "double down" on logistics / data centers via acquisition of ARA / LOGOS
Note:
(1)     Excludes fair value on completed investment properties, equity-settled share option expenses and tax effects of adjustments                 4
1H 2021 Interim Results Presentation - 20 August 2021 - ESR
Section 1                                   Industry Update

 ESR Jiangsu Friend — III Logistics Park,
                 China

                                                         5
1H 2021 Interim Results Presentation - 20 August 2021 - ESR
APAC Logistics – Largest Secular Growth Opportunity in Asia

1                            2                              3
    Rapid Rise of E-                  Digital                   Financialisation of
      Commerce                    Transformation                   Real Estate

     ESR has and will continue to uniquely leverage the largest secular trends to
                further solidify its market leading position in APAC

                                                                                      6
1H 2021 Interim Results Presentation - 20 August 2021 - ESR
1     Rapid Rise of E-Commerce
Post COVID-19, APAC Logistics Market Growth Continues to be Underpinned by E-commerce Across the Region

E-commerce penetration across Asia

   1    The PRC                                                                    2   South Korea
             40.4%        40.4%                                                             38.2%    39.4%
                                                                                   35.8%
    27.3%

      2020       2024E    2024E                                                     2020    2024E    2024E
                 before    after                                                            before    after
                 COVID    COVID                                                             COVID    COVID
    4    India
                          11.2%                                                    3   Japan
                 8.5%                                                                                12.7%
                                                                                            11.6%
      6.5%                                                                         10.4%

      2020       2024E    2024E                                                     2020    2024E    2024E
                 before    after                                                            before    after
                 COVID    COVID                                                             COVID    COVID
   5    Singapore                     7    Indonesia                               6   Australia
                                                       33.5%
                          17.5%                                                             14.0%    15.0%
    15.6%        14.5%                    19.9%                                    12.5%

      2020       2024E    2024E           2020         2024E                        2020    2024E    2024E
                 before    after                                                            before    after
                 COVID    COVID                                                             COVID    COVID

                            Increasing e-commerce penetration will continue to
                          support long-term demand for modern logistics facilities
                                                                                                              7
Source: Euromonitor
1H 2021 Interim Results Presentation - 20 August 2021 - ESR
1       Rapid Rise of E-Commerce
E-Commerce Accelerated During COVID-19 and it is Here to Stay
Higher frequency for e-commerce platform over the
past 12 months(1)                                                                                      Average spending per order continued to increase(2)
Shopping frequency for e-commerce platforms per year                                                   Average spending per order on the platform (RMB)

               Mogujie                         20                                                               Pinduoduo                          177
                                                         30                                                                                        177
               Vipshop                                   31                                                        Mogujie                                 249
                                                           34                                                                                            221
        Xiaohongshu                                       32                                                  Xiaohongshu                                    270
                                                           34                                                                                               257
Tmall Global/ Kaola                                 25                                                            Vipshop                                            316
                                                                44                                                                                                      353
                      JD                                        43                                     Tmall Global/ Kaola                                           317
                                                                   49                                                                                                     375
            Pinduoduo                                             46                                        Taobao/ Tmall                                                362
                                                                     51                                                                                                      406
       Taobao/ Tmall                                                                       84                             JD                                                   425
                                                                                                  95                                                                                               571
                           0              20               40            60           80         100                           0        100       200       300            400          500     600
                                                    2019          2020                                                                           2019        2020
Source: Euromonitor                                                                                     Source: Euromonitor

Low online retail penetration in Chinese fresh food                                                    Chinese packaged food online retailing is expanding
relative to other categories                                                                           at a CAGR of 29% over 2015-2020
Online penetration by categories (2020)                                                                China - food retail sales by distribution channel
                                                                                                       100%
            Toys and games                                                                      71%                  8              9            10            11                11           11
                                                                                                                     5              6            8             9                 10           12
      Consumer appliances                                                  40%                          80%
                                                                                                                    28             27            27            26                26           24
 Beauty and personal care                                            34%                                60%
         Apparel & footwear                                       31%
                                                                                                        40%
            Consumer health                                      30%                                                58             58            56            55                54           53
                                                                                                        20%
                    Home care                               24%

              Food and drink                    10%                                                      0%
                                                                                                                   2015            2016         2017          2018               2019         2020
                                  0%      10%       20%     30%      40%      50%    60%   70%   80%       Hyper/Supermarket         Traditional grocery retailers      Online retailing      Others
Source: Euromonitor                                                                                     Source: Euromonitor

Notes:                                                                                                                                                                                               8
(1)   2019 does not include Tmall Global
(2)   All respondents who purchased on the platform at least once every 2-3 months
1H 2021 Interim Results Presentation - 20 August 2021 - ESR
Risk / Reward For Logistics Will Continue To Transform Capital Values

Potential for meaningful cap rate compression in the APAC logistics real estate sector
Spreads between logistics & office cap rates (1)

        2.9%

                               1.7%
                                                      1.3%                   1.2%                    1.2%                 1.2%

                                                                                                                                           0.4%
                                                                                                                                                             0.2%
                                                                                                                                                                             0.0%

                                                                                                                                                                                           (0.4%)
     Singapore                Beijing                 Tokyo                  Seoul                Shanghai              Hong Kong         Sydney        Melbourne            London      US average

                   Cap rate tightening will drive higher logistics asset values, generating outsized returns for the asset class in APAC

APAC cities’ yield spreads are multiple times higher than mature markets
Spreads between logistics yields and debt cost, 4Q20 (2)
      7.9%
                         6.9%                6.7%               6.7%
      3.1%                                                                         5.2%
                                             1.9%               2.0%                                  4.6%               4.5%                                       4.5%         4.5%
                                                                                                                                       3.8%         3.4%
                         5.5%                                                      2.5%                                                                                          1.0%       3.3%
                                                                                                      2.8%               2.7%
      4.8%                                   4.8%               4.7%                                                                                                3.5%                    1.2%
                                                                                                                                       3.2%         2.2%
                                                                                   2.7%                                                                                          3.5%
                         1.4%                                                                         1.8%               1.8%                                                               2.1%
                                                                                                                                       0.6%         1.2%            1.0%
  Guangzhou           Singapore             Beijing          Shanghai              Seoul             Sydney           Melbourne        Tokyo       Germany          France          US       UK
                                                                                 Typical Cost of Debt               Yields Spread Over Debt Cost

                                   APAC offers more attractive yield spreads compared to more mature markets in the US and UK

Source: JLL, 4Q20

Notes:
                                                                                                                                                                                                   9
(1)   As of 2Q2020
(2)   As of 4Q2020, debt costs are based on investment grade tenants; assuming prime assets and 5-years load term
2       Digital Transformation Driving New Economy Real Estate
APAC Is Leading The Growth In Data Centers
APAC data traffic expected to grow exponentially due to demographic tailwinds

                                                                                                 7.7GB to 14.4GB(2)                                                             c.34%
                61.1%                                                                            2020-2025E mobile data usage in
                                                                                                                                                                                of global hyperscale data centers
                of global millennials live in APAC(1)                                                                                                                           expected to be located in APAC by
                                                                                                 APAC
                                                                                                                                                                                2021E(3)

Data consumption grew 4x in the                                                 Rapid growth in APAC emerging                                                            APAC EMs(3) outgrow all other
last five years                                                                 markets(3) public cloud service market                                                   regions in data center capacity
Amount of data created, consumed, and stored (ZB)                               Public cloud service market size (US$Bn)                                                 2019-2023E CAGR in data center capacity(4)

                                                                                                                                                                         30%
                                                             64.2
                                                                                                                                                                               27%

                      CAGR: 32.9%
                                                                                                                                         61.1
                                                  41.0                                                                                                                             18%
                                                                                                                                                                                                  16%
                                       33.0
                                                                                                     CAGR: 34.6%
                                                                                                                                                                                                                           13%
                             26.0                                                                                                                                                                       12%
                                                                                                                                                                                          10%
                  18.0
       15.5                                                                                                                                                                                                                      6%
                                                                                                     18.6
                                                                                                                                                                                                             5% 5%
                                                                                                                                                                                                                                      3% 2%

       2015       2016      2017       2018       2019      2020                                     2019                               2023E                               Hyperscale               Wholesale                   Retail
Source: IDC, Statista                                                                                                                                                     APAC Emerging Markets                  LATAM
                                                                                                                                                                          EMEA                                   North America
Notes:
(1)   Population aged 23-38
(2)   According to GlobalData research                                                                                                                                                                                                10
(3)   Including China, India and Southeast Asia
(4)   The percentages represent the 2019-2023E CAGR of the market size of carrier-neutral data centers (in terms of MW) across operating models and regions; market size is calculated by total capacity, which is the maximum
      capacity as designed
APAC Is World’s Second Largest DC Region
ESR Has a Competitive Advantage in APAC Given Our Leading Presence Across Key Markets

                                                          Nordic
                            Canada                       240 MW
                            450 MW
                                                      Western   Eastern
                                                      Europe
                                                                Europe                Greater
                                                                  250                               Japan &
                                                     3,000 MW                          China
                                                                                                  South Korea
                                US                                                   3,800 MW
                                                                                                   1,350 MW
                                                                             India
                             7,000 MW                                       750 MW
                                                          Middle East
                                                            / Africa                                   APAC
                                                           650 MW                        SEA
                                            Latin                                      750 MW    7,000-7,250
                                           America                                                       MW
                                           500 MW

                                                                                                   ANZ
         Denotes ESR’s pipeline projects                                                         450 MW

   APAC data center spending to surpass US$35Bn                 APAC to grow to a power capacity of 12,000 MW
    by 2024 to account for >35% of global market                                   by 2026

                                                                                                                11
Source: Synergy Research Dec 2020
3       The Financialisation of Real Assets in APAC
Institutionalization of Real Assets in APAC Has Just Begun with Significant Opportunity for Growth with the Launch
of New REIT Legislation Across the Region

US REIT Market has grown tremendously over the past two decades
Market cap evolution of US REIT market (US$Bn)
1,800

                                                                                                                                                                                                       1,246
                                                                                                                                                                                                                 1,184
1,200
                                                                                                                                                                              960     1,066     980
                                                                                                                                                           846        886

                                                                                                                                                    608
                                                                                                                                          544
   600
                                                                             401                                        359        408
                                                        275           301               289                  248
                        147        151        205                                                  176
              134

      0
             2000      2001       2002       2003      2004           2005   2006      2007       2008      2009       2010       2011    2012     2013    2014   2015       2016     2017    2018      2019     2020

Upcoming REIT markets in APAC provide a large secular growth opportunity
Total REIT market cap as % of 2020 real GDP

  25%                 19,273                             325                            1,312                           4,292                      2,443                      1,618                     14,483
                                                                (1)
                                                        22.8%
  14%                                                                                                                                            Over US$1Tn(2) opportunity
                                                                                        8.3%
    7%                 6.1%
                                                                                                                   US$125Bn(2)
                                                                                                                                                 US$143Bn(2)                US$95Bn(2)                US$890Bn(2)
                                                                                                                        3.2%                                   0.3%                      0.2%                       0.0%
    0%

                                                  2020 Real GDP (US$Bn)                                         Potential REIT Market Upside (US$Bn)

Source: Nareit, Oxford Economics

Notes:
(1)   Relatively high percentage due to prevalence of non-Singapore assets being listed as S-REITs                                                                                                               12
(2)   Estimated assuming a public REIT market in line with a mature market such as USA with total REIT equity market cap of 6.1% of GDP
Section 2                                    1H 2021
                                           Operations
                                            Overview

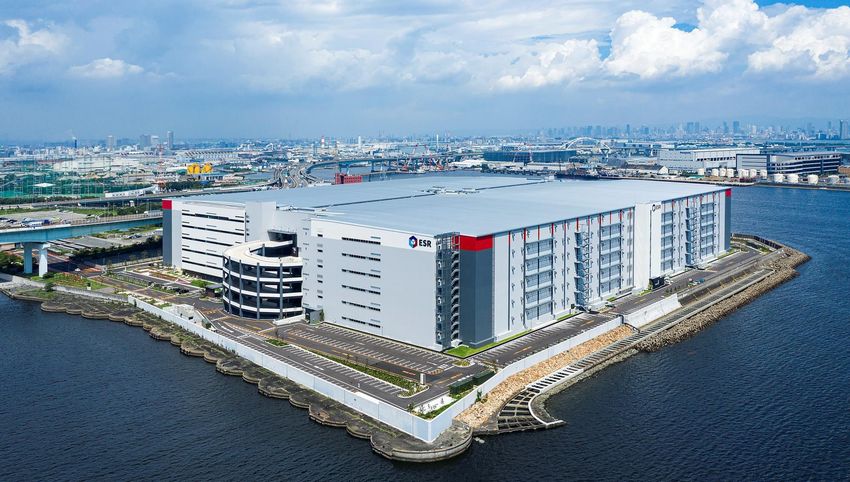
ESR Amagasaki Distribution Centre, Japan
#1 APAC Focused Logistics Real Estate Platform
       Market leading positions in key markets
       ◼    ESR has over                22.6 million sqm GFA in operation and under development1 and a further c7.6 million
            sqm GFA of development pipeline with MOUs2 signed across top tier markets with a high quality tenant base
                                                                                                                                     1. China Platform                      4. Australia Platform
                                                                                                                                                                           US$6.1 billion of AUM with
                                                                                                                                  #1 e-commerce landlord4                  a development pipeline of 1.2
                                                                                                  1       China                                                            mil sqm
                                                                                                                                  #1 development pipelines5
                                                                                                                                                                           Acquisition of A$3.8 billion
                                                                                                                                                                           (approximately US$2.9 billion)
                                                                                                                                  #2 largest portfolio of logistic         Milestone Portfolio and
                                                                                                  2       South Korea             properties6
                                                                                                                                                                           management platform

                                                                                                                                2. South Korea Platform                        5. India Platform
                                                                                                  3       Japan                                                             Established US$750
                                                                                                                                  #1 largest owner of logistics
                                                                                                                                  stock7                                    million JV with GIC to be
                                                                                                                                                                            seeded with a ~2.2 million sq ft
                                                                                                                                                                            build-to-core asset
                                                                                                  5       India                   #1 development pipeline in
                                                                                                                                  the Seoul Metropolitan Area7              1.6 million sqm GFA in
                                                                                                                                                                            development pipeline8
       Total AUM 3
       (US$ billion)
                                                                                                                                  1st publicly listed institutional
                                                                                                  6       Singapore               quality logistics asset focused          6. Singapore Platform
                                   36.3                                                                                           REIT in Korea
                                                                                                                                                                            #1 non-Temasek affiliated
                                                                                                                                    3. Japan Platform                       industrial REIT platform9 of 76
             26.5                                                                                                                                                           properties10
                                                                                                                                  #1 development pipeline in
                                                                                                  4       Australia               the Greater Tokyo and Greater
                                                                                                                                  Osaka regions7
                                                                                                                                                                         7. Southeast Asia - Other
                                                                                                                                  US$0.7 billion
                                                                                                  7 Southeast Asia                expansion of RJLF3, a
                                                                                                    - Vietnam                     development JV with APG and               Secured initial projects in
                                                                                                                                  a global institutional investor in        Vietnam and Indonesia
           1H 2020               1H 2021                                                          7 Southeast Asia                July 2021
                                                                                                    - Indonesia
Notes:
(1)    Consisting of approximately 14.2 million sqm of GFA of completed properties, approximately 5.5      (6)    As of 4Q 2019, in Greater Shanghai, Greater Beijing and Greater Guangzhou as measured by GFA
       million sqm of GFA of properties under construction and approximately 2.9 million sqm of GFA to     (7)    By GFA from 2019 to 2020
       be built on land held for future development as of 30 June 2021                                     (8)    Development pipeline including MOU as of 30 June 2021
(2)    MOUs as of June 2021                                                                                (9)    In terms of number of assets
(3)    As of 30 June 2021                                                                                  (10)   Including 58 properties in ESR REIT and 18 properties in Sabana REIT as of 30 June 2021
(4)    In terms of proportion of total area occupied in China in comparison to only GLP as of September
       2017 when GLP was privatised                                                                                                                                                                            14
(5)    In Greater Shanghai, Greater Beijing and Greater Guangzhou from 2020 to 2021
YTD 2021 Strategic Achievements
       FEB                                                               MAY                            JUN

           > ESR Australia partners                                        > Purchased with new           > ESR Kendall Square REIT JUL
             DHL Supply Chain                                                investor M&G a                 acquired two assets;
                                                                                                                                       > ESR and
             to develop 70K sqm                                              significant stake in           Anseong LP and Yongin
                                                                                                                                         Tamil Nadu
             pharmaceutical                                                  US$870 million ESR             BRIC for US$145m and
                                                                                                                                         Government           AUG
             distribution facility in                                        Ichikawa DC from               US$94.2m respectively.
                                          APR                                                                                            sign MoU for
             western Sydney.                                                 RJLF II.                                                                           > Proposed
                                                                                                          > Acacia Ridge Business Park   two industrial
                                            > 108k sq ft of industrial                                                                                            acquisition of
           > Best Industrial Project of                                    > First strategic asset in       commenced redevelopment.     parks.
                                              space leased to                                                                                                     ARA Asset
             the Year at Realty+                                             HK which will be
                                              CUBIC in Chennai,                                           > JPY75b expansion of ESR        > Plans to             Management
             Conclave & Excellence                                           developed into a
                                              India.                                                        Japan Logistics Fund III         develop 36.5-        (including
             Awards 2021.                                                    40MW data centre.
                                                                                                            (“RJLF3”).                       acre, Grade A        LOGOS) for
                                    MAR     > CPPIB and ESR                                                                                  industrial and
                                                                           > Formed JV with BW on                                                                 US$5.2b
                                              upsize joint                                                > Completion of acquisition of
                                                                             240k sqm industrial                                             logistics park
                   >BWX signed as             investment in Korea                                           A$3.8b Milestone Portfolio                          > Established
                                                                             development project                                             in Jalisana,
                     anchor at ESR            Income JV to US$1b.                                           and operating business from                           US$1b New
                                                                             near HCMC, maiden                                               India.
                   Clayton Business                                                                         Blackstone, in partnership                            China
                                            > Entered into                   entry into Vietnam.
                               Hub.                                                                         with GIC.                      > Toys“R”Us            Development
                                              US$400m senior                                                                                 signs 10 years
                                                                           > ESR-REIT acquired                                                                    Platform with
             > Plans to develop 38-           unsecured corporate                                         > Issued a further S$150m
                                                                             10% stake in EALP                                               lease with           APG and
               acre industrial and            term loan facility at                                         of perpetual step-up
                                                                             from ESR,                                                       ESR Clayton          RECO.
                     logistics park in        Libor +2.75% and                                              subordinated securities at
                                                                             demonstrating support                                           Business Hub.
                      Chakan, India.          +3.25% for 3-year                                                                 5.65%.
                                                                             and alignment.
                                              and 5-year tranches,                                            US$36.3b
             > Inclusion in HSCI, as
                                              respectively.                > ESR Australia adds               Jun 2021
                  well as Shanghai-
                                                                             56k sqm with pre-                   AUM
                  Hong Kong Stock           > Development of
                                                                             commitments from two
                       Connect and            US$2b+ multi-phase
                                                                             anchors at Horsley
                    Shenzhen-Hong             data centre campus
                                                                             Logistics Park.
               Kong Stock Connect.            near Osaka CBD,
                                              through acquisition of
                   > Issued S$200m
                                              the asset and its
                   perpetual step-up
                                              excess land.
                        subordinated
                 securities at 5.65%.
US$29.9b
Dec 2020
  AUM

                                                                                                                                                                       15
                                                                                                                               ESR Clayton Business Hub, Australia
Strong Operational Performance
Quality and strength of portfolio fundamentals

                                                        ▪      High portfolio occupancy of 89%1
                                                        ▪      Well-staggered WALE of 3.8 years2 by income
                                                        ▪      Strong leasing demand with 1.6 million sqm of space leased
             INVESTMENT
                                                               across portfolio primarily driven by new economy
                                                        ▪      Achieved 5% rental reversion on renewed leases1

                                                        ▪      Total AUM rose 36.9% y-o-y to US$36.3 billion3
             FUND
                                                        ▪      Fund AUM grew 37.9% y-o-y to US$32.7 billion3
             MANAGEMENT
                                                        ▪      Fund management fees increased 48.2% y-o-y to US$124 million

                                                        ▪      Commenced US$1.2 billion worth of developments in 1H 2021 and
                                                               Work In Progress grew 57% y-o-y to US$5.5 billion
             DEVELOPMENT
                                                        ▪      Achieved US$0.9 billion of development completions
                                                        ▪      Robust landbank of over 2.9 million sqm across portfolio

Notes:
(1)    Based on stabilised assets on balance sheet as at 30 June 2021
(2)    Based on assets on balance sheet and portfolio assets in funds and investment vehicles by income for 1H 2021            16
(3)    As at 30 June 2021
Leased 1.6 million sqm Of Space Across Portfolio
Powered by new economy – top five leases by area

                                   E-commerce        E-commerce          E-commerce                           E-commerce
                                                                                                Retail
                                      & 3PL             & 3PL               & 3PL                                & 3PL
                                       JD.com            Coupang             Alibaba       深圳市盈速达供应链         东莞金鹰仓储
                                                                                            管理有限公司            有限公司
  Tenant

                               Market Cap: US$98b1   Market Cap: US$56b1 Market Cap: US$468b1            Market Cap: US$87b1

  Market                                China           South Korea           China              China            China

  Area leased in
  1H 2021                                262                206                112                71                60
  (‘000 sqm)

  Lease term
                                        1–3                2–7                 1–5                 3               1–2
  (years)

                      Strong demand for logistics space from high quality new economy tenants

Note:
(1)     As of 19 August 2021                                                                                                   17
Strategically Diversified In Key APAC Markets
     Resilient to market changes and disruptions

            Revenue Contribution                                                            AUM By Region1                                                              GFA By Region1
                By Region1,2

                         India/Others                                                              India/Others                                                            India/Others
                              2%                                                                        3%                                                                      7%
         Australia
           11%                                                                                                                   China
                                                       China                  Australia                                          21%                     Australia
                                                       33%                      17%                                                                        13%
Singapore
   7%
                                                                                                                                                                                                                  China
                                                                                                                                                                                                                  40%
                                                                                                                                               Singapore
                                                                    Singapore
                                                                                                                                                  8%
                                                                       8%

                                                                                                                                  South Korea
       Japan                                        South Korea                                                                      26%
        35%                                                                                                                                                    Japan
                                                       12%                               Japan                                                                  16%
                                                                                          25%                                                                                         South Korea
                                                                                                                                                                                         16%

   As of 30 June 2021
   Notes:
   (1)      GFA includes completed properties, properties under construction and GFA on land held for future development. AUM includes portfolio assets owned directly by ESR and portfolio assets held in
            the funds and investment vehicles
   (2)      Revenue excludes contribution from construction income
                                                                                                                                                                                                             18
Section 3                             1H 2021
                                      Financial
                                     Highlights

  ESR Bucheon Logistic Park, Korea

                                             19
1H 2021 Key Financial Highlights
Revenue1                                                                                                      Adjusted EBITDA2
(US$ million)                                                                                                 (US$ million)
                                                                     178
                                         +24.7%                                                                                                                                       215
                        142                                                                                                                             +42.3%
                                                                                                                                      151

                     1H 2020                                       1H 2021                                                          1H 2020                                         1H 2021

Profit After Tax                                                                                              PATMI
(US$ million)                                                                                                 (US$ million)
                                                                     230
                                                                                                                                                                                       214
                                       +58.8%                                                                                                             60.9%
                        145                                                                                                             133

                     1H 2020                                       1H 2021                                                           1H 2020                                        1H 2021

▪ Delivered strong earnings across key business segments

▪ Well-diversified contributions from ESR’s core markets
Notes:
(1)    Excludes construction income
(2)    Adjusted EBITDA is calculated as profit before tax, adding back depreciation and amortization, exchange loss/(gain), finance costs, equity-settled share option and eliminating the effect of
                                                                                                                                                                                                       20
       interest income, and fair value gains on completed investment properties and investment properties under construction
Well-Equipped With Strong Balance Sheet
Proactive and disciplined debt management

Net Debt                                                                                             Finance Costs
(US$ million)                                                                                        (US$ million)                  156
                                                                                                                                     2
                                                                                                                                        1
                                                                                                                                        3
                  1,908                        1,780                              2,620
                                                                       4,204                                                            60
                                         3,805                                  3,753                                                                        82
                                             3,295                                                                   77
        3,189                                                                                                                           5                    1
            2,855                                                                                                     1                                       5
                                                                                                                      0
                                                                                                                                                              2
                                                                                                                     29                                      31
                                                      1,515                                                           3
                                                                                   1,133                                                85                    1
                      947
                                                                                                                     44                                      43

            1H 2020                           FY2020                        1H 2021                              1H 2020           FY2020                  1H 2021
   Total Equity     Total debt and other borrowings    Cash and bank balances       Net debt

 Net Debt / Total Assets                                             Net Debt / Equity                                     Weighted Average Interest Cost
 (%)                                                                 (%)                                                   (%)
                                                  30.6%
       28.6%                                                                    59.8%                          62.3%
                                                                                                                                 5.0%
                             23.2%                                                               46.8%                                          4.6%              4.6%

    30 Jun 2020           31 Dec 2020         30 Jun 2021                  30 Jun 2020         31 Dec 2020   30 Jun 2021    30 Jun 2020      31 Dec 2020      30 Jun 2021

                                   Weighted average interest cost was 4.6% as at 30 June 2021
                                                                                                                                                                         21
Key Drivers Of Our Three Pillars Of Business

                                A                                                                 B                                           C
                                    Investment                                              Fund Management                                   Development

                 –   Completed B/S properties
                                                                                – Base / Asset management fees                  – B/S development profits
                 ➢    Rental income + revaluation gains
                                                                                – Development fees                              ➢ Revaluation gains on U/C properties +
                 –   Fund co-investments(1)                                                                                       disposal gain on sale
 Income          ➢    Pro rata earnings                                         – Acquisition fees
                                                                                                                                – Funds’ development profits(1)
                 –   Listed securities                                          – Leasing fees
                                                                                                                                – Construction income
                 ➢    Dividend income                                           – Promote fees
                 –   Solar energy income

                 – Direct costs for rental and solar energy income                                                              – Construction costs
Expenses                                                                        – Allocated administrative expenses
                 – Allocated administrative expense                                                                             – Allocated administrative expenses

                 ✓ Rental growth and high occupancy                             ✓ Strong Fund AUM growth                       ✓ Significant development pipeline (B/S, funds)
                 ✓ Cap rate compression                                         ✓ Significant development pipeline in funds    ✓ Track record of strong development profit
Key drivers                                                                                                                      margins
                 ✓ High dividend payout from listed                             ✓ Promote Fee opportunity
                   securities                                                                                                  ✓ Asset recycling from B/S or development
                                                                                                                                 funds into core funds / REITs

 1H 2021
Segmental                        US$183 million                                                 US$97 million                                 US$135 million
 Result2

                                           % contribution                                            % contribution                           % contribution
                                               44.1%                                                     23.4%                                    32.5%

                                                                       Combined segmental EBITDA: US$415 million

                                                           D                            US$36 million corporate and other unallocated costs

                                                                           Total Segmental Result: US$379 million

Notes:
(1)    Based on allocated share of profits from FVTPL funds and JV funds to each of Investment and Development segments                                                      22
(2)    1H 2020 Segmental result: Investment: 36.2%, Fund Management: 21.5%, Development: 42.3%
Summary Of 1H 2021 Financial Performance
US$ million                                              1H 2020        1H 2021           Variance

Revenue                                                   198              204               3.4%
       Investment                                          59              54                (8.6%)
       Fund Management                                     84              124               48.2%
       Development                                         55              26               (51.6%)
Segmental Results (EBITDA)                                300              415              38.6%
       Investment                                          109             183               68.7%
       Fund Management                                     64              97                50.9%
       Development                                         127             135               6.7%
Corporate and other unallocated expenses                   (23)           (36)              52.7%
Total EBITDA                                              269              373              38.6%

Adjusted Revenue (ex. construction income)                142              178              24.7%
PATMI                                                     133              214              60.9%
Core PATMI (ex. revaluation from completed properties)    121              167              37.7%

▪   Revenue increased to US$204 million mainly due to higher fees from fund management segment,
    offset by lower construction income from outstanding projects prior to exit of the CIP construction
    business
▪   Increase in segmental results (EBITDA) boosted by an increase in fee income, as well as gains
    realised through fair value of completed investment properties, share of profits from Korea JV
▪   Growth in Core PATMI continues to be supported by strong recurring income such as fees collected
    from fund management
                                                                                                          23
1H 2021 Financial Performance – Segmental
EBITDA Breakdown

                            37%
                                                    33%
 42%
                                                                             44%
         1H 2020                                                   1H 2021
       US$300 mil                                                US415mil

                                                          23%
                   21%

               Investment         Fund Management         Development

                                                                                   24
A       Investment Segment
        Healthy broad-based demand with strong occupancy maintained
Portfolio Lease Expiry Profile By Area1,2                                                                      Investment Segmental Result
                           Assets held on Balance Sheet           Assets held in Funds & Investment Vehicles   (US$ million)
                                                                                                         36%
                                                                                                         35%                          183

                                            14%                15%
                         12%
      11%                                                      12%
                         11%                10%                                    10%                                         109
      8%
                                                                                   8%

      3%                 2%                  4%                 3%                 2%                 1%
   2H 2021              2022                2023               2024               2025             2026 and
                                                                                                    beyond

     As at 30 Jun 2021                        Assets held
                                                                      Assets held
                                              on Balance                                         Portfolio
                                                                       in Funds
                                                Sheet
     WALE (by leased area)                      1.9 years                4.1 years               3.8 years
     WALE (by income)                           2.2 years                4.0 years               3.8 years                1H 2020    1H 2021

▪ Investment segment results rose 68.7%, boosted by fair value gains on completed investment
  properties and share of profits from South Korea joint ventures
▪ Well-spread WALE of 3.8 years2 by leased area and 3.8 years2 by income
▪ High occupancy of 89%3 across portfolio with the addition of newly completed properties in
  1H 2021
▪ Achieved positive rental reversion of 5% on renewed leases 3
Notes:
(1)    As at 30 June 2021
(2)    Based on assets on balance sheet and portfolio assets held in the funds and investment vehicles
                                                                                                                                               25
(3)    Based on assets on balance sheet and stabilised assets
A       Investment Segment
         Robust leasing supported by new economy and deep customer relationships
         Portfolio Top 10 Tenants By Income1,2                                                               Portfolio End User By Industry
         (%)                                                                                                               Others
                                                                                                                           11%
             JD.com                                                                               9.4%

           Coupang                                                       6.0%                                     Retail
                                                                                                                  11%
         SoftBank
                                                               4.8%
        Group Corp
                                                                                                                                      Lease
                Zeny                               3.1%                                                  Manufacturing                Profile
                                                                                                             9%                     by Income1
            Amazon                                 3.1%

                                                                                                              Cold Chain
       Market Kurly                           2.6%                                                               5%

                Nitori                      2.3%
                                                                                 8 out
   Nakano Shokai                            2.2%
                                                                                 of 10                                                       64%
        The State                                                       Top 10 Tenants                                                   E-commerce and
                                       1.6%
     of Queensland                                                      are e-commerce                                                    3PL companies
                                                                            related1
             Alibaba                 1.3%

             E-commerce related

▪ Strong leasing transactions across portfolio with 1.6 million sqm of space2 leased across
  portfolio
▪ Robust leasing demand largely driven by e-commerce and 3PLs
Notes:
(1)    Based on income for 1H 2021                                                                                                                        26
(2)    Based on assets on balance sheet and portfolio assets held in the funds and investment vehicles
B   Fund Management Segment
    Fund AUM rose 37.9% y-o-y to US$32.7 billion
     Evolution in Total Assets Under Management (Dec 2019 to Jun 2021)
    (US$ billion)

                                                                                    36.3
                                                                                     18.5

                                                                29.9
                                   26.5                         17.3

                                     16.9
                    22.1
                    12.4

                                                                                     14.1

                                                                9.8

                    6.8              6.8

                    2.9              2.8                        2.8                   3.6

              31 Dec 2019        30 Jun 2020                31 Dec 2020           30 Jun 2021

                               Balance Sheet   Core Funds   Development Funds
                                                                                Fund AUM

    Accelerating growth of fund management business demonstrates strong investor confidence

                                                                                                27
B       Fund Management Segment
         Strong fundraising support with US$2.5b of new committed capital

         Fund Income                                             Fund Management Segmental Result
         (US$ million)                                           (US$ million)
                                              124
                                                                                                  97

                           84
                                                                                    64

                       1H 2020              1H 2021                               1H 2020       1H 2021

           Fund Income                     1H 2020    1H 2021    Capital Raised (US$ billion)   1H 2020      1H 2021

           % of adjusted Total AUM1          1.0%       0.9%     Equity committed                      9.0      12.3

           % of adjusted Fund AUM1           1.2%       1.0%     Undrawn capital                       3.6       4.4

           % of invested capital             3.5%       2.9%     Capital raised                        2.4       2.5

                            Increased development WIP adds greater visibility and a stronger base for
                                                fund management fee income
Notes:                                                                                                                 28
(1)    Excludes uncalled capital.
B     ESR’s Capital Raising By Market
       Continuous platform expansion underpinned by strong fundraising
                                                                                   Japan
                                                                                  AUM (US$ billion)
                                                                                                        9.2    New funds raised
                                                                                                                 in 1H 2021
                                                                                          7.9

US$2.5b
New capital committed
in 1H 2021
                                                                                        Dec 20        Jun 21

                                                                                   South Korea
US$4.4b                                                                           AUM (US$ billion)
                                                                                                        9.4    New fund raised
                                                                                                                 in 1H 2021
Uncalled capital                                                                          7.7
to be deployed

     Strong Network of
   Blue Chip Institutional
                                                                                        Dec 20        Jun 21
     Capital Providers              India
                                   AUM (US$ billion)
                                                                                   China
      CPPIB                APG                                                    AUM (US$ billion)
                                                                                                       7.4
                                                                                         6.7
                                         1.2            1.1
     Ping An              CPIC

        NCI                GIC         Dec 20          Jun 21
                                    Australia                                          Dec 20         Jun 21

       AXA              Manulife   AUM (US$ billion)            New fund raised    Singapore (2 Listed REITs)
                                                                  in 1H 2021
                                                        6.1                       AUM (US$ billion)
      PGGM               Allianz
                                         3.4                                             3.0           3.0

                                       Dec 20          Jun 21                          Dec 20         Jun 21          29
*AUM details as of 30 June 2021
B             Investment Vehicles Under Management
                       Continue to attract best-in-class capital partners across multiple-fund
                       investments         Inception Date Category
                                                                   Fund AUM
                                                                               Capital
                                                                            Commitments
                                                                                        Uncalled Capital Interest Held GFA                                                 1
                                                                                                                                                                                                            By ESR (%)
                                                                                                                             (US$ million)              (US$ million)               (US$ million)                                 ('000 sqm)
                           e-Shang Star Cayman Limited                         May-14               Development                 2,019                       863                          87                      25.6                2,326
                           RCLF I                                              Jul 12               Development                  812                        440                           -                       2.3                1,009
             China

                           China Invesco Core Fund                             Oct 17                  Core                      359                        190                           -                      16.3                 371
                           NCI Core Fund                                       Jan-19                  Core                      307                        159                           -                      10.0                 325
                           GIC                                                 Dec-19               Development                  927                        538                         313                      51.0                1,038
                           Manulife                                            Mar-20                  Core                      281                        292                           6                       1.5                 270
             South Korea

                           South Korea Development Fund I                      Nov-15               Development                    3,159                      1,150                        245                   20.0                 2,007
                           South Korea Core Fund                               Jul-18              Core/Core Plus                  2,320                      1,000                        586                   10.0                  491
                           South Korea Development Fund JV 2                   Jun-20               Development                    2,359                      1,000                        899                   20.0                  307
                           AMC Projects                                           -                     Core                        379                         -                           -                     NA                   197
                           ESR Kendall Square REIT                             Dec-20                  REIT                        1,222                       NA                          NA                     9.9                  684

                           RJLF II                                             Apr-18               Development                    1,333                       575                         67                    0.0                   443
             Japan

                           ESR Japan Core Fund                                 Dec-18                  Core                        1,352                       511                          -                   17.0                   605
                           RJLF III                                            Jun-19               Development                    2,928                      1,353                        836                  20.0                   745
                           Other investment vehicles                           Various              Development                    2,769                      1,184                        346                 Various                1,042
             Singapore

                           ESR-REIT                                             2006                      REIT                     2,405                        NA                         NA                     9.3                 1,449
                           Sabana REIT                                          2010                      REIT                      642                         NA                         NA                    20.9                  390

                           50 Ann PEP                                          May-17                Core Plus                      141                        67                           -                    25.0                  26
                           POP III                                             Feb-19                Core Plus                      100                        45                           -                    11.2                  20
                           PACT                                                Dec-17                Value Add                      262                        59                           -                    15.0                  19
             Australia

                           EALT                                                Nov-19                Core Plus                      145                        73                           -                    20.0                  94
                           EOP IV                                              Dec-19                Core Plus                      114                        49                           -                    11.2                  22
                           EALP                                                Jun-20                Core Plus                     1,057                       455                         53                    10.0                  629
                           EADP                                                Aug-20               Development                    1,692                       758                         657                   40.0                  363
                           EMP                                                 Jun-21                Core Plus                     2,519                       997                          -                    20.0                 1,706
             India

                           ESR India Logistics Fund                            Nov-18               Development                     401                        239                         63                   50.0                   795
                           ESR Mumbai 3                                        Dec-20               Development                     668                        300                         283                  100.0                  189

                                                                                          TOTAL OF ALL FUNDS                      32,672                     12,297                       4,443                                      17,562

Notes:
(1)      The commitment represents the aggregate capital commitments to the fund or investment vehicle, as applicable, including capital commitments by third-party investors and the general partner or investment manager. Foreign
         currency commitments have been converted into U.S. dollars based on: (i) the foreign exchange rate at the date of purchase for each investment; and (ii) the exchange rate that prevailed on 30 June 2021, in the case of uncalled
         commitments.                                                                                                                                                                                                                          30
C   Development Segment
    Record WIP boosted by robust customer led demand for higher value
    projects
    Work In Progress                         Work In Progress (Estimated Total Cost)
                                                                                                  1H 2020          1H 2021
                                             (US$ billion)
    Estimated Total Cost (US$ billion)
                                             WIP End Value as at December                              3.9             4.7
           41                      47
                                             Development Completions                                   1.3             0.7
                                             Development Starts                                        1.1             1.2
                                   5.5
                                             FX and other                                             (0.2)            0.3

                                             WIP End Value as at June 2021                             3.5             5.5

                                             No. of WIP developments (as at period end)                 41             47
           3.5

         1H 2020                 1H 2021
                   No. of WIP developments           Project rendering of the 195,373 sqm ESR Yokohama Sachiura DC2,
                                                                 a four-storey building with double ramp ways

▪ Strong growth in WIP to a record US$5.5 billion in 1H 2021 boosted by strong demand
  and expansion from e-commerce related customers
▪ Robust demand for high quality, large-scale, modern logistics facilities
                                                                                                                             31
C     Development Segment
      Continue to leverage third party capital for development starts
    Development Starts                                      Development Completions
    Estimated Total Cost (US$ billion)                      Completion Fair Value (US$ billion)

                                                                      2.2
                                                                      2.1

                                       1.2
                                       0.9

                                                                                                              The six-storey ESR Chigasaki DC in Japan was
            0.8                                                                                 0.9                                   completed in 1H 2021

             0.7                                                                                0.8

                                       0.3
           0.04                                                      0.05                       0.1
          1H 2020                 1H 2021                           1H 2020               1H 2021
        Assets held on Balance Sheet               Assets held in Funds & Investment Vehicles

    Development Starts       1H 2021     1H 2020           Development              1H 2021       1H 2020
    (%)                                                    Completions (%)

    Assets held on              41%          12%           Assets held on Balance       37%           5%
    Balance Sheet                                          Sheet

    Assets held in Funds &      59%          88%           Assets held in Funds &       63%           95%
                                                                                                            The four-storey ESR Kawasaki Yako DC in Japan
    Investment Vehicles                                    Investment Vehicles                                                   was completed in 1H 2021

                                                                                                                                                      32
C     Development Segment
          Strong landbank for sustainable and recurring development profits

                                                                                                                        Development
  Land Bank                                              Development Pipeline                                           Segmental Result
 GFA (million sqm)                                       GFA (million sqm)                                              (US$ million)

        US$3.9 bil              US$2.9 bil
                                                             16.1
            3.8                                                                                                                             135
                                                             1.9
            2.3
                                                                                                                                127
                                                             1.2
                                      2.9
                                                             3.0
                                      1.7
                                                                               7.6
                                                             4.0
                                                                               0.7
                                                                               0.6           5.5
                                                                               1.5
            1.5                                                                              0.9
                                                                                             0.2
                                                                                             0.7           2.9
                                      1.2                                      2.3
                                                             6.0                             1.3           0.3
                                                                                                           0.4
                                                                                                           0.8
                                                                               2.6           2.4           0.4
                                                                                                           1.0
                                                                                     1
         1H 2020                   1H 2021               Development       MOU              Under         Land
                                                           Pipeline                      Development
         Land held in Fund & Investment Vehicles          China    Japan   South Korea       Australia   India/Others
         Land held on Balance Sheet
         Estimated Total Cost                              GFA (million sqm)                  1H 2020     1H 2021

 GFA (million sqm)               1H 2020     1H 2021       MOU1                                    47%        46%             1H 2020      1H 2021
 Land held on Balance Sheet         41%            41%     Under Development                       28%        31%
 Land held in Funds &               59%            59%
 Investment Vehicles                                       Land                                    25%        22%

Note:
(1)     MOUs as of June 2021                                                                                                                         33
Summary Of 1H 2021 Balance Sheet

US$ million                                  30 Jun 20       31 Dec 20       30 Jun 21

Total Assets                                   6,662           7,687           8,550

Cash                                            947            1,515           1,133

Total debt and other borrowings                2,855           3,295           3,753

Net Debt                                       1,908           1,780           2,620

Net Debt / Total Assets                        28.6%           23.2%           30.6%

▪ Robust cash position of US$1.1 billion as at June 2021, an increase of 19.6% y-o-y
▪ Total debt and borrowings were higher in 1H 2021 to fund the Group’ investments and
  ongoing developments
▪ Healthy gearing of 30.6% which is expected to ease following the completion of
  the ARA acquisition (90% equity financed)

                                                                                         34
Disciplined Capital Management
        Well-managed debt maturity profile
        Debt Maturity Profile                                                                    Debt Currency Profile
        (US$ million)                                                                            As at 30 June 2021
                                                                                                          AUD HKD
                 1,393                                                                                    1%  3%
                                                          1,676
                  37%
                                                           45%                                  SGD
                                                                                                14%
                                                                                                                         USD
                                                                                                                         47%

                                                                                                JPY
                                      495                                                       20%
                                     13%
                                                                                  189
                                                                                  5%

             Within one year   In the second year   In the third to fifth   Beyond five years            RMB
                                                      year, inclusive                                    15%

 ▪        Well-managed debt maturity profile of 4 years with refinancing plans within one year in place
 ▪        Fully exited CNI investment with A$272 million of total proceeds; investment generated a
          23.0% unleveraged IRR1
 ▪        Continue to diversify its funding and capital structure, and maintaining interest cost
          management with weighted interest cost of 4.6% as at 30 June 2021 (Dec 2020: 4.6%)
         -      Mar 2021: Issued S$200 million perpetual resettable step-up subordinated securities at 5.65%
         -      Apr 2021: Entered into a new US$400 million unsecured term loan facility consisting of a 3-year
                US$267 million tranche at Libor +2.75% and a 5-year US$133 million tranche at Libor +3.25%
         -      Jun 2021: Further issuance of S$150 million perpetual resettable step-up subordinated securities
Note:                                                                                                                          35
(1)       Includes dividends
Section 4                            Outlook

  122 Newton Road, Wetherill Park,
    New South Wales, Australia
Going Forward
 Creating APAC’s largest real asset manager powered by New Economy

                                                                                                 Australia
                                                                                                                                   POWERED
                                                                                                                                   POWERED BY
                                                                                                                                           BY
                                      Southeast             Greater                      South                        US /        NEW
                                          Asia                                  Japan             & New      India                NEWECONOMY
                                                                                                                                      ECONOMY
                                                             China                       Korea                       Europe
                                                                                                 Zealand

                                            ✓                  ✓                     ✓    ✓        ✓         ✓
New Economy
  Sectors

                Logistics

                                            ✓                  ✓                     ✓    ✓        ✓         ✓                US$53 billion of AUM
              Data Centers                                                                                                        & >80%
                                                                                                                                        EBITDA
                   REIT
                                            ✓                  ✓                     ✓    ✓        ✓                  ✓            Of Enlarged Group

               Public REITs
                                                                                                                                          10
                                            ✓                  ✓                     ✓    ✓                           ✓             countries in APAC
                                                                                                                              representing over 95% of GDP
              Traditional RE
                  Funds
                                                                                                                                     >30 mil sqm
                                            ✓                                                      ✓                  ✓              Portfolio GFA

              Infrastructure /
               Renewables /
                   Others                                                                                                       >US$10 billion
                                                                                                                                   Development WIP
                                                                                                                                  of Enlarged Group(1)

                                                                                                      Total AUM                 US$7.7 billion
                                                                                                     US$131 billion                 Uncalled capital

 Note:                                                                                                                                                 37
 (1)   Includes LOGOS’ acquisition of Moorebank Logistics Park announced on 5 July
Section 5                                        Next Stage
                                                 Of Growth:
                                     Proposed Acquisition of ARA

   2 Jalan Kilang Barat, Singapore
Next Stage Of Growth
    Next Steps – Proposed acquisition of ARA

▪    ESR has entered into the Acquisition Agreement pursuant to which ESR will acquire 100% of the
     share capital of ARA for US$5.2 billion

▪    The Proposed Transaction is subject to ESR’s shareholders’ approval at an extraordinary
     general meeting which will be convened around October 2021

▪    An Independent Financial Advisor (“IFA”) will be appointed to advise ESR’s independent
     directors and the Shareholders on the terms of the Proposed Transaction. The letter of advice of
     the IFA as well as a letter from the Independent Board Committee will be included in the
     shareholder’s circular which is expected to be dispatched to ESR shareholders on or before 30
     September 2021

▪    Planning for post-deal integration has commenced with focus on alignment in growth strategy,
     culture and operations. An Integration Committee, consisting of senior management of ESR and
     ARA, will be formed

                                                                                                  39
A Landmark Transaction

                            Largest                                            US$36Bn                                              Largest                                          US$95Bn
                         APAC-Focused                                                                                                                                                         (2)
                                                                                                                                                                                         AUM(2)(3)
                                                                                    AUM(1)                                        Real Assets                                           AUM
                          Logistics Real                                                                                     Manager in APAC with                            • US$65Bn: Public REITs,
                                                                                                                             Significant Exposure                               private funds and subsidiaries
                         Estate Platform                                                                                                                                     • US$30Bn: Associates(3)
                                                                                                                               to New Economy

                         37% / 42%                                                      3                                               11(5)                                       58% / 30%
                         Perpetual +                                            Listed REITs                                        Listed REITs                                   Perpetual +
                     Core Capital(4) / AUM                                                                                                                                     Core Capital(2) / AUM
                           Growth(6)                                                                                                                                                 Growth(6)

                                                          59 New Capital Partner Relationships; 9 of Top 20 Global LPs(7)

        US$131Bn                                        US$53Bn
                                                                                                                #1
                                                                                                   APAC Real Asset Fund
                                                                                                                                                         >80%                                      >50%
                                                                                                    Manager Powered by                            EBITDA from New                             Perpetual + Core
        AUM(1)(2), ~2x the                           New Economy AUM;                                 New Economy                                  Economy Real                                Capital with 14
         Closest Peer                                   #1 in APAC
                                                                                                                                                      Estate(8)                                 Listed REITs

Source: Company Information, JLL Independent Market Research, data for peers as of 31 December 2020, or if unavailable, as of latest publicly available figures

Notes:                                                                                                                     (4)   Based on reported AUM as of 31 December 2020 adjusted for announced additions in 1H21
(1)   Reported AUM of US$29.9Bn for ESR as of 31 December 2020 adjusted for AUM announced in 1H21 (Milestone               (5)   5 directly managed REITs, 6 by associates
      Portfolio US$2.8Bn, RJLF 3 US$675MM, Korea Income JV US$500MM)                                                       (6)   2016-2020A CAGR
(2)   Assets under management by ARA Group and its Associates as at 30 June 2021, adjusted for LOGOS’ acquisition of       (7)   Ranked by real estate allocation since 2011 (JLL Independent Market Research, Preqin)
      Moorebank Logistics Park announced on 5 July 2021; data for peers as of 31 December 2020, or if unavailable, as of   (8)   Based on 2020A segment EBITDA, before unallocated corporate costs                       40
      latest publicly available figures
(3)   Associates include Cromwell (“CMW”) and Kenedix (“KDX”)
1       Leading Real Asset Manager in APAC and One of the Largest Globally

The Enlarged ESR Group Will Be The Largest Real Asset Manager in APAC with US$131Bn of AUM and the 3 rd
Largest Listed Real Estate Investment Managers Globally
Largest Real Asset Manager in APAC, Over 2x the Next Largest                                                                                             Propels the Enlarged ESR Group to be One of the Top 10 Real
Manager                                                                                                                                                  Estate Investment Managers Globally
AUM (US$Bn)(1)(2)                                                                                                                                         Real Estate AUM (US$Bn)(3)

                                                                                                                                                                                                                        The Enlarged ESR Group to be the 3rd
  131.7                                                                                                                                                                                                                   largest listed real estate manager
           3.7
  128.0                                         The Enlarged                                                                                              255.7
                                                 ESR Group
                                                is More than
                                                 2x the Next                                                                                                                                                                                 118.5 (1H21)(4)
             95.4                                  Largest
                                                  Manager
                                                                                                                                                                            163.6
                                                                                                                                                                                           140.7    140.7
                                                                                                                                                                                                                        130.7          125.0
                        59.1      56.4                                                                                                                                                                                                            36.3
                                                                               36.3                                                                                                                                                                       102.9                       100.7     100.0
                                                                                                                                                                                                                                                  82.2
                                                  37.3       36.5                     35.7
                                                                               32.6                  33.5                 30.8       30.7
                                   Capitaland

                                                                                                                           Frasers
                                                   Goodman
                         GLP

                                                                                                      Mitsubishi Estate

                                                                                                                                      Mapletree
                                                                                       Charterhall

                                                                                                                                                                                                                                                               AXA IM - Real Assets
                                                                                                                                                                                                     PGIM Real Estate

                                                                                                                                                                                                                          MetLife IM

                                                                                                                                                                                                                                        Nuveen

                                                                                                                                                                                                                                                                                       UBS AM
                                                                                                                                                                              Blackstone

                                                                                                                                                                                            Hines
                                                                                                                                                             Brookfield

                                                                                                                                                                                                                                                                                                 CBRE Global Investors
                                                              Mitsui Fudosan
             (1)

                                                                               (1)

                                                      Balance Sheet AUM                                                                                                   ARA AUM(1)                ESR AUM(1)                               Listed

Source: Company Filings, IPE Real Assets, JLL Independent Market Research
Notes:                                                                                                                                                  available figures; excludes balance sheet AUM
(1)   As of 31 December 2020 for ESR 2020 adjusted for AUM announced in 1H21 (Milestone Portfolio                                                 (2)   ESR and ARA data based on company information; peer data based on JLL Independent Market Research
      US$2.8Bn, RJLF 3 US$675MM, Korea Income JV US$500MM); assets under management by ARA Group                                                  (3)   Real estate AUM only; Peer data as of 30 June 2020 based on IPE Top 150 Real Estate Investment
      and its Associates as at 30 June 2021, adjusted for LOGOS’ acquisition of Moorebank Logistics Park                                                Managers 2020; ESR and ARA data based on company information
      announced on 5 July 2021; as of 31 December 2020 for peers data, or if unavailable, as of latest publicly                                   (4)   Real estate AUM only. Excludes credit AUM                                                                                                                        41
Double Down on New Economy Real Estate with the Leading Platform in
    APAC

                                                                                                                 ESR(1)                             LOGOS(2)             Enlarged ESR Group

                             # of Countries                                                                         7                                       9                    10

                             AUM                                                                                                                                                52.9
                                                                                                                 36.3(3)                                  16.6
                             (US$Bn)                                                                                                                                          ( 45.7%)

                             Portfolio GFA                                                                                                                                      31.5
                                                                                                                  22.6                                     8.9
                             (MM sqm)                                                                                                                                         ( 39.4%)

                             2020A Development Starts                                                                                                                            4.3
                                                                                                                  3.2                                      1.1
                             (US$Bn)                                                                                                                                          ( 34.4%)

                             1H 2021 Development Work In                                                                                                                        10.2
                                                                                                                  5.5(1)                                 4.7(1,2)
                             Progress (WIP) (US$Bn)                                                                                                                           ( 85.5%)

                             Capital Raised in the Past 24 Months                                                                                                                8.6
                                                                                                                 4.8(4)                                  3.8(5)
                             (US$Bn)                                                                                                                                          ( 79.2%)

                             Uncalled Capital                                                                                                                                    7.7
                                                                                                                 4.4(1)                                    3.3
                             (US$Bn)                                                                                                                                          ( 75.0%)

Source: Company Filings

Notes:
(1)   As of 30 June 2021                                                                                   (3)    Reported AUM of US$36.3Bn for ESR as of 30 June 2021
(2)   As of 30 June 2021, inclusive of ARA LOGOS Logistics Trust as of 30 June 2021, adjusted for LOGOS’   (4)    Includes capital raised in FY2019 and FY2020
      acquisition of Moorebank Logistics Park announced on 5 July 2021                                     (5)    Last 2 years to June 2021                                              42
Double Down on New Economy Real Estate with the Leading Platform in
    APAC (Cont’d)
    Major Player with Meaningful Presence in All APAC Regions and Leadership Positions Across Key Markets

                                               ESR + LOGOS                                              GLP                                      Goodman                                               Prologis

                                   AUM(1)           Pipeline(2)         WIP          AUM(3)        Pipeline(2)     WIP            AUM(3)           Pipeline(2)        WIP              AUM(3)           Pipeline(2)         WIP
                                  (US$Bn)           (MM sqm)          (US$Bn)       (US$Bn)        (MM sqm)      (US$Bn)         (US$Bn)           (MM sqm)         (US$Bn)           (US$Bn)           (MM sqm)          (US$Bn)

  #1 dev                             15.0                                                                                           16.4
  pipeline     Australia                                 0.7                             -               -                                             0.3                                 -                  -
               and NZ           (2 Countries)                                                                                  (2 Countries)

   #2 by
  AUM &        China                 10.7                2.5                           32.7             3.0                         4.0                1.4                                2.5               1.1
  pipeline

  #1 dev
               Japan                 9.2                2.6(4)                         16.2            2.2(4)                       3.0                0.2                                8.5               1.1
  pipeline

   #1 by
   AUM         Korea                 9.4                 1.2                             -               -                            -                  -                                 -                  -

   #1 by                                                                                 -
                                     7.0                                                                                                                                                  0.1
   AUM         SEA                                       1.2                           (1               0.2                           -                  -                                                    -
                                (4 Countries)                                                                                                                                         (1 Country)
                                                                                     Country)

   #1 by
   AUM         India                 1.6                 1.0                            1.0             0.5                           -                  -                                 -                  -

   #1 by
AUM, pipeline Total                  52.9                9.2             10.2          49.9             5.9        3.1             23.4(5)             1.9              5.8              11.1               2.2             1.9
  & WIP

    Source: Company Filings, JLL Independent Market Research
   Notes:                                                                                                         (3)    Peer AUM data based on company filings (GLP and Prologis: as of 31 December 2020; Goodman as of 31 March 2021)
   (1)   ESR data as of 30 June 2021; LOGOS data as of 30 June 2021, inclusive of ARA LOGOS Logistics Trust,      (4)    ESR and GLP pipeline in Japan for 2021-2027 based on ESR data
         adjusted for LOGOS’ acquisition of Moorebank Logistics Park announced on 5 July 2021                     (5)    Goodman Group APAC AUM of US$30.6Bn including Hong Kong
   (2)   2021-23 pipeline as of 1Q21; ESR and LOGOS data based on company information. Peer data as per JLL
         Independent Market Research Estimates
                                                                                                                                                                                                                             43
Double Down on New Economy Real Estate with the Leading Platform
in APAC (Cont’d)
Accelerate Rollout of Data Center Strategy with More Expansive Offerings
Selected Data Centers             Over 1,200MW of Pipeline Across Combined Platform                            LOGOS: Korea

        ESR Japan Data Center

                                                                                                             >150
                                                                                                    >100     Japan
Artist Impression Only, Subject to Final Changes
                                                                               Greater China
             Facility Load: 78MW                                                                   South
                                                                                                   Korea
   ESR Hong Kong Data Center                                                              >250
                                                                    India

                                                                     >300

                                                                                        Malaysia
                                                                                         >100
Artist Impression Only, Subject to Final Changes
                                                                            Singapore >160
             Facility Load: 40MW
                                                                                         >100 Indonesia
   LOGOS Jakarta Data Center
                                                                                                          Australia
                                                                                                                 >40

                                                       Total MW

Artist Impression Only, Subject to Final Changes   Partnership with World Class Operators and M&E Providers
             Facility Load: 20MW

                                                                                                                              44
Financial Impact and Synergies
The Transaction Will Create Robust Earnings Growth

EBITDA                                                                                                           Adj. EBITDA(1)
US$MM                                                                                                            US$MM

                                               35%                    772                                                                       55%
                                                                                                                                                             567

                             571
                                                                                                                                    366

                           2020A                     Total for Enlarged ESR Group(2)                                               2020A         Total for Enlarged ESR Group(2)

Potential Synergies

                   Revenue                                                         Cost                                Cost of Capital                      Capital Partners

     • Increased size and scale                               • Reduce back-office                              • Significant cost of capital         • Substantially expanded
     • Significant revenue                                       infrastructure costs                              advantages with                       investor base
                                                                                                                   increased platform size            • Ability to capture more
          synergies across New                                • Streamline overlapping
          Economy offerings                                                                                        and scale                             wallet share of some of
                                                                 country platforms
     • Wider geographical                                                                                       • Ability to leverage ARA’s              the largest global capital
                                                              • Leverage ARA’s deep asset                          deep capital market                   partners
          coverage of APAC
                                                                management capability                              relationships                      • Cover >40% of the top 20
                                                              • More cost effective                             • More diversified lender                global real estate
                                                                 procurement system with                           and borrowing                         investors by AUM
                                                                 the enlarged platform                             relationships

Notes:
(1)   EBITDA excluding revaluation gains on properties under construction and completed investment properties                                                                         45
(2)   Calculated based on 2020A ESR and ARA financial information
Fully Integrated Closed Loop Solutions Ecosystem for Capital Partners

Allows Leading Global Investors to Rebalance Their Portfolios by Divesting Prime Commercial Assets to Redeploy
Back into New Economy Real Estate Where They Are Meaningfully Under-allocated

                                                                                  Private Market Real Estate Investors

                                                                          Pension Funds                     SWFs      Insurance

                                                                                                                                                 Growing
              High Quality                                                                                                                       Exposure
              Prime Assets                                                                                                                      Across New
                                                                                                                                               Economy and
                                                                                                                                                   Other
                                                                                                                                                Alternative
                                                                                    MINIMAL                        SIGNIFICANT                     Asset
             Retail       Office                                                                                                                  Classes
                                                                        capital co-invest                          capital co-invest

              Divesting                                                                                                                        Investing
                                                           Public REITs                                              New Economy Real Estate

 ESR is well-positioned to benefit from a fully integrated closed loop solutions ecosystem to help global capital partners divest Grade A
               real estate with the benefit to re-deploy the capital back into new economy real estate via ESR and LOGOS

Source: Company Filings. FX rate:1 US$ = 6.5 RMB

Notes:
(1)   Includes AUM of listed REITs under management, listed REITs owned by Kenedix and Cromwell Property Group
(2)   Includes unlisted private funds of ARA, as well as balance sheet AUM of ESR                                                                             46
Thank You

                                          For enquiries, please contact Ms. Chang Rui Hua,
                                           Group MD, Capital Markets & Investor Relations

                                                                    DID: +852 55067719
                                                                 Email: rh.chang@esr.com
ESR Ichikawa Distribution Centre, Japan                                       www.esr.com
Section 5                               Appendix

  ESR Chakan 1 Industrial & Logistics
             Park, India
Statements Of Profit Or Loss
                                                                    Interim period ended 30 June
US$ million                                                           2020               2021

Revenue                                                               198                 204
Cost of sales                                                         (61)               (30)
Gross profit                                                          137                 174
Other income and gains, net                                           169                 212
Administrative expenses                                               (86)               (96)
Finance costs                                                         (72)               (80)
Share of profits and losses of joint ventures and associates, net      44                 78
Profit before tax                                                     192                 288
Income tax expense                                                    (47)               (58)
Profit for the year                                                   145                 230
Attributable to:
Owners of the parent                                                  133                 214
Non-controlling interests                                              12                 16
                                                                      145                 230

                                                                                                   49
Statements Of Financial Position
                                                                               As at
US$ million                                                         31 Dec 2020      30 Jun 2021
Non-current assets
Property, plant and equipment                                            32              33
Right-of-use assets                                                      12              12
Investments in joint ventures and associates                           1,082           1,272
Financial assets at fair value through profit or loss                   679             662
Financial assets at fair value through other comprehensive income       878             718
Investment properties                                                  2,664           3,598
Goodwill and other intangibles                                          427             780
Other non-current assets                                                 87              98
Total non-current assets                                               5,861           7,173
Current assets
Trade receivables                                                        95             125
Prepayments, other receivables and other assets                         209             119
Cash and bank balances                                                 1,515           1,133
Assets held for sale                                                      7              -
Total current assets                                                   1,826           1,377
Current liabilities
Bank and other borrowings                                               734            1,393
Lease liabilities                                                        7               6
Trade payables, accruals and other payables                             244             221
Liabilities held for sale                                                                -
Total current liabilities                                               985            1,620
Net current assets / (liabilities)                                      841            (243)
Total assets less current liabilities                                  6,702           6,930

                                                                                                   50
Statements Of Financial Position (Cont’d)
                                                             As at
US$ million                                    31 Dec 2020       30 Jun 2021
Non-current liabilities
Deferred tax liabilities                              281            314
Bank and other borrowings                            2,562           2,360
Lease liabilities                                      7              6
Other non-current liabilities                         47              46
Total non-current liabilities                        2,897           2,726
Net assets                                           3,805           4,204
Equity
Equity attributable to owners of the Company
Issued capital                                         3              3
Perpetual capital securities                           -             260
Equity components of convertible bonds                48               48
Other reserves                                       3,545           3,697
Non-controlling interests                             209            196
Total equity                                         3,805           4,204

                                                                               51
Adjusted EBITDA & Core PATMI
                                                      Interim period ended 30 June
US$ million                                              2020               2021
Profit before tax                                       192                 288
Add:
Depreciation and amortisation                             7                  8
Exchange loss/(gain)                                    (0.7)                2
Finance costs                                            72                 80
Equity settled share option expense                      8                   5
Less:
Interest income                                          (2)                (2)
Fair value gains on investment properties               (126)              (166)
Adjusted EBITDA                                         151                 215

                                                      Interim period ended 30 June
US$ million                                              2020               2021
Profit after tax and minority interests                 133                 214
Less:
Fair value gains on completed investment properties     (26)               (63)

Add back:
Tax effect of adjustments                                6                  11
Equity-settled share option expenses                     8                   5
Core PATMI                                              121                 167
                                                                                     52
Segmental Result
                                                                Six months ended 30 June 2021
                                                                    Fund
US$ million
                                                      Investment Management Development         Total

Segment Revenue                                          54           124          26                204

Revenue from continuing operation                        54           124          26                204

Operating expenses                                       (9)          (27)        (40)          (76)

Fair value gains on investment properties                63            -          103           166
Changes in carrying value of financial
    assets and liabilities at fair value                 (14)          -           6            (8)
    through profit or loss
Share of profits and losses of joint ventures and
    associates, net                                      43            -           35            78
Gain on sale of interests in a joint venture and an
    associate                                             3            -           2             5
Gain on disposal of asset held for sale                   -            -           3             3

Dividend income                                          43            -            -            43

Segment Result                                          183           97          135           415

                                                                                                        53
Segmental Result (Cont’d)

                                                                  Six months ended 30 June 2020
                                                                    Fund
US$ million
                                                      Investment Management Development           Total

Segment Revenue                                             59          84           55             198

Revenue from continuing operation                           59          84           55             198

Operating expenses                                         (20)         (20)        (68)           (108)

Fair value gains on investment properties                   26                 -    100             126
Changes in carrying value of financial assets and
                                                           (10)                -                          1
   liabilities at fair value through profit or loss                                  11
Share of profits and losses of joint ventures and
   associates, net                                          18                 -     26              44

Gain on disposal of subsidiaries                            -                  -     5                    5
Dilution of interests in investment in a joint
   venture                                                  -                  -     (2)              (2)

Dividend income                                             36                 -      -              36

Segment Result                                            109           64          127             300

                                                                                                              54
ESG Framework
      Human Centric                                      Property Portfolio                      Corporate Performance

 • Engaging with our stakeholders                     • Sustainable and efficient solutions      • Corporate governance and risk
 • People are our greatest assets                     • Sustainable building standards             management
                                                      • Responding to climate change             • Corporate policies
 • Seeding positive change in our
   communities                                        • Striving for continuous improvement      • Focus on third-party compliance
 • Designed with occupants in mind                                                               • Responsible investment
                                                                                                 • Disclosure and reporting

Basic human needs are universal.                     We aspire to develop and manage            Strong corporate performance is the
Meeting those needs today while                      logistics facilities for the new economy   foundation upon which we will achieve
ensuring they can continue to be met in              by offering tenants modern, state-of-      sustained and balanced growth giving
the future, is the cornerstone of                    the- art, focused and integrated real      rise to stable returns over the
sustainable development.                             estate platforms.                          long-term.

Focus Areas:                                         Focus Areas:                               Focus Areas:
• Safety, Health & Well-being                        • Sustainable & Efficient Operations       • Financial Performance
• Diversity & Inclusion                              • Sustainable Building Certifications      • Investor Relations
• Community Investment                               • Climate Change Resilience                • Responsible Investing & Finance
• Managing & Developing Talent                       • Biodiversity and Habitat Protection      • Corporate Governance
• Stakeholder Engagement                             • Flexible & Adaptable Properties          • Risk Management
                                                     • Strategic Locations                      • Disclosure & Reporting

                    ESR’s vision for sustainable development and ESG Framework
                    aligns with the United Nations 2030 Agenda. We’ve identified six
                       United Nations goals which we feel we can make the most
                                         meaningful contribution.
                                                                                                                                     55
Building For The New Economy
2020 ESG Highlights

      Human Centric                         Property Portfolio               Corporate Performance               2020 Sustainable Building
                                                                                                                       Certifications

             20%                                   35MW                   New corporate policies formally
           Hire rate                        Installed rooftop solar       endorsed by the Board:
                                               power capacity             • ESR Group ESG Policy
             36%                                                          • ESR Group Supplier Code of
                                                     58                     Conduct
   Female participation rate
                                                                          • ESR Conflict of Interest Policy
                                       Certified sustainable buildings
            +10.9                              in our portfolio
                                                                             ESR ComplianceDesktop®
       Net promotor score                                                    Automated Third Party Due
(indicates our people are happy                     70%                     Diligence Workflow has been
          here at ESR)                   of GFA completed in 2020             fully implemented across
                                        has/in process of certification               all markets

                       On track to achieve our ESG targets set out in Five-Year Roadmap

                       Disclosure & Reporting                                                 MSCI ESG RATING – “A”

     Global Real Estate Sustainability Benchmark (GRESB)                     MSCI ESG Ratings – “A” Rating
     ESR was named “Sector Leader” in Asia for our outstanding               ESR received an inaugural “A” rating, which places ESR
     performance. Four ESR funds in Japan and South Korea                    among the top 20% of companies in the real estate
     stand out in particular by earning four out of five Green Stars.        development and diversified activities industry for ESG
                                                                             performance.

                            For more information, please refer to our ESG Report 2020 on our website.                                   56
Five-Year ESG Targets
Pursuit towards excellence in sustainability set out in five-year ESG Roadmap
 5-YEAR ESG TARGETS

                                 Human Centric                                       Property Portfolio                                          Corporate Performance

                      Safe working environment targeting                  50% increase in solar power generation                 Achieve a 3 Star GRESB rating average
                      Zero Workplace Fatalities                           (from base year 2019)
                                                                                                                                 Maintain a culture of strong corporate
                                                                          Sustainable building certification for 50% of          performance
                      Gender ratio of 40/60 women/men                     ESR’s portfolio
                      (from base year 2019)                                                                                      US$15 million in Social Investment
                                                                          20% reduction in energy consumption                    Programme to our local community
                      Development of community                            across the Group (from base year 2019)                 foundation by 2030
                      engagement/foundation programme

                                                                                                     Plan and Adapt for Change

                                                                                  Conduct regular ESG risk assessments in building safety,
                                                                                  energy efficiency, indoor environmental quality and waste
                           Develop and Embed Systems                                                               and water management.
                         and Processes for the Long-term
 Integrate ESG considerations into all stages of the business cycle              In Australia, we use a climate risk model to inform our buy
which include establishing data management systems, streamlining                      or sell decisions and for the rest of the region, we are
ESG data collection processes and developing policies while setting                       embarking on a climate impact study to shape the
                           annual performance targets and reviews.                                   Group’s approach to climate adaptation.

                                                                                                                                                                     Foster A Culture of
                             Consistent Reporting with Transparency                                                                                                   Active Learning
          Plan to progress in our reporting each year, with honesty and                                                                                 Encourage employees to progress on
           transparency. We will look to produce a GRI adopted ESG                                                                                      continuous learning with annual ESG
         report by 2022, improve our GRESB score and participate at a                                                                                             training for all employees.
           corporate level and become a signatory of the Principles of
                     Responsible Investment (PRI) by 2024.                                                                                         This will pave the way for streamlined
                                                                                                                                              systems and efficient processes, creating a
                                                                                                                   Increase Engagement with        more resilient workforce for the future
                                                                                                                  the people that Matter Most

                                                                                        Implement engagement programmes to promote health & well-
                                                                                           being to provide all our stakeholders with a positive and
                                                                                                           supportive environment.

                                                                                        We will measure our impact with the hopes of creating a culture
                                                                                       of community service and promote harmony with the community.
                                                                                                                                                                                    57
You can also read