Markaz - BBK US Retail Realty Investment Unit III - US$ 50 million Offering to Participate in the Investment in
←
→
Page content transcription
If your browser does not render page correctly, please read the page content below
US$ 50 million Offering to
        Participate in the Investment in

           Markaz – BBK
US Retail Realty Investment Unit III
                     2004
The Fund

                                           US $ 50 Million
                                               Offering in

                     Markaz – BBK US Retail Realty Investment Unit III
                  Investment period of Seven years, extendable by Two additional years

                                           Minimum Subscription
                                      100 units @ US$10,200 per unit
                Any lower subscriptions to be accepted at the discretion of the fund manager

           Projected Annual Cash Yield of 8.5%                  Projected Internal Rate of Return of 9%

                                                 Fund Manager
                                   Kuwait Financial Centre, S.A.K. (Markaz)
                  Mar-Gulf Management Company, Inc. ( a fully owned subsidiary of Markaz)

                   Fund Co-Manager                                 Property and Asset Manager
           Bank of Bahrain and Kuwait B.S.C.                 Developers Diversified Realty, Inc. (DDR)

                                                     2
Offering Snapshots

                                                          Investment Highlights
  • The Offering
    Markaz-BBK US Retail Realty Investment Unit III (“Fund”) seeks to raise $ 50 mn to invest in predominantly grocer anchored retail
    properties in the US. The fund will benefit from the cash flow stability of retail properties and the attractive spread of over 250 basis
    points between the yield on properties (7.75%) and fixed financing cost (5.15%).

  • Portfolio
    Markaz & BBK have identified and secured the acquisition of a portfolio of thirteen retail centers with a Gross Leasable Area (GLA)
    of approximately 1.634 million SF and located in five states. The portfolio is 94% leased and anchor tenants occupy approximately
    72% of GLA. The Portfolio, acquired at USD 208 mn, is financed by approximately USD 150 mn debt (72% of total value) at a fixed
    rate of 5.15% for seven years (Interest only). The 6% vacant space has been leased to DDR for a period of 2 years at market rent,
    resulting in an initial economic vacancy of 0%.

  • Return Objective
    To generate current income that would enable the Investment Unit to distribute and average of 8.5% per annum on the aggregate
    capital investment in the Investment Unit. The internal rate of return on an investment made in the Fund is expected to be 9% after
    taking into effect taxes and other annual fees but before taking into effect any placement fees to be paid to the sponsors.

  • Management fee and Carried Interest
    Management fee of 1.5% of the total investment and a carried interest of 10% after the investors have earned a return of 10% on
    their investments.

  • Subordination of Asset management fee
    The entire asset management fee payable to DDR (6.25% of NOI) has been subordinated to the venture achieving a IRR of 11.5%.
    If at liquidation, the venture achieves an IRR of less than 11.5%, DDR shall reimburse the venture an amount - up to the
    aggregate Asset Management Fee received – to make the IRR equal to 11.5%.

                                                                        3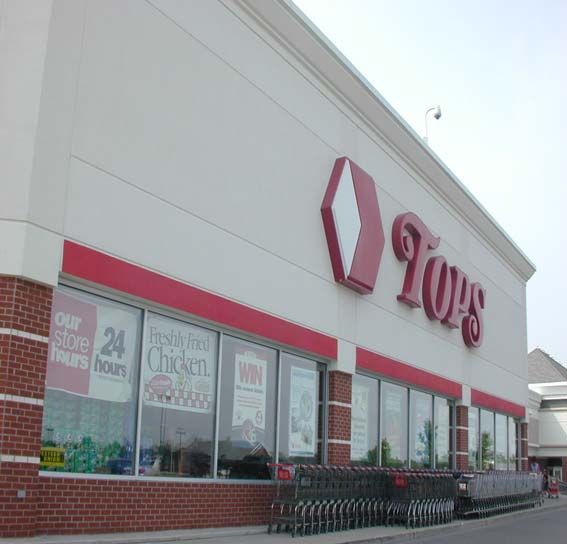
Performance of Other US real estate funds by Markaz & BBK

                          Markaz-BBK Industrial Realty Investment Unit I
  • Markaz and BBK raised approximately $ 43.3 million in equity and an additional $ 114 mn in debt in October
    2002 to acquire a portfolio of distribution warehouses in the USA.
  • The portfolio comprised of 12 distribution warehouses, located in 7 states, with a GLA of 4.3 mn SF and an
    occupancy of over 98%
  • The portfolio was acquired at a capitalization rate of 9.55% and was expected to generate a cash yield of 9%
    and an IRR of over 12% during the life of the fund, which is 7 years starting October 2002.
  • The investment performance has been at or above expectations, featuring monthly distributions to the investors

             10.5%                  Annualized yield on Principal investments
             10.3%
             10.1%
              9.9%                                                                    Actual Yields
              9.7%
              9.5%
              9.3%
              9.1%
              8.9%                                                               Targetted yields
              8.7%
              8.5%
                     N- D- J- F- M- A- M- J- J- A- S- O- N- D- J- F- M- A- M- J- J- A- S- O-
                     02 02 03 03 03 03 03 03 03 03 03 03 03 03 04 04 04 04 04 04 04 04 04 04

                                                           4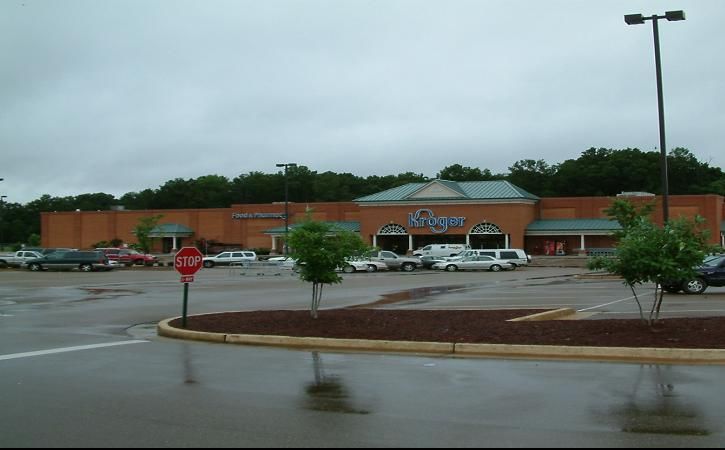
Performance of Other US real estate funds by Markaz & BBK

                            Markaz-BBK Retail Realty Investment Unit II
  • Markaz and BBK raised approximately $ 50.25 million in equity and an additional $ 111 mn in debt in June 2003
    to acquire a portfolio of Retail Properties in the USA.
  • The portfolio comprised of 7 community/power centers, located in 5 states, with a GLA of 1.5 mn SF and an
    occupancy of over 99%
  • The portfolio was acquired at a capitalization rate of 9.05% and was expected to generate a cash yield of 12%
    and an IRR of over 12% during the life of the fund, which is 5 years starting June 2003.
  • The investment performance has been at or above expectations, featuring monthly distributions to the investors

          13.0%                        Annualized yield on Principal investments

          12.5%                                                                                   Annualized yields

          12.0%
                                                                                                      Target Yield

          11.5%

          11.0%
                  S-03   O-03   N-03   D-03   J-04   F-04   M-04 A-04 M-04   J-04   J-04   A-04    S-04   O-04

                                                                 5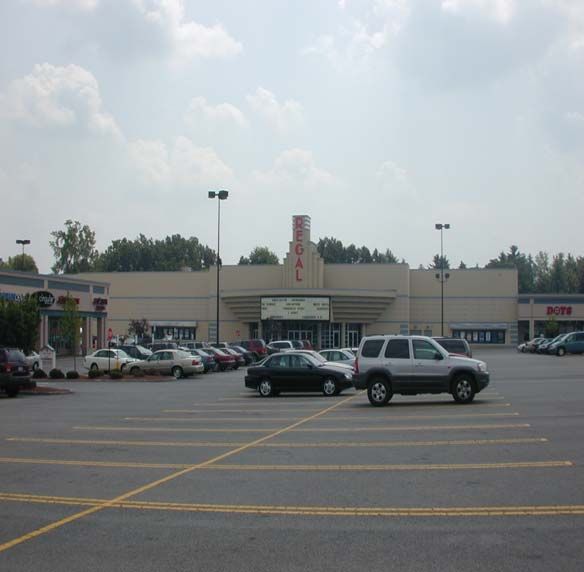
Investment Overview
Investment Overview

            6
Investment Overview

                                                                                                          Fixed
                Real Estate
                                                                                                     Mortgage Rates
            Attractive Cap Rates
                                                        Attractive return on Leveraged Real Estate

   Multifamily
   Multifamily     Retail
                   Retail            Industry
                                    Industry         Office
                                                     Office

                                                                                                          Investors lock in an
                  Largest beneficiary of the shift
                   in consumer preferences                                                                attractive spread.

        Grocery
        Grocery                  Otherretail
                                       retail
                                Other
       anchored
       anchored                   property
                                 property
         center
        center                      types
                                   types

    Stablecash
   Stable  cashflows,
                 flows,            Experienced
                                  Experienced                            9%Return
                                                                            Return
      Longer  leases                Manager                             9%
     Longer leases                  Manager

                                                                                7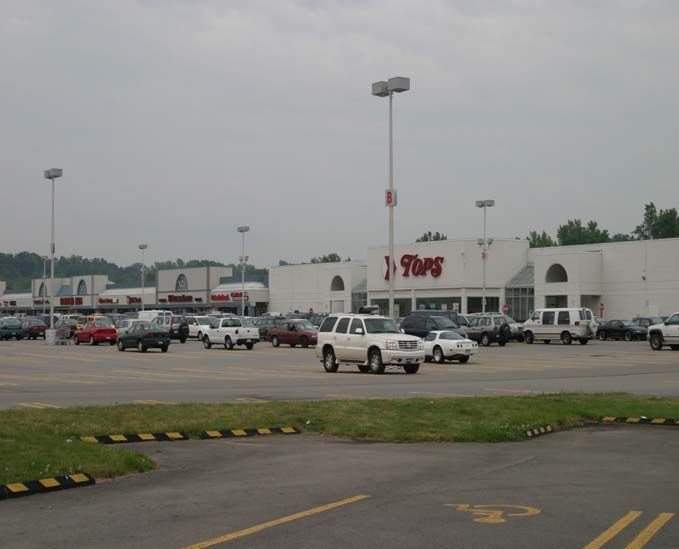
Investment Overview
The Structure
DDR
DDR Investors
Investors
20% Equity 80% Equity
Equity 58 mn.
Property Debt
Property
US$208
208mn
mn US$ 150 mn
US$
Developers Diversified Realty, Inc. (DDR) will retain a 20% equity interest in the Portfolio and will manage it on
behalf of the Fund.
Markaz and its subsidiary Mar-Gulf Management will manage the Fund and be responsible for the acquisition,
disposition, and supervision of the real estate assets.
8
Investment Overview
The Opportunity
Spreads remain attractive, despite rising interest rates
Although interest rates have been on the rise, the spread between the capitalization rates and financing rates
remain extremely attractive for leveraged acquisitions.
Despite the narrowing of spreads from their peaks in early 2003, the current levels are at well above the
average spreads in the past.
10% 5%
9% 4%
8% 3%
7% 2%
6% 1%
0%
5%
-1%
4% -2%
3% -3%
M a r-90
M a r-93
M a r-96
M a r-99
M a r-02
J un-92
J un-95
J un-98
J un-01
J un-04
De c-90
Se p-91
De c-93
Se p-94
De c-96
Se p-97
De c-99
Se p-00
De c-02
Se p-03
M ar-90
M ar-93
M ar-96
M ar-99
M ar-02
Jun-92
Jun-95
Jun-98
Jun-01
Jun-04
Dec-90
Sep-91
Dec-93
Sep-94
Dec-96
Sep-97
Dec-99
Sep-00
Dec-02
Sep-03
Spread Average
Cap Rate 10-year Treasury (%)
Source : Markaz Estimates
9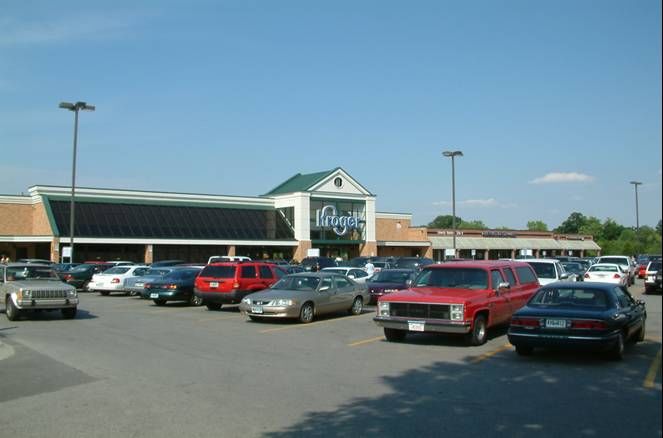
Investment Overview
Real Estate
Superior risk adjusted returns
Real Estate offers a higher component of current income than other investments. On a risk adjusted basis, the real estate sector
has outperformed other major equity indices .
For 9 months ending September 2004, NAREIT index gained 13.7% as compared to 0.2% returns on the S&P, and -1% returns
on Russell 2000 index.
The Low level of correlation between real estate investment returns and other major asset classes makes it an ideal tool for
diversification.
10 years 5 years 3 years 1 year
Return Volatility Yield Return Volatility Yield Return Volatility Yield Return Volatility Yield
NAREIT 12.2% 12.9% 7.6% 15.3% 13.7% 8.0% 16.3% 14.5% 7.5% 21.0% 18.6% 6.8%
NCREIF 10.4% 2.9% 8.6% 9.4% 2.4% 8.4% 8.0% 2.2% 8.2% 10.9% 1.7% 7.7%
S&P 500 11.1% 15.7% 1.7% -2.2% 16.6% 1.5% -1.5% 16.4% 1.7% 13.2% 8.9% 1.6%
ML Bond Index* 7.3% 4.4% N/A 7.4% 4.6% N/A 6.2% 5.5% N/A 4.6% 6.5% N/A
* Includes government and private bonds
Source : NAREIT
10Investment Overview
Retail Real Estate
Attractive Investment Attributes
• Historically, total returns on Retail Real Estate investments have been relatively stable compared to other property
types.
• The Demand-Supply gap for retail Real Estate is under check due to minimal speculative developments; Anchor leases
have to be in place for feasible development.
• Over the long term, “Same-store NOI” growth remained flat to positive for retail properties, whereas all other real
estate sectors have recorded negative same-store NOI growth. For the quarter ending Sep 2004, Retail recorded the
strongest NOI growth among all property types.
10% Multi-
8% SS NoI Growth family Industrial Office Retail
6%
Over 25 Years
4%
Income Volatility 0.8% 0.8% 1.0% 0.9%
2%
0%
Capital Appreciation Volatility 5.7% 5.6% 8.3% 4.7%
-2%
3Q 2004 Results Total Return Volatility 6.2% 6.2% 9.0% 5.2%
-4%
Multifamily
Industrial
(0.7%)
1.8% Last 10 Years
-6% Office
1
(1.9%) Income Volatility 0.9% 0.5% 0.5% 0.3%
Retail 3.0%
-8% Capital Appreciation Volatility 1.2% 3.0% 5.6% 3.9%
-10% Total Return Volatility 1.8% 3.3% 5.9% 4.4%
1Q 3Q 1Q 3Q 1Q 3Q 1Q 3Q 1Q 3Q 1Q 3Q 1Q 3Q
98 98 99 99 00 00 01 01 02 02 03 03 04 04
Multifamily Industrial Office Retail
Source : MCP/Green Street Advisors Source : MCP/NCREIF
11Investment Overview
Grocery anchored retail properties
Cycle resistant, generating significant consumer traffic
Necessity nature of the products sold in the community Average Sales PSF
centers such as food, medicines, clothing etc minimizes
impact of economic volatilities on store profitability; Food $300
$277
sales account for almost 9.6% of the GDP, more than any
$250 $238
other retail sector. $215
Absolute occupancy cost is lower due to overhead costs and $200
CAM costs being substantially lower due to minimal $160
$150
enclosed common area, lower construction and smaller
areas and due to lower Real estate taxes. $100
Shopping Center fundamentals continue to be positive given
$50
consumer spending.
Effective rent growth up from 1.1% in 2002 to 2.3% in $0
Super Regional Community Grocery-
2003. Regional Malls Centers Anchored
Malls Centers
Vacancy rates remained constant at 7% in 2003 from
2002 and have held at 7% through 2Q 2004.
Source : Dollar & Cents, 2004
Recession resilient; sector has experienced positive net
absorption every quarter over the past 4 years.
Institutional investors rate grocery-anchored retail the most
favorable investment opportunity among 10 sectors.
12Investment Overview
Retail Real Estate Property Definition
Sq Ft, Including
Types Concept Acreage Typical Anchor Anchor Primary
anchors
Number Type Ratio * Trade Area **
Neighborhood
Convenience 30,000-150,000 3 to 15 1 or more Supermarket 30-50% 3 Miles
centers
Discount dept store,
General
Community Supermarket, drug, home
merchandise, 100,000-500,000 10 to 40 2 or more 40-60% 3-6 miles
Center improvement, large
Convenience
specialty/discount apparel
General
Full-line dept store, Jr.
merchandise,
Regional center 400,000-800,000 40 to 100 2 or more dept store, mass 50-70% 5-15 miles
fashion (mall, typicall
merchant, fashion apparel
enclosed)
Similar to regional Full-line dept store, Jr.
Super Regional center, but has dept store, mass
800,000 plus 60 to 120 3 or more 50-70% 5-25 miles
center more variety and merchant, fashion
asortment apparel
Fashion / higher-end, fashion
80,000 - 250,000 5 to 25 N/A Fashion N/A 5-15 miles
Specialty Center oriented
Not usually anchored, but
Upscale specialty may include large format
Typically 150,000-
stores; dining and book store, multiplex
Lifestyle Center 500,000, but can 10 to 40 0 to 2 0-50% 5-8 miles
etntertainment in cinema, small
vary
outdoor setting department(s) and other
big boxes
Category killer, home
Category dominant
improvement, discount
Power Center anchors, few small 250,000 - 600,000 25 to 80 3 or more 75-90% 5-10 miles
dept. store, warehouse
tenants
club, off-price
* The share of a center's total square footage that is attrib uted to its anchors
**The area from which 60-80% of the center's sales originate
Source : www.ICSC.org
13The Portfolio
The Portfolio
14Portfolio Overview
Quality Portfolio
Attractive Asset Class
Comprises of 12 grocery anchored and a power center.
High Quality
Properties are generally located in suburban areas with moderate to strong buying
portfolio
power.
Average age of properties is 20 years.
Properties leased to high-quality anchors, reducing risk of default, greatly Cash Flow
enhancing ability of re- tenanting/releasing non-anchor space . Stability
Properties leased to 180 tenants with no single lease accounting for more
than 5% of portfolio GLA .
Average remaining lease term for key anchor space is approximately 11 years. Less than 45% of the tenant space
lease (predominantly non-anchor space) is due for renewal within 7 years (life of the investment).
15Portfolio Overview
Unique structuring
Enhancing the investment value
The venture shall pay 6.25% of the NOI as annual asset management to DDR.
However, such fees shall be subordinated to the venture achieving a minimum
Subordination
IRR of 11.5% over the 7 year period.
of fees
Any shortfall in the IRR shall be recovered from the asset management fee
payable to DDR.
The entire physical vacancy of approximately 6% of GLA is “master-Leased” Master lease
to DDR for a period of 2 to 5 years at Market rents, boosting the cash flows structure
and enabling a stable distribution policy.
16Portfolio Overview
Qualified Asset Manager
• Based in Cleveland, Ohio, DDR is a Real Estate Investment Trust ("REIT") based in Cleveland, Ohio. DDR is a
fully integrated real estate firm, actively developing, acquiring, operating, managing and investing in income-
producing retail shopping centers nationwide with a market capitalization of over $ 8 bn.
• Subsequent to recent acquisitions of the JDN and Benderson portfolio’s, DDR currently owns and manages over
460 retail properties in 44 states totaling over 102 million square feet of real estate under management.
• DDR has strong relationship with most of the national retailers such as Wal-Mart, Kroger's, Jewel, Kohl’s and
have an impressive record in re-tenanting properties.
17Portfolio Overview
Geographical Locations
18Portfolio Overview
Properties of the Fund
Acquisition
Total GLA Number of Occupancy Total Value Price ($ per
Center Name City State Year Opened (Sq Ft) Tenants Cap Rate ($'000) SF) Key Anchors
Midway Plaza Loganville GA 1995 91,196 16 9.11% 99% $10,281 $113 Kroger
Oxford Place Oxford MS 2001 71,866 7 6.85% 97% $3,558 $50 Kroger
Northcreek Commons Goodlettsville TN 1987 84,441 12 8.15% 95% $7,279 $86 Kroger
Chillicothe Place Chillicothe OH 1974 105,512 6 10.75% 100% $8,330 $79 Kroger
Tops Robinson Amhers NY 1986 145,192 17 6.75% 100% $16,379 $113 Tops
Tops Jamestown Jamestown NY 1997 98,001 4 7.60% 90% $15,128 $154 Tops
Tops Leroy Leroy NY 1997 62,747 7 7.74% 100% $7,000 $112 Tops
Tops Ontario Ontario NY 1998 77,040 11 7.30% 100% $9,394 $122 Tops
Tops Warsaw Warsaw NY 1995 74,105 8 7.50% 94% $8,611 $116 Tops
Culver Ridge Irondequoit NY 1981 226,382 29 8.10% 96% $28,330 $125 Regal Cinemas
Crossroads Centre Orchard Park NY 2001 167,805 15 7.35% 88% $24,555 $146 Tops
Panorama Plaza Rochester NY 1959 278,241 40 7.20% 96% $45,711 $164 Tops
Tops Union Road Cheektowoga NY 1983 151,357 9 8.35% 78% $19,216 $127 Tops
Total / Weighted Average 1984 1,633,885 181 7.75% 94% $203,773 $125
Source : Markaz
19Portfolio Overview
2004 Demographic profile for 3 mile radius
Population Household Income
Midway Plaza 27,861 9,304 $81,736
Northcreek Commons 21,828 8,857 $58,985
Oxford Place 17,644 6,271 $43,770
Tops - Jamestown 39,028 16,517 $39,242
Tops Plaza - Leroy 6,875 2,735 $52,729
Tops Plaza - Ontario 8,176 3,061 $64,251
Tops - Robinson Rd. Plaza 65,328 25,359 $54,476
Tops - Warsaw 4,795 1,868 $46,490
Tops - Union Road 96,848 41,445 $45,918
Chillicothe Place 28,066 10,285 $44,942
Panorama Plaza 55,006 22,180 $84,564
Culver Ridge 75,788 31,462 $54,179
Crossroads 42,854 17,391 $65,792
20Portfolio Overview
Lease Renewal Cycle
10.0% Annual Lease Expiration Schedule
8.0%
4.7% 1.3%
6.0% 1.6%
8.6% 5.7%
4.0%
2.5% 5.8%
4.8% 5.1%
2.0% 4.1%
1.1%
1.8% 1.4%
0.7%
0.0%
2005 2006 2007 2008 2009 2010 2011 2012
Anchor Non-Anchor
Approximately 66% of the GLA is leased to anchor tenants. The average remaining lease term for the key anchors is approximately 11 years and
lease contracts equivalent to approximately 42% of the portfolio GLA is due to expire before the anticipated seven-year term of the investment unit.
Almost 67% of such expiring leases (approximately 28% of the Portfolio GLA) are occupied by non-anchor tenants, while the remaining 33% of the
expiring leases (approximately 14% of the Portfolio GLA) are occupied by anchor tenants (i.e. tenants leasing space of over 10,000 SF).
21Portfolio Overview
Tenant Profile
Lease expirat ion Rent
Tenant Propert y Area Dat e Per Sq Ft
T ops Market T ops - Robinson 82,897 Dec-10 6.31
T ops - Union 78,000 Dec-13 11.60
T ops - Jamestow n 77,000 Sep-18 11.74
Panorama Plaza 74,000 May-14 12.84
Crossroads Cent re 57,000 Mar-22 10.75
T ops - LeRoy 47,000 May-17 8.81
T ops - Ont ario 47,000 Aug-19 9.04
T ops - W arsaw 45,533 Jun-15 8.58
508,430
Kroger Midw ay Plaza 63,296 Jan-16 8.59
Chillicot he Plaza 60,425 Nov-25 9.22
Nort hcreek Commons 59,134 Oct-12 7.12
Oxford Place 58,666 Aug-20 2.59
241,521
Regal Cinema Culver Ridge Plaza 58,012 Jun-22 6.95
Dollar T ree T ops - Union 14,098 Nov-17 8.30
Panorama Plaza 9,000 Jun-11 10.50
Culver Ridge Plaza 8,383 Sep-16 8.00
T ops - Robinson 4,860 Apr-08 10.00
T ops - LeRoy 4,000 Sep-07 8.50
T ops - Ont ario 4,000 Sep-07 9.10
T ops - W arsaw 4,000 Jun-06 9.00
48,341
Blockbuster Culver Ridge Plaza 6,650 Dec-08 13.50
T ops - Robinson 6,500 Oct-05 14.38
Panorama Plaza 6,361 Feb-05 12.00
Crossroads Cent re 6,310 Oct-09 17.00
T ops - Union 5,000 Mar-14 18.58
T ops - LeRoy 4,692 Oct-10 14.18
T ops - Ont ario 3,000 Jun-05 12.00
38,513
22Portfolio Overview
Top Five Tenants
Tops Tops Market LLC is a fully owned subsidiary of Royal Ahold group, which is one of the largest
Tops
Markets
retailers in the world. Tops owns supermarkets under the name Tops Friendly Markets and
neighborhood food stores under the name Wilson Farms as well as supermarket franchisees
Markets operating under the Tops Friendly Markets and Wilson Farms names. As of December 2003, Tops
Market had 365 stores in operation generating sales of over $ 3 bn in Fiscal 2003. Tops primary
markets are Buffalo and Rochester, both in New York State, as well as markets in Cleveland, Ohio,
and northern Pennsylvania. Tops is the largest grocer in Buffalo with a market share of over 50%,
while it is the second largest grocer in Rochester with a market share of around 19%.
Krogers The Kroger Co. is one of the nation’s largest grocery retailers and is ranked #19 on the Fortune 500
Krogers list. The company’s principal operating format is combination food and drug stores (combo stores).
In addition to combo stores, Kroger also operates multi-department stores, price-impact warehouses,
convenience stores, fuel centers, jewelry stores, and food processing plants. At the end of the second
quarter of fiscal 2004, the Company operated (either directly or through its subsidiaries) 2,530
supermarkets and multi-department stores in 32 states under two dozen banners including Kroger,
Ralphs, Fred Meyer, Food 4 Less, King Soopers, Smith’s, Fry’s, Fry’s Marketplace, Dillons, QFC and
City Market. Kroger also operated (directly or through subsidiaries, franchise agreements, or
operating agreements) 792 convenience stores, 439 fine jewelry stores, 502 supermarket fuel centers
and 42 food processing plants. Total sales for the second quarter of 2004 increased 5.1% to $13.0
billion. Identical food-store sales, including fuel, increased 2.1% and, excluding fuel, increased 0.6%.
23Portfolio Overview
Top Five Tenants
Regal Regal Cinemas (RCM) operates the largest and most geographically diverse theatre circuit in the
Regal
Cinema
United States, consisting of 5,110 screens in 430 theatres in 37 states as of January 1, 2004, with
over 225 million annual attendees. In addition, Regal Cinemas operates 935 screens in 120 theatres
Cinema for United Artists Theatre Circuit, Inc., a subsidiary of REG. The Company's geographically diverse
circuit includes theatres in 9 of the top 10 and 43 of the top 50 U.S. designated market areas, which
includes locations in suburban growth areas. The Company primarily operates multi-screen theatres
and has an average of 11.9 screens per location, which is well above the 2003 average of 5.9
screens per location for the North American motion picture exhibition industry. The Company
develops, acquires and operates multi-screen theatres primarily in mid-sized metropolitan markets
and suburban growth areas of larger metropolitan markets throughout the U.S.
Dollar Tree operates a chain of more than 2,500 discount variety stores in 47 states, offering a wide
Dollar Tree assortment of everyday general merchandise at $1.00 or less. Its stores, designed to be the modern
Dollar Tree day equivalent of traditional variety stores, offer a wide assortment of everyday general merchandise
in many traditional variety store categories, including consumables (candy and food, health and
beauty care, and households), seasonal goods, and variety merchandise (toys, durable house wares,
gifts, hardware and other items). At May 1, 2004, the company operated 2,579 stores, in 47 states,
under the names Dollar Tree, Dollar Express, Dollar Bills, Only One Dollar, Only $One, and
Greenbacks. In FY 04 (Jan.), DLTR opened 183 stores, acquired 100, closed 42, and expanded or
relocated 124. Retail selling square footage increased 28%, to 16.9 million sq. ft. The company aims
to continue to expand its store base by concentrating on strip center locations anchored by mass
merchandisers and selected mall-based locations. DLTR planned to boost square footage by about
20% in FY 05, supported by a capital spending budget of about $199 million.
24Portfolio Overview
Top Five Tenants
Blockbuster Inc. is a leading global provider of in-home rental and retail movie and game
Blockbuster entertainment, with over 9,000 stores in the United States, its territories and 25 other countries as of
Blockbuster September 30, 2004. During the first nine months of 2004, the company added 278 company-
operated stores including the net addition of approximately 100 locations offering retail game sales
only, which are primarily Game Station and Rhino stores. They closed 180 company-operated stores
during this period. The continued weakness in the in-store rental industry was the primary driver in a
6.6% decline in worldwide same-store rental revenues in the first nine months of 2004. This decline
was partially offset by a 4.4% increase in worldwide same-store retail revenues, which were driven
primarily by strong growth in domestic retail game sales and international retail movie and game
sales. In October 2004, Viacom Inc. announced the successful completion of its divestiture of its
ownership interest in Blockbuster. To accomplish the divestiture of Blockbuster, on September 8,
2004, Viacom launched an offer to its stockholders to exchange, on a tax-free basis, some or all of
their shares of Viacom stock for shares of Blockbuster held by Viacom.
25Wal Mart risk assessment
WALMART RISK ASSESSMENT
WalMart Store/ Wal mart
Supercenter Comments
1 mile 5 miles 10 miles
Kroger, Midway Plaza, Very strong sales PSF, strong demographics, Wal mart opened 6 months
0/1 0/1 0/1
Loganville, GA ago, marginal decline in market share of Kroger, likely to be recovered
Sparesly populated, but positive growth till 2008, Opening of
Kroger, Oxford Place,
0/1 0 0 Walmart impacted Kroger marginally; however market share
Memphis
retained
Kroger, Northcreek,
0 1/0 1/0 No Super center, robust Kroger store sales, potential supercenter risk
Goodletsville, TN
Tops, Jamestown 0 1/0 0 Demographics may not support a new Walmart
Tops, Crossroads
centre, Orchard Park, 0 1/0 1/0 Strong Tops Sales, no visible impact of Wal Mart
Buffalo
Tops, Union Road, Moderately high sales, strong demographics, Walmart within 1
1/0 0/1 1/0
Cheektowoga, NY mile radius, risk minimized
Tops, Panorama Place, Seasoned centre, competitive markets, strong Wal Mart presence, further
0 0/1 2/1
NY risk minimized
Tops, Warsaw, NY 1/0 0 0 Wal mart exists within a mile, no additional openings expected
Tops, Ontario 0 0 0 Demographics may not support a new Walmart
Tops, Leroy 0 0 0 Demographics may not support a new Walmart
Tops, Robinson 1/0 0/1 1/0 Strong Tops Sales, no visible impact of Wal Mart
Krogers, Chillicothe 1/0 0 0 Strong same store sales for Kroger, Absorbed impact of Wal Mart
¾ WalMart’s food retailing business is growing at almost 15-17% per annum. On a National basis, market share of Wal Mart in food retailing
is expected to increase from 14% to 28% by 2012, predominantly at the cost of the smaller local grocers.
¾ WalMart risk is predominantly restricted to 10 of the 12 centers in the portfolio which are anchored by grocers, Tops and Kroger
¾ We feel that there is a low probability of WalMart opening supercenters in Tops- Ontario and Tops-Leroy, which currently do not have a
Wal-Mart in their vicinity.
26Other Key Risk Factors
• Increase in cap rates
¾ Increase in interest rates
Cap rates have declined from approximately 9% to around 7%-7.25% over the last 18 months. Despite the recent rise in
interest rates, the cap rates have remained stable or in most instances declined further. This is largely on account of strong
inflows from un-levered investors. Going forward, our IRR calculations are based on a 50 bps expansion of cap rates at the
time of exit
¾ Decline in fundamentals
Cap rates would increase if the market perceive that the fundamentals would weaken
• Retail : Historically retail sales have remained stable even during recessions; Volatility in revenue growth has been in
the range of 0%-2% during the last 23 years over the various economic cycles
• Specific product class : Grocer anchored centre cater to the basic needs of value driven people, less sensitive to
downward trends;
• Decrease in net income
¾ Rents
Overall, potential market decline in rents will marginally impact the portfolio because of a
¾ Longer average lease period
¾ Mature properties, with settled tenants generating attractive sales in their occupied spaces ; thus unlikely to demand
lower rents upon renewals
¾ Vacancy
¾ Emerges from the credit risk; credit worthy tenants
¾ In case of any potential vacancies, properties can be re-leased in a timely and efficient due to management
expertise of DDR
27Management
Management
28The Management
Kuwait Financial Centre (Markaz)
• One of the largest and most respected investment company in Kuwait, managing assets more than $2.3 bn
in domestic and international markets
• Active in the US real estate market since 1978, and has actively managed real estate investments through
various cycles.
• Domestic equities funds currently managed by Markaz are the best performing funds in Kuwait, consistently
outperforming the index and other funds.
• Corporate team with a cumulative active experience of over 80 years in the US and Kuwait real estate
markets.
• Markaz would offer liquidity on a limited basis to the investors by being a market maker
29The Management
23 funds under management
Diversification Providing Markaz Global Asset Allocation capability across five continents and
several asset classes.
Multi funds – Multi managers
Markaz’s multi manager concept is founded on the principle of picking the best
Sophistication manager for each class, ensuring superior returns to its investors. Our concept is
applied across all of our equity and hedge funds.
Domestic Equities KD 435 million Size
International Equities UD$ 175 million
Over US 2.3 Billion
Private Equities US$ 203 million
Real Estate US$ 467 million
The Best Performing Domestic Funds
Performance Mumtaz Fund: 442% return since inception in 1999.
Midaf Fund: 184% return since inception in 2001.
30Markaz’s Structured Product
Superior Execution Capabilities: Through a team of Corporate Finance and Investment
professionals enabling Markaz to provide its clients with unique investment products and the means
to help them reach their business objectives. Some of our structuring achievements include.
Structuring the first Money Market Fund in Kuwait.
Issuing the largest bond issue [NIG].
Structuring the first tradable Islamic Fixed Income Paper (non sukouk) [A’ayan].
Structuring the first Bond Issue to be secured by BOT Projects in Kuwait [KCMCC].
Structuring and implementing the first Stock Options Market in MENA.
Structuring the 1st Hedge Fund ever in a market the size of Kuwait [Forsa].
Structured and successfully placed three US real estate focused sector specific funds.
31The Management
Kuwait Financial Centre (Markaz)
Manaf A. Al-Hajeri- General Manager
Prior to joining Markaz, Mr. Al Hajeri was the Deputy Director of the Investment Department of the Kuwait Fund for Arab
Economic Development (KFAED) where he was actively involved in the investment banking activities. He represented KFAED on
project financing activities in Asia, Africa, Europe, Latin America and the Middle East. Mr. Alhajeri joined Markaz in March 2004
as General Manager.
Certified Financial Manager (CFM), Institute of Management Accountants, New Jersey, USA
Masters Degree in Civil Engineering, Kuwait University
Ali H. Khalil - Executive Vice President
Upon graduation from Texas University, Mr. Khalil worked as chief engineer for a steel structure firm in Kuwait and later
worked as a Research Associate at INSEAD. Mr. Khalil, joined Markaz group in 1988 to hold positions until today in its affiliated
companies in the US. In 1997, he moved to Kuwait to join Kuwait Financial Centre (Markaz) as its Executive VP – Finance and
also heads the Corporate Finance Department. He is the president of an affiliate of Markaz, Gulf Pacific America, an investment
fund focused on US real estate, and President of Mar-Gulf Management.
Texas A&M – B.S. Industrial Engineering, M.S. Industrial Engineering
INSEAD - MBA
Gopal Menon - Executive Vice President – International Investments
Mr. Menon started his investment career with Kuwait International Finance Co., and later joined Kuwait Foreign Trading and
Contracting Co. as Chief Securities Dealer and Portfolio Advisor, a position he maintained until 1985. In late 1985, he moved to
London to work for Union Bank of Switzerland as Assistant Director and Head of Middle East Sales and in 1988, he became a
Partner and Director of Newcrest Investment and Securities Ltd, London. In 1995, he joined Merrill Lynch International Bank as
a private banker and in 1997, was appointed Executive Director and Head of London Operations of Taib Bank – Bahrain. Mr.
Menon joined Kuwait Financial Centre (Markaz) in 2000 as Executive Vice President – Investments.
Kerala University, India – Masters of Economic
32The Management
Kuwait Financial Centre (Markaz)
Maha Al-Kadi, Vice President – Fund Structuring & Private Equities
After obtaining her BA in Business Management in 1990, Ms. Al-Kadi joined Banque de la Méditerranée, Sal – Beirut, where she worked for
seven years, and became Junior Credit Officer in charge of Letters of Credit and Guarantee at the bank's branch in Sidon. In October 1997,
she joined Markaz as back office support for the private equity group. She later moved to perform review and due diligence on private
equity fund investments and was promoted to Assistant Vice President in 2000, and in December 2003 was promoted to Vice President.
Lebanese American University, Beirut - BA Business Management
Kumar Srinivasan, Vice President – Corporate Finance
After obtaining his MBA in 1994, Mr. Srinivasan worked as an Analyst (Equity Research) for J.M. Share and Stockbrokers Ltd. India and
subsequently as Analyst, Corporate Finance with J.M. Morgan Stanley Ltd., India. In November 1999, he joined as a Senior Analyst with
Gulf Investment Services in Muscat, Sultanate of Oman. In October 2001, he joined Kuwait Financial Centre S.A.K. (Markaz) as Assistant
Vice President in the Corporate Finance Department and in November 2002 was promoted as Vice President.
Poona University, India – B.S. Computer Science and MBA with specialization in Finance
Hadi Salame, Financial Analyst – Product Structuring
Mr. Salame received his Bachelors Degree in Business Administration from the American University of Beirut in 2001. Mr. Salame joined
Kuwait Financial Centre in September 2001 as Assistant Analyst and now is a Financial Analyst in the Product structuring department.
American University of Beirut – BBA Business Administration
33The Management
Mar-Gulf Management Company, Inc
Mar-Gulf, a fully owned subsidiary of Markaz, was established in 1988 for the sole purpose of acting as the asset
management arm of Markaz in the United States. MGM’s office is located in Los Angeles, California, each of its
professional staff has over 12 years' experience in the acquisition, disposition, development and management of
real estate properties in the US.
Advisory Services
Asset Management
• Review of evaluation of real estate portfolio.
• Rebalancing real estate portfolios • Acquisition and Disposition of Properties
• Valuation of properties. • Coordination of property management,
• Auditing existing operations, recommending leasing and repositioning of properties to
changes maximize value
• to optimize returns.
• Renovation of properties
• Initiating, coordinating and managing
litigations.
Corporate & Ownership matters
Property Development
• Financial Management and Accounting
• Entitlement and Zoning of properties
• Ownership structuring • Coordination of construction
• Tax planning and restructuring • Pre-leasing and leasing of properties
• Financing and refinancing of debt
34The Management
Mar-Gulf Management Company, Inc
Ali Khalil - President
Sami Shabshab - Vice President
Mr. Sami Shabshab has been active in the real estate and construction field for 17 years. His experience ranges from
structural engineering to general contracting and construction management. He has been involved in numerous renovation
and rehabilitation projects as well as new construction. His real estate consulting firm, Shabcon, established in 1987, also
provided services such as market analysis and research for real estate appraisers and investors. Mr. Shabshab joined Mar-Gulf
Management in 1993 and now acts as Vice-President. He is responsible for operations, with special focus on turnaround
situations and under-performing assets.Mr. Shabshab graduated from the American University of Beirut in 1984, where he
majored in civil and structural engineering. In addition to his general contracting license and designation as a professional
engineer (PE), Mr. Shabshab also holds a California real estate broker license.
Ani Soghomonian - Treasurer
Ms. Ani Soghomonian is the Treasurer of Mar-Gulf Management and responsible for all financial reporting. She is in charge of
corporate affairs, preparing financial statements, tax planning and compliance, investor relations and reporting, financial
reporting of projects, review and analysis of all financial reports and projections of properties and cash management of
portfolio assets. Ms. Soghomonian has been working with Mar-Gulf since 1984. She has a bachelor’s degree in business
administration and is a Certified Public Accountant licensed by the California Board of Accountancy.
35The Management
Bank of Bahrain and Kuwait
• Founded in 1971, BBK is one of the largest commercial banks in Bahrain.
• BBK offers a wide range of banking services including retail, corporate, international and investment
services to an institutional and high net worth client base.
• With a large branch network in Bahrain, BBK also has a presence in Kuwait, Dubai, Mumbai and Hyderabad.
• The Investment Services Department has been active in providing investment opportunities and advice
ranging from conservative guaranteed funds to a high risk private equity funds.
• BBK aligns its interests with those of its clients by investing in the funds it provides.
36The Management
Bank of Bahrain and Kuwait
Dr. Fareed Ahmed Al Mulla, General Manager & Chief Executive Officer
Dr. Al Mulla joined BBK in 1990 as an Assistant General Manager of International Banking Division. In 1997, he was promoted
to Deputy General Manager - Banking Group. In 2001, he assumed the responsibility of General Manager of BBK. Prior to
joining BBK, Dr. Al Mulla was Vice President and Head of Specialized Financing Division at Gulf International Bank (GIB). Dr. Al
Mulla has 21 years of banking experience.
B.A. in European Studies, Master of Science in social science and PhD in Economic and International Relations, University of
Sussex (UK).
Mr. Ahmed Ali Ahmed Al Banna, Deputy General Manager – Banking Group
Mr. Al Banna joined BBK in 1987 to assume the position of Assistant General Manager – Human Resources. Between 1996 and
2001, he headed the Retail Banking Division and International Banking Division. In August 2001, he was promoted to Deputy
General Manager – Banking Group. Prior to joining BBK, Mr. Al Banna was Director of Human Resources with Citibank –
Bahrain. Mr. Al Banna has 20 years of banking experience.
BSc from the University of Houston (USA).
Mr. Abdulrasool Mohamed Abdulmajeed Turki, Assistant General Manager –Treasury and Investment Division
Mr. Turki joined BBK in July 2004 as Assistant General Manager – Treasury and Investment Division. Mr. Turki has 26 years of
banking experience around the region and in a number of business areas, including Treasury products, financial institutions
and wealth management. His work experience includes the following organizations: Forsyth Partners, Merrill Lynch, Standard
Chartered Bank, Bahrain International Bank, Gulf International Bank, Arab Asian Bank.
Diploma in science from People’s College (Major in math, biology, physics and chemistry) Nottingham, England.
37The Management
Bank of Bahrain and Kuwait
Mr. Suhail Mohamed Hajee, Senior Manager, Head of Representative Office – Dubai
Mr. Hajee joined BBK in 1996 as Manager of the Investment Services Department. In 1998, he was promoted to Senior
Manager. Prior to joining BBK, Mr. Hajee was an Investment Advisor with Integrated Financial Concepts Inc., a specialized
financial planning firm based in Vancouver, Canada from 1991 to 1996. He has also worked as a general equity analyst covering
the U.S. market and as a portfolio manager for Gulf equities at Arab Insurance Group (ARIG) in 1990-1991. Mr. Hajee has 16
years of investment and banking experience.
B.Eng. from Concordia University – Montreal (Canada) and an MBA from McGill University, Montreal (Canada) and Executive
Development Program from Darden Graduate School of Business Administration, University of Virginia.
Khulood Al Qattan, Head of Investment Services Department
Ms. Al Qattan has 17 years of banking experience, mainly in the investment field. She started her career as a trader in U.S. and
European equities and has gained experience in Capital and Money Market Instruments in the local, regional and international
markets. Currently, Ms. Al Qattan manages BBK’s proprietary investment portfolio and is also responsible for client's advisory
services, structuring products for BBK’s clients, as well as being involved in various corporate finance deals.
B.Sc. in Accounting from the University of Ayn Shams – Egypt.
38The Management
Developers Diversified Realty, Inc (DDR)
• Based in Cleveland, Ohio, DDR is a Real Estate Investment Trust ("REIT") based in Cleveland, Ohio. DDR is a
fully integrated real estate firm, actively developing, acquiring, operating, managing and investing in income-
producing retail shopping centers nationwide.
• DDR currently owns and manages over 460 retail properties in 44 states totaling over 102 million square feet of
real estate under management.
• DDR’s business plan is to
– Focus on the ownership and management of high-quality market-dominant community shopping centers
– Cultivate premier relationships with the nation’s leading retailers
– Proactively replace underperforming tenants at significantly higher rents
– Maximize revenue generation from existing centers
• Expansion and redevelopment
• Ancillary income sources
– Recycle capital at positive spreads
• Opportunistic acquisitions
• Development of infill sites in major markets
– Engineer innovative JV structures with institutional capital partners
• Additional equity source
• Maximize returns on invested equity
39The Management
Developers Diversified Realty, Inc
Scott A. Wolstein
Chief Executive Officer and Chairman of the Board
Mr. Wolstein has been the Chief Executive Officer and a Director of Developers Diversified Realty since its organization in 1993. Mr.
Wolstein has been Chairman of the Board of Directors of the Company since May 1997. Prior to the organization of the Company, Mr.
Wolstein was a principal and executive officer of Developers Diversified Group ("DDG"), the Company's predecessor. He is currently a
member of the Board of NAREIT, the International Council of Shopping Centers, The Real Estate Roundtable, the Zell-Lurie Wharton
Real Estate Center, and Cleveland. Mr. Wolstein is also a member of the Urban Land Institute and PREA. He has also served as
president of the Board of Trustees of the United Cerebral Palsy Association of Greater Cleveland and is a member of the Board of the
Great Lakes Theater Festival, The Park Synagogue, and the Convention and Visitors Bureau of Greater Cleveland.
Graduate of the Wharton School at the University of Pennsylvania and the University of Michigan Law School.
Joan U. Allgood
Senior Vice President and General Counsel
Joan Allgood has been Vice President and General Counsel of Developers Diversified Realty (DDR) since its organization as a public
company and General Counsel of its predecessor entities since 1987. Mrs. Allgood practiced law with Thompson, Hine and Flory from
1983 to 1987.
Graduate of Denison University and Case Western Reserve University School of Law.
William H. Schafer
Senior Vice President and Chief Financial Officer
Mr. Schafer has been Senior Vice President and Chief Financial Officer of Developers Diversified Realty (DDR) since May 1999 and
Vice President and Chief Financial Officer of DDR since the Company's IPO in 1993. Mr. Schafer joined the Company's predecessor
entities as Chief Financial Officer in April 1992. Prior to his joining DDR, Mr. Schafer held various positions with the Cleveland, Ohio
office of Price Waterhouse LLP beginning in 1983, serving as a Senior Manager from July 1990 until he joined DDR.
Graduate from the University of Michigan in Ann Arbor with bachelor of arts degree in business administration.
40The Management
Developers Diversified Realty, Inc
Richard E. Brown
Senior Vice President of Real Estate Operations
Mr. Brown, a twenty-year shopping center industry veteran, joined Developers Diversified Realty (DDR) in January 2000. Prior
to joining DDR Mr. Brown served as Vice President of Asset Management for Philadelphia, Pennsylvania-based PREIT-RUBIN
and had direct responsibility for a portfolio of 8.1 million square feet of retail space including regional malls, power centers and
neighborhood strip centers. Prior to his tenure with PREIT-RUBIN, Mr. Brown served as Vice President of Retail Asset
Management for The Balcor Company, a Chicago-based owner of a national portfolio of commercial and residential properties.
Graduate of Carleton University in Ottawa, Canada and a chartered accountant (Canada), and member of ICSC.
Joseph G. Padanilam
Vice President of Transactions
Mr. Padanilam, formerly Vice President of Investment and Planning at DDR, was promoted to Vice President of Transactions in
2001. Mr. Padanilam is actively involved in the analysis, negotiation and structuring of current and new transactions. Mr.
Padanilam joined DDR from Price-Waterhouse, Coopers where he was Senior Tax Manager. Mr. Padanilam is a member of the
National Association of Real Estate Investment Trusts (NAREIT), Tax Executives Institute, American Institute of Certified Public
Accountants (AICPA), Ohio Society of Certified Public Accountants (OSCPA), and the Notre Dame Monogram Club.
1988 bachelor of business administration, University of Notre Dame,1988 and Master's of business administration, at
Washington University in St. Louis,1990
41The Properties
The Properties
42Portfolio Overview
Properties of the Fund
Acquisition
Total GLA Number of Occupancy Total Value Price ($ per
Center Name City State Year Opened (Sq Ft) Tenants Cap Rate ($'000) SF) Key Anchors
Midway Plaza Loganville GA 1995 91,196 16 9.11% 99% $10,281 $113 Kroger
Oxford Place Oxford MS 2001 71,866 7 6.85% 97% $3,558 $50 Kroger
Northcreek Commons Goodlettsville TN 1987 84,441 12 8.15% 95% $7,279 $86 Kroger
Chillicothe Place Chillicothe OH 1974 105,512 6 10.75% 100% $8,330 $79 Kroger
Tops Robinson Amhers NY 1986 145,192 17 6.75% 100% $16,379 $113 Tops
Tops Jamestown Jamestown NY 1997 98,001 4 7.60% 90% $15,128 $154 Tops
Tops Leroy Leroy NY 1997 62,747 7 7.74% 100% $7,000 $112 Tops
Tops Ontario Ontario NY 1998 77,040 11 7.30% 100% $9,394 $122 Tops
Tops Warsaw Warsaw NY 1995 74,105 8 7.50% 94% $8,611 $116 Tops
Culver Ridge Irondequoit NY 1981 226,382 29 8.10% 96% $28,330 $125 Regal Cinemas
Crossroads Centre Orchard Park NY 2001 167,805 15 7.35% 88% $24,555 $146 Tops
Panorama Plaza Rochester NY 1959 278,241 40 7.20% 96% $45,711 $164 Tops
Tops Union Road Cheektowoga NY 1983 151,357 9 8.35% 78% $19,216 $127 Tops
Total / Weighted Average 1984 1,633,885 181 7.75% 94% $203,773 $125
43The Properties
Midway Plaza
Loganville, Georgia
Major Tenants GLA Store Type
Kroger 63,296 National Grocer
Major Tenants' GLA 63,296
Total GLA 91,196
% of Total Owned GLA 69%
44The Properties
Oxford Place
Oxford, Mississippi
Major Tenants GLA Store Type
Kroger 58,666 National Grocer
Major Tenants' GLA 58,666
Total GLA 71,866
% of Total Owned GLA 82%
45The Properties
Northcreek Commons
Goodlettsville, Tennessee
Major Tenants GLA Store Type
Kroger 59,134 National Grocer
Major Tenants' GLA 59,134
Total GLA 84,441
% of Total Owned GLA 70%
46The Properties
Chillicothe Place
Chillicothe, Ohio
Major Tenants GLA Store Type
Kroger 60,425 National Grocer
CVS Pharmacy 23,404 Drugstore
Book World 10,069 Bookstore
Petland 5,500 Petstore
Major Tenants' GLA 99,398
Total GLA 105,512
% of Total Owned GLA 94%
47The Properties
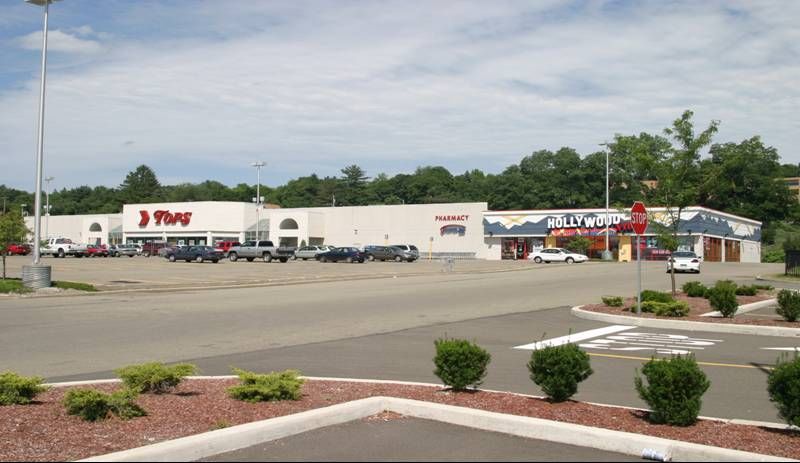
Tops Robinson
Amherst, New York
Major Tenants GLA Store Type
Tops Market 82,897 Regional Grocer
Shanor Lighting Center 19,232 Home Imporvement
Blockbuster 6,500 Video Store
Buffalo Wild Wings 6,288 Restaurant
Major Tenants' GLA 114,917
Total GLA 145,192
% of Total Owned GLA 79%
48The Properties
Tops Jamestown
Jamestown, New York
Major Tenants GLA Store Type
Tops Market 77,000 Regional Grocer
Hollywood Video 8,000 Video Store
Major Tenants' GLA 85,000
Total GLA 98,001
% of Total Owned GLA 87%
49The Properties
Tops Leroy
Leroy, New York
Major Tenants GLA Store Type
Tops Market 47,000 Regional Grocer
Major Tenants' GLA 47,000
Total GLA 62,747
% of Total Owned GLA 75%
50The Properties
Tops Ontario
Ontario, New York
Major Tenants GLA Store Type
Tops Market 47,000 Regional Grocer
Secor Lumber 8,000 Lumber Store
New York Sports 5,000 Sports Shop
Major Tenants' GLA 60,000
Total GLA 77,040
% of Total Owned GLA 78%
51The Properties
Tops Warsaw
Warsaw, New York
Major Tenants GLA Store Type
Tops Market 45,533 Regional Grocer
Hollywood Video 7,488 Video Store
Major Tenants' GLA 53,021
Total GLA 74,105
% of Total Owned GLA 72%
52The Properties
Culver Ridge
Irondequoit, New York
Major Tenants GLA Store Type
Regal Cinema 58,012 Movie Theatre
AJ Wright 26,959 Brand Merchandise
Petco Animal Supplies 15,277 Petstore
Factory Card Outlet 12,237 Greeting Card Store
Old Country Buffet 11,100 Restaurant
Major Tenants' GLA 123,585
Total GLA 226,382
% of Total Owned GLA 55%
53The Properties
Crossroads Centre
Orchard Park, New York
Major Tenants GLA Store Type
Tops Market 57,000 Regional Grocer
Stein Mart 36,000 General Merchandise
Blockbuster 6,310 Video Store
Tim Horton's 5,438 Restaurant
Total Tan 5,100 Beauty Shop
Major Tenants' GLA 109,848
Total GLA 167,805
% of Total Owned GLA 65%
54The Properties
Panorama Centre
Rochester, New York
Major Tenants GLA Store Type
Tops Market 74,000 Regional Grocer
Linens 'N Things 23,114 Home Improvement
Eckerd Drugs 17,100 Drugstore
Factory Card Outlet 13,202 Greeting card store
Fashion Bug 13,000 Fashion Apparel
Major Tenants' GLA 140,416
Total GLA 278,241
% of Total Owned GLA 50%
55The Properties
Tops Union
Cheektowoga, New York
Major Tenants GLA Store Type
Tops Market 78,000 Regional Grocer
Dollar Tree 14,098 Discount Store
Advanced Auto Parts 10,949 Auto Parts
Blockbuster 5,000 Video Store
Major Tenants' GLA 108,047
Total GLA 151,357
% of Total Owned GLA 71%
56You can also read