ODISHA - SUN TEMPLE AT KONARK, ODISHA For updated information, please visit www.ibef.org
←
→
Page content transcription
If your browser does not render page correctly, please read the page content below

ODISHA

         SUN TEMPLE AT KONARK, ODISHA
                                             June 2021
         For updated information, please visit www.ibef.org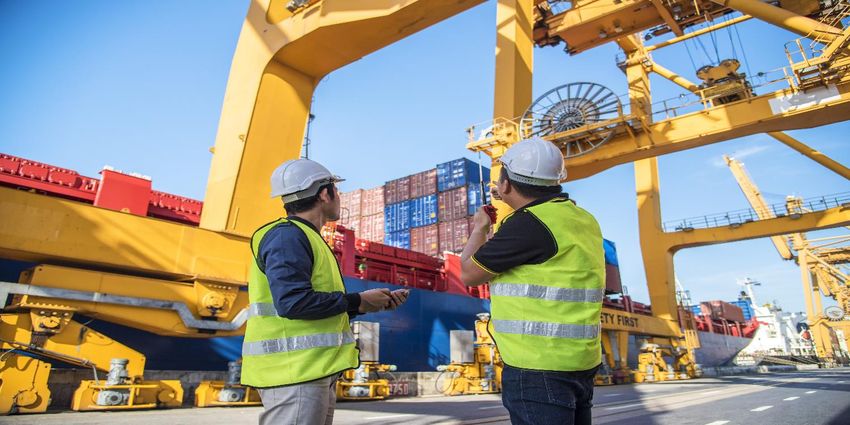
Table of Contents

        Executive Summary           3

        Introduction                4

        Economic Snapshot           9

        Physical Infrastructure     15

        Social Infrastructure       23

        Industrial Infrastructure   26

        Key Sectors                 29

        Key Procedures & Policies   37

        Appendix                    48

 2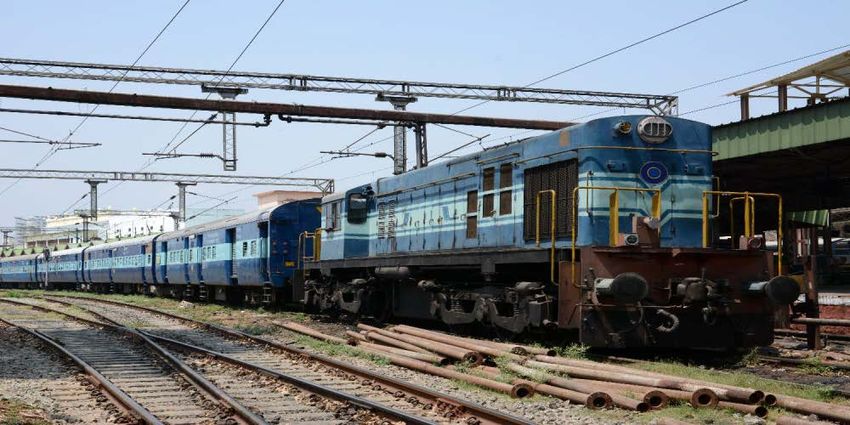
Executive summary

                   Strong economy
       1               •   Cumulative FDI inflow in the state amounted to US$ 32.80 million between October 2019 and March 2021.

                      Strong mineral production

       2               •   Odisha has emerged as the key state with regard to the mineral and metal-based industries. In 2019-20^, Odisha
                           contributed to the largest share (35.3%) of mineral production (by value*) in India. Value* of minerals produced in
                           the state reached Rs. 70.54 billion (US$ 951 million) in 2020-21^.

                      Strong growth in MSME units
       3               •   The state is home to a large number of MSME units. The state is amongst the top ten states accounting for the
                           highest number of MSME enterprises.

                     Strong power sector
       4               •   Odisha is the first state in India to have undertaken reform and restructuring initiatives in the power sector. As of
                           April 2021, Odisha accounted for a total installed power generation capacity of 8,594.47 megawatts (MW).

 Note: *- Excluding fuel minerals, atomic minerals and minor minerals, ^- Until September 2020, MSME- micro small medium enterprises, GSDP- Gross State Domestic Product
 Source: Economic Survey of Odisha, News Article

 3
INTRODUCTION

4
Fact file
Bhubaneswar
Capital 43.95 million
270 persons per sq km total population
Population density
75.5% 155.707 sq.km. 25.5 million 27.1 million
literacy rate geographical area female population male population
Administrative districts: 30 979
Sex ratio
(females per 1,000 males)
67.8% 83.2%
Male literacy Female literacy
Key Insights rate rate
Odisha is located in the eastern region of India. The state shares its borders with West Bengal in the north-east, Jharkhand in the north, Andhra
Pradesh in the south, Chhattisgarh in the west and the Bay of Bengal in the east.
Languages spoken in the state are Odia and its various dialects, Hindi and English.
Bhubaneswar, Mayurbhanj, Baleshwar, Khordha and Sundargarh, Ganjam, Cuttack are some of the large cities in terms of population
Odisha has 3 major seasons, summer (March to June), monsoon (July-September) and winter (October-February).
Source: Census 2011, Economic Survey of Odisha
5
Advantage

         High economic growth                                   Policy, fiscal incentives
                                                                and initiatives
         •   The state’s GSDP increased at a CAGR of            •   The state offers a wide range of fiscal and policy incentives
             6.72% between 2016-17 and 2020-21.                     for businesses under the Industrial Policy Resolution,
         •   The tertiary sector was the key contributor            2007.
             (42.47%) to the state’s GSDP in 2020-21.           •   Additionally, the state has sector-specific policies for IT
                                                                    and micro, small and medium enterprises.
                                                                •   The state Government has constituted ‘Team Odisha’ to
                                                                    help with investment promotion.

                                                                                                  Facilitating infrastructure
                                                                                                  •   In Union Budget 2021, Odisha allocated
                                                                                                      6.4% of its total expenditure on health,
                                                                                                      (higher than the average allocation for
      Rich labour pool                                                                                health by other states (5.5%)), 7.5% on
                                                                                                      rural development (higher than the
  •   The state has a literacy                                                                        average allocation for rural development
      rate of 72.87%, in line with                                                                    by other states (6.1%)) and 7.8% on
      the national average.                                                                           roads and bridges (higher than the
  •   Furthermore, the state has                                                                      average allocation by states (4.3%)).
      a large pool of semi-skilled                                                                •   In Maritime India Summit 2021, the
      and unskilled labour.                                                                           government announced to establish
  .                                                                                                   Odisha as the hub of maritime trade.

 Note: BE- Budget Estimate
 Source: Economic Survey of Odisha, Central Statistics Office

 6
Vision 2022
8. INDUSTRIAL
1. HEALTH DEVELOPMENT
To improve rural healthcare system, To develop industrial parks with
to provide quality emergency quality infrastructure, to encourage
healthcare facilities, to patronise micro-enterprises as ancillaries and
health insurance, to imbibe health to pave the way for cost & technology
1 8
and hygiene content in education orientation by encouraging
system, etc. competition.
7. INFRASTRUCTURE
2. GOVT. SERVICES AND To improve connectivity by increasing
ADMINISTRATION
2 7
road and rail density and to improve
To enhance the use of Information passenger services.
Technology (IT) To provide universal access to
to ensure transparency and speed. power, irrigation and to improve
To minimize interface between public urban infrastructure as well.
and Government for dealings.
6. GROWTH AND WELL-
3. TOURISM & CULTURE 3 6 BEING
To frame concerted strategies to
To protect historical monuments address various issues of
through proper renovation. unemployment and rural well being.
To nurture and promote classical To bring about growth with equity.
music, dance and literature.
4 5
5. EDUCATION & SKILL
4. AGRICULTURE DEVELOPMENT
To improve the productivity of the sector, to To foster technical and vocational education
encourage modern agricultural practices, to and skill development programmes.
bring insurance schemes for farmers against To establish educational townships.
natural disasters, etc.
Source: Confederation of Indian Industry
7
Odisha in figures

     Odisha’s Contribution to Indian Economy (2019-20)                                        Physical Infrastructure in Odisha’

          GSDP as a percentage of all states’ GSDP
                                                                                                      Installed power capacity (MW) (as of April 2021)
 GSDP
          India: 100.00 | Odisha: 2.5
                                                                                                      India: 382,730.02 | Odisha: 8,594.47
          GSDP growth rate** (%)
          India: 9.80 | Odisha: 12.77
                                                                                                      Wireless subscribers (million) (as of February 2021)
          Per capita GSDP* (US$)                                                                       India: 1,167.70 | Odisha: 34.01
          India: 1,956| Odisha : 1,721.97
                                                                                                      Internet subscribers (million) (as of December 2020)
     Odisha’ Contribution to Indian Economy (2018-19)                                                  India: 795.18 | Odisha: 20.65

           Literacy rate (%)                                                                          National highway length (kms) (as of March 2021)
           India: 73.0 | Odisha : 72.87                                                               India: 136,440 | Odisha: 5,897.08

          Birth rate (per 1,000 population) (2018)
          India: 20 | Odisha : 18.2                                                                    India: 13+187| Odisha: 1+13
                                                                                                      Airport (No.)
     Industrial Infrastructure                                                                         India: 125 | Odisha : 2
          Operational PPP projects (No.)( November
          2019 )                                                                                Investments
           India: 1,824 | Odisha : 44
           Operational SEZs (No.)                                                                    Cumulative FDI equity inflow (from October
           (October 2020)                                                                            2019 to March 2021) (US$ million)
           India: 262 | Odisha : 5                                                                     India: 83,516.88 | Odisha: 32.80

 Note: GSDP, per capita GSDP figures are taken at current prices, MW- megawatt, FDI- Foreign Direct Investment, PPP: Public-Private Partnership, SEZ: Special Economic
 Zone, SRS: Sample Registration System For source refer to Annexure

 8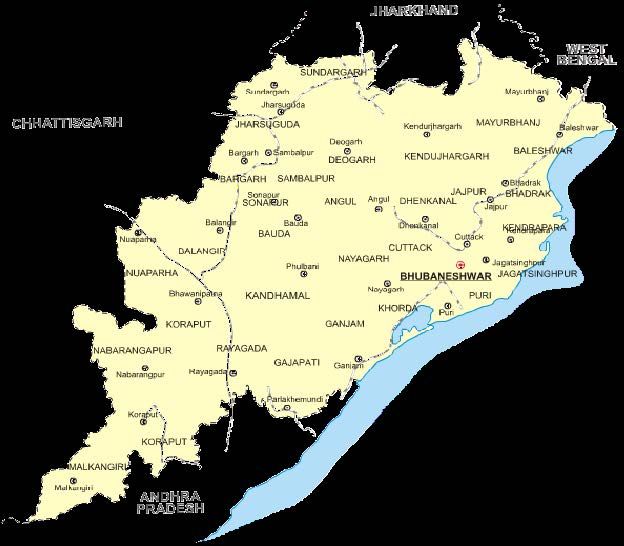
ECONOMIC SNAPSHOT

9
Economic Snapshot – GSDP
GSDP at current prices GSDP per capita at current prices
CAGR 6.72% CAGR 6.28%
80.00 6 1,800 140000
1,600
1,689.25
70.00
73.95
5 120000
1,600.98
1,596.96
70.20
69.80
1,575.64
5.21
68.41
5.10
119,075.01
1,400
115,922.99
4.88
60.00
111,892.26
100000
1,354.23
4.41
58.55
4
101,549.96
1,200
50.00
3.93
90,855.27
1,000 80000
40.00 3
800 60000
30.00
2 600
20.00 40000
400
1
10.00 20000
200
0.00 0 0 0
2016-17
2017-18
2018-19
2019-20
2020-21
2016-17
2017-18
2018-19
2019-20
2020-21
US$ billion Rs. trillion US$ Rs.
At current prices, the gross state domestic product (GSDP) of Odisha The state’s per capita GSDP was Rs. 121,381.91 (US$ 1,721.97) in
stood at ~Rs. 5.10 trillion (US$ 70.20 billion) in 2020-21. 2018-19.
Odisha’s GSDP increased at a CAGR of ~6.72% between 2016-17 Per capita GSDP increased at a CAGR of 6.28% between 2016-17
and 2020-21. and 2020-21.
Source: Ministry of Statistics and Programme Implementation
10Economic Snapshot – NSDP
NSDP at current prices NSDP per capita at current prices
CAGR 7.02% CAGR 6.58%
70.0 5 1,600 120000
4.5 1,400
64.94
1,483.41
60.0
4.58
4.49
100000
61.86
1,407.30
1,404.80
61.24
104,565.54
1,386.66
60.20
4
4.28
102,155.70
98,181.24
1,200
3.88
50.0 3.5
89,370.21
1,180.22
51.03
80000
3.42
1,000
79,181.13
3
40.0
2.5 800 60000
30.0
2 600
40000
20.0 1.5
400
1
10.0 20000
0.5 200
0.0 0 0 0
2016-17
2017-18
2018-19
2019-20
2020-21
2016-17
2017-18
2018-19
2019-20
2020-21
US$ Rs. trillion US$ Rs.
Odisha’s total NSDP was ~Rs. 4.49 trillion (US$ 61.86 billion) in Odisha’s per capita NSDP was Rs. 102,155.70 (US$ 1,407.30) in
2020-21. 2020-21.
The state’s NSDP (in Rs.) increased at a CAGR of 7.02% between Per capita NSDP of Odisha increased at CAGR of 6.58% between
2016-17 and 2020-21. 2016-17 and 2020-21.
Source: Ministry of Statistics and Programme Implementation
11Economic snapshot – Percentage distribution of GSVA
Gross State Value Added by Economic Activity at Current
In 2020-21, the tertiary sector contributed 42.47% to the state’s
Basic Prices
gross state value added (GSVA) at current prices, followed by
primary (30.25%) and secondary (27.28%) sectors.
100%
38.54% CAGR* 42.47%
At a CAGR* of 9.32%, the tertiary sector was the fastest-growing 90%
among the three sectors between 2011-12 and 2020-21. This was
80%
driven by communication and services related to broadcasting,
70%
financial services, water transport, public administration and other 9.32%
services. 60%
31.57%
27.28%
50%
The primary sector increased at a CAGR* of 8.30% between
2011-12 and 2020-21. 40%
6.41%
30%
The secondary sector increased at a CAGR* of 6.41% between 30.25%
29.89%
2011-12 and 2020-21. 20%
10%
8.30%
0%
2011-12 2020-21
Primary Secondary Tertiary
Note:-* in Rs. terms
Source: Directorate of Economics & Statistics of Odisha, Central Statistics Office, Sector-wise % share of GSDP
12Economic snapshot – FDI inflow & investments
FDI inflows in Odisha in April 2000-September 2020
According to the DPIIT, cumulative FDI inflow in the state stood at Visakhapatnam port traffic (million tonnes)
(US$ million)
US$ 32.80 million between October 2019 and March 2021.
700
Odisha is aiming to facilitate growth in the manufacturing sector with
11 616
a yearly increase of 15% until 2020. As per the State Government 56
600
investment plans, the contribution of manufacturing sector in the 69
overall GSDP of the state is projected to reach 27% by 2020. 65
500
In April 2021, South Korean steel giant POSCO announced plans to 12
10 5
invest US$ 12 billion to set up an integrated steel plant in Odisha. 400 47
52
In February 2021, the Odisha government approved eight new 300 28
246
industrial projects, worth Rs. 1,242 crore (US$ 170.87 million), which
are expected to create 3,135 employment opportunities. 200
In February 2021, the Odisha government approved three key
100
investment proposals, which totaled Rs. 5,358.24 crore (US$ 737.18
FY12
FY13
FY14
FY15
FY16
FY17
FY18
FY19
FY20
FY01-FY21*
FY01-FY11
FY21*
million).The three industrial projects, in sectors such as metal and
metal downstream, cement and refinery and petrochemical, are
expected to generate 3,667 jobs in the state.
Note: *- Until September 2020
Source: Department for Promotion of Industry and Internal Trade, Economic Survey of Odisha, News articles
13Economic snapshot – Export trends
Merchandise Export from Odisha (US$ billion) Major Commodities Exported in FY21
12.00
Iron Ore
10.00 Iron & Steel
10.22 20.69%
33.93%
8.00 Aluminum and Products of
7.59 Aluminium
6.00 6.66 Petroleum Products
6.07 6.30
4.00 19.45% Marine Products
2.31%
3.35 3.36%
2.00 2.91 Processed Minerals
6.01%
14.24%
0.00 Others
FY15 FY16 FY17 FY18 FY19 FY20 FY21*
Total merchandise exports from Odisha stood at ~US$ 6.66 billion in FY20 and US$ 10.22 billion in FY21.
Iron ore, iron & steel and aluminium & aluminium products accounted for a majority share in the overall exports from the state.
In 2020-21, total exports of iron ore from Odisha stood at US$ 2,116.07 million (~20.7%).
Source: DGCIS Analytics
14PHYSICAL INFRASTRUCTURE 15
Physical infrastructure – Roads
Odisha is well connected to its neighbouring states & other parts of
India through 41 national highways. The state had a road density of
164 km per 100 square km of area.
Odisha has around 254,845.32 km of roads, including 5,762 km of
national highways & 4,100.63 km of state highways.
In Union Budget 2021, Odisha allocated 7.8% of its total expenditure
on roads and bridges. This was higher than the average allocation by
other states (4.3%).
The Odisha government allocated funds worth Rs. 2,296 crore (US$
315.88 million) to the road development programme and Rs. 2,000
crore (US$ 275.16 million) for construction of roads under the
PMGSY (Pradhan Mantri Gram Sadak Yojana) scheme.
Note: ** - 2015-16
Source: * as per Economic Survey of Odisha. National Highways Authority of India, Odisha Budget - 2021-22
16Physical infrastructure – Railways
Odisha serves as a link between eastern & western India through the
railway network of the South Eastern Railways & the East Coast
Railways.
Odisha falls in the East Coast Railways region. Its major divisions
are Khurda Road, Sambalpur & Waltair, with district headquarters in
Bhubaneswar.
As per the Union Budget 2021-22, Rs. 6,995.58 crore (US$ 962.44
million) has been allocated for development of railway infrastructure
in the state.
In May 2019, the Government is planning to set up integrated coach
factory to manufacture aluminium body train sets in Odisha
In November 2020, the Indian Railways' East Coast Railway (ECoR)
zone signed an MoU with the Telecommunications Consultants India
Limited (TCIL) for construction of six Road Over Bridges (ROBs) in
Odisha for Rs. 436.87 crore.
Source: Maps of India
Source: Odisha Budget 2021-22
17Physical infrastructure – Airports
Biju Patnaik Airport, is located in the state capital, Bhubaneswar. In November 2013, the airport was declared an international airport by the
Ministry of Civil Aviation.
Direct links are available from Bhubaneswar to destinations such as New Delhi, Kolkata, Chennai, Nagpur, Mumbai and Hyderabad. In addition,
there are 17 airstrips and 16 helipads at several places in the state.
In 2019, Jharsuguda airport has been made fully operational with around five flights operating and Rourkela airport with 5,900 ft runway has
been made ready for operation of the 19 sitter flights.
Under Ude Desh ka Aam Naagrik (UDAN) scheme, four airstrips are proposed by the Government. These are at Rourkela, Jharsuguda, Utkela
and Jeypore.
Airport indicators
Bhubaneswar Airport Statistics
Aircraft movements Passengers Freight
(in no) (in no.) (in MT)
Airport
2019-20 2020-21 2019-20 2020-21 2019-20 2020-21
Bhubaneswar 27,931 14,265 3,672,246 1,571,933 10,011 7,398
Source: AAI
18Physical infrastructure – Ports
Paradip port is one of the major ports in Odisha. It is connected
Commodity-wise traffic handled at Paradip port (‘000 tonnes)
with the broad-gauge rail link of the East-Coast Railway & is
also served by National Highway-5A.
Total traffic handled by Paradip port reached 112.69 million Commodity 2018-19 2019-20 2020-21* 2021-22*
tonnes in 2019-20 and 82.44 million tonnes in 2020-21 (until
December 2020) Petroleum, oil &
38,117 37,330 23,396 6,045
lubricants
During April 2018, Union Minister drafted a blueprint for port-led Others 1,517 1,637 1,253 255
development in Paradip under Sagarmala project. This includes
Iron 12,206 22,954 21,219 5,004
40 projects which is estimated to cost around Rs. 91,000 crore
Fin 199 484 431 -
(US$ 14.12 billion).
Fertilizers
Raw 4,380 4,075 3,644 523
In November 2019, JSW Infrastructure commissioned a new
Thermal &
iron ore terminal in Paradip port. The terminal can load these 32,478 27,004 16,993 4,697
Steam
Coal
vessels at a rate of 100,000 tonnes a day. Coking &
12,714 12,157 8,987 2,611
Others
In December 2020, the Ministry of Port, Shipping, and Tonnage 194 222 194 37
Waterways agreed to the Odisha government’s proposal for the Containers
TEUs
13 12 11 2
riverine port to be developed by the Paradip Port Trust at an
investment of Rs. 4,000 crore (US$ 547.46 billion). The project Other Misc. Cargo 7,343 6,826 6,324 1,335
is estimated to generate employment for 6,000 people.
Total 109,275 112,689 82,441 20,507
Note: *- until December 2020 (FY21), * - until May 2021 (FY22)
Source: India Ports Association
19Physical infrastructure – Power
Odisha is the first state in the country to bring in power sector reforms. Installed Power Capacity (MW)
As of April 2021, Odisha had a total installed power-generation capacity
8,800
of 8,594.47 MW, of which 1,966.98 MW was under the central sector,
8,600
3,828.22 MW (under state utilities) and 2,799.27 MW (private sector). Of
8,594.47
8,594.47
8,591.69
8,538.27
the total installed power-generation capacity, 5,893.98 MW was 8,400
contributed by thermal, 2,150.92 MW by hydro and 549.57 MW by
8,200
renewable energy.
8,000
An outlay of Rs. 533 crore (US$ 76.26 million) has been allocated to
7,800
establish new 33 x 11 sub-stations under Odisha Distribution System
7,600
7,653.58
Strengthening Programme (ODSSP).
7,400
By 2022, Odisha plans to reach generation of 2,200 MW of solar power,
7,338.42
7,200
200 MW of wind power,180 MW of bio-mass power, 150 MW of small
hydro power and 20 MW of Waste-to-Energy (WTE) power. 7,000
6,800
In June 2021, Tata Power company's proposed purchase of a 51% stake
in each of the three power utilities in Odisha was cleared by the 6,600
FY17
FY18
FY19
FY20
FY21
FY22*
Competition Commission of India. The company is to buy the stakes in
Western Electricity Supply Company of Odisha (WESCO), Southern
Electricity Supply Company of Odisha Ltd. (SOUTHCO) and Central
Electricity Supply Company of Odisha Ltd. (CESCO).
Note: MW- Megawatt, *- Until April 2021
Source: Central Electricity Authority
20Physical infrastructure – Telecom
Telecom Infrastructure (as of February 2021)
Wireless subscribers (million) 34.01
Wireline subscribers 209,030 Performance status of Bharat Net Project
Internet subscribers (million) (as of Service-ready GPs (November 2020) 4,854
20.65
December 2020)
Tele-density (%) 77.71
As of February 2021, Odisha had 34.01 million wireless and 0.20
Major telecom operators in Odisha
wireline subscribers.
Bharat Sanchar Nigam Limited (BSNL)
The number of internet subscribers in the state stood at 20.65
Bharti Airtel
million, as of December 2020.
Vodafone Idea
Odisha had a total tele-density of 77.71%, as of February 2021.
Reliance Jio
Source: Telecom Regulatory Authority of India, Department of Telecommunications
21Physical infrastructure – Urban
Classification of AMRUT Cities in Odisha on the basis of
Bhubaneswar, Odisha’s capital, has secured a spot in the list of
population
world’s top 20 smart cities in 2017. The ranking has placed the city at
the 13th position in terms of safety and 20th in three other
Number of AMRUT cities with population
parameters viz. mobility, healthcare and productivity. 9
less than 1 million
Government of India has approved 5,133 affordable houses in 26 Number of AMRUT cities with population
0
in the range of 1 - 10 million
cities of Odisha with an investment of Rs. 156 crore (US$ 24.10
Number of AMRUT cities with population
million) of which central Government would contribute 77 crore (US$ 0
greater than 10 million
11.89 million).
Total number of AMRUT cities 9
The government plans to cover an additional 7 million rural
population and 100% urban population under piped water supply by
FY22.
Source: JNNURM, Ministry of Urban Development, Government of India, News articles , UIDSSMT: Urban Infrastructure Development Scheme for Small and Medium Towns
22SOCIAL INFRASTRUCTURE 23
Social infrastructure – Education
Educational infrastructure (2018-19)
Odisha primary education statistics (2017-18)
Undergraduate
Primary: 36,070
Medical Colleges (Pvt+ Govt.) 8 Number of
Upper primary: 22,019
schools
Dental colleges (Pvt+ Govt.) 4 High schools: 9,873
Engineering colleges (Pvt+ Govt.) 123 Primary: 5.81
School-dropout
Upper primary: 5.45
MCA colleges (Pvt+ Govt.) 41 rate (%)
High Schools: 5.21
MBA colleges (Pvt+ Govt.) 62
Pupil-teacher Primary: 23:1
Polytechnics/engineering schools 117 ratio Upper primary: 24:1
The major universities in the state are Utkal University and Biju Patnaik University of Technology; popular colleges are Orissa Engineering College and
Sriram Chandra Bhanj Medical College.
The state is also home to premier institutions such as National Institute of Technology (NIT) Rourkela, Xavier Institute of Management and National
Institute of Science Education and Research.
In June 2021, the Odisha government launched the 'state-model' of IBM (International Business Machines Corporation) and Science, Technology,
Engineering and Mathematics (STEM) education for girl students in 258 schools across the state. The state-model of IBM-STEM seeks to ensure the
capacity building of girls in digital literacy, career choice and life skills.
In March 2021, the World Skill Centre (WSC) was inaugurated in Bhubaneswar, Odisha. The WSC was established as a premier institute to teach
advanced skills and create globally employable youth in the state. The centre will be developed at an investment of Rs. 1,342.2 crore (US$ 184.66
million) (on a cost sharing basis with the Asian Development Bank under the Odisha Skill Development Project).
Source: Economic Survey of Odisha, University Grants Commission, MCA: Master of Computer Applications, MBA: Master of Business Administration, SEBC: Socially and Educationally
Backward Class, News Article
24Social infrastructure – Health
Health indicators (2018) Health infrastructure (May 2020)
Population served per hospital bed
1,386 Primary health centres 1,396
(as of 2014-15)
Birth rate
1
18.2 Sub centres 6,691
1
Death rate 7.3 Community health centres 433
2
Infant mortality rate 40 District hospitals 35
Life expectancy at birth (year) Sub district hospitals 40
Male (2011-15) 64.3 Total 8,595
Female (2011-15) 67.3
In Budget Estimate for FY22, the Indian government allocated funds worth Rs. 9,340 crore (US$ 1.28 billion) to the Health and Family Welfare in
Odisha.
For Odisha, the government announced funds worth Rs. 1,353 crore (US$ 186.14 million) for the Biju Swasthya Kalyan Yojana, Rs. 1,755 crore
(US$ 241.45 million) for the National Health Mission and Rs. 1,572 crore (US$ 216.27 million) for healthcare infrastructure and services under the
Mukhya Mantri Swasthya Seva Mission.
Note: 1Per thousand persons, 2Per thousand live births, PPP - Public Private Partnership
Source: Central Bureau of Health Intelligence, Government of India, Ministry of Health and Family welfare, Economic Survey of Odisha, SRS Bulletin
25INDUSTRIAL INFRASTRUCTURE 26
Industrial infrastructure … (1/2)
As a part of the state government-enacted Orissa Industries (Facilitation) Act, Key Industrial zones
2004, a single-window clearance system was implemented in the state. This was Talcher-Angul Gopalpur-Chatrapur
done with the aim of facilitating the growth of industries and creating an attractive
Kalinganagar-Duburi Paradip-Jagatsinghpur
environment for both domestic and international investments.
Bhubaneswar-Khurda Jharsuguda-
Investment intentions filed in the state is Rs. 29,826 crore (US$ 4.27 billion) in Brajarajnagar
Rayagada-Sunabeda
2019.
Investment intentions in terms of IEMs filed,
In March 2021, ArcelorMittal-Nippon Steel India and the Odisha government
LOIs / DILs issued
signed a MoU to establish a 12 MT integrated steel plant in the state, with an
investment worth Rs. 50,000 crore (US$ 6.88 billion). Proposed Investments (US$
Year Number
billion)
In December 2020, 28 projects worth ~Rs. 588 crore (US$ 80.47 billion), with
2013 40 16.37
employment potential of 3,245, have been fast-tracked—showcasing swift land
2014 27 4.68
allotment process by the Industrial Development Corporation Odisha (IDCO) as a
step towards achieving ‘ease of doing business’ in the state. 2015 23 4.02
2016 36 3.49
2017 31 1.08
2018 45 2.33
2019 76 4.27
2020 46 5.08
Note: *IEM: Industrial Entrepreneur Memoranda, LOI: Letters of Intent; DIL: Direct Industrial Licenses
Source: Economic Survey of Odisha, DCO - Odisha Industrial Infrastructure Development Corporation, MoU - Memorandum of Understanding
27Industrial infrastructure…(2/2): SEZs and industrial estates
The state has two operational IT SEZs with one in Bhubaneswar and the other in Jatni Tehsil, as of October 2020. Odisha also has an operational
SEZ for production and export of aluminium, one for mineral-based industries and one for multi-products.
As of October 2020, the state had 17 SEZs, of which five are operational, five are notified and seven are formally approved.
IDCO is the main developer for 40% of the formally approved SEZs. The state has 86 industrial estates.
Formally approved SEZs (as of October 2020) Operational SEZs in Odisha (as of October 2020)
Industry Location SEZs (No) Industry Location SEZs (No)
IT/IT(Knowledge Orissa Industrial
Khurda 3 Infrastructure
Park)ITeS Bhubaneswar IT/ITES
Development Corporation
Multiproduct Ganjam 1 (IDCO)
Vedanta Aluminium Brundamal and Manufacture and
Metal based SEZ Jajpur 1 Limited Kurebaga villages export of aluminium
Mineral based industries Ganjam 1 Saraf Agencies Private Chhatrapur, Mineral-based
Limited Gunjam district industries
Manufacture & export
Jharsuguda 1 Village
of aluminium Orissa Industrial
Gaudakashipur
Infrastructure IT (Knowledge
and Arisal, Tehsil
Development Corporation Park)
Jatni, District
(IDCO)
Khurda, Odisha
Tata Steel Special
Economic Zone Limited Gopalpur, District-
Multi Product
(formerly Gopalpur Special Ganjam, Odisha
Economic Zone Limited)
Source: Ministry of Commerce & Industry, Government of India, IDCO - Odisha Industrial Infrastructure Development Corporation
28KEY SECTORS 29
Key sector – Metals & mining…(1/2)
Odisha is one of India’s richest states in terms of mineral reserves. The Value of Mineral production in Odisha (US$ million)
mineral belt is spread over an area of more than 6000 sq km. Moreover, 1,000
the state accounts for more than 35% of total iron ore resources of the 951
country. The key minerals found in the state are iron, coal, bauxite, 833
manganese, nickel, chromite, limestone, dolomite, graphite, decorative
500
stones, beach sand, china clay, tin ore, etc.
In February 2021, under production-linked incentive (PLI) scheme, the
government approved an outlay of funds worth Rs. 6,322 crore over five 0
years to boost domestic production of specialty steel. 2019-20 2020-21
(April 2019 - Mar 2020) (April 2020 - September 2020)
In February 2021, two new iron ore mines were inaugurated in Odisha,
with a production capacity of 15 lakh tonnes per month and ~275 million Mineral Production in Odisha (September 2020)
tonnes of consolidated iron ore reserves. These mines are expected to
Minerals Production
generate ~Rs. 5,000 crore (US$ 679.28 million) in annual revenue for the
state and create employment opportunities for locals. Coal (‘000 tonnes) 10,784
Bauxite (tonnes) 1,199,586
In January 2021, National Aluminium Company Ltd. (NALCO), a state-run Chromite (tonnes) 56,986
company, announced its plans to invest ~Rs. 30,000 crore (US$ 4.13
Iron Ore (total) (‘000’tonnes) 7,959
billion) as part of its expansion and diversification projects in the next 6-7
Manganese Ore (tonnes) 24,899
years until FY28.
Sulphur (tonnes) 14,420
Note: MTPA- million tonne per annum
Source: Ministry of Mines, Government of India, Department of Steel & Mines, Government of Odisha
30Key sector – Metals & mining … (2/2)
Key players
OMC was established in 1956 to explore and harness the mineral wealth of Odisha. In 1961, it became a state-
owned corporation of the Government of Odisha. OMC has reserves of around 654.9 million tonnes of iron ore, 6.3
million tonnes of manganese-ore, 25.3 million tonnes of chromite, 19.6 million tonnes of limestone and other
Orissa Mining minerals. OMC has 35 mining leases (chromite - 11, iron - 11, iron & manganese - 5, manganese - 3, limestone - 1
Corporation Ltd and gemstone - 4).
Mahanadi Coalfields Limited is one of the major coal producing company of India. It is an eight subsidiaries of
Coal India Limited and was formed in April 1992. It has two coalfields at Talcher & IB Valley in Odisha.
Mahanadi Coalfields
Ltd (MCL)
Rungta Mines Limited is the flagship company of the S R Rungta Group. The company specialises in mining iron-
ore and manganese ore. it is also involved in mining of limestone, dolomite, fireclay and bauxite.The company has
Rungta Mines Ltd one million tonne cement plant in Odisha, which will involve an investment of US$ 126.5 million.
31Key sector – Agriculture…(1/2)
Odisha's main agriculture products are rice, pulses, oilseeds, vegetables, Area and production of horticulture crops (2019-20)
groundnut, cotton, jute, coconut, spices, sugarcane, potato and fruits. There is a
vast scope for agro-based industries for rice, lentils, edible oil-milling, dehydration Area Production
Year
of vegetables, maize-milling, cattle and poultry rearing, cotton oil, potato chips, (‘000 Ha) (‘000 MT)
coconut oil, sugar mills, mushroom cultivation, non-edible oils and others.
Fruits 316.44 1,917.07
In 2019-20, the total production of horticulture crops in the state was expected to
be 10,514.23 thousand metric tonnes and area under production was 1,315.85 Vegetables 587.58 7,937.16
thousand hectares. In 2019-20, the total production of vegetables and fruits was
estimated at 7,937.16 thousand metric tonnes and 1,917.07 thousand metric Spices 147.67 2,93.85
tonnes, respectively.
Plantation 257.69 316.20
In Union Budget 2021, the Odisha government allocated funds worth Rs. 10,705
Aromatics &
crore (US$ 1.47 billion) to agriculture and allied activities. The state allocated 1.92 0.61
Medicinal
7.4% of its total expenditure towards agriculture and allied activities, (higher than
Honey - 1.20
the average allocation for agriculture by other states, i.e., 6.3%).
Requirement, Availability and Sales of Fertilisers in
The government allocated Rs. 1,800 crore (US$ 247.64 million) to the KALIA Odisha (MT) (in April 2021)
(Krushak Assistance for Livelihood and Income Augmentation) scheme and Rs.
1,415 crore (US$ 194.67 million) to the fisheries and animal resources Fertiliser Requirement Availability Sales
development sector. Urea 20,000 38,968.24 35,925.68
DAP 10,000 13,036.03 4,655.75
In May 2021, CM Mr. Naveen Patnaik announced that Rs. 920 crore (126.14
million) has been deposited in the bank accounts of 42 lakh farmers in the state MOP 3,000 12,071.42 3,072.7
under the Kalia Yojana for Kharif 2021.
NPK 7,000 27,876.06 6,345
Note: 1-3rd Adv. Est 2018-19.
Source: Department of Agriculture, Cooperation & Farmers Welfare, Government of India
32Key sector – Agriculture…(2/2)
Key players
The company was established in the year 1961 and has a average capacity to crush 19,000 tonnes of sugarcane
a day. The company has four crushing units, three units are located in Tamil Nadu while one in Dhenkanal district.
The Odisha plant has sugarcane processing capacity of 2500 tonnes per day.
Sakthi Sugars Ltd
The company was established in the year 1963. Its plant is located in Aska town of the Ganjam district in Odisha,
170 km from Bhubaneswar. The cooperative employs 900 people and provides livelihood to 20,000 sugarcane
Aska Cooperative Sugar growers in the area. Presently, the plant has a crushing capacity of 2,500 tonnes per day.
Industries Ltd
IFFCO produces and distributes fertilizers to farmers and member co-operatives in India. Its products include urea
and fertilisers, indigenous seeds and chemicals. The Odisha plant is situated at the Bhubaneswar - Paradeep
National Highway ,which can produce 2 Million TPA DAP/NPK, 7000 TPD of Sulphuric Acid and 2650 TPD of
Indian Farmers Fertiliser Phosphoric Acid.
Cooperative (IFFCO)
33Key Sectors – IT/ITeS and electronics … (1/2)
The IT sector is dominated by over 300 SMEs. The sector employs around 12,000 software professionals. In order to attract ICT investments, the
centre is considering a mega project in Bhubaneswar, Odisha.
The state has an ample talent pool to cater to the needs of this industry. It produces 40,000 technical & management professionals & 50,000
general graduates every year.
The state Government announced plans to spend US$ 663.57 million by 2020 for the development of IT/ITeS/ESDM sector of Odisha, with an aim
to create more than 100,000 job opportunities through this investment. Increased demand from IT giants such as TCS, Infosys and Wipro is
expected to generate 30,000 jobs in the state.
Policy initiatives and statutory framework
To develop IT/ITES/ESDM industries in the state of Odisha and to promote start-ups , Products and R&D
/Innovation Firms, Incubation Centres in Educational Institutions & Private sector, Electronic System
Information and Communication Design and Manufacturing (ESDM), Entertainment IT (Visual Effects, Animation, Gaming) , Mega IT
Technology Policy (ICT), 2014 Projects, Level II Cities , T Parks/IT SEZs/IT Clusters .The Government is incentivising by providing Entry
Tax Exemption (during construction) for a period of 3 years and IT/ITES/ESDM industries to be provided
with separate SEZs.
The Government of Odisha has given importance to the ESDM by providing it with subsidies and special
Special Incentive Package Scheme
incentive packages such as training subsidy ,100% VAT reimbursement for a period of 5 years
for ESDM
Exemption on entry tax on machinery and equipment.
This policy considers IT and ESDM on top priority by offering incentives to attract investments and
The Industrial Policy Resolution
promote economic growth in the state of Odisha.
2015
Source: Invest Odisha
34Key Sector- IT/ITeS and electronics … (2/2)
Key players
Infosys was set up in 1981. It has presence in the areas of IT consulting, modular global sourcing, process re-engineering and
BPO services. The company has international operations in countries such as Australia, China, Japan, UK, Germany, the US
and marketing and technological alliances with Informatica, IBM, HP, Microsoft, Oracle, etc.. In Odisha, it has a world-class
development centre at Bhubaneswar which anchors Infosys’ relationships with clients from Canada, Europe and North
Infosys Ltd America.
TCS is among the leading Indian IT services, business solutions and outsourcing companies. TCS employs over 448,464
people worldwide with a presence in 46 countries. It has operations in Odisha (in Bhubaneswar) since 2001.
Tata Consultancy
Services (TCS)
Established in 1945, it has presence in the areas of IT services, product engineering, technology infrastructure services, BPO
and other consulting solutions. The company provides services such as application development, deployment and
maintenance, business intelligence and Customer Relationship Management (CRM). In February 2008, the company set up a
development centre in Bhubaneswar.
Wipro Ltd
Established in 2001, Orisys Infotech is a software development company, which offers services from system applications to
business application development. It is involved in a variety of services, such as software development, web solutions, e-
commerce, multimedia and search engine optimization. The company is based in Bhubaneswar.
Orisys Infotech Pvt Ltd
35Key sector- Tourism
Total tourist arrivals in Odisha (millions)
18.0
16.0
14.0
15.40
15.30
14.11
12.0
12.90
10.0
11.80
8.0
6.0
4.0
2.0
0.0
2015
2016
2017
2018
2019
Bhubaneswar, the capital city of the state, is known as the temple city of India & is home to about 500 temples. Puri, Bhubaneswar & Konark are
the main centres for religious tourism.
About 153.07 lakh domestic tourists and 1.15 lakh foreign tourists visited Odisha in 2019-20.
Odisha has vast potential for development of tourism. It is one of the critical sectors of the state’s economy, in terms of foreign exchange
earnings as well as employment generation opportunities.
According to a study, there will be a three-fold increase in the number of hotel rooms in the state by 2025 and will require a capital expenditure of
Rs. 14.5 billion (US$ 207.46 million) through public-private participation.
Source: Economic Survey of Odisha, Tourism Report, Government of Odisha, Ministry of Tourism, Government of India
36KEY PROCEDURES AND POLICIES 37
Single – Window clearance mechanism… (1/2)

 Investments handled                                      Under the chairmanship of       Nodal agency

         Greater than         High-level clearance
                                                               Chief Minister of Odisha
       US$ 219.4 million            authority
                                                                                            Industrial Promotion
                                                                                            and Investment
                                                                                            Corporation of
                                                                                            Odisha (IPICOL)
                                                                                            (Team Odisha):
                                                                                            State-level
          Between
                           State-level single-window
        US$ 10.9 and                                               Chief Secretary
                              clearance authority
       US$ 219.4 million

         Less than         District-level single-window                                       District Industries
                                                                  District Collector                Centre
       US$ 10.9 million        clearance authority

 38
Single – Window clearance mechanism … (2/2)
The Government enacted the Orissa Industries Facilitation Act, 2004, for implementing the single-window clearance system for faster and one-
point clearance of industrial projects, single-point dissemination of industrial project related information and streamlining inspection of industries
by different agencies and authorities.
The District-level Single-Window Clearance Authority works under the chairmanship of the District Collector for projects involving investment less
than US$ 10.9 million.
The State-level Single-Window Clearance Authority is chaired by the Chief Secretary of the state for projects involving investment of US$ 10.9
million or more, but less than US$ 219.4 million.
A High-level Clearance Authority chaired by the Chief Minister of Odisha examines and considers proposals for industrial and other projects
involving investment of US$ 219.4 million or above.
39Key investment promotion offices … (1/3)
Agency Description
IPICOL is a key promotional institution. It was incorporated in 1973 with the main objective of
Industrial Promotion and Investment
accelerating the pace of industrial development by promoting large and medium scale industries.
Corporation of Odisha Limited
In 2014-15, the IPICOL received 26 combined application forms for setting up projects with an
(IPICOL)
investment of US$ 11.97 billion.
Industrial Development Corporation of Orissa IDCOL was established in 1962 to promote, establish and run industries in the state.
Limited
The corporation, since its inception, has set up 15 industrial units across sectors including
(IDCOL) cement, ferrochrome, pig iron and spun pipe.
IDCO was established with the objective of providing infrastructure assistance for rapid
establishment and orderly growth of industry in Odisha.
Orissa Industrial Infrastructure Development
Corporation The corporation is engaged in multiple activities that foster rapid industrialisation in the state by
developing industrial infrastructure.
(IDCO)
In 2012-13, IDCO allotted 352.530 acres of land and sheds to 14 new industrial estates/areas
across the state.
APICOL’s aim is to strengthen the rural economy by providing financial support for promotion
Agricultural Promotion and Investment and development of agro-based and food-processing industries.
Corporation of Odisha Limited APICOL provides subsidy to the agro-processing and food-processing units in the state.
(APICOL)
In 2009-10, the corporation promoted 145 commercial agro-enterprises with an aggregate
investment of about US$ 24,38,619.77 .
40Key investment promotion offices … (2/3)
Agency Description
OSFC is a premier state-level financial institution that was established in 1956 to cater to the
needs of industrial development in the state.
Orissa State Financial Corporation It provides financial assistance to small and medium scale industries in consortium with state-
(OSFC) level financial institutions.
Besides, the corporation also receives financial assistance from the state and central
governments, and provides soft loans and margin money for rehabilitation of sick industrial units.
OPDC is the only public sector undertaking in the fishery sub-sector and aims at carrying on
Orissa Pisciculture Development Corporation business in pisciculture in brackish water areas, freshwater ponds and other water sources.
Limited (OPDC) It has launched a number of projects such as supplying fishnet, fuel and fish seeds for the
economic development of fishermen.
DEPM has been set up to promote export of goods from Odisha and to provide marketing
assistance to SSI units of the state.
Directorate of Export Promotion & Marketing It disseminates market intelligence, oversees enquiries related to tenders and trade from existing
(DEPM) and potential exporters and entrepreneurs.
It provides guidance in export processing, pricing of export items and on different incentives for
exports, granted by the Government of India.
OSIC was established in April 1972, with the main objective of aiding and assisting SSI units in
the state for their sustained growth and development.
Odisha Small Industries Corporation Ltd
(OSIC) The corporation has been extending help for marketing support, financial assistance on
purchase of raw materials, providing sub-contracting opportunities in the construction sectors
and also rendering various other services to SSI units.
41Key investment promotion offices … (3/3)
Agency Description
Established in 1956, OSCHC is the primary authority engaged in encouraging exporters,
The Orissa State Cooperative Handicrafts
enlarging marketing opportunities, introducing new design and technology and strengthening the
Corporation (OSCHC)
production base in the handicrafts sector.
Orissa State Electronics Development OSEDC was established in 1981 as the nodal organisation in the state for promotion of
Corporation (OSEDC) electronic industries, both in hardware and software.
GRIDCO is a Government of Odisha undertaking and was incorporated in April 1995 for power
transmission.
Grid Corporation of India Limited In 2005, GRIDCO’s transmission-related activities were transferred to Orissa Power
(GRIDCO) Transmission Corporation.
Now, GRIDCO is a trading company and is involved in the bulk sale of power to the four power
distribution companies in Odisha. It also trades surplus power with neighboring states.
OSPCB is responsible for managing hazardous waste, bio-medical waste, municipal solid-
waste, recycled plastics, batteries as well as manufacture, storage and import of hazardous
Orissa State Pollution Control Board
chemicals.
(OSPCB)
Its functions are broadly classified under areas such as enforcement, advisory, monitoring,
research and facilitation.
42Contact list
Agency Description
Killa Maidan, Cuttack-753 001
Phone: 91-0674-2536640
Directorate of Industries Fax: 91-0674-2536819
E-mail: diorissa@ori.nic.in
Website: http://diodisha.nic.in/
IPICOL House, Janpath, Bhubaneswar-751 022
Phone: 91-0674-2542 601
Industrial Promotion and Investment Corporation of Odisha Limited
Fax: 91-0674-2543 766
(IPICOL)
E-mail: info@ipicolodisha.com
Website: http://www.ipicolorissa.com/
43Key approvals required (1/2)
Approvals and clearances required Departments to be consulted
Incorporation of company Registrar of Companies
Registration/Industrial License/Industrial District Industries Centres for
Entrepreneurs Memorandum (IEM) SSI, Secretariat for Industrial
Assistance**
Industrial Infrastructure
Allotment of land Development Corporation
(IDCO)
IDCO, Dept of Town & Country
Permission for land use Planning, Local
(In case industry is located outside an authority/District Collector
industrial area)
Ministry of Forest &
Environment, Government of
Forest and environment clearance India
Approval of construction activity and Concerned Development
building plan Authority
Distribution and
Sanction of electricity Transmission Company*
*Distribution Companies- CESU, NESCO, SOUTHCO, WESCO; Transmission Company- Orissa Power Transmission Corporation Limited (OPTCL)
**Secretariat for Industrial Assistance (Government of India) for Large and Medium Industries
44Key approvals required (2/2)
Approvals and clearances required Departments to be consulted
Water supply Department of Water Resources
Chief Inspector of Factories and
Factory and boiler clearance
Boilers
Orissa State Financial Corporation
Finance (OSFC), IPICOL, Commercial
Banks*
Commercial Tax Department and
Orissa Value Added Tax (VAT) Act, and Central and State Excise
Central and State Excise Act Department
*Commercial Banks such as IDBI, ICICI, State Bank of India, etc.
45Cost of doing business in Odisha Cost parameter Cost estimate Land (per sq m) US$ 2 to US$ 15 Office space rent (per sq ft per month) US$ 0.2 to US$ 2 Residential rent (for a 2,000 sq ft house, per month) US$ 200 to US$ 400 Five-star hotel room (per night) US$ 200 to US$ 450 Power cost (per kwh) Industries: US 7.5 cents to US 10.4 cents Labour cost (minimum wage per day) US$ 4.6 to US$ 6.15 Source: Ministry of Labour and Employment, Government of India, Industry sources 46
State acts and policies

      1
                          Excise Policy 2017-18
                          • To adopt excise duty, fee structure and guidelines for the settlement of excise shops and
                            establishments.
                                                                                                                 Read more

      2
                          Export Policy 2017 (Draft)
                          • To provide necessary support to exporting industries with the aim of providing a boost to exports.
                          • To establish an institutional mechanism for regular dialogue with export sector.     Read more

                      Odisha Mobile Towers, OFC and related Telecom Infrastructure Policy, 2017

      3
                          • To streamline the process of application and grant of permission for telecom infrastructure within
                            specified timelines.
                          • To facilitate establishment of modern telecommunication infrastructure to provide high speed
                            internet.                                                                             Read more

                      Renewable Energy Policy 2016

      4
                      •     To create an environment conducive to public/private/community participation and investments in
                            renewable energy
                      •     To facilitate R&D and development of manufacturing units in the renewable energy sector.
                                                                                                                Read more

      5
                          Urban Wage Employment Initiative
                          • MUKTA, an urban wage employment initiative, was introduced to provide wage employment
                            opportunities to the urban poor in Odisha.
                                                                                                          Read more

                          Odisha Tourism Policy 2016

      6
                          • To promote sustainable tourism with a view to create employment opportunities and to bring about
                            socio-economic benefits to the community.
                          • To give high priority to development and promotion of prime tourism products, conservation of
                            heritage, etc.                                                                     Read more

 47
APPENDIX 48
Sources

                       Data                                                                 Sources

 GSDP (state)                                  Economic Survey 2018-19 (Odisha)

 Per capita GSDP figures                       Economic Survey 2018-19 (Odisha)

 GSDP (India)                                  Economic Survey 2018-19 (India)

  Installed power capacity (MW)                Central Electricity Authority

  Wireless subscribers (No)                    Telecom Regulatory Authority of India

  Internet subscribers (million)               Telecom Regulatory Authority of India

  National highway length (km)                 NHAI, Roads and Building Department-Government of India

  Major and minor ports (No)                   India Ports Association

  Airports (No)                                Airports Authority of India

  Literacy rate (%)                            Economic Survey 2018-19 (India)

  Birth rate (per 1,000 population)            Economic Survey 2018-19 (India)
 Cumulative FDI equity inflows (US$ billion)   Department for Promotion of Industry and Internal Trade
  Operational PPP projects (No)                DEA , Ministry of Finance, Government of India

  Operational SEZs (No)                        Ministry of Commerce & Industry, Department of Commerce

 49
Exchange rates
Exchange Rates (Fiscal Year) Exchange Rates (Calendar Year)
Year Rs. Equivalent of one US$ Year Rs. Equivalent of one US$
2004-05 44.95 2005 44.11
2005-06 44.28 2006 45.33
2006-07 45.29 2007 41.29
2007-08 40.24 2008 43.42
2008-09 45.91 2009 48.35
2009-10 47.42 2010 45.74
2010-11 45.58 2011 46.67
2011-12 47.95 2012 53.49
2012-13 54.45 2013 58.63
2013-14 60.50 2014 61.03
2014-15 61.15 2015 64.15
2015-16 65.46 2016 67.21
2016-17 67.09 2017 65.12
2017-18 64.45 2018 68.36
2018-19 69.89 2019 69.89
2019-20 70.49 2020 74.18
2020-21 73.20 2021* 74.26
Note: As of June 2021
Source: Reserve Bank of India, Average for the year
50Disclaimer India Brand Equity Foundation (IBEF) engaged Sutherland Global Services private Limited to prepare/update this presentation. All rights reserved. All copyright in this presentation and related works is solely and exclusively owned by IBEF, delivered during the course of engagement under the Professional Service Agreement signed by the Parties. The same may not be reproduced, wholly or in part in any material form (including photocopying or storing it in any medium by electronic means and whether or not transiently or incidentally to some other use of this presentation), modified or in any manner communicated to any third party except with the written approval of IBEF. This presentation is for information purposes only. While due care has been taken during the compilation of this presentation to ensure that the information is accurate to the best of Sutherland Global Services’ Private Limited and IBEF’s knowledge and belief, the content is not to be construed in any manner whatsoever as a substitute for professional advice. Sutherland Global Services Private Limited and IBEF neither recommend nor endorse any specific products or services that may have been mentioned in this presentation and nor do they assume any liability, damages or responsibility for the outcome of decisions taken as a result of any reliance placed on this presentation. Neither Sutherland Global Services Private Limited nor IBEF shall be liable for any special, direct, indirect or consequential damages that may arise due to any act or omission on the part of the user due to any reliance placed or guidance taken from any portion of this presentation. 51
You can also read