TAMIL NADU BLEND OF TRADITION AND TECHNOLOGY - MEENAKSHI TEMPLE IN MADURAI, TAMIL NADU - IBEF ...
←
→
Page content transcription
If your browser does not render page correctly, please read the page content below

MEENAKSHI TEMPLE IN MADURAI, TAMIL NADU

     TAMIL NADU
     BLEND OF TRADITION AND TECHNOLOGY

    For updated information, please visit www.ibef.org                                                  June 2020
1       TAMIL NADU                                               For updated information, please visit www.ibef.org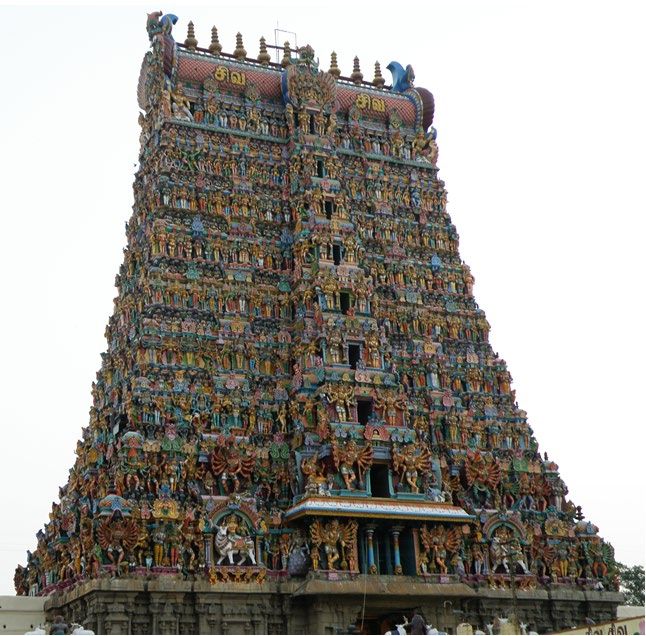
Table of Contents

       Executive Summary……………….….…….3

       Introduction…………………..........………..4

       Economic Snapshot………….……………..9

       Physical Infrastructure………….....………15

       Social Infrastructure...................................23

       Industrial Infrastructure…….………..…….26

       Key Sectors ……...…………………….…..31

      Key Procedures & Policies...……..........…40

       Annexure.………….……..….......................50

2     TAMIL NADU                                                    For updated information, please visit www.ibef.org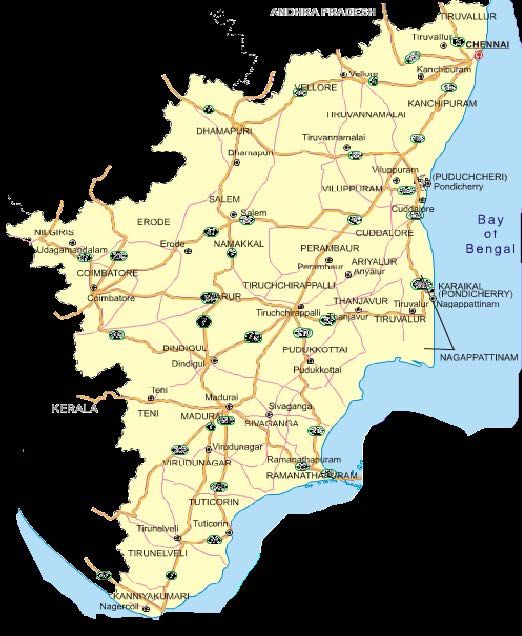
EXECUTIVE SUMMARY
Gross State Domestic Product (GSDP) of Tamil Nadu grew at a CAGR of 12.20 per cent between 2015-16
Strong growth in GSDP
and 2020-21, reaching about Rs 20.92 trillion (US$ 269.32 billion) in 2020-21.
The cumulative FDI inflow* in the state during April 2000 to March 2020 amounted to US$ 32.20 billion.
Strong investment climate
Tamil Nadu has 59 universities, 40 medical colleges, 517 engineering colleges, 447 polytechnics and 20
and Human resource
dental colleges.
Tamil Nadu has a diversified manufacturing sector and features among the leading states in several
Diversified industrial base industries like garments & textile products, IT & ITeS, etc.
It ranks first among the states in terms of number of factories and industrial workers.
As of March 2019, IT & ITeS exports from Tamil Nadu have increased to Rs 1.39 lakh crore (US$ 19.9 billion)
in 2018-19, at a growth rate of 10 per cent year-on-year.
Thriving services sector
It has a thriving tourism sector and ranks 1st in India in terms of number of domestic tourist arrivals and 2nd in
foreign tourist arrivals in 2017(P).
It has well developed infrastructure with an excellent road and rail network, three major ports, 23 minor ports,
and seven airports across the state providing excellent connectivity.
In line with Vision 2023, it aims to step up infrastructure investment from 4-5 per cent of GSDP to about 11.5
Robust infrastructure per cent by 2019.
Roads & highways, ports, railways, education and healthcare are likely to see major investments.
The state also plans to develop 2 industrial corridors – Chennai-Bengaluru & Madurai-Tuticorin.
Note: E – Expected, * – includes Pondicherry, IT - Information and Technology, ITeS – IT enabled services, P - Provisional
Source: Central Statistics Office, Department for Promotion of Industry and Internal Trade ,1Including Puducherry, News articles
3 TAMIL NADU For updated information, please visit www.ibef.org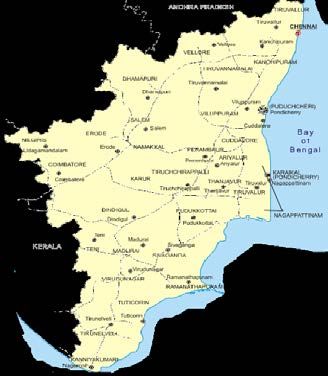
TAMIL NADU

    INTRODUCTION

4   TAMIL NADU     For updated information, please visit www.ibef.org
TAMIL NADU FACT FILE
Parameters Tamil Nadu
Capital Chennai
Geographical area (sq km) 130,058
Administrative districts (No) 32
Population density (persons per sq km) 555
Total population (million) 72.14
Male population (million) 36.13
Female population (million) 36.00
Sex ratio (females per 1,000 males) 996
Literacy rate (%) 80.09
Tamil Nadu is the southern-most Indian state, surrounded by Andhra Pradesh on the north, Karnataka and Kerala on the west, Indian Ocean
on the south, and Bay of Bengal on the east.
Tamil Nadu is among the most industrialised states in the country. Tamil is the state language; English is also commonly used for
communication and as a medium of education.
Chennai, Coimbatore, Madurai, Thiruchirappalli, Salem, Tirunelveli and Erode are some of the key cities in the state.
The climate ranges from dry sub-humid to semi-arid. Major rivers flowing through the state include Palar, Cheyyar, Ponnaiyar, Kaveri,
Bhavani, Vaigai and Tamaraparani.
Source: Government of Tamil Nadu website, Census 2011, Maps of India
5 TAMIL NADU For updated information, please visit www.ibef.org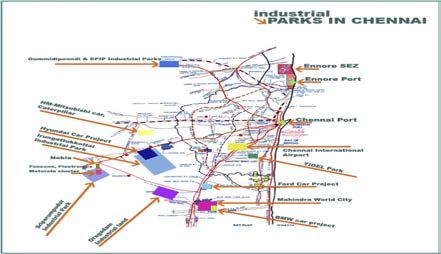
ADVANTAGE: TAMIL NADU
High economic growth Rich talent pool
The GSDP at current price of Tamil Nadu grew at a CAGR of The state has a highly qualified, skilled, disciplined,
12.20 per cent between 2015-16 and 2020-21. productivity-oriented and English-speaking human
Total merchandise exports from the state stood at US$ 30.52 resource pool.
billion during 2018-19. Tamil Nadu produces nearly 4 lakh engineering and
According to the Good Governance Index 2019, Tamil Nadu polytechnic students every year, the highest in the
ranked first in terms of governance. country.
During September 2017 – October 2019, 50,606 formal
jobs were created in Tamil Nadu.*
Advantage
Tamil Nadu
Infrastructure Large industrial base
Tamil Nadu has well-developed social, physical and industrial Tamil Nadu has a range of manufacturing industries such
infrastructure and virtual connectivity. as automobiles and components, castings and forgings,
pumps and motors, garments and textile products, leather
Excellent road and rail network, three major ports, 15 minor
products, chemicals and plastics.
ports and seven airports provide excellent connectivity.
Tamil Nadu ranks first among all states in terms of the
It is one of the first states in India to have 100 per cent
number of factories and industrial workers.
metalled road connectivity.
India and China have agreed to develop Chennai-
Chongqing as sister cities.
Note: * - According to Employees' Provident Fund Organisation (EPFO) data
Source: Ministry of Statistics and Programme Implementation, March 2015. Tamil Nadu Vision 2023 at 2010 Prices; News articles
6 TAMIL NADU For updated information, please visit www.ibef.org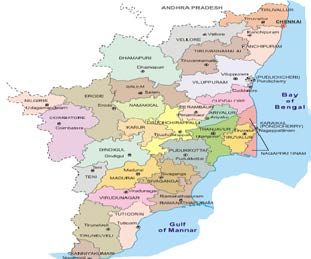
VISION 2023
To nurture a culture of To be India’s most
responsive and economically
transparent governance prosperous state by
that ensures progress, 2023 and achieve six-
security and equal fold growth in per
opportunity to all capita income.
stakeholders.
To address the causes of Growth To exhibit a highly inclusive
Opportunity
vulnerability arising due to growth pattern, leading to be
natural calamities and economic a poverty free state with
downturns, among others, and opportunities for gainful and
Reduce
mitigate their adverse effects. productive employment.
vulnerability Opportunities
Vision 2023
To ensure peace, security and
prosperity for all citizens and Trade & Heritage Development To become the leading state
businesses, facilitating free trade
in social development, with
movement between the state, rest
the highest Human
of India & the world.
Investment Infrasturcture Development Index among all
To preserve and care for the Indian states.
state’s ecology and heritage.
To become one of the top three
preferred investment destinations in
India and Asia. To provide the best infrastructure
To be India’s innovation hub and services in India in terms of access
knowledge capital. to housing, water & sanitation,
The state targets attracting investments energy, transportation, irrigation,
to the tune of US$ 248.84 billion connectivity, healthcare and
between 2012-2023. education.
Source: Government of Tamil Nadu
7 TAMIL NADU For updated information, please visit www.ibef.orgTAMIL NADU IN FIGURES
Tamil Nadu’s Contribution to Indian Economy (2018-19) Physical Infrastructure in Tamil Nadu
Parameter Tamil Nadu India Parameter Tamil Nadu India
GSDP as a percentage of all Installed power capacity
8.43 100.0 32,840.34 370,106.46
states’ GSDP (MW) (As on March 2020)
GSDP growth rate** (%) 12.32 11.5 Wireless subscribers (Mn)
81.89 1,156.44
(As on January 2020)
Per capita GSDP* (US$) 2,876.23 1,982.65
Internet subscribers (Mn)
48.46 687.62
(As on September 2019)
Social Indicators
National highway length
Parameter Tamil Nadu India 6,742 132,499
(km)
Literacy rate (%) 80.09 73.0 Major and minor ports
3 + 15 13+187
(No)
Birth rate (per 1,000
15.0 20.4
population) Airports (No) 8 129
Industrial Infrastructure Investments (as of March 2020)
Parameter Tamil Nadu India Parameter Tamil Nadu* India
Operational PPP projects (No) 84 1877
Cumulative FDI equity
Exporting SEZs (No) (As of inflows since April 2000 32.20 469.99
35 231
March 2019) (US$ billion)
Note: GSDP, per capita GSDP figures are for 2017-18 taken at current prices, Conversion rate: 64.45, For source refer to Annexure, * - Includes Pondicherry, ** - year-on-year, MW-
megawatt, FDI- Foreign direct investment, MN- Million
8 TAMIL NADU For updated information, please visit www.ibef.orgTAMIL NADU ECONOMIC SNAPSHOT 9 TAMIL NADU For updated information, please visit www.ibef.org
ECONOMIC SNAPSHOT – GSDP
GSDP of Tamil Nadu at current prices GSDP per capita of Tamil Nadu at current prices
350 CAGR (In Rs) 12.20% 25 4,000 250,000
CAGR (In Rs) 11.03%
237,500.71
3,500
300
3,398.21
200,000
299.32
20
207,519.98
20.92
3,000
3,051.76
250
186,124.70
2,887.89
246.91
17.26
2,500
167,240.18
150,000
229.77
16.06 15
156,306.05
2,492.77
221.42
200
2,387.81
14.27
2,000
189.37
179.73
12.70
150
11.77
10 100,000
1,500
100
1,000
5 50,000
50 500
0 0 0 0
2015-16
2016-17
2017-18
2018-19
2019-20
2020-21
2015-16
2016-17
2017-18
2018-19
2019-20
US$ billion Rs trillion US$ Rs
At current prices, Tamil Nadu’s Gross State Domestic Product The state’s per capita GSDP was Rs 237,500.7 (US$ 3,398.21)
(GSDP) was about Rs 20.92 trillion (US$ 269.32 billion) in 2020- in 2019-20.
21. Per capita GSDP increased at a CAGR of 11.03 per cent
The GSDP of the state grew at a CAGR of 12.20 per cent between between 2015-16 and 2019-20.
2015-16 and 2020-21.
Source: Ministry of Statistics and Programme Implementation
10 TAMIL NADU For updated information, please visit www.ibef.orgECONOMIC SNAPSHOT – NSDP
NSDP of Tamil Nadu at current prices NSDP per capita of Tamil Nadu at current prices
300 18 3,500 250,000
CAGR (In Rs) 12.17% CAGR (In Rs) 11.13%
16
16.73
250 3,000
3,065.34
214,236.72
200,000
14.99
14
2,849.26
239.41
193,749.62
2,500
2,662.26
220.49
13.16
200 12
204.12
171,582.85
11.72
2,299.48
150,000
10 2,000
154,271.97
2,145.44
10.57
174.69
150
140,440.83
161.49
8
1,500
100,000
100 6
1,000
4
50,000
50
500
2
0 0 0 0
2015-16
2016-17
2017-18
2018-19
2019-20
2015-16
2016-17
2017-18
2018-19
2019-20
US$ billion Rs trillion US$ Rs
Tamil Nadu’s Net State Domestic Product (NSDP) was about Rs The state’s per capita NSDP was Rs 214,236.72 (US$ 3,065.34)
16.73 trillion (US$ 239.41 billion) in 2019-20. in 2019-20.
NSDP of the state grew at a CAGR of 12.17 per cent between The per capita NSDP increased at a CAGR of 11.13 per cent
2015-16 and 2019-20. between 2015-16 and 2019-20
Note: Conversion rate as per slide 53
Source: Ministry of Statistics and Programme Implementation
11 TAMIL NADU For updated information, please visit www.ibef.orgECONOMIC SNAPSHOT – PERCENTAGE
DISTRIBUTION OF GSVA
Visakhapatnam
Percentageport
distribution
traffic (million
of GSVAtonnes)
In 2019-20, tertiary sector contributed 54.63 per cent to the state’s
Gross State Value Added (GSVA) at current prices, followed by 100%
50.48% 54.63%
secondary sector at 31.92 per cent. CAGR
90%
Tertiary sector grew at a CAGR of 12.79 per cent between 2011-12
and 2019-20, driven by trade, hotels, real estate, finance, insurance, 80%
transport, communications and other services. 12.79%
70% 1
Secondary sector grew at a CAGR of 9.87 per cent in this period,
driven primarily by manufacturing and construction sectors. 60%
Primary sector grew at a CAGR of 12.02 per cent between 2011-12 50%
and 2019-20. 9.87%
40% 31.92%
30%
20% 36.39%
12.02%
10% 13.45%
13.13%
0%
2011-12 2019-20
Primary Secondary Tertiary
Source: Ministry of Statistics and Programme Implementation
12 TAMIL NADU For updated information, please visit www.ibef.orgECONOMIC SNAPSHOT – FDI INFLOW &
INVESTMENTS
According to DPIIT, cumulative FDI inflow* in Tamil Nadu stood at FDI inflow in Tamil Nadu
US$ 32.20 billion between April 2000 and March 2020 . April 2000-March 2020 (US$ billion)*
Tamil Nadu organised its second Global Investor Meet (GIM) on 35
2.36 32.20
January 23 and 24, 2019. The state surpassed the targeted
investment and attracted Rs 3.4 lakh crore (US$ 48.65 billion) 30
investment in 12 sectors including automobile, textiles, renewable
energy, etc. 2.61
25
Around 146 memorandum of understanding (MoUs) were signed
3.48
with an expectation to generate 10.5 lakh job opportunities in the 20 2.22
state.
15 4.53
3.82
10
6.85 2.12
2.81
5 1.42
0
FY12
FY13
FY14
FY15
FY16
FY17
FY18
FY19
FY20
FY01-FY11
FY01-FY20
Note: * - Including Pondicherry
Source: Directorate of Economics & Statistics of Tamil Nadu, Department for Promotion of Industry and Internal Trade
13 TAMIL NADU For updated information, please visit www.ibef.orgECONOMIC SNAPSHOT – EXPORTS
Composition of Major Items Exported from Tamil Nadu
Export Trend (US$ billion)
(April-December 2019)
35.00 13.63%
30.00
30.52 10.83%
29.75
25.00 26.45
22.90 51.69%
6.22%
20.00
3.92%
15.00
3.45%
3.57%
10.00 3.19%
3.48%
Motor Vehicles/Cars RMG Cotton including Accessories
5.00
Auto Components/Parts Cotton Fabrics, Madeups etc
Footwear of Leather RMG of other Textiles materials
0.00 Industrial Machinery for Dairy etc Electric Machinery and
2016-17 2017-18 2018-19 2019-20*
Others
Total merchandise exports from the state stood at US$ 30.52 billion during 2017-18. During April-December 2019, exports stood at US$ 22.90
billion.
Major items exported from the state of Tamil Nadu are motor vehicles, readymade garments including accessories and auto components and parts
etc.
Note: RMG – Ready Made Garments, *- till December 2019
Source: Directorate General of Commercial Intelligence and Statistics
14 TAMIL NADU For updated information, please visit www.ibef.orgTAMIL NADU PHYSICAL INFRASTRUCTURE 15 TAMIL NADU For updated information, please visit www.ibef.org
PHYSICAL INFRASTRUCTURE – ROADS
Length (kms)
Category of Roads
(as of March 2019)
National highways (NH) 6,742
Tamil Nadu has 28 national highways. It is an important terminus in the Golden Quadrilateral road link of NHAI. District centres are linked via
187 state highways.
Tamil Nadu to get 6-8 lane expressways of 2000 km, 4 lane highways of 5000 km and all the highways to be converted into double-lane along
with paved shoulders*.
The Comprehensive Road Infrastructure Development Programme (CRIDP) is a flagship scheme to upgrade road infrastructure in the State.
Under Budget 2020-21, Rs 5,500 crore (US$ 780.25 million) has been allocated to the scheme.
Note: * - Vision 2030
Source: Ministry of Road Transport & Highways, Government of Tamil Nadu, Tamil Nadu Policy Note on Roads, Bridges, Vision 2023, News articles, Maps of India
16 TAMIL NADU For updated information, please visit www.ibef.orgPHYSICAL INFRASTRUCTURE – RAILWAYS
Tamil Nadu’s railway network falls under the jurisdiction of Southern
Railways, which covers Tamil Nadu, Kerala, Puducherry & a small
part of Andhra Pradesh. It has 6 divisions, 4 of which are in Tamil
Nadu (Chennai, Tiruchirappalli, Madurai & Salem). Coimbatore is
also a key railway junction. Tamil Nadu presently has a 4,181 km rail
network, with 690 railway stations. Chennai has a well-established
suburban railway network connecting it to the suburbs &
neighbouring cities.
Mass-Rapid-Transit System (MRTS) is an elevated line of the
suburban railway in Chennai. It runs from the Chennai beach junction
to the Velachery suburb, covering a distance of 25 km over 21
stations. It is operated by the Southern Railways.
A stretch of 10 km out of the 45 km under 1st phase of the Chennai
metro rail project is already operational. About 9 km of Extension
under 1st Phase of the Chennai metro rail project is also expected to
be completed in March 2020.
Chennai Metro Rail Budget Allocation for 2020-21 has been Rs
3,100 crore (US$ 439.78 million).
Note: RUB: Railway Under Bridges; ROB: Railway Over Bridges
Source: Tamil Nadu Vision 2023, Ministry of External Affairs,
17 TAMIL NADU For updated information, please visit www.ibef.orgPHYSICAL INFRASTRUCTURE – AIRPORTS
Tamil Nadu has international airports at Chennai, Coimbatore & Trichy; it has domestic airports at Tuticorin, Salem, Vellore (non-operational) &
Madurai. The Chennai International Airport was the 1st in the country to get ISO 9001-2000 certification.
Tamil Nadu Vision 2023 envisages an investment of US$ 5.2 billion1 for developing a greenfield airport near Chennai and upgrading other airports.
Construction work on a new passenger terminal at the Chennai International Airport has been completed. The terminal would have a capacity of 10
million passengers. Electronic Data Interchange (EDI) facility for customs clearance is available at the Chennai Airport. A new integrated terminal
building has been constructed at Madurai Airport. Thanjavur is slated to get an airport, as the Government has identified 50 locations in smaller
cities for airport.
In February 2019, the Airports Authority of India (AAI) allocated more than 25 per cent of its budget for the expansion of airports in Tamil Nadu, the
project costing Rs 2,467 crore (US$ 341.93 million).
Tamil Nadu aircraft statistics for 2019-20
Parameter Chennai Coimbatore Trichy Madurai
Aircraft movement (nos.) 1,67,982 22,303 14,260 15,925
Passenger traffic (nos.) 2,22,66,722 28,42,835 16,12,492 14,22,337
Freight handled (tonnes) 3,55,194 12,355 8,114 3,356
Source: Airports Authority of India, 1At 2011-12 rates
18 TAMIL NADU For updated information, please visit www.ibef.orgPHYSICAL INFRASTRUCTURE – PORTS
Tamil Nadu’s ports
Tamil Nadu has 3 major ports: Chennai, Ennore and VO • Chennai
Chidambaranar. The state also has 15 minor ports . Major ports • Kamarajar (Ennore)
The Chennai port mainly handles container cargo, while the Ennore • V O Chidambaranar
and V O Chidambaranar ports handle coal, ores and other bulk
minerals. Tamil Nadu Vision 2023 envisages an investment of US$
3.1 billion for 3 greenfield ports and 5 minor ports, with a cumulative
capacity of 150 million tonnes. • Cuddalore
• Nagapattinam
• Rameswaram
Cargo traffic at major ports in Tamil Nadu (million tonnes) • Pamban
• Colachel
Ports 2016-17 2017-18 2018-19 2019-20 • Valinokkam
• Kanyakumari
Minor ports • Ennore
Kamarajar
30.02 30.45 34.50 31.74 • Punnakayal
(Ennore)
• Thirukkadaiyur
• PY-3 (Oilfield)
• Kattupalli
Chennai 50.21 51.88 53.01 46.75
• Thiruchopuram
• Manappad
• Kudankulam
V.O.
38.46 36.57 34.34 36.07
Chidambaranar
Total 118.69 118.9 121.85 114.56
Source: Indian Ports Association, Tamil Nadu Vision 2023.
19 TAMIL NADU For updated information, please visit www.ibef.orgPHYSICAL INFRASTRUCTURE – POWER
The total installed capacity of Tamil Nadu is forecasted to expand, Installed power capacity (GW)
and the State Government invested Rs 5,000 crore (US$ 745.82
million) to boost renewable energy policies, transmission
34.00
infrastructure and commission a floating solar plant.
The Tamil Nadu Government has proposed to provide 2,000 solar
powered pumps up to a capacity of 10 HP for improving the micro 33.00
irrigation in the state. As per budget 2019-20, US$ 11.65 million
32.84
have been allocated for this project. 55 GW by 2026-27.
32.00
As of March 2020, the state had a total installed power generation
capacity of 32.84 GW.
Thermal power contributed 14.86 GW to the total installed power 31.00
31.06
generation capacity, followed by renewable power, hydropower, and
nuclear power with contributions of 14.35 GW, 2.18 GW, and 1.45
GW, respectively. 30.00
29.90
Private sector, with a capacity of 19.43 GW, was the biggest
contributor to the total installed power generation capacity in Tamil 29.00
29.11
Nadu, followed by state utilities (7.14 GW) and central utilities (6.24
GW).
28.00
27.00
FY17
FY18
FY19
FY20
Note: GW- Gigawatt
Source: Central Electricity Authority, Tamil Nadu Vision 2023
20 TAMIL NADU For updated information, please visit www.ibef.orgPHYSICAL INFRASTRUCTURE – TELECOM
Telecom infrastructure (as of January 2020)
According to Telecom Regulatory Authority of India (TRAI), Tamil Wireless subscribers 81,892,021
Nadu had nearly 81.89 million wireless subscribers and 2.02 million
wire-line subscribers as of January 2020. Wire-line subscribers 2,027,242
Tamil Nadu had a high tele density of 108.21 per cent as of January
Tele density (in%) 108.21
2020.
By end of January 2020, 39.60 million subscribers had submitted Internet subscribers (September 2019) (million) 46.96
request for mobile number portability in Tamil Nadu.
Major telecom operators in Tamil Nadu
Bharat Sanchar Nigam Limited (BSNL)
Bharti Airtel
Reliance Jio
Vodafone Idea
Source: Telecom Regulatory Authority of India
21 TAMIL NADU For updated information, please visit www.ibef.orgPHYSICAL INFRASTRUCTURE – URBAN
Tamil Nadu Sustainable Urban Development Programme has been Population, area & literacy rate of identified smart cities in
taken up by the state Government with the assistance of World Tamil Nadu
Bank at an amount of US$ 585.24 million.
Tamil Nadu Vision 2023 envisages an investment of US$ 57.4 Population Area Literacy rate
Cities
(million) (sq km) (percentage)
billion* for urban infrastructure development.
Google India and Tata Trusts have decided to expand their Chennai 4.6 426 90.18
‘Internet Saathi’ program in Tamil Nadu in which Google India will
Coimbatore 1.05 246.75 91.30
facilitate the provision of Google Cloud credits for eligible startups
engaged with Tamil Nadu Government’s startup initiative.
Madurai 1.01 148 90.91
Technical mentorship and advisory support to various startups will
also be made available by Google India. Tiruchirappalli 0.84 167.23 91.38
The State Government has allocated Rs 1,650 crore (US$ 236.08
Salem 0.83 5205 84.42
million) for the smart cities and Rs 1,450 crore (US$ 207.46
million) for AMRUT programme as per budget 2020-21. Tirunelveli 0.47 169.9 90.39
As of October 2018, 100 per cent households have been electrified
Thanjavur 0.22 3397 91.27
in the state under Saubhagya Scheme.
Tiruppur 0.44 5,186.34 87.81
Vellore 0.18 6,077 86.40
Erode 0.16 5,692 82.29
Thoothukudi 0.24 4,745 93.69
Dindigul 0.20 4,497.77 90.22
Source: Census 2011
22 TAMIL NADU For updated information, please visit www.ibef.orgTAMIL NADU
SOCIAL
INFRASTRUCTURE
23 TAMIL NADU For updated information, please visit www.ibef.orgSOCIAL INFRASTRUCTURE – EDUCATION
Tamil Nadu is one of the states running the Total Literacy Campaign, Tamil Nadu’s primary education statistics (2017-18)
the Post-Literacy Mission and the Continuing Education Programme
(CEP). Primary: 35,307
Middle: 9,588
In the Budget 2020-21, Rs 34,181.73 crore (US$ 4.85 billion) has Number of schools ^
High & higher secondary
been proposed towards school education. schools: 12,297
A sum of Rs 966.46 crore (US$ 137.11 million) has been allocated in
Net enrolment ratio Primary level: 99.86
this Budget for providing laptops to school students during 2020-21.
(in%) Upper primary level: 99.22
An amount of Rs 5,052.84 crore (US$ 716.82 million) has been
provided in the Budget Estimates 2020-21 for higher education. Primary: 24.02:1
Pupil-teacher ratio*
Upper primary: 24.77:1
Educational infrastructure as of 2018-19
Universities 59
Colleges 2,466
Medical colleges 40
MBA/MCA 65
Engineering colleges 584
Polytechnics 518
Dental colleges 15
Notes: * - Provisional
Source: Tamil Nadu State Portal, State Budget 2020-21
24 TAMIL NADU For updated information, please visit www.ibef.orgSOCIAL INFRASTRUCTURE – HEALTH
The state has a 3-tier health infrastructure comprising hospitals, Health infrastructure (as of May 2020)
primary health centres, health units, community health centres & sub-
centres. As of May 2020, the state had 34 district hospitals, 319 sub- Sub-centre 8,725
district health centres, 1,976 primary health centres, 8,725 sub-
Primary health centre 1,976
centres & 449 community health centres.
Community health centre 449
A total amount of Rs 1,033.29 crore (US$ 147.85 million) has been
provided in the Budget Estimates 2020-21 for the CMCHIS. Sub – District health centre 319
In the Budget Estimates 2020-21, Rs 15,863.37 crore (US$ 2.27 District hospitals 34
billion) has been allocated to Health and Family Welfare Department.
The Government of India’s Pradhan Mantri Matru Vandana Yojana Health indicators of Tamil Nadu (September 2017)
has been provided a sum of Rs 959.21 crore (US$ 137.24 million) in
1
the Budget Estimates 2020-21. Birth rate 15.0
1
Death rate 6.4
2
Infant mortality rate 17
Life expectancy at birth (years)
Male (2006-10) 67.1
Female (2006-10) 70.9
Source: Ministry of Health & Family Welfare, Tamil Nadu Vision 2023, 1Per thousand persons, 2Per thousand live births
25 TAMIL NADU For updated information, please visit www.ibef.orgTAMIL NADU INDUSTRIAL INFRASTRUCTURE 26 TAMIL NADU For updated information, please visit www.ibef.org
INDUSTRIAL INFRASTRUCTURE… (1/4)
SEZs (no) (as of February
Description
2020)
Notified SEZs 50
SEZs with formal approvals 53
SEZs with in-principle approvals 3
TIDCO, State Industries Promotion Corporation of Tamil Nadu (SIPCOT), Tamil Nadu Industrial Investment Corporation Ltd. (TIIC) and Tamil
Nadu Small Industries Development Corporation Ltd (TANSIDCO) are jointly developing industrial infrastructure in the state.
Tamil Nadu Industrial Guidance and Export Promotion Bureau has been set up with the objective of attracting major investment proposals into
Tamil Nadu.
As of February 2020, the state had 54 formally approved SEZs, 50 notified SEZs and four with in-principle approval SEZs and has total 40
exporting SEZs.
In May 2017, an MoU was signed between the Tamil Nadu National Industrial Development Corporation Ltd. (TIDCO) and the National Highways
Authority of India for the development of a multimodal logistics park in the Ponneri Industrial Node area near Kamarajar Port.
27 TAMIL NADU For updated information, please visit www.ibef.orgINDUSTRIAL INFRASTRUCTURE… (2/4)
Infrastructure Description
• The State Industries Promotion Corporation of Tamil Nadu Limited (SIPCOT) Export Promotion
Industrial Park (EPIP) is spread over 224 acres at Gummidipoondi in the Thiruvallur district.
• An industrial park has been set up at Irungattukottai for the automotive, electronics, food processing,
general engineering & other non-polluting industries.
• The hi-tech SEZs in the Sriperumbudur Industrial Park & Oragadam Industrial Growth Centre (both in
Industrial parks Kanchipuram district), are spread over 570.92 acres and 347.66 acres, respectively. These house
manufacturing units for electronics, telecom hardware & support services.
• A new industrial park spread across 1,127 acres for the development of an industrial complex at
Thervoy Kandigai village in Tamil Nadu has been planned. Land development work has started for the
same. SIPCOT has taken possession of 125 acres of land in Thiruvallur district for creation of a new
complex.
• Established in 1984 to promote FDI & one of the 7 export promotion zones (EPZs) set up by the
Madras Export Processing Zone
Government of India, MEPZ is a multi-product export zone with 117 functional units & another 27 in the
(MEPZ)
process of being set up. As of July 2015, the project is in construction stage.
• SIPCOT’s SEZs comprise a leather SEZ in Vellore, a footwear SEZ in Kanchipuram, an engineering
SIPCOT’s SEZs products SEZ in Erode, an automotive SEZ in Thiruvannamalai & a transport engineering goods SEZ in
Tirunelveli, granite SEZ in Bargur & hi-tech SEZs in Kanchipuram.
28 TAMIL NADU For updated information, please visit www.ibef.orgINDUSTRIAL INFRASTRUCTURE… (3/4)
Infrastructure Description
• Tamil Nadu Industrial Development Corporation (TIDCO) has been engaged in setting up of industries,
infrastructure projects & SEZs. Some of the projects completed through joint ventures are Tanflora
Infrastructure Park, Tamil Nadu Road Development Company (TNRDC), Titan Industries Ltd., Tamil
Nadu Petroproducts, TIDEL Park, Mahindra World City, Ascendas IT Park, etc.
TIDCO’s SEZs • TIDCO and Rankindo Developers Private Ltd. have jointly developed an integrated township with IT
SEZ in Coimbatore.
• An IT and ITeS SEZ-TIDEL – III, with an international convention centre, is set up on 25 acres of land on
the IT Expressway at Taramani in Chennai. MRTS runs near the project site.
• Two apparel parks have been set up, one at Tirupur & the other at Irungattukottai near Chennai, with a
Apparel Parks project cost of US$ 133 million, including Government of India’s assistance of US$ 6.5 million. Both
parks are functioning.
st
• Palladam Hi-Tech Weaving Park is the 1 integrated textile park in India. It is located near to
Hi-tech Weaving Parks
Coimbatore and recognised as one of the emerging weaving hubs.
29 TAMIL NADU For updated information, please visit www.ibef.orgINDUSTRIAL INFRASTRUCTURE… (4/4)
Infrastructure Description
• Tamil Nadu Industrial Development Corporation Ltd. (TIDCO) & Indian Oil Corporation Ltd. through a joint venture,
would set up a Liquefied Natural Gas (LNG) import terminal near Ennore Port at Kattupalli village in Thiruvallur.
The LNG terminal is anticipated to get operationalized by 2018.
LNG Import Terminal
1
• The project’s total investment is estimated at US$ 759.4 million & it aims to meet the state’s rising demand for
energy & create a firm source for natural gas in the long term.
• GAIL and TIDCO are jointly setting up a 500 MW LNG-based power project in the state.
• TIDCO and M/s GVK Group of Hyderabad are jointly developing a multi-product SEZ in Perambalur; 2,880 acres of
Perambalur SEZ land has been procured. The Ministry of Commerce & Industries, Government of India, has formally approved the
project.
• TIDCO has proposed the development of solar power parks for setting up 1,000-MW solar power projects in
association with public and private organisations.
Solar Power Park Project • In the first phase, TIDCO and M/s Raasi Green Earth Energy Private Limited, Bangalore, would jointly develop a
solar park project of 100-MW capacity on a 500-acre dry land in Paramakudi, Ramanathapuram.
30 TAMIL NADU For updated information, please visit www.ibef.orgTAMIL NADU
KEY SECTORS
Agriculture and Allied Industries
Textiles
IT & ITeS
Tourism
31 TAMIL NADU For updated information, please visit www.ibef.orgKEY SECTOR – AGRICULTURAL AND ALLIED
INDUSTRIES…..(1/2)
Tamil Nadu is one of the leading producers of bananas, flowers,
tapioca, mango, coconut, groundnut, coffee, tea & sugarcane. Annual production in 2018-19^
Crop
(‘000 tonnes)
Tamil Nadu is the second largest producer of poultry and dairy
products in India and the third largest producer of tea and coffee in
Fruits 5,767.95
the country.
Vegetables 6,082.54
The state is among the leading producers of horticultural crops and
fruits in the country. Coconut* 4,247.12
With the aim of creating a conducive environment for the healthy Flowers 521.78
growth of the food processing industry, an exclusive Food
Aromatic and Medicinal 232.73
Processing Policy will be unveiled in 2018-2019.
Cotton** 600
A sum of Rs 1,229.85 crore (US$ 197.75 million) has been provided Source: Ministry of Agriculture
in the Budget Estimates 2020-21 for Fisheries Sector. Spices 178.33
Plantation crops 3,743.50
Honey 2.10
Note: * - Includes pepper, ** - ’000’ bales of 170 kgs each, E- Estimated, ^- 3rd Adv.Est.
Source: 2nd Advance Estimates, Department of Agriculture Cooperation & Farmers Welfare
32 TAMIL NADU For updated information, please visit www.ibef.orgKEY SECTOR – AGRICULTURAL AND ALLIED
INDUSTRIES…..(2/2)
Key players
Coca Cola Ltd Hindustan Coca-Cola Beverages Pvt Ltd, Nemam, Chennai, was established in 1997.
The manufacturing unit is spread over an area of 49 acres and has a capacity of producing 600 Bottles Per Minute
(BPM) of aerated soft drinks and 225 BPM of juice drinks. In 2014, India has become the 6th largest market for the
company by volumes, overtaking Germany.
Nestle Nestle is a company headquartered in Vevey, Switzerland as a Swiss multinational nutritional, snack food, and
health-related consumer goods company. It is the leading food company in the world in terms of revenues.
The second plant of Nestle was established in Choladi, India in 1967. It is renowned as India's 'Most Respected
Companies' and one of the 'Top Wealth Creators of India‘.
HUL
Hindustan Unilever Limited (HUL) is India's principal fast moving consumer goods (FMCG) company.
HUL employs more than 16,000 people nationwide.
Mondelez India Foods Ltd is part of Mondelēz International, Inc. It operates in five categories – chocolate
Mondelez India Foods
confectionery, beverages, biscuits, gum and candy.
Mondelez's key brands in India include Cadbury Dairy Milk, Bournvita, 5 Star, Perk, Bournville, Celebrations,
Gems, Halls, Éclairs, Bubbaloo, Tang and Oreo.
33 TAMIL NADU For updated information, please visit www.ibef.orgKEY SECTOR – TEXTILES … (1/2)
Exports from Tamil Nadu (US$ billion) Raw Silk Production in Tamil Nadu (in MT)
3.50 1.2
3.00
1.13
3.25
1 2,000
3.22
3.13
2,072
1.00
0.99
1,984
2.50
1,914
0.8
0.90
2.48
2.46
2.00 1,500
0.6
1,548
1.88
1.50
0.61
0.57
0.4 1,000
1.00
0.50 0.2
0.00 0 500
2014-15
2015-16
2016-17
2017-18
2018-19
2019-20^
0
2016-17
2017-18
2018-19(P)
2019-20*
RMG cotton (including accessories) Cotton fabrics, madeups etc
Tamil Nadu is known as the “Yarn Bowl” of the country. Tamil Nadu is the largest producer of cotton yarn, accounting for 41 per cent of India’s
production. Coimbatore and Tirupur are the major textile centres in Tamil Nadu. Tirupur is known as the ‘Knitting City’, while Coimbatore is called
the ‘Manchester of South India’.
Allocation of US$ 175.17 million for Handlooms and Textiles sectors and US$ 30.21 million for Handicrafts and Khadi sectors have been provided
in the Budget Estimates 2020-21.
During April-December 2019, raw silk production stood at 1,587 million tonnes (MT).
In 2019, Chief Minister launched the Tamil Nadu New Integrated Textile Policy, 2019.
Note: P - Provisional , MT – million tonnes, RMG – Readymade garments, ^- Till December 2019
Source: Tamil Nadu Policy Note on Industries, State Portal, Ministry of Textiles, Government of India, State Budget 2019-20, Department for Promotion of Industry and Internal Trade
34 TAMIL NADU For updated information, please visit www.ibef.orgKEY SECTOR – TEXTILES … (2/2)
Key players
Coats is the world’s largest supplier of industrial sewing thread and crafts products. It is the world’s second-largest
Coats India Ltd and fastest growing manufacturer of top quality zip fasteners. The company has operations in over 70 countries.
Industrial product manufacturing started in Madurai in 1944, and the weaving unit was started in Ambasamudram
in 1961. Recently the company has announced a strategic alliance with a UK based company, GSD in order to
collaborate on offering their respective management solutions to maximise productivity and drive down costs.
Primus Fabrics
Founded in 1950,it manufactures and exports bed sheets, duvets and home textiles and is based in Tiruchengode.
The total capacity is 50,000 spindles plus 1,120 rotors.
Lakshmi Mills
Established in 1910 at Coimbatore. Lakshmi Mills. It has two units to manufacture 100 per cent cotton yarns,
blended yarns and yarns produced from special fibres.
Products manufactured include yarns, fabrics and garments.
35 TAMIL NADU For updated information, please visit www.ibef.orgKEY SECTOR – IT AND ITeS … (1/2)
Tamil Nadu has emerged as a key destination for IT investments. IT & ITeS exports from Tamil Nadu (US$ billion)
The state has 22 approved IT Parks. The TIDEL Park in Chennai is
spread over 1.28 million sq ft. It is the largest IT facility in India, 20.0
19.9
promoted by TIDCO and ELCOT.
18.0
18.2
Electronics Corporation of Tamil Nadu Limited (ELCOT) has
established eight Information Technology Special Economic Zones 16.0
15.6
(ELCOSEZs) in Chennai and seven in Tier-II locations: Coimbatore,
14.0
Madurai (2), Trichy, Salem, Tirunelveli and Hosur.
14.1
The state had 18 operational SEZs for IT/ITeS as of February 2020. 12.0
IT & ITeS exports from Tamil Nadu have increased to Rs 1.39 lakh
10.0
crore (US$ 19.9 billion) in 2018-19, at a growth rate of 10 per cent
year-on-year. 8.0
The state Government is planning to make Tamil Nadu a global
6.0
SaaS hub. It is planning to attract Rs 15,000 crore (US$ 2.14 billion)*
in the IT and ITeS sector in the second Global Investors Meet (GIM) 4.0
to be held in January 2019.
2.0
0.0
2015-16
2016-17
2017-18
2018-19
Note: SaaS – Software as a Service
Source: Tamil Nadu Policy Note on Information Technology, 2013-14, News articles
36 TAMIL NADU For updated information, please visit www.ibef.orgKEY SECTOR – IT AND ITeS … (2/2)
Key players
Tech Mahindra
In 2013, Mahindra Satyam was merged into Tech Mahindra. Globally, the company provides software solutions
and operates in 90 countries with around 33 offices.
Tata Consultancy
Services (TCS) A company of the Tata group of India, TCS is a well-recognised global service provider for a wide range of IT
solutions, including consulting, BPO, engineering services and IT infrastructure. The company has offices in 46
countries, including around 80 locations in India; it has offices at Chennai and Coimbatore.
Infosys Technologies Infosys was started in 1981; it is a leader in IT and consulting, with a global footprint of 73 offices and 94
development centres in India, US, China, Australia, Japan, Middle East, UK, Germany, France, Switzerland,
Netherlands, Poland, Canada and many other countries. The company has two offices in Chennai.
HCL Technologies
Incorporated in 1976, HCL is a leading global technology and IT enterprise with operations across 31 countries. It
has delivery facilities in the US, the UK, Finland, Poland, Puerto Rico, Brazil, China, Malaysia, Singapore and
India.
37 TAMIL NADU For updated information, please visit www.ibef.orgKEY SECTOR – TOURISM … (1/2)
Tamil Nadu is a highly preferred tourist destination by both domestic Visakhapatnam
Tourist arrivalsport
in Tamil
trafficNadu
(million
(millions)
tonnes)
and foreign tourists.
Tamil Nadu boasts of historical monuments, forts, wildlife and bird
sanctuaries, temple towns, numerous places of worship, hill resorts, 400 CAGR 5.04%
rich heritage and culture, waterfalls, beaches, breath-taking valleys,
mangrove forests, backwaters, music and dance festivals. Chennai 390
391.98
and Coimbatore are becoming popular for Meetings, Incentives,
Conferences and Exhibitions (MICE) tourism. 380
The state is one of the leading medical tourism & wellness tourism
destinations in India. The state is focusing on Clean and Green 370
Destination Campaign in order to attract more and more tourists.
Tamil Nadu’s tourism industry increased in terms of tourist arrivals to 360
reach 385.90 million in 2018, at a CAGR of 5.04 per cent between
2014 and 2018. 350
349.92
348.5
It ranked first in terms of domestic tourist arrivals and second in
terms of foreign tourist arrival in 2017(P). 340
338.2
Asian Development Bank assisted Tourism Development Project is
330
currently under implementation and a sum of Rs 90.85 crore (US$
12.89 million) has been provided in the Budget Estimates 2020-21.
320
310
2018P
2015
2016
2017
Note: News articles, P – Provisional
Source: Tamil Nadu State Portal, Ministry of Tourism
38 TAMIL NADU For updated information, please visit www.ibef.orgKEY SECTOR – TOURISM … (2/2)
Major attractions
Tamil Nadu is one of the leading destinations for medical tourism.
Well-equipped corporate hospitals, skilled medical professionals and reasonable costs of treatment are the major
advantages offered by Tamil Nadu in this area.
Medical Tourism
The state plans to set up two medi-cities in Perundurai and Madurai, catering to a range of medical services,
research centres, treatment facilities, medical education and training, facilities for stay and support facilities like
insurance services, etc. Area for the development of medi cities in Perundurai and Maduraiwill will be 358 acres
and 500 acres respectively. The project is part of Tamil Nadu vision 2023.
Tamil Nadu has various hill stations, wild life sanctuaries, forests, bird sanctuaries, national parks and waterfalls.
Eco Tourism Various packages have been developed to promote eco-tourism in the state on a sustainable basis without
disturbing the environment and wildlife.
Trekking programmes are conducted at identified trekking routes in Yercaud, Kodaikanal and Elagiri and Nilgiris.
Paragliding programme is conducted at Elagiri in the summers.
Adventure Tourism The Tourism Department has developed water sports such as cruising through speed boats, water-skiing, yachting
and wind-surfing; along the East Coast at Tharangambadi, Kovalam, Poompuhar and Mudhaliarkuppam. In
February 2016, the ‘Manapad Classic 2016’, a three-day national level sea sports event, was held at Manapad
coast, Tamil Nadu.
Source: Tamil Nadu Policy Note on Tourism 2012-13, Tamil Nadu Vision 2023
39 TAMIL NADU For updated information, please visit www.ibef.orgTAMIL NADU
KEY PROCEDURES
AND POLICIES
40 TAMIL NADU For updated information, please visit www.ibef.orgTWO-TIER SINGLE-WINDOW MECHANISM (SWM)
Single-window clearance mechanism has been established to avoid SWM structure in Tamil Nadu
procedural delays and accord all pre-project clearances at the state
Government level: Under the Chairmanship of Nodal agency
• Project Approvals Authority (PAA) under the Chief Secretary to
Government to monitor and hasten projects with investments less
State-level Chief
than US$ 20 million.
Industrial Minister of
Tamil Nadu
• State-level Investment Promotion Board (SIPB) under the Promotion Board Tamil Nadu
Industrial
chairmanship of Chief Minister of Tamil Nadu to monitor and Guidance &
expedite all mega projects exceeding US$ 20 million. Export
Chief Promotion
Common Application Form (CAF): The Government of Tamil Nadu Bureau
Project Approvals Secretary to
has introduced a CAF to be filled and filed by investors with the Government of (Guidance
Authority
Documentation and Clearance Centre (DCC) in the Guidance Tamil Nadu Bureau)
Bureau.
Efforts of the state Government were able to attract additional
investments of US$ 1.56 billion, to be done in 42 projects through
single window facilitation.
In order to develop business opportunities, during 2015-16 an
Industry Investment Portal as a single window mechanism was
launched. This would facilitate the investors in obtaining all the
required permissions and licenses from various departments
Note: Conversion rate 60.28
Source: Directorate of Industries and Commerce, Government of Tamil Nadu Conversion rate 60.28
41 TAMIL NADU For updated information, please visit www.ibef.orgKEY INVESTMENT PROMOTION OFFICES … (1/2)
Project cost SWM fees (US$)
Projects with investment between US$ 1.66 million-US$ 8.30 million 4,976.78
Projects with investment between US$ 8.30 million-US$ 16.59 million 8,294.63
Projects with investment between US$ 16.59 million-US$ 49.77 million 16,589.25
Projects with investment above US$ 165.89 million 24,883.88
Agency Description
Tamil Nadu Industrial Development
• Established in 1965 as a Government of Tamil Nadu enterprise to promote large and medium-scale
Corporation Limited industries in Tamil Nadu. It focusses on promoting infrastructure projects, industrial parks and SEZs.
(TIDCO)
State Industries Promotion
• It focusses on developing, marketing and maintaining industrial complexes/parks and growth centres, and
Corporation of Tamil Nadu implementing infrastructure development schemes.
(SIPCOT)
42 TAMIL NADU For updated information, please visit www.ibef.orgKEY INVESTMENT PROMOTION OFFICES … (2/2)
Agency Description
Tamil Nadu Industrial Investment • TIIC Provides financial assistance in the form of term loans for purchase of land, plant and machinery; for
Corporation Limited the construction of buildings for setting up new industrial units; and for the expansion, modernisation and
(TIIC) diversification of existing units. It also extends term loans to the service sector in the state.
• TNUDF provides project advisory, financial advisory and consultancy services to various urban local
Tamil Nadu Urban Development
bodies (ULBs) through its fund manager, Tamil Nadu Urban Infrastructure Financial Services Limited
Fund (TNUDF) (TNUIFSL).
Tamil Nadu Urban Finance and
Infrastructure Development • It extends financial assistance to urban infrastructure schemes in Tamil Nadu.
Corporation (TUFIDCO)
• It is the nodal agency for Information and Communication Technology (ICT) projects for the Government of
Electronics Corporation of Tamil
Tamil Nadu. It focusses on three broad areas: IT promotion for the state of Tamil Nadu, IT procurement for
Nadu Limited (ELCOT) the Government of Tamil Nadu and e-governance excellence within Tamil Nadu.
Tamil Nadu Small Industries
• TANSIDCO, an undertaking of the Government of Tamil Nadu, plays a catalytic role in the promotion and
Development Corporation development of small-scale industries and speedy setting up of industries throughout Tamil Nadu.
(TANSIDCO)
43 TAMIL NADU For updated information, please visit www.ibef.orgCONTACT LIST … (1/2)
Agency Contact Information
19-A, Rukmini Lakshmipathy Road,
Egmore, Chennai-600 008
Tamil Nadu Industrial Development Corporation Limited (TIDCO) Phone: 91-44-2855 4421
E-mail: cmd.tidco@nic.in
Website: www.tidco.com
19-A, Rukmini Lakshmipathy Road,
Egmore, Chennai-600 008
Phone: 91-44-2855 4787
State Industries Promotion Corporation of Tamil Nadu (SIPCOT) Fax: 91-44-2851 3978
E-mail: sipcot@md3.vsnl.net.in
Website: www.sipcot.com
19-A, Rukmani Lakshmipathy Salai,
Egmore, Chennai - 600 008. INDIA
Tamil Nadu Industrial Guidance & Export Promotion Bureau Tel : 91-44-28588364
Fax : 91-44-28588364
Website: www.tidco.com
New no: 692, Anna Salai, Nandanam,
Chennai-600 035
Phone: 91-44-2433 1203
Tamil Nadu Industrial Investment Corporation Limited (TIIC) Fax: 91-44-2434 7209
E-mail: ho@tiic.in
Website: www.tiic.org
44 TAMIL NADU For updated information, please visit www.ibef.orgCONTACT LIST … (2/2)
Agency Contact Information
19,T.P Scheme Road,
Raja Annamalai Puram,
Chennai - 600028.
Tamil Nadu Urban Infrastructure Financial Services Ltd Phone: 91-44-2815 3104, 2815 3105
Fax: 91-44-2815 3106
E-mail: cmd@tnuifsl.com
Website: www.tnuisfl.com
692, M.H.U. Complex, II Floor, Anna Salai,
Nandanam, Chennai-600 035
Electronics Corporation of Tamil Nadu Limited Phone: 91-44-6551 2330
(ELCOT) Fax: 91-44-2433 0612
E-mail: secyit@tn.nic.in
Website: www.elcot.in
Thiru Vi Ka Industrial Estate,
Chennai - 600 032
Phone: 91-44-2250 1461, 2250 1422, 2250 0185, 2250 0506, 2250 1210
Tamil Nadu Small Industries Development Corporation (TANSIDCO) Fax: 91-44-2250 0792
E-mail: sidco@vsnl.com
Website: www.sidco.tn.nic.in
45 TAMIL NADU For updated information, please visit www.ibef.orgKEY APPROVALS REQUIRED
Estimated time taken
Approvals and clearances required Departments to be consulted
(days)
Incorporation of the company Registrar of Companies
Registration, Industrial Entrepreneurs
District Industry Centre
Memorandum (IEM), industrial licences
Tamil Nadu Department of Industries/State Industrial
Allotment of land
Development Corporation/Infrastructure Corporation
Single-window clearance
Tamil Nadu Department of Industries/Tamil Nadu Industrial guidance (state’s single-
Permission for land use Development Corporation, Department of Town and Country window clearance facility)
Planning clears investment proposals
in 30 days on an average.
Tamil Nadu Pollution Control Board (TNPCB) and Union
Site environmental approvals The single-window obtains
Ministry of Environment and Forests
all approvals necessary for
No-objection Certificate and Consent under Water the investment proposal
Tamil Nadu Pollution Control Board within the aforementioned
and Pollution Control Acts
time.
Approval of construction activity and building plan Department of Town and Country Planning (DTCP)
Sanction of power Tamil Nadu Electricity Board (TNEB)
Registration under States Sales Tax Act and
Sales Tax Department, Central and State Excise Departments
Central and State Excise Acts
46 TAMIL NADU For updated information, please visit www.ibef.orgCOST OF DOING BUSINESS IN TAMIL NADU
Cost parameter Cost estimate Source
Industrial land (per sq ft) US$ 5 to US$ 120 (Chennai) Industry sources
Five star hotel (per room per night) US$ 90 to US$ 250 Leading hotels in the state
Office space rent (per sq ft per month) US$ 0.7 to US$ 3.1 Industry sources
Residential space rent
US$ 300 to US$ 1,200 per month Industry sources
(2,000 sq ft house)
Commercial US 14.5 cents,
Power (per kWh) Industrial: US 11 cents DCH Databook October 2013
Domestic: US 3.8 cents
Ministry of Labour and Employment,
Labour (minimum wages per day) US$ 2.95 to US$ 8.8
Government of India
Tamil Nadu Water Supply and Drainage
Water (per 1,000 litres) Commercial and industrial: US 33 cents
Board
47 TAMIL NADU For updated information, please visit www.ibef.orgSTATE ACTS AND POLICIES … (1/2)
Objectives
Aerospace and Defence To create an end-to-end ecosystem for Aerospace sector development covering design, engineering and
Industrial Policy, 2019 manufacturing of aircraft for civil and defence sector. Read more
To achieve energy security.
Tamil Nadu Solar Energy
To reduce carbon emissions.
Policy 2019
To project Tamil Nadu as a solar hub. Read more
Information To address the investors especially IT and ITeS companies, MSMEs, and Start-ups
Communication
To provide incentives like capital subsidies, tax exemptions, administrative incentives, fiscal incentives
Technology (ICT) Policy
2018 To promote research and green IT industry
Read more
To develop infrastructure for the overall improvement of the economy of the state.
Highways and Minor
To augment the traffic capacity of state roads, widening works of all Intermediate Lane State Highways to Double
Ports Department Policy
Lane and all Single Lane Major District Roads to Intermediate Lane
Note-2017-18
To avoid traffic congestion Read more
To improve industries of high technology including aerospace, nanotechnology etc., in Tamil Nadu.
Tamil Nadu Industrial
Work for speedy industrialisation of districts in the southern part of Tamil Nadu.
Policy 2014
Read more
To attain comprehensive and maintainable industrial growth in Tamil Nadu
48 TAMIL NADU For updated information, please visit www.ibef.orgSTATE ACTS AND POLICIES … (2/2)
Objectives
To raise the exports of software from Tamil Nadu and provision of cable TV services at reasonable rates to all
Tamil Nadu Information Tamil Nadu households;
Technology Policy 2014-
To provide Tamil education through the web and take computing in Tamil to a higher level;
2015
Read more
To enhance the quality of life of citizens through information and communication technology.
To develop MSMEs in the state.
Micro, Small and Medium
Industries Policy 2014-15 To enhance joint ventures of private industries with new industrial estates such as SIDCO to encourage the export
of products of MSMEs in the state. Read more
Tamil Nadu Disaster To develop a new culture of prevention, preparedness and quick response to disasters.
Management Policy To reduce the vulnerability of the community through proper risk assessment. Read more
Tamil Nadu Thorough record of bio-resources to be engaged in the state.
Biotechnology Policy
2014 To invite R&D institutions and manufacturing firms. Read more
Tamil Nadu Automobile To promote competitiveness and cut costs for the industry. To address the specific organisational gaps and
and Auto Components scarcities.
Policy 2014 To develop the talent pool to meet the skilled manpower requirements of this industry Read more
Enhanced Rural BPO Attract willing entrepreneurs to set up business centres in rural areas.
Policy 2012 Provide conducive environment for the BPO industry to thrive in rural areas. Read more
To minimise e-waste generation, utilise e-waste for beneficial purposes through environmentally sound recycling
E-Waste Policy 2010
and ensure environmentally sound disposal of residual waste. Read more
49 TAMIL NADU For updated information, please visit www.ibef.orgTAMIL NADU
ANNEXURE
50 TAMIL NADU For updated information, please visit www.ibef.orgANNEXURE…(1/2) - SOURCES
Data Sources
GSDP (state) Ministry of Statistics & Programme Implementation 2018-19
Per capita GSDP figures Ministry of Statistics & Programme Implementation 2018-19
GSDP (India) Ministry of Statistics & Programme Implementation 2018-19
Installed power capacity (MW) Central Electricity Authority
Wireless subscribers (No) Telecom Regulatory Authority of India
Internet subscribers (Mn) Telecom Regulatory Authority of India
National highway length (km) NHAI, Roads and Building Department-Government of India
Major and minor ports (No) India Ports Association
Airports (No) Airports Authority of India
Literacy rate (%) Census 2011
Birth rate (per 1,000 population) SRS Bulletin
Cumulative FDI equity inflows (US$ billion) Department for Promotion of Industry and Internal Trade
Operational PPP projects (No) DEA, Ministry of Finance, Government of India
Exporting SEZs (No) Ministry of Commerce & Industry, Department of Commerce
51 TAMIL NADU For updated information, please visit www.ibef.orgANNEXURE…(2/2) - EXCHANGE RATES
Exchange Rates (Fiscal Year) Exchange Rates (Calendar Year)
Year INR INR Equivalent of one US$ Year INR Equivalent of one US$
2004–05 44.95 2005 44.11
2005–06 44.28 2006 45.33
2006–07 45.29 2007 41.29
2007–08 40.24 2008 43.42
2008–09 45.91
2009 48.35
2009–10 47.42
2010 45.74
2010–11 45.58
2011 46.67
2011–12 47.95
2012 53.49
2012–13 54.45
2013 58.63
2013–14 60.50
2014 61.03
2014-15 61.15
2015 64.15
2015-16 65.46
2016-17 67.09 2016 67.21
2017-18 64.45 2017 65.12
2018-19 69.89 2018 68.36
2019-20 70.49 2019 69.89
Source: Reserve Bank of India, Average for the year
52 TAMIL NADU For updated information, please visit www.ibef.orgDISCLAIMER
India Brand Equity Foundation (IBEF) engaged TechSci Research to prepare this presentation and the same has been prepared by TechSci
Research in consultation with IBEF.
All rights reserved. All copyright in this presentation and related works is solely and exclusively owned by IBEF. The same may not be reproduced,
wholly or in part in any material form (including photocopying or storing it in any medium by electronic means and whether or not transiently or
incidentally to some other use of this presentation), modified or in any manner communicated to any third party except with the written approval of
IBEF.
This presentation is for information purposes only. While due care has been taken during the compilation of this presentation to ensure that the
information is accurate to the best of TechSci Research and IBEF’s knowledge and belief, the content is not to be construed in any manner
whatsoever as a substitute for professional advice.
TechSci Research and IBEF neither recommend nor endorse any specific products or services that may have been mentioned in this presentation
and nor do they assume any liability or responsibility for the outcome of decisions taken as a result of any reliance placed on this presentation.
Neither TechSci Research nor IBEF shall be liable for any direct or indirect damages that may arise due to any act or omission on the part of the user
due to any reliance placed or guidance taken from any portion of this presentation.
53 TAMIL NADU For updated information, please visit www.ibef.orgYou can also read