Intercomparison between the aerosol optical properties retrieved by different inversion methods from SKYNET sky radiometer observations over ...
←
→
Page content transcription
If your browser does not render page correctly, please read the page content below
Atmos. Meas. Tech., 13, 1195–1212, 2020
https://doi.org/10.5194/amt-13-1195-2020
© Author(s) 2020. This work is distributed under
the Creative Commons Attribution 4.0 License.

Intercomparison between the aerosol optical properties retrieved by
different inversion methods from SKYNET sky radiometer
observations over Qionghai and Yucheng in China
Zhe Jiang1 , Minzheng Duan1 , Huizheng Che2 , Wenxing Zhang1 , Teruyuki Nakajima3 , Makiko Hashimoto3 ,
Bin Chen4 , and Akihiro Yamazaki5
1 Key  Laboratory of Middle Atmosphere and Global Environment Observation, Institute of Atmospheric Physics,
Chinese Academy of Sciences, Beijing 100029, China
2 State Key Laboratory of Severe Weather (LASW) and Laboratory of Atmospheric Chemistry of CMA, Chinese Academy of

Meteorological Sciences (CAMS), Beijing 100081, China
3 Earth Observation Research Center (EORC), Japan Aerospace Exploration Agency (JAXA),

Tsukuba, Ibaraki 305-8505, Japan
4 State Key Laboratory of Numerical Modeling for Atmospheric Sciences and Geophysical Fluid Dynamics,

Institute of Atmospheric Physics, Chinese Academy of Sciences, Beijing 100029, China
5 Japan Meteorological Agency, Meteorological Research Institute, 1-1 Nagamine, Tsukuba, Ibaraki 305-0052, Japan

Correspondence: Huizheng Che (chehz@cma.gov.cn) and Minzheng Duan (dmz@mail.iap.ac.cn)

Received: 31 January 2019 – Discussion started: 6 March 2019
Revised: 10 January 2020 – Accepted: 30 January 2020 – Published: 11 March 2020

Abstract. This study analyzed the aerosol optical proper-       1 %, 2 %, 3 %, and 4 %, the averaged changes in SSAs did not
ties derived by SKYRAD.pack versions 5.0 and 4.2 (referred      exceed 0.8 % both by V4.2 and V5.0. The SSA differences at
to as V5.0 and V4.2) using the radiometer measurements          500 nm between the two versions decreased, while aerosol
over Qionghai and Yucheng in China, two new sites of the        optical depths (AODs) increased over both sites. The sea-
sky radiometer network (SKYNET). As V5.0 uses an a pri-         sonal variability of the aerosol properties over Qionghai and
ori size distribution function (SDF) of a bimodal log-normal    Yucheng was investigated based on SKYRAD.pack V5.0.
function, the volume size distribution retrieved by V5.0 pre-   The seasonal averaged AOD over Qionghai had higher val-
sented bimodal patterns with a 0.1–0.2 µm fine particle mode    ues in spring, winter, and autumn and lower values in sum-
and a 3.0–6.0 µm coarse particle mode both over Qionghai        mer. The AOD averages were commonly higher in summer
and Yucheng. The differences in the volume size distribu-       and spring than in winter and autumn in Yucheng. The lowest
tions between the two versions were very large for the coarse   seasonal averaged SSAs were both observed in winter at the
mode with a radius of over 5 µm. The single scattering albe-    two sites. The fraction of the fine aerosol particles was much
dos (SSAs) by V5.0 correlated with SSAs by V4.2 with            smaller in summer than in other seasons over Qionghai; the
R = 0.88, 0.87, 0.90, 0.88, and 0.92 at wavelengths of 400,     volume fraction of the coarse-mode particle in Yucheng had
500, 670, 870, and 1020 nm over Qionghai, respectively. The     much larger values compared to the fine-mode particle in
correlation coefficients were around 0.95, 0.95, 0.96, 0.94,    all seasons. The validation results provide valuable refer-
and 0.91 at the five channels in Yucheng. An error of ±5 %      ences for continued improvement of the retrieval algorithms
for the solid view angle (SVA) introduced about ±2 % dif-       of SKYNET and other aerosol observational networks.
ferences in retrieved SSA values both by V4.2 and V5.0. An
error of ±50 % for ground surface albedo (Ag ) caused about
1 % averaged differences in retrieved SSA values by the two
versions. With the atmospheric pressure (PRS) increased by

Published by Copernicus Publications on behalf of the European Geosciences Union.
1196                                                  Z. Jiang et al.: Intercomparison between the aerosol optical properties

1   Introduction                                                   ences for continued improvement of the retrieval algorithms
                                                                   of SKYNET and other aerosol observational networks.
Aerosols are well known to have significant impacts on cli-
mate change and global hydrologic cycle by absorbing and
scattering solar radiation (Hensen et al., 1997; Sun et al.,       2     Site description, instrumentation, and inversion
2017) and participating in cloud processes (Ackerman et al.,             method
2000; Ramanathan et al., 2001; Kaufman et al., 2005; Li et
al., 2011; Bi et al., 2014; Zhao et al., 2018a). Aerosols also     2.1    Instrumentation
adversely influence human health and visibility (Samet et al.,
2000; Pope et al., 2002; Yang et al., 2015; Wang et al., 2017).    The sky radiometer (model POM-02, PREDE Co. Ltd.) was
Aerosol-related environmental problems have drawn a great          deployed at Qionghai and Yucheng starting in February 2013
deal of attention (Cai et al., 2016).                              and August 2012, respectively. The PREDE-POM02 model
   Using a Sun–sky radiometer to measure both direct solar         was equipped with an indium gallium arsenide (InGaAs) de-
beam and angular sky radiance is the most common method            tector to measure the direct solar irradiance and the sky dif-
for a reliable and continuous estimation of detailed aerosol       fuse radiance at 11 wavelengths, namely 315, 340, 380, 400,
properties over megacities around the world. Several aerosol       500, 675, 870, 940, 1020, 1627, and 2200 nm. The data from
ground-based observational networks have been established          five channels at 400, 500, 675, 870, and 1020 nm were used
to understand the aerosol optical properties, validate the in-     here to retrieve the aerosol optical properties over Qionghai
version products of satellite remote sensing, and indirectly       and Yucheng. The full angle field of view is 1.0◦ , while the
evaluate their effect on climate (Uchiyama et al., 2005; Taka-     minimum scattering angle of measurement is approximately
mura and Nakajima, 2004; Nakajima et al., 2007). The sky           3◦ . The sky radiance is measured at 24 predefined scatter-
radiometer network (SKYNET), the focus of this study, is           ing angles and at regular time intervals. The sky radiome-
a ground-based research network of using sky radiometers           ter operates only during daytime and collects data regardless
(PREDE Co., Ltd., Tokyo, Japan) with observation sites prin-       of the sky conditions. Its dynamic range is 107 . The typi-
cipally located in Asia and Europe (Che et al., 2014).             cal measurement interval of the sky radiance is 10 min. The
   The direct solar and angular sky radiance data measured         improved Langley (IL) plot method is used in this study to
by the sky radiometers are processed to obtain the aerosol op-     determine the temporal and spectral calibration constants for
tical properties, such as aerosol optical depth (AOD), single      direct intensity (F0 ) with accuracy of about 1.5 %–2.5 %, de-
scattering albedo (SSA), complex refractive index, and vol-        pending on the wavelength (Nakajima et al., 1996; Campan-
ume size distribution function (SDF) using SKYRAD.pack,            elli et al., 2004). The calibration by IL plot method was made
which is the official retrieval algorithm of SKYNET (Naka-         daily so that the variation of F0 due to instrumental drift
jima et al., 1996) with several different versions. SKYNET         could be quickly spotted and appropriate corrections could
currently uses the SKYRAD.pack algorithm version 4.2               be applied exactly from the period in which the deviation oc-
(Takamura and Nakajima, 2004). The aerosol retrievals de-          curred (Campanelli et al., 2004). The calibration method for
rived from the SKYRAD.pack version 4.2 algorithm have              the sky radiance measurements is different from that used for
been used to investigate the regional and seasonal charac-         the direct solar irradiance measurements. The solar disk scan
teristics of aerosols for climate and environmental studies        method has been routinely used in the SKYNET measure-
and to validate satellite remote sensing results (e.g., Kim et     ment for the solid view angle (SVA) of the sky radiometer by
al., 2004; Che et al., 2008, 2018; Campanelli et al., 2010;        scanning a circumsolar domain (CSD) of ±1◦ around the Sun
Estellés et al., 2012a; Wang et al., 2014). Recently, a new        with every 0.1◦ interval (Nakajima et al., 1996; Uchiyama et
SKYRAD.pack version (V5.0) was proposed to improve                 al., 2018).
SSA retrievals (Hashimoto et al., 2012). There are a few ap-
plications of SKYRAD V5.0; for example, it has been pre-           2.2    Site description
liminarily used to retrieve aerosol optical properties over Bei-
jing, China (Che et al., 2014).                                    The Qionghai site of SKYNET (19.23◦ N, 110.46◦ E;
   This study presents the aerosol optical properties over         24 m a.s.l.), which is located in the eastern part of the island
Qionghai and Yucheng derived from SKYNET sky radiome-              of Hainan, is mainly influenced by East Asian monsoons and
ter measurements by using SKYRAD.pack V5.0 and V4.2                typhoons. During summer, the dominant wind is from south
during February 2013 to December 2015. This work is de-            to southeast, and the summer monsoon from the South China
signed to achieve the following objectives: (1) investigate        Sea and western Pacific brings most of the annual rainfall to
the difference in the aerosol optical properties derived by        the island (Zhu et al., 2005), whereas the winter monsoon
SKYRAD.pack V5.0 and V4.2 over the two SKYNET sites;               from Inner Mongolia carries dry winds to the area (Zhu et
and (2) analyze the seasonal variability of aerosol optical        al., 2005; Peel et al., 2007; Yin et al., 2002). Annual average
properties over the two sites based on SKYRAD.pack V5.0.           rainfall in Qionghai is estimated to be about 1653.4 mm. The
The results presented in this study provide valuable refer-        highest temperature occurs in July with a monthly average of

Atmos. Meas. Tech., 13, 1195–1212, 2020                                              www.atmos-meas-tech.net/13/1195/2020/
Z. Jiang et al.: Intercomparison between the aerosol optical properties                                                   1197

                                                                non-linear iterative method. A particle non-sphericity model
                                                                is not included in V4.2 nor V5.0.
                                                                   The retrieved v(r) in each iteration step was used as an in-
                                                                put parameter for the radiative transfer model (Nakajima and
                                                                Tanaka, 1988) to simulate R(2), which was compared with
                                                                the measured R(2) to evaluate the root mean square differ-
                                                                ence ε(R). The maximum number of iterations and the tol-
                                                                erance parameter for the convergence of R were set to 20 %
                                                                and 0.1 %, respectively.
                                                                   The retrieval of v(r) from β(2) and τ data in
                                                                SKYRAD.pack V4.2 was conducted using a constrained lin-
                                                                ear method. The inversion method consisted of a linear ma-
                                                                trix formulation, in which the solution stability was con-
                                                                trolled by the requirement that it agrees with both the input
                                                                data and the imposed weighted constraints (Nakajima et al.,
                                                                1983).

Figure 1. The locations of the two SKYNET sites in the study.   f = Kx + ε,                                                 (1)
                                                                where f is the vector of the β(2) and τ data, and x is a state
                                                                vector containing the values of size distribution vi = v(ri )
28.6 ◦ C, while the lowest temperature occurs in January with   with ri equidistant on a logarithmic scale (i.e., ln(ri + 1 ) −
a monthly average of 19.1 ◦ C (Yin et al., 2002).               ln(ri ) = const). The components of vector ε were the error of
   The other measurement site in this study is located in       each datum, K = K(m(λ)), a matrix of the kernel coefficients
rural Yucheng (36.82◦ N, 116.57◦ E; 22 m a.s.l.), Shandong      calculated for the fixed values of the complex refractive index
Province, China, which is almost in the center of the North     (m(λ)).
China Plain. The selected site is in an open field surrounded      V4.2 used the iterative relaxation method of Nakajima et
by farmland. The region belongs to semi-humid and temper-       al. (1983, 1996) to remove the multiple scattering contribu-
ate monsoon climate zones, characterized by an annual mean      tion and derived an optimal solution using a statistical regu-
temperature of 21 ◦ C and annual precipitation of 610 mm        larization method (Turchin and Nozik, 1969) by minimizing
mainly distributed in summer months (Chen et al., 2012).        the following cost function as proposed by Phillips (1962)
Yucheng and the surrounding areas are famous for their agri-    and Twomey (1963):
culture (e.g., wheat and corn) and grazing land (e.g., don-
                                                                e2 = |(f − Kx)|2 + γ |Bx|2 ,                                (2)
keys and chickens). In addition, several factories producing
inorganic and organic fertilizers are located within a 20 to    where B is a smoothing matrix used to generate a priori in-
30 km radius of the site (Wen et al., 2015), and the appli-     formation that forces the solution x to be a smooth function
cation of fertilizers to farmland emits a great deal of NH3     of ln(r); and γ is a Lagrangian multiplier coefficient to mini-
(Zhao et al., 2012). Meanwhile, Yucheng is located down-        mize the first term of the right-hand side of Eq. (2). The solu-
wind of the Beijing–Tianjin–Hebei region; therefore, long-      tion of Eq. (1) provided a smooth retrieval of the size distri-
range transport of industrial pollution and biomass burning     bution v(r) corresponding to the minimum of e2 defined by
contributes significantly to the concentrations of pollutants   Eq. (2). In such an approach, the solutions of both v(r) and
in Yucheng (Lu et al., 2016).                                   e2 depended on the assumed value of the complex refractive
                                                                index m(λ). The complex refractive index m(λ) in each iter-
2.3   Inversion method                                          ation was also evaluated together with v(r), but the retrieved
                                                                m(λ) can only be chosen from the predefined set of values.
The aerosol optical properties (i.e., AOD, SSA, complex            The m(λ) values in SKYRAD.pack V5.0 were directly in-
refractive index, and volume SDF) were derived in this          cluded in the state vector x. Equation (1) becomes non-linear,
study by using SKYRAD.pack V4.2 and V5.0. Within the            and V5.0 solves it using the non-linear maximum likelihood
SKYRAD.pack code, the inversion schemes were used to de-        method defined by Rodgers (2000). This method was based
rive the single scattering term β(2) from the measurements      on the Bayesian theory:
of the normalized sky flux R(2) and retrieve the aerosol SDF    p(x|f ) = p(f |x)p(x)/p(f ),                                (3)
v(r) (as a function of particle radius, r) from data β(2) and
AOD τ . The inversion of β(2) was performed through a non-      where p is the probability density function defined as the
linear iterative method. Each step of the loop contained the    Gaussian distribution; x and f denote the state and measure-
procedure for retrieving v(r) using a constrained linear or a   ment vectors, respectively. Accordingly, x was chosen in the

www.atmos-meas-tech.net/13/1195/2020/                                             Atmos. Meas. Tech., 13, 1195–1212, 2020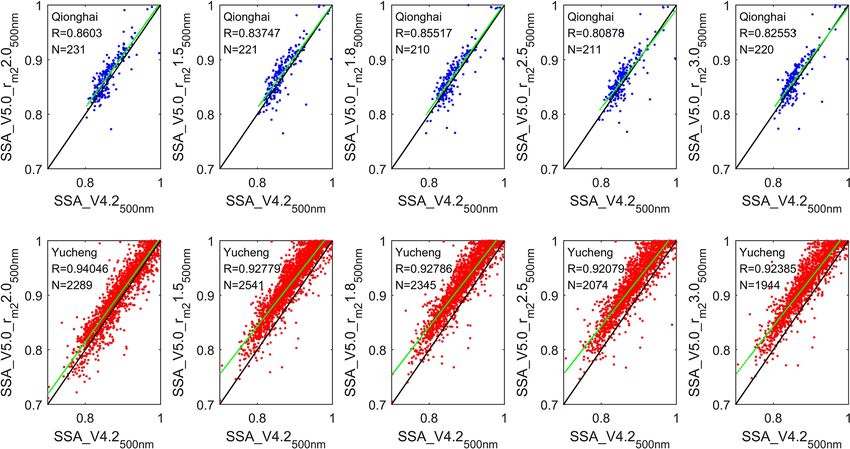
1198                                                    Z. Jiang et al.: Intercomparison between the aerosol optical properties

maximum likelihood method, such that the posterior prob-                V5.0 poses a condition regarding the magnitude of the
ability p(x|f ) becomes the maximum under the condition               coarse mode of the SDF:
that a priori information is already given. We obtained the
following equation in the tangential space to be solved by            Cv × v(2.4 µm) < max{v(7.7 µm), v(11.3 µm), v(16.5 µm)},     (7)
a Newtonian method by organizing this non-linear equation,
such that p(x|f ) = max:                                              where Cv is a threshold coefficient to be determined for opti-
                                                                      mum rejection of cirrus contamination; v(r) is vertically in-
x k+1 = x k + (UTk S−1      −1 −1 T −1
                    e Uk + Sa ) [Uk Se (f − f k )                     tegrated aerosol SDF as a function of particle radius, r. Based
                                                                      on data analysis at the Pune and Beijing sites (Hashimoto et
       − S−1
          a (x k − x a )],                                     (4)
                                                                      al., 2012), Cv is set to 2 in V5.0 to reject most cirrus con-
where x k is the solution at the kth iteration step; f k = f (x k )   tamination cases and retain dust cases. It would be useful to
is an observation modeled using x k ; x a is the a priori value of    re-evaluate the Cv value after more cirrus contamination data
x; Se is the measurement error covariance matrix; Sa denotes          and dust event data are collected.
the covariance matrix defined by a priori and state values,
Sa = (x − x a )(x − x a )T ; U is the Jacobian matrix, ∂f /∂x.
                                                                      3     Results and discussion
The retrieval algorithm used in V5.0 allowed a rigorous re-
trieval of both the aerosol size distribution and the spectral
                                                                      The results retrieved by SKYRAD.pack V4.2 were used to
complex refractive index.
                                                                      compare with the results retrieved by SKYRAD.pack V5.0.
   The non-linear inversion has a strong dependence on the
                                                                      The intercomparisons of the volume size distribution, sin-
estimation of the first-guess solution. V5.0 uses an a priori
                                                                      gle scattering albedo, and refractive index between V5.0 and
SDF of a bimodal log-normal function as follows:
                                                                      V4.2 were based on 1397 measurements in 355 d over Qiong-
                       "                      #                      hai and 5830 measurements in 473 d over Yucheng. Con-
                             1 ln r − ln rmn 2
         X2
v (r) =         C exp −                           ,            (5)    sidering a relatively low retrieval accuracy of SSA when
            n=1 n            2      lnSn                              AOD < 0.2 (Dubovik et al., 2000), only the measurements
                                                                      with AOD ≥ 0.2 were selected to be effective values in this
where rm1 = 0.1 µm, rm2 = 2.0 µm, S1 = 0.4, S2 = 0.8, C1 =
                                                                      study. Figure 2 showed the plots of AOD values at each wave-
1.0 × 10⁻¹² , and C2 = 1.0 × 10⁻¹² , following the reported
                                                                      length derived from the solar direct irradiance between the
climate values (Higurashi et al., 2000). For a priori estimates
                                                                      two versions. High correlation was found with a significant
of the refractive index, the real (mr ) and imaginary (mi ) parts
                                                                      coefficient larger than 0.995 at each band in both sites except
were set to 1.5 and 0.005, respectively.
                                                                      for 1020 nm over Qionghai. The high consistency between
   SKYRAD V5.0 developed a stricter data quality control
                                                                      V4.2 and V5.0 indicates that the inversion process in V5.0
method of observation data and cloud screening. The stan-
                                                                      did not bring about a large change in the retrieved direct so-
dard process of quality control in SKYNET applies a re-
                                                                      lar radiation (Hashimoto et al., 2012). The slight differences
trieval error between observations and calculated theoretical
                                                                      between AODs by V5.0 and V4.2 were mainly caused by the
values by using retrieval values, σobs :
                                                                      very small differences in calibration constant F0 . F0 values
                                                                      in V4.2 and V5.0 are both determined from sky radiance data
        v
        u                      !2
        u X            τλ i               XX                          by the improved Langley method. V5.0 adopts more rigorous
σobs = We i meas − 1 + Wp i
        t
                                                 j
                      τλi                                             data processing and cloud detection methods. The sky radi-
                                                                      ance measurements involved in F0 calculation in V4.2 are a
     [Rλi 2j /Rλmeas

                    i
                          2j − 1]2 ,                          (6)     little different from those in V5.0. In the inversion calcula-
                                                                      tions of both versions, AODs are used as indicative values in
where (τλmeas  and Rλmeas ) and (τλi and Rλi ) are measured and
           i          i                                               the first step of the loop but are updated at each iteration. The
retrieved observation vectors for the AOD and relative sky
                                                                      AOD data can be given different weights with respect to the
radiance; Ni , Nj , and Ntotal = Ni +Ni ×Nj indicate the num-
                                                                      normalized diffuse sky flux data, according to their reliability
ber of measured wavelengths, scattering angles, and their to-
                                                                      (Nakajima et al., 1996).
tal, respectively; We = WP = 1/Ntotal . In V4.2, the data are
rejected if the value of σobs is larger than 0.2, but the thresh-     3.1     Intercomparison of aerosol properties derived by
old is set to 0.07 in V5.0. There are some other differences                  SKYRAD V4.2 and V5.0
between V4.2 and V5.0 on the issue of quality control of ob-
servation data (Hashimoto et al., 2012).                              3.1.1    Intercomparison of the volume size distribution
   The cloud screening method in V4.2 relies heavily on the                    derived by SKYRAD V4.2 and V5.0
global flux test and needs global irradiance data, but almost
all SKYNET sites do not have solar irradiance observations.           Aerosol size properties were one of the most important
Furthermore, cirrus contamination data are difficult to re-           pieces of information for both the observation and modeling
move as cloud-affected data (Hashimoto et al., 2012).                 of radiative forcing (Dusek et al., 2006). The volumes at each

Atmos. Meas. Tech., 13, 1195–1212, 2020                                                 www.atmos-meas-tech.net/13/1195/2020/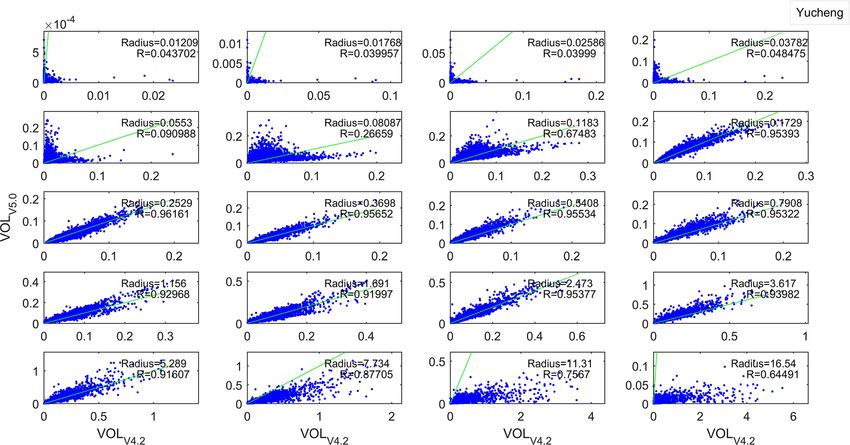
Z. Jiang et al.: Intercomparison between the aerosol optical properties 1199
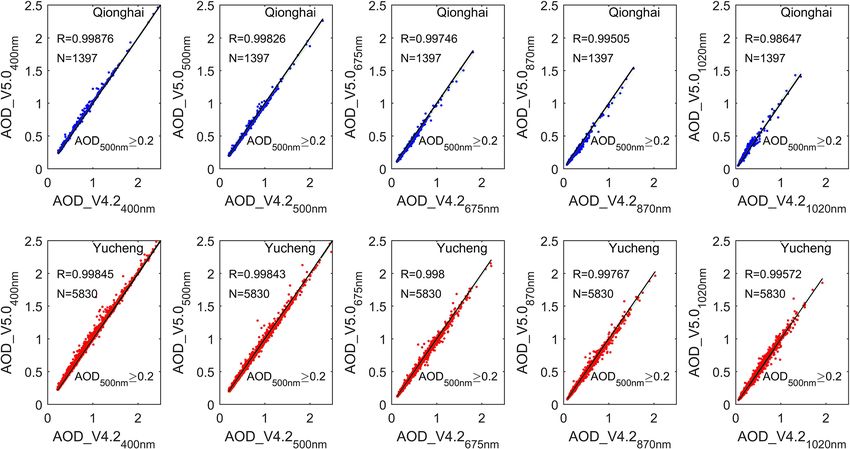
Figure 2. Scattergrams of the AOD derived by SKYRAD V4.2 and V5.0 at wavelengths of 400, 500, 670, 870, and 1020 nm over Qionghai
and Yucheng during February 2013 to December 2015.
bin were averaged monthly during the experiment period for As shown in Tables 1 and 2, the percentage difference in
V4.2 and V5.0 over Qionghai and Yucheng (Fig. 3). The SDF the volume size distributions between SKYRAD V5.0 and
by V4.2 usually showed a predominant peak at the coarse V4.2 were larger than 50 % at smaller size (r < 0.025 µm
mode with a radius over 10 µm. In Qionghai, the SDF by at Qionghai, and r < 0.017 µm at Yucheng) and larger size
V4.2 showed a slightly tri-model pattern in February. There (r > 10 µm at both sites). When the radius is between 0.17
were tri-model patterns with three peak volumes at radii of and 5 µm, the size distributions retrieved by V5.0 were in
0.026, 0.25, and 16.54 m and 0.25, 1.69, and 11.31 µm in vol- good agreement with those by V4.2.
ume SDF by V4.2 in August and September over Yucheng,
respectively. As V5.0 uses an a priori SDF of a bimodal log- 3.1.2 Intercomparison between single scattering albedo
normal function (Hashimoto et al., 2012), the volume SDF derived by SKYRAD V4.2 and V5.0
derived by V5.0 generally showed the classic bimodal pat-
terns at both Qionghai and Yucheng. The SDF from V5.0 As a key variable in assessing the climatic effects of aerosols,
showed two peaks at radii of 0.17 and 5.29 µm over both the SSA is defined as the ratio of the scattering coefficient
sites. Generally, the SDF retrieved by V4.2 was similar to and the extinction coefficient. It characterizes the absorption
V5.0 at a radius < 5 µm. The large differences in volume SDF properties of aerosols and serves as an important quantity in
at a radius over 5 µm between V4.2 and V5.0 were mainly re- evaluating aerosol radiative forcing. The SSA value is mostly
lated to the fact that the smoothness condition in V4.2 given dependent on the shape, size distribution, and concentration
by Eq. (2) allowed the retrieved SDF to be distributed beyond of aerosol particles.
a 10 µm radius, whereas a strong constraint on the SDF for Tables 3 and 4 presented average single scattering
the coarse-mode particles as shown in Eq. (5) was applied in albedo and refractive index for SKYRAD V5.0 and
V5.0 (Hashimoto et al., 2012). V4.2 and the differences between the two versions over
As shown in Figs. 4 and 5, the differences in the retrieved Qionghai and Yucheng during February 2013 to Decem-
size distribution at smaller size (r < 0.05 µm) and larger size ber 2015, respectively. The differences between SSAs re-
(r > 10 µm) were both very large. To avoid unrealistically in- trieved by SKYRAD V5.0 and V4.2 at 400, 500, 675, 870,
creasing tails of size distribution due to the very low sensi- and 1020 nm over Qionghai were −0.0009 (−0.1057 %),
tivity of sky radiometer observations to very small and very −0.0028 (−0.2984 %), −0.0072 (−0.7596 %), −0.0077
large particles, V5.0 introduced the constraint on the vol- (−0.809 %), and 0.0039 (0.4443 %), respectively. The stan-
ume size distribution described above. As a result, the values dard deviations of absolute differences were 0.0268, 0.0287,
of the retrieved size distribution of the smallest size classes 0.0283, 0.0332, and 0.0454, respectively. Over the Yucheng
(r < 0.05 µm) and the largest size classes (r > 10 µm) by V5.0 station, the SSAs retrieved from V5.0 were approximately
were close to zero. 0.0142 (1.5646 %), 0.0008 (0.0873 %), 0.0064 (0.6766 %),
and 0.0101 (1.1048 %), lower than those from V4.2 at
400, 675, 870, and 1020 nm, respectively, but were 0.0059
www.atmos-meas-tech.net/13/1195/2020/ Atmos. Meas. Tech., 13, 1195–1212, 2020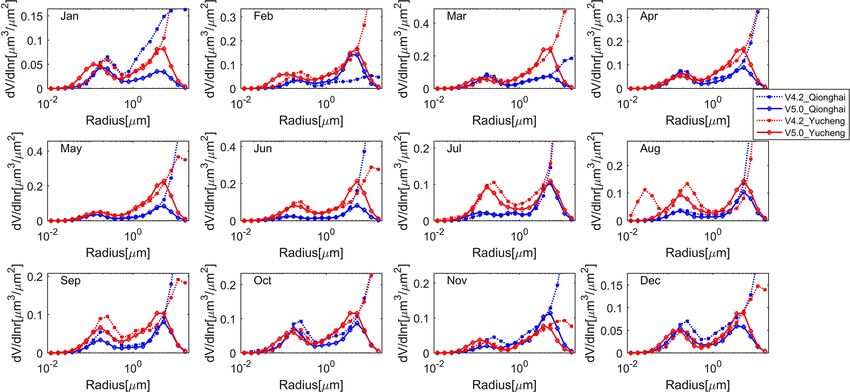
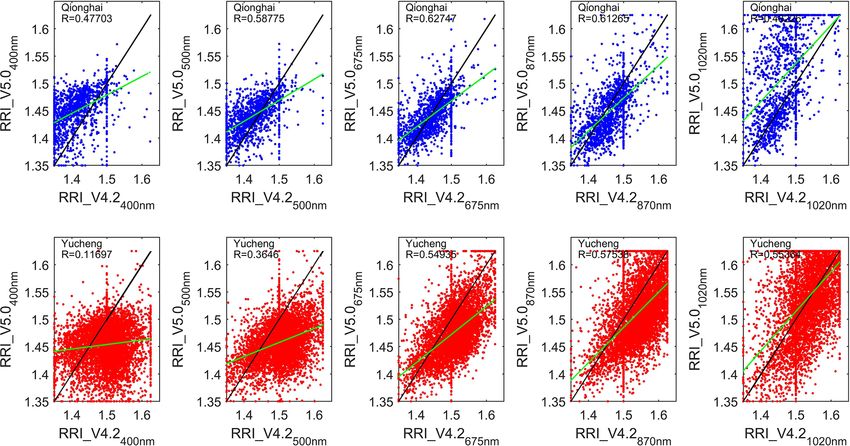
1200                                                                 Z. Jiang et al.: Intercomparison between the aerosol optical properties

Figure 3. Retrieved monthly volume size distribution by SKYRAD V4.2 (dotted lines) and V5.0 (solid lines) for Qionghai (blue lines) and
Yucheng (red lines) during February 2013 to December 2015.

Table 1. Averaged volume size distribution in each bin and the differences between the two versions at the Qionghai site during February 2013
to December 2015.

  Radius        Mean_VOL_V5.0            Std_VOL_V5.0           Mean_VOL_V4.2            Std_VOL_V4.2          Mean_1VOL            Std_1VOL          Mean_1VOL/
  (µm)                                                                                                                                                VOL_V4.2 (%)
  0.0121                   0.00002                0.00002                  0.00009               0.00053            −0.00006             0.00052               −66.67
  0.0177                   0.00020                0.00017                  0.00040               0.00217            −0.00020             0.00208               −50.00
  0.0259                   0.00104                0.00093                  0.00116               0.00471            −0.00012             0.00426               −10.34
  0.0378                   0.00337                0.00290                  0.00316               0.00651             0.00021             0.00580                 6.65
  0.0553                   0.00821                0.00634                  0.00970               0.00799            −0.00150             0.00849               −15.46
  0.0809                   0.01924                0.01304                  0.02574               0.01216            −0.00651             0.01308               −25.29
  0.1183                   0.03959                0.02213                  0.04698               0.02060            −0.00739             0.01440               −15.73
  0.1729                   0.05205                0.02655                  0.05365               0.02762            −0.00160             0.00858                −2.98
  0.2529                   0.03683                0.02030                  0.03704               0.02110            −0.00021             0.00558                −0.57
  0.3698                   0.01625                0.01120                  0.01726               0.01155            −0.00101             0.00407                −5.85
  0.5408                   0.01046                0.01178                  0.00989               0.01048             0.00058             0.00383                 5.86
  0.7908                   0.01309                0.01217                  0.01242               0.01090             0.00067             0.00535                 5.39
  1.1560                   0.01942                0.01305                  0.01952               0.01483            −0.00010             0.00753                −0.51
  1.6910                   0.02766                0.01786                  0.02707               0.02105             0.00059             0.00913                 2.18
  2.4730                   0.03812                0.03021                  0.03391               0.03145             0.00421             0.01005                12.42
  3.6170                   0.05222                0.05550                  0.04139               0.04655             0.01083             0.02102                26.17
  5.2890                   0.05585                0.07943                  0.05122               0.06994             0.00463             0.02892                 9.04
  7.7340                   0.03647                0.06242                  0.06948               0.12479            −0.03301             0.07272               −47.51
  11.3100                  0.01348                0.02238                  0.09903               0.24624            −0.08555             0.22908               −86.39
  16.5400                  0.00329                0.00400                  0.10389               0.31131            −0.10061             0.30881               −96.84
 VOL indicates volume spectrum (dV /d ln r[µm3 /µm2 ]); subscripts V5.0 and V4.2 indicate parameters retrieved by SKYRAD V5.0 and V4.2, respectively; 1VOL was defined as
 1VOL= VOL_V5.0 - VOL_V4.2 .

(0.6408 %) higher than those from V4.2 at 500 nm. The stan-                              ing February 2013 to December 2015. As shown in Fig. 6,
dard deviations of absolute differences at 400, 500, 675,                                SSAs by V5.0 correlated with those by V4.2 with R = 0.88,
870, and 1020 nm were 0.0188, 0.018, 0.0208, 0.0267, and                                 0.87, 0.90, 0.88, and 0.92 at wavelengths of 400, 500, 670,
0.0421, respectively.                                                                    870, and 1020 nm, respectively, over Qionghai. Although the
   Figure 6 presented the comparison results between SSAs                                correlation coefficient was highest at 1020 nm in Qionghai,
retrieved by SKYRAD V4.2 and V5.0 at wavelengths of 400,                                 their patterns were more scattered. The SSA values com-
500, 670, 870, and 1020 nm over Qionghai and Yucheng dur-                                puted from V5.0 had correlation coefficients of 0.95, 0.95,

Atmos. Meas. Tech., 13, 1195–1212, 2020                                                                          www.atmos-meas-tech.net/13/1195/2020/
Z. Jiang et al.: Intercomparison between the aerosol optical properties                                                              1201

Table 2. The same as Table 1 but for Yucheng during February 2013 to December 2015.

  Radius       Mean_VOL_V5.0              Std_VOL_V 5.0      Mean_VOL_V4.2   Std_VOL_V 4.2   Mean_1VOL      Std_1VOL      Mean_1VOL/
  (µm)                                                                                                                    VOL_V4.2 (%)
  0.0121                   0.00004                 0.00003         0.00009         0.00057      −0.00005       0.00057          −55.56
  0.0177                   0.00037                 0.00034         0.00041         0.00226      −0.00005       0.00227          −12.20
  0.0259                   0.00209                 0.00223         0.00127         0.00466       0.00082       0.00509           64.57
  0.0378                   0.00771                 0.00814         0.00365         0.00668       0.00405       0.01027          110.96
  0.0553                   0.01964                 0.01793         0.01092         0.01085       0.00872        0.0201           79.85
  0.0809                   0.03693                 0.02529         0.02626         0.01986       0.01067       0.02768           40.63
  0.1183                   0.05215                 0.02732         0.04296         0.02867       0.00919       0.02261           21.39
  0.1729                   0.05234                 0.02986         0.04693         0.03068       0.00541       0.00922           11.53
  0.2529                   0.03565                 0.02656         0.03577         0.02494      −0.00012       0.00731           −0.34
  0.3698                   0.02127                 0.02186          0.0224         0.01984      −0.00112       0.00647           −5.00
  0.5408                   0.02097                  0.0232         0.01849         0.01942       0.00248       0.00739           13.41
  0.7908                   0.03422                 0.02713         0.02756         0.02358       0.00665       0.00851           24.13
  1.156                    0.05671                 0.04448         0.04648         0.03793       0.01023       0.01674           22.01
  1.691                    0.07164                 0.05576         0.06556         0.05141       0.00608       0.02186            9.27
  2.473                    0.08896                 0.06535         0.08213         0.06165       0.00684       0.01965            8.33
  3.617                    0.12994                 0.10367         0.10484         0.07932       0.02511       0.03979           23.95
  5.289                    0.13706                 0.12457         0.13461         0.10872       0.00246       0.05025            1.83
  7.734                    0.08079                 0.09025         0.16487         0.17992      −0.08408        0.1097          −51.00
  11.31                    0.02645                 0.03229         0.18977         0.34336      −0.16332       0.31962          −86.06
  16.54                    0.00575                 0.00592         0.16934         0.42522      −0.16359       0.42143          −96.60
 Meanings of all symbols are the same as in Table 1.

Figure 4. Scattergrams of volume size distribution retrieved by SKYRAD V4.2 and V5.0 in 20 bins over Qionghai during February 2013 to
December 2015. Only data with AOD500 nm > 0.2 are shown. The green line indicates the fitted linear regression curve.

0.96, 0.94, and 0.91 with those from V4.2 at wavelengths                     lack of a coarse part in the SDF causes overestimation of
of 400, 500, 670, 870, and 1020 nm over Yucheng. Based on                    sky radiance at all observation angles. It is likely that V5.0
the comparison results over the two sites, in most cases, V5.0               decreases the SSA value to dim the sky radiance in the cal-
retrieved lower SSA values than V4.2. V5.0 tends to underes-                 culation when a tight constraint on the SDF for particles with
timate the SSA due to underestimation of the coarse aerosols                 radius over 10 µm is applied.
larger than 10 µm when the a priori SDF for constraint tends
to be close to zero. Hashimoto et al. (2012) found that the

www.atmos-meas-tech.net/13/1195/2020/                                                         Atmos. Meas. Tech., 13, 1195–1212, 2020
1202                                                     Z. Jiang et al.: Intercomparison between the aerosol optical properties

Figure 5. The same as Fig. 4 but for the Yucheng site.

Figure 6. Scattergrams of the single scattering albedo retrieved by SKYRAD V4.2 and V5.0 at wavelengths of 400, 500, 670, 870, and
1020 nm over Qionghai and Yucheng during February 2013 to December 2015. Only data with AOD500 nm > 0.2 are shown. The green line
indicates the fitted linear regression curve.

3.1.3   Intercomparison of the refractive index derived               nels of 400, 500, 675, 870, and 1020 nm, respectively, over
        by SKYRAD V4.2 and V5.0                                       Qionghai. The standard deviations of absolute differences
                                                                      were 0.0038, 0.0039, 0.0038, 0.0041, and 0.0054, respec-
                                                                      tively. The averaged mi retrieved by V5.0 was 0.0015,
The averaged mi values retrieved from V5.0 at all wave-               0.0007, 0.0013, and 0.0017 higher at 400, 675, 870, and
lengths were systemically higher than those from V4.2 over            1020 nm wavelengths, respectively, but 0.0005 lower at
Qionghai (Table 3). The mean values of mi retrieved from              500 nm, than those retrieved by V4.2 in Yucheng. The stan-
V4.2 were approximately 0.0019, 0.0009, 0.0015, 0.0016,               dard deviations of absolute differences at 400, 500, 675, 870,
and 0.0021 lower than those from V5.0 for the five chan-

Atmos. Meas. Tech., 13, 1195–1212, 2020                                                www.atmos-meas-tech.net/13/1195/2020/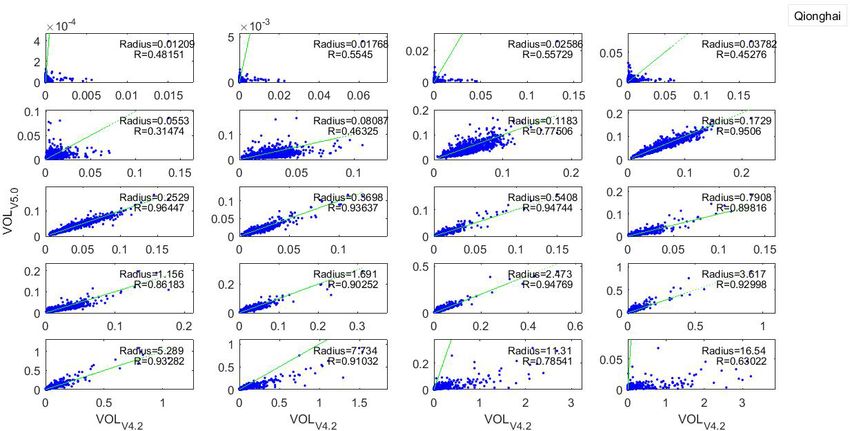
Z. Jiang et al.: Intercomparison between the aerosol optical properties                                                                                      1203

Table 3. Averaged single scattering albedo and refractive index in                                   most random differences over the two sites; the difference in
SKYRAD V5.0 and V4.2, and the absolute and percentage differ-                                        mr between the two versions was greater than that in mi (as
ences between the two versions at the Qionghai site during Febru-                                    shown in Tables 3 and 4). The mean mr values from V5.0
ary 2013 to December 2015.                                                                           were approximately 0.0359 (2.5363 %), 0.0118 (0.8263 %),
                                                                                                     and 0.0477 (3.2598 %) higher at 400, 500, and 1020 nm, re-
                   400 nm           500 nm          670 nm           870 nm        1020 nm
                                                                                                     spectively, but 0.0019 (0.1321 %), 0.0116 (0.7926 %) lower
  ωv5.0           0.8852           0.9233          0.9355           0.9447            0.8774         at 675 and 870 nm than those from V4.2 over the Qionghai
  ωv4.2           0.8862           0.9260          0.9427           0.9524            0.8735         station. The results for mr showed that the retrievals by V5.0
  mr_v5.0         1.4498           1.4423          1.4402           1.4497            1.5103
  mr_v4.2         1.4139           1.4305          1.4421           1.4613            1.4626
                                                                                                     were lower than those by V4.2 at wavelengths of 400, 500,
  mi_v5.0         0.0156           0.0086          0.0062           0.0049            0.0141         675, and 870 nm, respectively, but were larger than those by
  mi_v4.2         0.0137           0.0077          0.0047           0.0034            0.0120         V4.2 at 1020 nm over Yucheng. The averaged percentage dif-
  δω             −0.0009          −0.0028         −0.0072          −0.0077            0.0039         ferences of the mean mr obtained using the two versions were
  σ (δω)          0.0268           0.0287          0.0283           0.0332            0.0454         all within 3.26 % both at Yucheng and Qionghai. The corre-
  δmr             0.0359           0.0118         −0.0019          −0.0116            0.0477
  σ (mr )         0.0484           0.0413          0.0380           0.0441            0.0740
                                                                                                     lation coefficients between mr by V5.0 and those by V4.2 at
  δmi             0.0019           0.0009          0.0015           0.0016            0.0021         the five wavelengths were all smaller than 0.63 at the two
  σ (mi )         0.0038           0.0039          0.0038           0.0041            0.0054         sites.
  δω %           −0.1057          −0.2984         −0.7596          −0.8090            0.4443
  δmr%            2.5363           0.8263         −0.1321          −0.7926            3.2598
                                                                                                     3.2     Sensitivity tests
  Rmi             1.1374           1.1175          1.3298           1.4694            1.1707
 ω, mr , and mi indicate averaged single scattering albedo, the real part of the refractive index,
 and the imaginary part of the refractive index; subscripts v5.0 and v4.2 indicate parameters        3.2.1    Sensitivity tests for the main causes of error in
 retrieved by SKYRAD V5.0 and V4.2, respectively; δ - and δ - % indicate absolute and
 percentage difference between SKYRAD V5.0 and V4.2, respectively; σ (δ) indicates the                        the SSA and AOD retrievals by V5.0 and V4.2
 standard deviation of absolute differences between SKYRAD V5.0 and V4.2; Rmi indicates
 the ratio of mi_v5.0 to mi_v4.2 .
                                                                                                     The accurate retrieval of SSA is more difficult than esti-
                                                                                                     mation of AOD and size distribution (Loeb and Su, 2010;
Table 4. The same as Table 3 but for Yucheng during February 2013
                                                                                                     McComiskey et al., 2008). The errors associated with Ag
to December 2015.
                                                                                                     (ground surface albedo), SVA, and the amount of aerosols in
                   400 nm          500 nm           670 nm           870 nm        1020 nm           the atmosphere are possible causes of error in the SSA, and
                                                                                                     these errors may cause either underestimation or overestima-
  ωv5.0           0.8944          0.9343           0.9352          0.9390           0.9022
  ωv4.2           0.9086          0.9284           0.9360          0.9454           0.9122
                                                                                                     tion (Hashimoto et al., 2012). The current SKYRAD package
  mr_v5.0         1.4535          1.4590           1.4768          1.5115           1.5404           underestimates the SVA by 0.5 % to 1.9 % (Uchiyama et al.,
  mr_v4.2         1.4950          1.5055           1.5089          1.5409           1.5358           2018). The accuracy of calibration constant (F0 ) determines
  mi_v5.0         0.0100          0.0053           0.0054          0.0053           0.0093           the inversion accuracy of the amount of aerosols.
  mi_v4.2         0.0085          0.0058           0.0047          0.0039           0.0076
                                                                                                        Based on the measurements over the two sites in January,
  δω             −0.0142          0.0059          −0.0008         −0.0064          −0.0101
  σ (δω)          0.0188          0.0180           0.0208          0.0267           0.0421           April, July, and October 2014, several sensitivity tests were
  δmr            −0.0415         −0.0465          −0.0322         −0.0294           0.0045           carried out to test the magnitude of the change in SSA. We as-
  σ (mr )         0.0631          0.0506           0.0448          0.0520           0.0609           sumed an error of ±5 % for calibration constant F0 , ±5 % for
  δmi             0.0015         −0.0005           0.0007          0.0013           0.0017           solid view angle SVA, and ±50 % (±0.05) for ground sur-
  σ (mi )         0.0030          0.0029           0.0030          0.0035           0.0048
                                                                                                     face albedo (Ag ). We compared the differences in retrieved
  δω %           −1.5646          0.6408          −0.0873         −0.6766          −1.1048
  δmr%           −2.7743         −3.0869          −2.1317         −1.9053           0.2960           SSA values at a wavelength of 500 nm between cases with
  Rmi             1.1798          0.9099           1.1455          1.3383           1.2230           and without the assumed errors, and the relative difference
 Meanings of all symbols are the same as in Table 3.                                                 is defined as {[SSA (with assumed error)–SSA (no assumed
                                                                                                     error)]/[SSA (no assumed error)]}.
                                                                                                        As shown in Fig. S1 in the Supplement, when we assumed
and 1020 nm were 0.003, 0.0029, 0.003, 0.0035, and 0.0048,                                           an error of +5 % for calibration constant F0 , the averaged
respectively. As shown in Fig. 7, the mi values by V5.0                                              differences in SSAs_V4.2 and SSAs_V5.0 were −2.82 % and
were linearly correlated with those by V4.2 with R = 0.8947,                                         −3.42 %, while if the F0 was reduced by 5 %, the aver-
0.8661, 0.8658, 0.8370, and 0.9131 at wavelengths of 400,                                            aged differences in SSAs_V4.2 and SSAs_V5.0 were +4.46 %
500, 675, 870, and 1020 nm in Qionghai. The correlation co-                                          and +3.85 % at the Qionghai site. In Yucheng, an error of
efficients between mi by V5.0 and those by V4.2 at the five                                          +5 % in F0 caused −2.76 % and −3.00 % averaged error in
wavelengths were all higher than 0.89 over Yucheng.                                                  SSAs_V4.2 and SSAs_V5.0 , respectively; when we introduced
   The complex refractive index in V4.2 can only be chosen                                           a −5 % error in F0 , there was about 2.76 % and 3.08 % aver-
from the predefined set of values. mr values in V5.0 were                                            aged difference in retrieved SSAs by V4.2 and V5.0.
directly included in the state vector, including constraints                                            The SVA is related to the sky radiance, and errors in
on the complex refractive index. As a priori estimation, mr                                          the SVA will affect the SSA results. Figure S2 shows that
was usually be set to 1.5. As shown in Fig. 8, mr has al-                                            an error of ±5 % for SVA introduced about ±2 % differ-

www.atmos-meas-tech.net/13/1195/2020/                                                                                   Atmos. Meas. Tech., 13, 1195–1212, 2020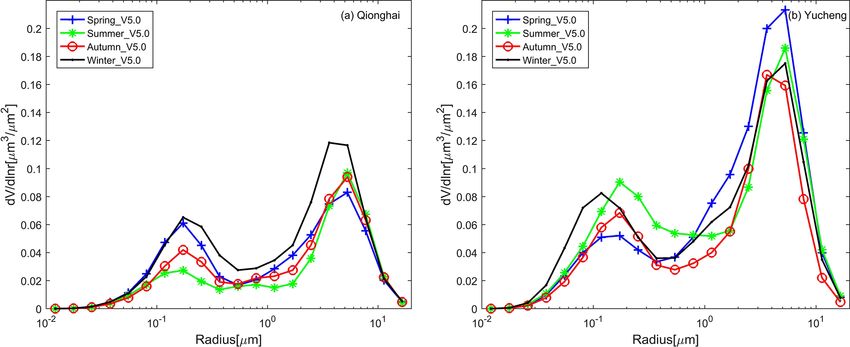
1204                                                      Z. Jiang et al.: Intercomparison between the aerosol optical properties

Figure 7. Scattergrams of the imaginary part of the complex refractive index (mi ) retrieved by SKYRAD V4.2 and V5.0 at wavelengths of
400, 500, 670, 870, and 1020 nm over Qionghai and Yucheng during February 2013 to December 2015. The green line indicates the fitted
linear regression curve.

Figure 8. The same as Fig. 7 but for the real part of the complex refractive index (mr ).

ences in retrieved SSA values over both two sites. The av-                SSAs_V5.0 were lower than those in SSAs_V4.2 both in
eraged differences in SSAs_V4.2 and SSAs_V5.0 in Qionghai                 Qionghai and Yucheng.
were around 0.6 % and 0.36 % when we assumed errors of                       Although the value of Ag depends on wavelength and
±5 % for SVA. The sensitivity tests were based on 60 mea-                 ground conditions, the Ag values used in data processing
surements in Qionghai and 607 measurements in Yucheng.                    in V4.2 and V5.0 were both set to 0.1 for each wavelength.
The averaged differences in SSAs_V4.2 and SSAs_V5.0 over                  As shown in Fig. S3, when Ag was increased by 0.05 com-
Yucheng were about 0.4 % and 0.2 %. The differences in                    pared to the initial value of 0.1, the SSAs_V4.2 and SSAs_V5.0
                                                                          in Qionghai were about 0.88 % and 1.14 % smaller than the

Atmos. Meas. Tech., 13, 1195–1212, 2020                                                     www.atmos-meas-tech.net/13/1195/2020/
Z. Jiang et al.: Intercomparison between the aerosol optical properties 1205 retrieved SSA results without the assumed Ag errors. How- averaged differences in retrieved SSA values due to ±5 % er- ever, when the Ag was reduced by 0.05, the SSAs_V4.2 and ror in F0 varied from 3 % to 5 %. With the PRS increased by SSAs_V5.0 in Qionghai were about 0.98 % and 1.16 % larger 1 %, 2 %, 3 %, and 4 %, the averaged changes in SSAs did than those from the results without the assumed Ag errors. not exceed 0.8 %, and the changes in SSAs_V4.2 were larger Over Yucheng site, an error of +5 % in Ag caused -0.97 % than those in SSAs_V5.0 over the two sites. and −0.98 % averaged error in SSAs_V4.2 and SSAs_V5.0 , re- spectively; when we introduced −5 % in Ag , there was about 3.2.2 Sensitivity tests for the parameters linked to the +0.93 % and +0.95 % averaged difference in retrieved SSAs SSA differences between the V5.0 and V4.2 by V4.2 and V5.0. For the AOD at the wavelength of 0.5 µm, there were no The most different physical process between V4.2 and V5 differences when we introduced an error in Ag and SVA, is a derivation of particle size distribution. When a large but there were noticeable differences when we introduced amount of coarse particles of the dust-like aerosol type with a ±5 % error in F0 as shown in Fig. S4. The averaged er- radius greater than 10 µm existed, the numerical tests per- rors in retrieved AODs_V4.2 and AODs_V5.0 caused by +5 % formed by Hashimoto et al. (2012) showed that V4.2 could error in F0 were +4.00 % and +4.83 % in Qionghai, and retrieve the SDF relatively better, including the coarse mode, +3.25 % and +4.13 % in Yucheng. The averaged errors in re- in comparison with V5.0. This is because the smoothness trieved AODs_V4.2 and AODs_V5.0 due to −5 % errors in F0 condition given by Eq. (2) allowed the retrieved SDF to be were −4.38 % and −4.73 % in Qionghai, and −3.32 % and distributed beyond 10 µm radius; on the other hand, V5.0 −4.20 % in Yucheng. The differences in AODs_V5.0 were underestimated the coarse mode of the SDF because of the larger than those in AODs_V4.2 over the two sites. strong SDF constraint condition given by Eq. (5) with a We also investigated the differences in SSAs due to the as- small model radius rm2 = 2.0 µm for the coarse-mode SDF sumed errors in atmospheric pressure (PRS). PRS was con- (Hashimoto et al., 2012). So we have compared the differ- sidered to be 1.00 (atm) in the experimental group, while it ences between retrieved SSAs at 500 nm by V5.0 and V4.2 was sequentially changed by 1 % in the control groups. As when setting rm2 = 1.5, 1.8, 2.0 (default), 2.5, and 3.0 in shown in Fig. S5, the averaged changes in SSA retrieved SKYRAD.pack V5.0 based on the measurements in 2014. by V5.0 in the four control groups compared with the ex- As shown in Fig. 9, SSAs by V5.0 correlated with SSAs by perimental group were all smaller than those in SSA re- V4.2 with R = 0.860, 0.837, 0.855, 0.809, and 0.826 when trieved by V4.2 over both sites. In Qionghai, with the PRS rm2 = 2.0 (default), 1.5, 1.8, 2.5, and 3.0 in V5.0 over Qiong- increased by 1 %, 2 %, 3 %, and 4 %, the averaged changes hai, respectively. The SSA values computed from V5.0 had in SSAs by V5.0 were 0.18 %, 0.21 %, 0.17 %, and 0.26 %; correlation coefficients around 0.940, 0.928, 0.928, 0.921, those by V4.2 were 0.66 %, 0.56 %, 0.58 %, and 0.78 %. The and 0.924 with those from V4.2 when rm2 = 2.0 (default), averaged changes in SSAs retrieved by V5.0 over Yucheng 1.5, 1.8, 2.5, and 3.0 in V5.0 in Yucheng. The correlation were 0.17 %, 0.21 %, 0.23 %, and 0.22 %; those by V4.2 coefficient between SSA by V5.0 and V4.2 was the highest were 0.44 %, 0.46 %, 0.47 %, and 0.50 %. The changes in when setting rm2 to 2.0 (the default value) in V5.0 at the two SSAs_V4.2 were larger than those in SSAs_V5.0 over the two sites. sites. We also investigated whether the total amount of aerosols On the basis of the above sensitivity tests, it is concluded in the atmosphere was linked to the differences in SSA be- that an error in the calibration constant (F0 ) causes an error tween the two versions. As shown in Fig. 10, the SSA dif- in both retrieved SSA and AOD. However, according to a re- ferences at 500 nm between the two versions (defined as ported comparison of calibration constants from SKYNET SSA_V5.0500 nm – SSA_V4.2500 nm ) decreased while the cor- with those from the Aerosol Robotic Network (AERONET), responding AODs at wavelengths of 500 nm by V5.0 in- the improved Langley method adopted by SKYNET seems to creased at the two sites. When the AOD was high (in this yield accurate calibration constants (Campanelli et al., 2004; study, the threshold was set to 0.5 for AOD500 nm ), SSA re- Hashimoto et al., 2012). An error of ±5 % for SVA intro- trieved by V5.0 had a good comparison with that by V4.2. It duced about ±2 % differences in retrieved SSA values both is well known that the inversion products have a high uncer- by V4.2 and V5.0, and the differences in SSAs_V5.0 were tainty in cases of very low aerosol burdens; the retrieval error lower than those in SSAs_V4.2 over both sites. The sensitiv- in SSA rapidly increases with decreasing AOD, especially in ity test results indicate that overestimation or underestima- parameters such as the imaginary part of the refractive index tion in the Ag could result in underestimation or overestima- (Dubovik et al., 2000). tion of the SSA, respectively. An error of ±50 % for ground Base on the intercomparison results in Sect. 3.1 and the surface albedo Ag caused about 1 % averaged differences in sensitivity tests in Sect. 3.2, we could not reach the conclu- retrieved SSA values both by V4.2 and V5.0. For the AOD sion that V5.0 is definitely better than V4.2. We do not yet at the wavelength of 0.5 µm, there were no differences when have other measurements in the two sites to help us prove we introduced an error in Ag and SVA, but there were notice- that V5.0 is better than V4.2. The most different physical able differences when we introduced a ±5 % error in F0 . The process between the two versions is the derivation of parti- www.atmos-meas-tech.net/13/1195/2020/ Atmos. Meas. Tech., 13, 1195–1212, 2020
1206                                                 Z. Jiang et al.: Intercomparison between the aerosol optical properties

Figure 9. Scattergrams of retrieved SSA by SKYRAD V4.2 and V5.0 when rm2 = 2.0 (default), 1.5, 1.8, 2.5, and 3.0 for Qionghai (a) and
Yucheng (b) in 2014. rm2 represents the model radius for the coarse-mode SDF.

Figure 10. Scattergrams of the difference between SSAs at 500 nm retrieved by V5.0 and V4.2 (defined as SSA_V5.0–SSA_V4.2) and the
corresponding AODs at 500 nm by V5.0 during February 2013 to December 2015.

cle size distribution. On the one hand, V5.0 tends to be ro-         cles of the dust-like aerosol type with a radius greater than
bust in detecting cloud contamination, due to inversion con-         10 µm exits.
straint by a priori SDF which filters out coarse particles to           Considering that V5.0 adopts more rigorous data process-
simulate cloud-scattered radiation. Some tests by Hashimoto          ing and cloud detection methods, and that the SSA and mi
et al. (2012) showed that the SDF setting in V5.0 was use-           had high correlation coefficients between V4.2 and V5.0 with
ful for detecting ill-conditioned data caused by cirrus con-         default the coarse-mode radius rm2 value in V5.0 based on
taminations, horizontally and/or temporally inhomogeneous            the above comparison results, we chose the retrieved results
aerosol stratification, and so on (Hashimoto et al., 2012). On       by V5.0 to analyze the seasonal variability of the aerosol op-
the other, because a priori SDF for constraint tends to be           tical properties over Qionghai and Yucheng in the following
zero for radii larger than 10 µm, V5.0 will underestimate the        section.
coarse-mode aerosols when a large amount of coarse parti-

Atmos. Meas. Tech., 13, 1195–1212, 2020                                                www.atmos-meas-tech.net/13/1195/2020/
Z. Jiang et al.: Intercomparison between the aerosol optical properties                                                     1207

3.3     Seasonal variability of the aerosol optical               3.3.2   SSA
        properties over Qionghai and Yucheng based on
        SKYRAD.pack V5.0                                          Figure 11b shows the seasonal averaged SSA at 500 nm for
                                                                  Qionghai and Yucheng during February 2013 to Decem-
The analysis of the 500 nm channel was chosen because it          ber 2015. In Qionghai, the seasonal averaged SSA values
was widely quoted in Sun photometric and remote sens-             were approximately 0.91, 0.90, 0.90, and 0.89 in spring, sum-
ing applications and generally representative of visible band     mer, autumn, and winter, respectively. The lowest seasonal
wavelengths (Estellés et al., 2012b). Four seasons were con-      average SSA was observed in winter, which was probably
sidered in this paper, i.e., spring (March–May), summer           attributable to the regional transport of the air masses origi-
(June–August), autumn (September–November), and winter            nating from eastern China, where a great amount of coal was
(December–February), to investigate the seasonal variations       used for industrial enterprises and emitted a large amount of
of the aerosol optical properties over Qionghai and Yucheng       organic carbon (OC) and elemental carbon (EC) (Liu et al.,
based on SKYRAD.pack V5.0.                                        2018). In Yucheng, the seasonal pattern of SSA was consis-
                                                                  tent with AOD; the lowest seasonal average SSAs were also
3.3.1    AOD                                                      observed in winter due to carbonaceous aerosols increased by
                                                                  heating activities and biomass burning in cold seasons (Tao
The AOD is representative of the aerosol loading in the at-
                                                                  et al., 2017). High concentrations of fine particulate nitrate
mospheric column and important for the identification of the
                                                                  were frequently observed in summer in Yucheng (Wen et al.,
aerosol source regions and the aerosol evolution.
                                                                  2015), likely causing the high SSA in summer.
   The AOD showed a distinct seasonal variation over both
Qionghai and Yucheng. Figure 11a showed that the seasonal
                                                                  3.3.3   Volume size distribution
averaged AOD over Qionghai had higher values in spring,
winter, and autumn and lower values in summer. During
                                                                  Figure 12a and b show the seasonal averaged volumes of
summer, the dominant wind is from south to southeast (Zhu
                                                                  the different aerosol particle size distributions (dv/d ln r) in
et al., 2005) and the main emission source was from the
                                                                  Qionghai and Yucheng. The aerosol volume size distribu-
South China Sea and western Pacific. In addition, seasonal
                                                                  tions were typical bimodal patterns during each season at the
upwelling off the east coast of the island of Hainan was
                                                                  Qionghai and Yucheng sites. Figure 12a and b show that there
strongest in summer (Li et al., 2018), which was conducive
                                                                  was a larger contribution of coarse-mode particles to the
to pollutant diffusion. Meanwhile, rich precipitation in sum-
                                                                  aerosol volume compared with the fine-mode particles at the
mer was effective for eliminating aerosols. Because of the
                                                                  two sites. The fine mode showed a peak at a radius of 0.17 µm
reasons above, seasonal averaged value of AOD in summer
                                                                  in all seasons over Qionghai. The coarse mode was charac-
was the lowest in Qionghai. In contrast, AOD in spring was
                                                                  terized by a peak at a radius of 5.29 µm in spring, summer,
higher than other seasons. Southerly and northeasterly winds
                                                                  and autumn and 3.62 µm in winter. As shown in Fig. 12a,
both prevail in spring over Qionghai (Liu et al., 2018), so
                                                                  the fraction of the fine aerosol particles was much smaller in
long-distance transport and emissions from surrounding ar-
                                                                  summer than in other seasons. The summer meteorological
eas were probably both the main pollutant sources.
                                                                  conditions, such as high wind speeds, high mixing heights,
   The maximum AOD average of 0.99 occurred in sum-
                                                                  and fresh air masses originating from or passing through the
mer over Yucheng. Several factories which produced inor-
                                                                  sea, may contribute to the decrease of anthropogenic pollu-
ganic and organic fertilizers were located around this site.
                                                                  tant concentrations (Liu et al., 2018) and introduce some sea
The stronger sunlight in summer accelerated the photochem-
                                                                  salt particles of a relatively large size. The seasonal averaged
ical reaction and enhanced the formation of fine particulate
                                                                  peaks of fine-mode and coarse-mode SDFs were both higher
nitrate (Wen et al., 2015). Also, the humidity in summer
                                                                  in winter than in other seasons, as shown in Fig. 12a. The sta-
over Yucheng was higher than in other seasons (Meng et al.,
                                                                  ble atmospheric circulation provides a stable atmospheric en-
2007). The high humidity combined with large fractions of
                                                                  vironment background, which is not conducive to the diffu-
hygroscopic chemical components (e.g., sulfate, nitrate, am-
                                                                  sion of pollutants; moreover, continuous low-level northeast
monium, and some organic matters) can enhance light ex-
                                                                  wind facilitates the transport of pollutants from the inland to
tinction (Tao et al., 2017). AOD was higher in spring than in
                                                                  Hainan in winter (Wu et al., 2011; Liu et al., 2018).
autumn and winter, which is likely related to the long-range
                                                                     As shown in Fig. 12b, the coarse-mode particles in
transportation of dust from northern/northwestern China and
                                                                  Yucheng had a relatively large value compared to the vol-
pollutants emitted from enterprises in Hebei (Tan et al., 2012;
                                                                  ume distribution of the fine-mode particles. The aerosol was
Tao et al., 2017).
                                                                  not only from winter heating but also from regional transport
                                                                  in winter (Tao et al., 2017; Zhao et al., 2018b). The volume
                                                                  fraction of the coarse aerosol particles relative to the whole
                                                                  was much larger in spring than in other seasons in Yucheng
                                                                  probably because of the presence of dust particles transported

www.atmos-meas-tech.net/13/1195/2020/                                               Atmos. Meas. Tech., 13, 1195–1212, 2020
1208 Z. Jiang et al.: Intercomparison between the aerosol optical properties
Figure 11. Seasonal variations in the AOD (a) and the SSA (b) based on SKYRAD V5.0 over Qionghai and Yucheng for the period from
February 2013 to December 2015. The boxes represent the 25th to 75th percentiles of the distributions, while the dots and solid lines within
each box represent the means and medians, respectively.
from the northwest of China and pollutants emitted from en- ticle mode both over Qionghai and Yucheng. The correlation
terprises in Hebei (Tao et al., 2017). coefficients between SSAs by V5.0 and by V4.2 were around
0.88, 0.87, 0.90, 0.88, and 0.92 at wavelengths of 400, 500,
3.3.4 Refractive index 670, 870, and 1020 nm over Qionghai, respectively. The SSA
values computed from V5.0 had relatively high correlation
The real part of the refractive index (mr ) represents scatter- coefficients of 0.95, 0.95, 0.96, 0.94, and 0.91 at wavelengths
ing. A higher mr indicates a stronger scattering. The imag- of 400, 500, 670, 870, and 1020 nm in Yucheng. The corre-
inary part of the refractive index (mi ) represents absorption lation coefficients between mi by V5.0 and those by V4.2 at
and is an important quantity in evaluating the aerosol radia- the five wavelengths were all higher than 0.89 over Yucheng.
tive forcing. On the basis of the sensitivity tests, it is concluded that
Figure 13a showed the seasonal variation of the real part an error in the calibration constant (F0 ) caused an error in
of the refractive index (mr ) at 500 nm over Qionghai and both retrieved SSA and AOD. The averaged differences in
Yucheng. The seasonal averages of mr at 500 nm were 1.45, retrieved SSA values due to ±5 % error in F0 varied from
1.46, 1.45, and 1.43 in spring, summer, autumn, and winter 3 % to 5 %. An error of ±5 % for SVA introduced about
in Qionghai, respectively. The mr showed a maximum of ap- ±2 % differences in retrieved SSA values both by V4.2 and
proximately 1.47 in spring and a minimum of approximately V5.0. Overestimation or underestimation in the Ag resulted
1.45 in summer in Yucheng. Figure 13b presented the sea- in underestimation or overestimation of the SSA. An error
sonal variation of the imaginary part of the refractive index of ±50 % for Ag caused about 1 % averaged differences in
(mi ) at 500 nm over Qionghai and Yucheng. The values of mi retrieved SSA values both by V4.2 and V5.0. With the atmo-
were both the highest in winter over the two sites. The aerosol spheric pressure PRS increased by 1 %, 2 %, 3 %, and 4 %,
absorption coefficient was mainly determined by EC mass the averaged changes in SSAs did not exceed 0.8 %. Sensi-
concentration and its coating (Tao et al., 2017), and heating tivity tests showed that the correlation coefficient between
activities and biomass burning induced higher carbonaceous SSAs at 500 nm by V5.0 and V4.2 was higher when set-
aerosols in winter in Yucheng. ting rm2 to 2.0 µm (the default value) in V5.0 than rm2 = 1.5,
1.8, 2.5, and 3.0 µm at the two sites. The SSA differences at
500 nm between the two versions decreased with the increase
4 Summary of the corresponding AODs at the two sites.
Based on SKYRAD.pack V5.0, the seasonal variations of
The aerosol optical properties over the two new SKYNET the aerosol optical properties over Qionghai and Yucheng
sites of Qionghai and Yucheng in China were continuously were investigated. The seasonal patterns of AOD were quite
investigated over 2 years using the PREDE-POM02 sky ra- different between the two stations. The AOD showed high
diometer measurements. As V5.0 used an a priori SDF of a values in spring, autumn, and winter but decreased to min-
bimodal log-normal function, the volume size distribution re- imum in summer over Qionghai, likely related to summer
trieved by V5.0 presented an overall bimodal pattern with a monsoon from the South China Sea and western Pacific that
0.10–0.20 µm fine particle mode and a 3.0–6.0 µm coarse par-
Atmos. Meas. Tech., 13, 1195–1212, 2020 www.atmos-meas-tech.net/13/1195/2020/Z. Jiang et al.: Intercomparison between the aerosol optical properties 1209
Figure 12. Seasonally averaged volumes of the different aerosol particle size distributions based on SKYRAD V5.0 over Qionghai (a) and
Yucheng (b) for the period from February 2013 to December 2015.
Figure 13. Seasonal variations in the real part of the refractive index (a) and the imaginary part of the refractive index (b) based on SKYRAD
V5.0 over Qionghai and Yucheng for the period from February 2013 to December 2015. The boxes represent the 25th to 75th percentiles of
the distributions, while the dots and solid lines within each box represent the means and medians, respectively.
brought most of the annual rainfall to the island, whereas the The comparison results between the aerosol optical prop-
winter monsoon from Inner Mongolia carried the air masses erties retrieved by SKYRAD V5.0 and SKYRAD V4.2 were
from mainland China to Qionghai. In Yucheng, the maximum very different over the two SKYNET sites. The results can
seasonal averaged AOD and SSA both appeared in summer provide validation data in China for SKYNET to continue
probably due to the hygroscopic effects. The fraction of the improving data processing and inversion methods. Mean-
fine aerosol particles over Qionghai was much smaller in while, the results can promote the integration of more Chi-
summer, which is probably related to wet deposition. Specif- nese observation stations into the international network.
ically, more precipitation in the summer can lead to more ef-
ficient removal of aerosol. The volume fraction of the coarse
aerosol particles relative to the whole in spring was much Data availability. The sky radiometer data at Qionghai and
larger than in other seasons in Yucheng, probably due to the Yucheng, China, are available on request by contacting the first au-
presence of the dust particles transported from the northwest thor of the paper (jiangzhe@mail.iap.ac.cn).
of China and pollutants emitted from enterprises in Hebei.
The location and distribution of major industrial sources, in-
tensity of local minor sources such as winter heating, and Supplement. The supplement related to this article is available on-
line at: https://doi.org/10.5194/amt-13-1195-2020-supplement.
prevailing wind directions together caused the different sea-
sonal variations between the two sites discussed above.
www.atmos-meas-tech.net/13/1195/2020/ Atmos. Meas. Tech., 13, 1195–1212, 2020You can also read