Impact of exhaust emissions on chemical snowpack composition at Concordia Station, Antarctica - The Cryosphere
←
→
Page content transcription
If your browser does not render page correctly, please read the page content below
The Cryosphere, 14, 199–209, 2020
https://doi.org/10.5194/tc-14-199-2020
© Author(s) 2020. This work is distributed under
the Creative Commons Attribution 4.0 License.

Impact of exhaust emissions on chemical snowpack
composition at Concordia Station, Antarctica
Detlev Helmig1 , Daniel Liptzin1 , Jacques Hueber1 , and Joel Savarino2
1 Institute   of Arctic and Alpine Research, University of Colorado, Boulder, CO 80309, USA
2 Université    Grenoble Alpes, CNRS, IRD, Grenoble INP, IGE, 38000 Grenoble, France

Correspondence: Detlev Helmig (detlev.helmig@colorado.edu)

Received: 29 August 2018 – Discussion started: 16 October 2018
Revised: 10 September 2019 – Accepted: 28 September 2019 – Published: 23 January 2020

Abstract. The chemistry of reactive gases inside the snow-        data showed noticeable concentration changes during these
pack and in the lower atmosphere was investigated at Con-         events that were above the normal variability seen in the
cordia Station (Dome C), Antarctica, from December 2012           data. Nonetheless, the clarity of the NOx and ozone obser-
to January 2014. Measured species included ozone, nitrogen        vations adds important new insight into the discussion of if
oxides, gaseous elemental mercury (GEM), and formalde-            and how snow photochemical experiments within reach of
hyde, for study of photochemical reactions, surface ex-           the power grid of polar research sites are possibly compro-
change, and the seasonal cycles and atmospheric chemistry         mised by the snowpack being chemically influenced (con-
of these gases. The experiment was installed ≈ 1 km from          taminated) by gaseous and particulate emissions from the re-
the station main infrastructure inside the station clean air      search camp activities. This question is critical for evaluat-
sector and within the station electrical power grid boundary.     ing if snowpack trace chemical measurements from within
Ambient air was sampled continuously from inlets mounted          the camp boundaries are representative for the vast polar ice
above the surface on a 10 m meteorological tower. In addi-        sheets.
tion, snowpack air was collected at 30 cm intervals to 1.2 m
depth from two manifolds that had both above- and below-
surface sampling inlets. Despite being in the clean air sector,
over the course of the 1.2-year study, we observed on the         1   Introduction
order of 50 occasions when exhaust plumes from the camp,
most notably from the power generation system, were trans-        Research conducted during the past ≈ 15 years has revealed
ported to the study site. Continuous monitoring of nitrogen       an active and remarkable spatial diversity of atmospheric ox-
oxides (NOx ) provided a measurement of a chemical tracer         idation chemistry in the polar lower atmosphere (Grannas
for exhaust plumes. Highly elevated levels of NOx (up to          et al., 2007). Ozone plays a fundamental role in control-
1000 × background) and lowered ozone (down to ≈ 50 %),            ling the lifetime of many atmospheric trace gases directly
most likely from reaction of ozone with nitric oxide, were        and indirectly by modulating atmospheric OH. Unlike the
measured in air from above and within the snowpack. Within        episodic ozone depletion events observed at coastal sites, the
5–15 min from observing elevated pollutant levels above the       opposite effect (i.e., ozone production) has been observed
snow, rapidly increasing and long-lasting concentration en-       in the Antarctic interior (Crawford et al., 2001; Helmig et
hancements were measured in snowpack air. While pollu-            al., 2007b, 2008a; Legrand et al., 2009, 2016). The discov-
tion events typically lasted only a few minutes to an hour        ery of ozone production chemistry in the remote and pristine
above the snow surface, elevated NOx levels were observed         Antarctic environment was rather surprising because hitherto
in the snowpack lasting from a few days to ≈ 1 week. GEM          photochemical production in the lower atmosphere had ex-
and formaldehyde measurements were less sensitive and cov-        clusively been associated with polluted urban environments
ered a shorter measurement period; neither of these species’      (Molina and Molina, 2004). Photochemical production and
                                                                  snowpack emissions of nitric oxides (NOx ) have been identi-

Published by Copernicus Publications on behalf of the European Geosciences Union.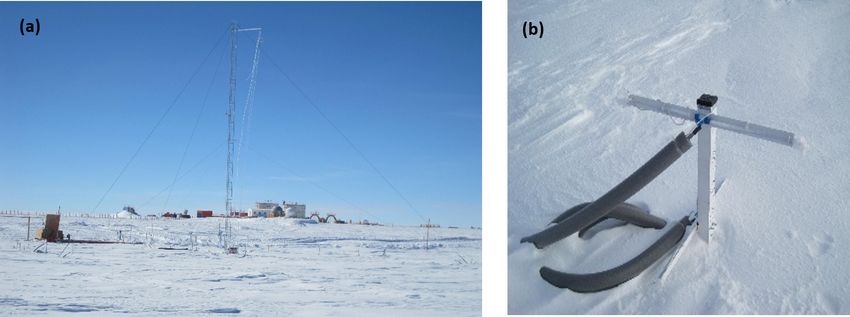
200                                       D. Helmig et al.: Impact of exhaust emissions on chemical snowpack composition

fied as underlying processes driving this chemistry. NOx has       episodes, using the NOx monitoring as a sensitive chemical
been shown to be formed from photochemical reactions in            tracer for identification of exhaust plumes.
the snowpack (Honrath et al., 1999; Jones et al., 2000), with
deposited nitrate constituting the reservoir of this chemistry.
NOx plays a crucial role in snow photochemical reactivity          2   Methods
(Murray et al., 2015). NOx mixing ratios in interstitial air re-
sulting from photochemical reactions can exceed those in the       Location
air above the snowpack by a factor of ≈ 50 (Van Dam et al.,
                                                                   This experiment was conducted at the French–Italian Antarc-
2015).
                                                                   tic research station Concordia, located at the Dome Circe or
   This concentration gradient is driving NOx emission
                                                                   Dome Charlie (Dome C, 75.10◦ S, 123.35◦ E, 3233 m a.s.l.,
fluxes out of the snowpack into the overlying atmosphere
                                                                   mean temperature – 55 ◦ C). An experimental site was estab-
(Jones et al., 2001; Honrath et al., 2002), which, under sta-
                                                                   lished at the border of the clean air sector, approximately
ble atmospheric conditions, can cause large NOx enhance-
                                                                   1 km to the west of the station common buildings (Fig. 1).
ments in the atmospheric surface layer (Helmig et al., 2008b;
                                                                   The clean air sector is located in the opposite direction
Neff et al., 2008; Frey et al., 2011, 2013), and in the presence
                                                                   of the prevailing wind direction. The site consisted of a
of solar irradiance trigger photochemical ozone production,
                                                                   8 m × 2 m × 2.5 m underground laboratory positioned at the
with resulting peak ozone levels that can be double those in
                                                                   border of the clean air area, a 10 m tall meteorological tower,
the atmospheric layer aloft (Crawford et al., 2001; Helmig et
                                                                   and two snow air sampling manifolds for sampling the atmo-
al., 2008a; Legrand et al., 2016). Experiments on reactive ni-
                                                                   sphere and the snow interstitial air (Fig. 2). The installation
trogen chemistry investigating this rather unexpected ozone
                                                                   was in late November 2012 with continuous monitoring con-
production chemistry have built on a variety of atmospheric
                                                                   ducted until January 2014 (14 months).
research strategies, including snowpack air sampling (Dibb
et al., 2002; Jacobi et al., 2004; Helmig et al., 2007a; Van       Meteorological tower
Dam et al., 2015), snow flux chambers (Dibb et al., 2002),
snow chemical analyses (Dassau et al., 2002; Dibb et al.,          A 10 m meteorological tower (Fig. 2a) was equipped with
2007b; France et al., 2011; Erbland et al., 2013), atmospheric     two sonic anemometers for atmospheric turbulence measure-
monitoring (Frey et al., 2011; Kramer et al., 2015; Legrand et     ments and three gas sampling inlets (0.5, 2, 10 m) with sam-
al., 2016), surface fluxes (Jones et al., 2001; Honrath et al.,    pling lines inside a heated conduit running to the laboratory.
2002; Frey et al., 2011, 2015), and boundary layer vertical        The upper inlet was attached to a manual pulley allowing
profiling (Helmig et al., 2008a; Frey et al., 2015).               it to be lowered for side-by-side sampling of both inlets for
   Most of these studies have relied on observations from          tracking and correcting sampling inlet and line biases.
dedicated campaigns at research stations, including photo-
chemistry campaigns at Summit, Greenland (Dibb et al.,             Snowpack air sampling
2007a), the Antarctic Tropospheric Chemistry Investigation
(ANTCI; Eisele and Davis, 2008) at the South Pole, the             Two identical multi-inlet snow sampling manifolds (“snow
Chemistry of the Antarctic Boundary Layer and the Inter-           tower”) for collection of interstitial and ambient air were con-
face with Snow (CHABLIS) experiment at Halley (Jones et            structed, with a design similar to that described by Seok et
al., 2008), and the Oxidant Production over Antarctic Land         al. (2009) (Fig. 2b). The snow tower consisted of a vertical
and its Export (OPALE) campaign at Concordia Station (Pre-         post of square aluminum alloy (3.8 cm × 3.8 cm) with eight
unkert et al., 2012). A common limitation of these studies         60 cm long cross arms spaced vertically every 20 cm. Each
is that experiments were conducted in proximity to research        of the cross bars supported a pair of sampling inlets. The
stations, where use of fuel-powered engines in generators and      inlets were fitted with 25 mm Acrodisc hydrophobic polyte-
vehicles causes exhaust emissions with highly elevated con-        trafluoroethylene (PTFE) syringe filters (Pall Life Sciences,
centrations of particulates and gases, particularly of volatile    Ann Arbor, Michigan, USA) to prevent snow and ice crystals
organic compounds (VOCs) and NOx . A critical question is          from being pulled into the sampling line. For the installation,
if and how this pollution, and possibly secondary products         a snow pit was dug and the inlets were inserted horizontally
formed during the atmospheric transport and deposition, im-        into the clean untouched walls of the pit. The hole was then
pacts the snow chemical position and reactivity, and poten-        loosely refilled with the excavated snow, re-establishing the
tially the findings from this aforementioned literature. This      stratigraphy as much as possible. Blowing snow then refilled
is of particular importance for oxidized nitrogen species.         any remaining gaps within the following 2–3 d. The snow
   This study yielded, for the first time, a year-long record      tower was kept in place after the campaign, so we have no
of NOx and O3 in an Antarctic snowpack at Concordia and            data on the potential changes in porosity and air flow dynam-
the atmosphere above it. This experiment also gave us the          ics that resulted from the installation and subsequent changes
opportunity to study and evaluate occurrences of pollution         in the snow morphology as the snowpack re-equilibrated. In-
                                                                   sulated and heated sampling lines connected the sampling in-

The Cryosphere, 14, 199–209, 2020                                                       www.the-cryosphere.net/14/199/2020/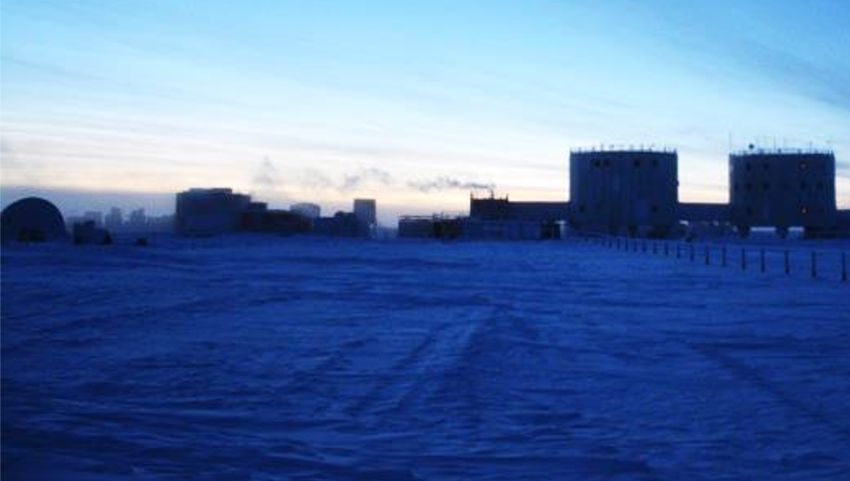
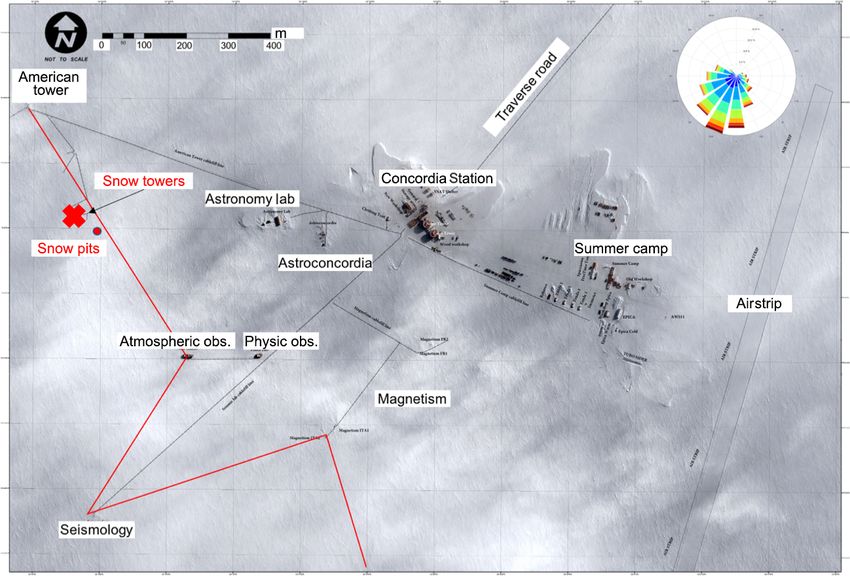
D. Helmig et al.: Impact of exhaust emissions on chemical snowpack composition                                                            201

Figure 1. Satellite image of research station Concordia with location of the snow photochemistry experiment indicated by the red text and
cross marker. Its location was ∼ 1 km west of the station main buildings and power generation plant. The map also indicates the location
where the snow pits were collected, the border of the clean air sector (which is west of the red line), and a wind rose for a full year of wind
data collected from the met tower that was adjacent to the snow tower manifolds (Pléiades satellite image courtesy of Airbus Defence and
Space SAS, CNES, 2016).

Figure 2. (a) Meteorological tower with the station infrastructure in the background. The wooden box to the left is the entry hatch to the
underground laboratory. Air sampling inlets were located at 0.5, 2, and 10 m above the surface on the tower. Two snowpack air sampling
towers were located approximately 7 m to the left and 10 m to the right of the base of the meteorological tower. (b) One of the two snowpack
air sampling manifolds (snow tower), with one pair of inlets right on the snow surface and one inlet pair at ∼ 30 cm height. Four more
equivalent sampling inlet pairs are below the snow surface at 30 cm depth intervals extending to a maximum depth of 1.2 m (see Fig. 1 in
Van Dam et al., 2015, for a schematic of a similar installation at Summit, Greenland).

www.the-cryosphere.net/14/199/2020/                                                                 The Cryosphere, 14, 199–209, 2020
202                                     D. Helmig et al.: Impact of exhaust emissions on chemical snowpack composition

lets to the chemical analyzers in the underground laboratory.
All sampling lines were of 0.64 cm o.d. × 30 m long pre-
conditioned perfluroalkoxy (PFA) tubing, except the lines to
the gradient inlets on the meteorological tower, which were
of 0.78 cm o.d. These were continuously purged to main-
tain a flow of at least 2 L min−1 . Air was pulled through the
snow tower sampling lines by the combined flow of the gas
analyzers (ozone monitor at 1 L min−1 , a gaseous elemen-
tal mercury (GEM) analyzer at 1 L min−1 , NOx monitor at
1 L min−1 ). Only two monitors sampled from the snow tower
inlets together at a given time to limit the maximum snow
air sampling. Since each line connected to a pair of inlets
at equal height, the effective flow through each inlet was ≈     Figure 3. Photograph of Concordia Station illustrating the disper-
1 L min−1 . Each height was sampled for 10 min every 2 h,        sion of the exhaust plume from the electrical power generating plant
resulting in the approximate volume of a sphere with a ra-       during conditions with a strong surface temperature inversion. The
dius of 25 cm around each inlet every 2 h. Sampling from the     plume dissipated toward the west in the direction of the experimen-
two snow towers was alternated every 24 h. Each sampling         tal site. This is a typical situation for a contamination event.
inlet had a thermocouple wire attached for monitoring of the
snowpack temperature gradient.
                                                                 the instrument response was linear within this range. Inter-
Ozone measurements                                               cept values of the linear regression, and zero values from
                                                                 sampling of the scrubbed air, were below 0.1 ppb.
Ozone was measured with a Thermo Environmental (TEI)
49i UV absorption monitor that was calibrated against a          Formaldehyde measurements
NOAA Global Monitoring Division reference standard be-
                                                                 Formaldehyde was measured with a commercial analyzer by
fore field shipment.
                                                                 liquid fluorimetry. Details of the measurement, instrument
                                                                 characterization, and deployment at Concordia Station have
NOx measurements
                                                                 been provided by Preunkert et al. (2015).
Nitrogen oxides were monitored with a TEI chemilumines-          Gaseous elemental mercury measurements
cence analyzer (TEI 42C-TL). The TEI 42C-TL has two
channels. The first channel measures NO via NO + O3              GEM was measured with a commercial Tekran model 2537
chemiluminescence. The second channel measures total ni-         instrument. The measurement protocol and calibration and
trogen oxides (NOx = NO + NO2 ) by redirecting air through       instrument characterization details are available in Angot et
a heated (325 ◦ C) molybdenum converter, which causes NO2        al. (2016).
– including other oxidized nitrogen compounds – to be con-
verted to NO. NO2 is then determined by subtracting NO,          Snow sampling and NO−
                                                                                     3 determination
obtained from the first channel, from the resulting NOx sig-
nal. There are a number of other oxidized nitrogen species       The snow pit NO−  3 data stem from sampling that was done
that can contribute to the NO2 measurement (Steinbacher          at and near Concordia between January 2009 and Decem-
et al., 2007). The error in the NO2 measurement increases        ber 2010, and at ≈ 3 m distance from snow tower 2 in Jan-
with rising levels of interfering gases such as nitrous acid     uary 2014. Snow was collected in pre-cleaned 50 mL cen-
(HONO), peroxyacetyl nitrate (PAN), and alkyl nitrates that      trifuge tubes inserted directly on a newly scraped wall of a
contribute to the NO2 -mode signal. Consequently, NO2 con-       snow pit. Nitrate concentration in snow samples was mea-
centrations obtained with the TEI 42C-TL represent an esti-      sured directly in the field, at the wet chemistry laboratory
mate for the sum of these oxidized nitrogen species. Field       of Concordia Station. Each sample was melted at room tem-
calibrations were conducted with a NIST-traceable 1 ppm          peratures and NO− 3 concentrations were determined using a
NO in N2 gas standard (Scott-Marrin, Inc., Riverside, CA,        colorimetric method employed routinely at Concordia (Frey
USA) that was dynamically diluted to low-parts-per-billion       et al., 2009).
mixing ratios. We did not bring a zero-air compressed gas
cylinder to Concordia. Instead, a low-NOx dilution gas was
prepared by pumping ambient air (which had significantly
lower NOx levels than snowpack air) through a cartridge
filled with ≈ 1 dm3 of granular chemisorbent (Purafil, Do-
raville, GA). Calibration ranges were from 0.1 to 25 ppb, and

The Cryosphere, 14, 199–209, 2020                                                       www.the-cryosphere.net/14/199/2020/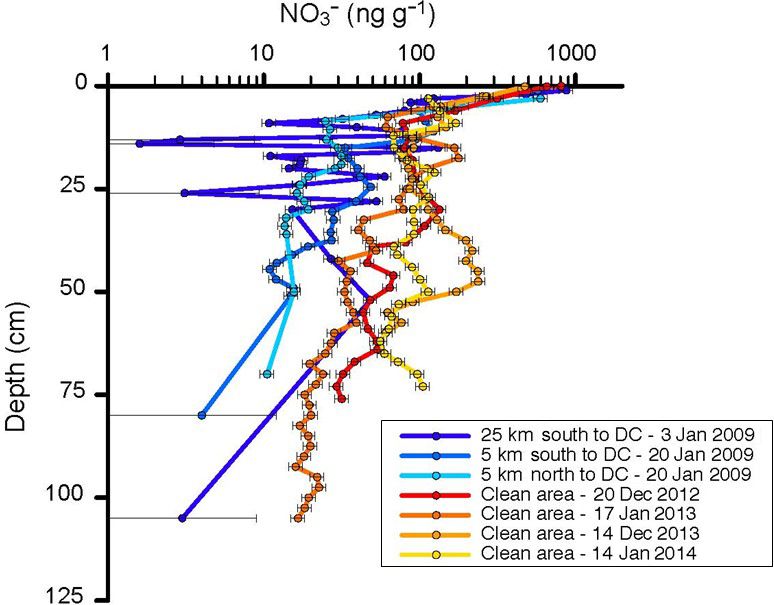
D. Helmig et al.: Impact of exhaust emissions on chemical snowpack composition 203
3 Results and discussion
Results of the year-round snowpack and ambient monitor-
ing, including interpretations on photochemistry, will be pre-
sented elsewhere (Helmig et al., 2020). Here, we primarily
focus on occurrences of pollution transport to the sampling
site and its penetration into the snowpack.
Figure 3 shows a photograph of the station main buildings.
The power plant is adjacent to the two-column structure. Ap-
proximately 300 m3 of Special Antarctic Blend (SAB) diesel
fuel are burned in the plant for electricity and heat generation
per year. The exhaust plume from the 5 m high stack of the
power plant can be seen in the picture, blowing towards the
west. Due to the typical strong stratification and stability of
the atmosphere near the surface, the plume does not rise far
above the stack height, but instead gets transported horizon- Figure 4. NOx measured from the above-surface inlets on the two
tally at a height of ≈ 5–10 m above the snow surface. This is snow towers and from all inlets on the meteorological tower. Cir-
cles represent 10 min averaged data. Plotted are data that were ex-
a typical exhaust plume dispersion behavior for a cold-region
tracted from occurrences when NOx was above 1 ppb, well above
environment, seen at many other polar research stations. The
the background mixing ratio, and any time when the wind direction
plume typically does not hit the surface within the immedi- was from the polluted wind sector.
ate distance of the stack location. Depending on the actual
turbulent mixing conditions, it may take several hundred me-
ters before the stack emissions are encountered right at the
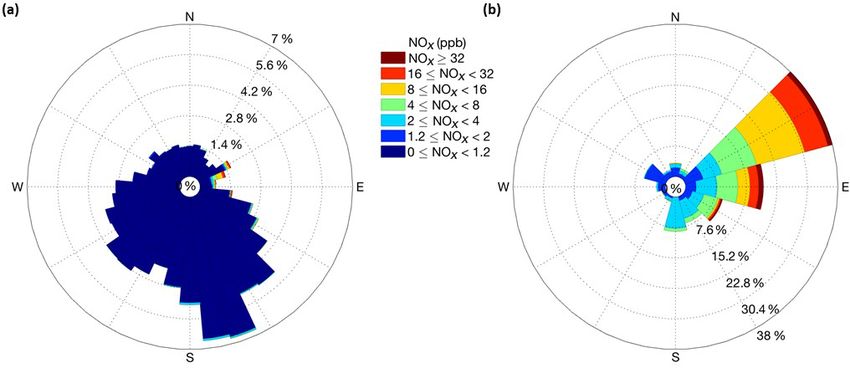
surface. the entire campaign, pollution episodes constituted < 2.0 %
Of the gases monitored in this experiment, NOx was the of the measurements above the snowpack and < 10 % of the
most sensitive tracer for pollution impact. We chose to con- measurements within the snowpack. The correlation analyses
centrate on NOx as the total of NO + NO2 , as this is a of pollution occurrences with wind direction clearly define
more representative indicator for the total amount of oxidized the direction of the transport. The predominant wind direc-
nitrogen, whereas NO would only indicate a fraction. Fur- tion sector at Concordia is southeast to northwest (Fig. 5a),
ther, the fractionation between NO and NOx is sensitive to with southeasterly winds having the overall largest share.
other gases (such as ozone) and residence time and snowpack NOx levels were consistently well below 1 ppb when winds
depth. Therefore, interpretation of NO data is more ambigu- were from the southeast to northeast. The sector with pol-
ous. NOx in ambient air at Concordia remained well below lution transport is well defined, with wind directions cover-
1 ppb during background conditions year-round (Helmig et ing approximately 45–120◦ (Fig. 5b). These sectors perfectly
al., 2020), in agreement with observations from prior shorter line up with the upwind direction of the station power plant
campaign NOx measurement at Concordia (Frey et al., 2011, (Fig. 1), clearly identifying the plant as the source of these
2013, 2015). We only observed elevated NO levels during pollution occurrences.
pollution events. There were no elevated NO conditions that One of these elevated NOx events is further investigated in
could be traced to snowpack emissions, similar to what has Fig. 6. Here, we show the measurements from six inlets on
been reported from the South Pole (Helmig et al., 2008b; each of the two snow towers over a 1-week period. The sam-
Neff et al., 2008). During pollution events, the 1 ppb thresh- pling of a polluted plume is first observed in the two above-
old was exceeded very quickly in measurements taken from surface inlets (orange/red colored data; +10 and +45 cm), by
the meteorological tower and from above-surface snow tower the sudden increase in NOx from well below 1 ppb to a mix-
inlets, with resulting NOx mixing ratios rising to as high as ing ratio of ≈ 13 ppb. This spike in NOx lasted for ≈ 3 h. Af-
close to 200 ppb, representing an up to 1000-fold enhance- ter that time, NOx in air sampled above the surface dropped
ment over background conditions (Fig. 4). very quickly and equilibrated to prior mixing ratios within
During the course of the ≈ 14 month study, a total of ≈ 50 less than 0.5 h.
pollution events were observed, although some events over- A much different behavior was found in the air sampled
lapped (Fig. 4). Most of these occurrences were relatively from within the snowpack, indicated by the data in the shades
short, with elevated mixing ratios above the snowpack last- of blue. The onset of the pollution signal is delayed, by 1–
ing from minutes to a few hours. We counted 15 events in 3 h, with progressively later times deeper in the snowpack.
total when there was a spike in the above-surface NOx mea- Maximum mixing ratios that are reached in the snowpack are
surements followed by an increase of at least 1 ppb of NOx lower, i.e., 10 %–50 % of those that were measured above the
in snowpack air. It took up to in excess of 7 d for NOx in the surface, with mixing ratio maxima becoming progressively
snowpack air to return to pre-event levels. Integrated over smaller with increasing depth. The most remarkable differ-
www.the-cryosphere.net/14/199/2020/ The Cryosphere, 14, 199–209, 2020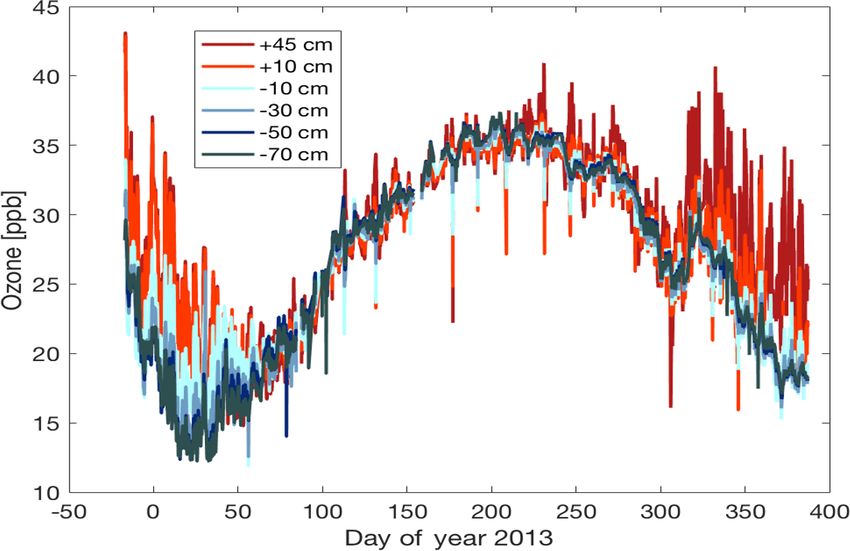
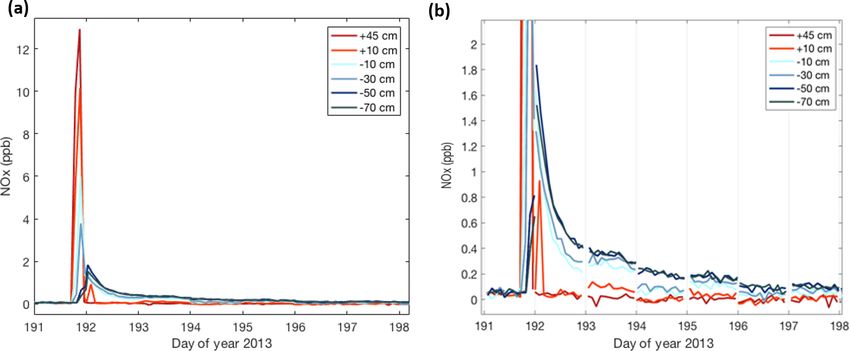
204                                         D. Helmig et al.: Impact of exhaust emissions on chemical snowpack composition

Figure 5. (a) Concentration wind rose with the relative frequency of NOx mixing ratio data from the above-surface inlets of the two snow
towers segregated by 10◦ sectors for the full year of observation data. This panel shows all data. (b) The same analysis, with wind direction
data binned in 20◦ sectors for events when NOx in ambient air exceeded 1.2 ppb.

Figure 6. Combined measurements from the two snow towers capturing a pollution event at Concordia during the middle of the winter (day
of year 191 = 11 July). Plotted time series traces correspond to the sampling heights indicated in the legend, with positive numbers giving
the height above the snow surface and negative numbers the depth below the snow surface. Panel (b) is an enlargement of the data shown in
panel (a) with the transitions between the connecting lines between two snow tower measurements removed to show the level of agreement
in the data from the two sampling manifolds. The sampling switched between the two snow towers every 24 h, leading to some abrupt shifts
in the snowpack NOx measurements.

ence between the above- and below-surface measurements is                ting of the data to an exponential decay function yields simi-
the longer residence time of the pollution signal in the snow-           lar results for all snowpack depths (Fig. 7), with exponential
pack. NOx mixing ratios in air withdrawn from all sampling               regression fit R 2 results of >0.95.
inlets in the snowpack dropped steadily, but remained ele-                  Effects of the exhaust transport were also observed in the
vated in comparison to levels seen before the pollution event            ozone signal. The ozone record, shown in Fig. 8, shows a
for ≈ 1 week. The behavior seen in the measurements from                 plethora of short positive and negative spikes superimposed
snow tower 1 were in full qualitative agreement and within               on the annual cycle. The up to 15–20 ppb sudden ozone
≈ 30 % quantitative agreement with the observations from                 increases seen during the austral summer months are at-
the second snow tower. After the pollution event, NOx in the             tributable to the photochemical ozone production events that
snowpack air steadily declined over several days (Fig. 6). Fit-          occur in the surface layer of the Antarctic Plateau (see dis-

The Cryosphere, 14, 199–209, 2020                                                               www.the-cryosphere.net/14/199/2020/
D. Helmig et al.: Impact of exhaust emissions on chemical snowpack composition                                                     205

                                                                           Enhancements in formaldehyde in ambient samples sus-
                                                                        pected to be influenced by station emissions have previously
                                                                        been noted in measurements taken during the OPALE cam-
                                                                        paign (Preunkert et al., 2015). We therefore investigated if
                                                                        pollution signatures were present in formaldehyde measure-
                                                                        ments taken in the record from our study. Furthermore, we
                                                                        revisited the GEM measurements taken during the campaign
                                                                        (Angot et al., 2016). Both of these measurements did not
                                                                        quite have the same time resolution and sensitivity as the
                                                                        NOx and ozone monitoring. Formaldehyde measurements
                                                                        overlapped with the ozone and NOx monitoring only for a
                                                                        short period during the 2012/2013 austral summer, and this
                                                                        measurement period suffered from a number of instrument
                                                                        problems. The remaining data did not allow a conclusive
                                                                        evaluation on the behavior of formaldehyde in the snowpack
                                                                        during pollution events. Similarly, we did not identify a clear
                                                                        signature of GEM changes in snowpack air that correlated
Figure 7. Exponential decay function fits to the NOx snowpack           with the NOx enhancements during pollution events.
measurements versus time at four depths for the event starting on          Nitrogen oxides undergo reaction with atmospheric oxi-
day of year 191 shown in Fig. 6. The start of the event was defined     dants, primarily the OH radical (summer only) and ozone,
as the time when high NOx was detected above the snowpack. So-          yielding higher oxidized nitrogen species that can partition
lutions for the best fit exponential decay functions are given in the   into the snowpack aqueous and solid phases. The frequency,
legend.                                                                 large enhancement, and long duration (in the snowpack) of
                                                                        NOx pollution events constitute an apparent unnatural source
                                                                        of NOx to the snowpack. One can hypothesize that reaction
                                                                        of NO and NO2 with OH may be a source of HNO2 and
                                                                        HNO3 in the snowpack, which would add acidity to the snow.
                                                                        This then also poses the question of whether and to what de-
                                                                        gree photochemical processes, building for instance on NO−   2
                                                                        or NO−  3 as a substrate, may be altered from natural condi-
                                                                        tions. However, the overall quantitative effect is likely rel-
                                                                        atively minor given the large overall NO−  3 reservoir in the
                                                                        solid phase of the snowpack.
                                                                           We investigated this question by comparing NO−     3 results
                                                                        from snow pit sampling at different locations within the camp
                                                                        and at up to a 25 km distance from Concordia Station. Ni-
                                                                        trate in the snowpack shows a steep vertical gradient, with
                                                                        the highest levels observed right at the surface and progres-
                                                                        sively lower concentrations with increasing depth (see Fig. 9
Figure 8. Ozone measured from the snow tower inlets throughout
                                                                        and Supplement Fig. S1 for a summary graph where data
the year. Negative spikes in the data coincide with elevated NOx
                                                                        from both groups were combined and binned in 15 cm depth
from exhaust infiltration in the snowpack.
                                                                        intervals). The results from the seven snow pits are consis-
                                                                        tent in the depth profile; however, there appears to be a ten-
                                                                        dency that the four snow pits within the camp have some-
cussion in the introduction section). Occurrences of these              what higher as well as more variable snow NO−       3 . Deeper
elevated ozone events at Concordia Station have previously              into the snowpack, the difference between the two groups of
been investigated by Legrand et al. (2009) and Cristofanelli            data becomes stronger. At 1 m depth, the snow age is approx-
et al. (2018). In addition to these positive ozone spikes, this         imately 10 years and therefore approximately corresponds
annual record also shows numerous sudden negative ozone                 to the start of permanent and year-round activities in 2005
changes that can be attributed to destruction of ozone by titra-        (note that summer activities at Concordia Station were es-
tion of NO in the exhaust plume. Up to 50 % of the ambient              tablished in 1996). Similar vertical NO− 3 concentration pro-
ozone was destroyed in air sampled from the above-surface               files in the Antarctic snowpack have previously been docu-
inlets. Similar to NOx , this signal, albeit weaker and attenu-         mented (France et al., 2011). Further, relatively higher NO− 3
ated in time, was also seen in the air sampled from within the          concentrations (approximately 5 times) are observed in the
snowpack (Fig. 8).                                                      upper layers of the snowpack during the Antarctic summer

www.the-cryosphere.net/14/199/2020/                                                             The Cryosphere, 14, 199–209, 2020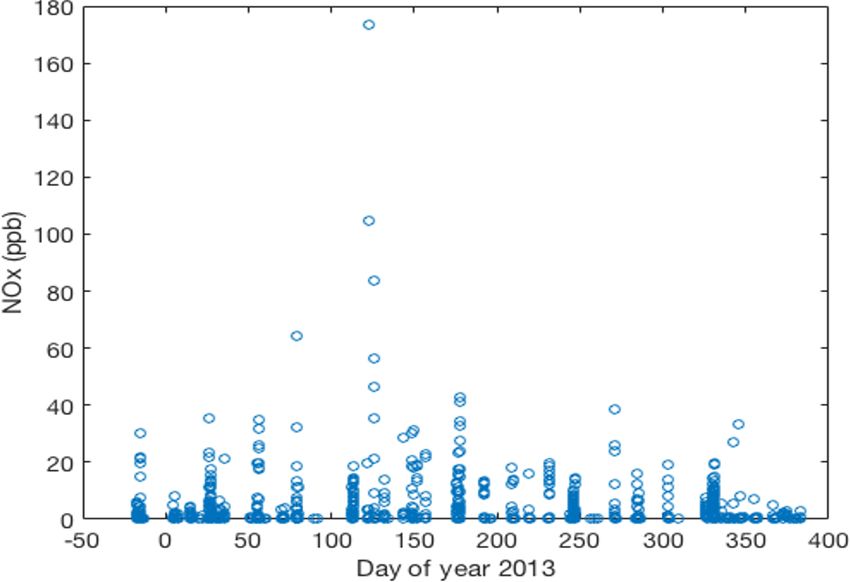
206                                          D. Helmig et al.: Impact of exhaust emissions on chemical snowpack composition

                                                                        a number of dynamic flow-through snow chamber photo-
                                                                        chemistry experiments were conducted to investigate if there
                                                                        were differences in the reactive chemistry in the snow from
                                                                        near the snow tower site compared to snow sampled 25 km
                                                                        away from camp. These measurements showed on the order
                                                                        of 10 %–20 % higher NOx and less ozone in the outflow of
                                                                        chambers filled with the snow from further away from the
                                                                        camp. We did not conduct a high enough number of repeats
                                                                        for evaluating the repeatability and statistical significance of
                                                                        these results to gauge whether and how much of this signal
                                                                        was due to the experimental setup or due to differences in
                                                                        the snowpack chemical composition. Nonetheless, these pre-
                                                                        liminary findings point towards possible differences in the
                                                                        chemical behavior that potentially are linked to differences in
                                                                        the snow sampling locations and contaminant levels resulting
                                                                        from camp influences that warrant further investigation.

Figure 9. Nitrate concentration in snow pits in proximity (≈ 20 m)
to the snow towers at the border of the clean air sector (warm col-
                                                                        4   Summary and conclusions
ors), and sampling locations up- and downwind of Concordia (cold
colors). Sampling dates are indicated in the figure legend. Horizon-
tal error bars depict the estimated uncertainty of the chemical anal-
                                                                        With our snowpack sampling manifold we were able to sam-
ysis, i.e., 10 % at > 10 ng g−1 , 50 % between 5 and 10 ng g−1 , and    ple snowpack air to a maximum depth of 70 cm below the
100 % at < 5 ng g−1 .                                                   surface. Up to ≈ 2 ppb enhancements in NOx were observed
                                                                        at that depth from exhaust infiltration. While our experiment
                                                                        was not able to access air deeper (than 70 cm), the observed
                                                                        concentration gradients imply that this transport and contam-
(Supplement Fig. S2) than during the winter. This NO−     3 en-         ination extend well beyond the depth that was probed in these
hancement in surface snow and the seasonal cycle have been              measurements.
linked to the production of HNO3 in the photoactive summer                 This experiment was a one-spot measurement, at ≈ 1 km
months from reaction of OH with NO2 , with the NO−        3 en-         from the camp main facilities. We have no data that would
hancement being the result of HNO3 deposition to the snow               allow us to assess to what distance from the camp the snow-
surface (Erbland et al., 2013). Elevated NO−   3 concentrations         pack pollution from exhaust infiltration would be noticeable
observed at the surface of the snowpack are a common fea-               and of importance, but it likely extends well beyond the dis-
ture in low-accumulation regions, with the concentration val-           tance of our site.
ues depending strongly on the strategy for collection of the               Several other previous studies have noted challenges in
first few centimeters of the snowpack (Erbland et al., 2013;            sampling clean air at polar research sites that stem from pol-
Shi et al., 2018). With the sensitivity of surface snow NO−3 to         lution caused by camp exhaust. For atmospheric sampling,
the seasonal cycle and the high variability of NO−   3 observed         this interference can be mitigated by careful postprocess-
in surface snow and vertical profiles, the currently available          ing/filtering of the monitoring data, or by interrupting the
data do not allow a conclusive quantitative assessment of the           sampling during unfavorable wind conditions, which is par-
degree to which the snowpack at Concordia is chemically                 ticularly critical for integrated aerosol collection (Wolff and
impaired by ventilation of the snowpack with pollution-NOx -            Cachier, 1998; Wolff et al., 1998). Our experiments from
enriched air. Contamination of the snowpack around Concor-              Concordia Station emphasize the pronounced and longer-
dia Station has been noted in previous investigations. War-             lasting influence that station exhaust can have on NOx lev-
ren et al. (2006) reported an > 3-fold increase in snowpack             els inside the snowpack air (compared to ambient air). A
black carbon concentration after the station was established            tendency of potentially enhanced snowpack NO−        3 levels in
in 2003, with black carbon levels in pre-2003 snow (from                two snow pits collected at the camp, compared to data from
deeper depths) also being in closer agreement with snow col-            three sites at a further distance, supports the suspicion that
lected a further distance from the station. Black carbon is             the snowpack chemical oxidized nitrogen composition at the
one of the contributing factors for a decrease in light pen-            station may be compromised (i.e., contaminated) from the
etration into the snowpack (Warren et al., 2006; France et              re-occurring ventilation of the snowpack with polluted air.
al., 2011; Libois et al., 2013). Consequently, the increased            A similar conclusion was derived from δ 15 N nitrate analy-
presence of black carbon causes a shallower e-folding depth             ses of snow at Summit: samples collected in the predominant
compared to pristine, uncontaminated snow. In addition to               downwind direction of the station generator showed an iso-
the experiments described above, during the 2014 campaign               topic signature that had a stronger association with engine

The Cryosphere, 14, 199–209, 2020                                                            www.the-cryosphere.net/14/199/2020/
D. Helmig et al.: Impact of exhaust emissions on chemical snowpack composition 207
exhaust than samples collected at a further distance (Fibiger vestissements d’avenir – ANR10 LABX56), and the program 1011
et al., 2016). Even in the Summit clean air sector, elemental SUNITEDC of the Institut Polaire Paul Emile Victor (IPEV). The
carbon in snow was 1.8–2.4 times higher than in snow col- US scientists were supported through a grant from the National Sci-
lected 10–20 km from the camp (Hagler et al., 2008). The ence Foundation (NSF), PLR#1142145.
associations shown in our study argue for further investiga-
tion, for instance by a high-resolution spatial survey of sur-
face snow composition within and beyond camp boundaries. Review statement. This paper was edited by Martin Schneebeli and
reviewed by two anonymous referees.
Given the strong seasonality of NO− 3 , this survey should be
performed with as close as possible concurrently conducted
snow sampling at selected locations to minimize the influ-
ence of temporal changes on the NO− 3 signature.
These observations emphasize concerns about the repre- References
sentativeness of experimental snow chemistry data collected
within a polar research camp periphery. This raises the ques- Angot, H., Magand, O., Helmig, D., Ricaud, P., Quennehen,
tion of how interpretations from such experiments reflect B., Gallée, H., Del Guasta, M., Sprovieri, F., Pirrone, N.,
Savarino, J., and Dommergue, A.: New insights into the atmo-
conditions in the remote polar environment. Furthermore, our
spheric mercury cycling in central Antarctica and implications
findings should motivate comparison studies with sampling on a continental scale, Atmos. Chem. Phys., 16, 8249–8264,
along transects at a further distance from the main camp fa- https://doi.org/10.5194/acp-16-8249-2016, 2016.
cilities. Comparison of these observations will likely yield Crawford, J. H., Davis, D. D., Chen, G., Buhr, M., Oltmans, S.,
new insights for evaluating prior polar research site observa- Weller, R., Mauldin, L., Eisele, F., Shetter, R., Lefer, B., Arimoto,
tions and interpretation of snow photochemistry in the glacial R., and Hogan, A.: Evidence for photochemical production of
snowpack. ozone at the South Pole surface, Geophys. Res. Lett., 28, 3641–
3644, https://doi.org/10.1029/2001gl013055, 2001.
Cristofanelli, P., Putero, D., Bonasoni, P., Busetto, M., Cal-
Data availability. Data are available at the Arctic Data Center zolari, F., Camporeale, G., Grigioni, P., Lupi, A., Petkov,
(https://doi.org/10.18739/A2FP03, Helmig, 2017). B., Traversi, R., Udisti, R., and Vitale, V.: Analysis of
multi-year near-surface ozone observations at the WMO/GAW
“Concordia” station (75 degrees 060 S, 123 degrees 200 E,
Supplement. The supplement related to this article is available on- 3280 m a.s.l. – Antarctica), Atmos. Environ., 177, 54–63,
line at: https://doi.org/10.5194/tc-14-199-2020-supplement. https://doi.org/10.1016/j.atmosenv.2018.01.007, 2018.
Dassau, T. M., Sumner, A. L., Koeniger, S. L., Shepson, P.
B., Yang, J., Honrath, R. E., Cullen, N. J., Steffen, K., Ja-
cobi, H. W., Frey, M., and Bales, R. C.: Investigation of
Author contributions. DH oversaw the study, participated in field-
the role of the snowpack on atmospheric formaldehyde chem-
work, conducted data analyses and quality control, and prepared
istry at Summit, Greenland, J. Geophys. Res., 107, 4394,
the manuscript. DL conducted data analyses and quality control,
https://doi.org/10.1029/2002JD002182, 2002.
prepared figures, and contributed to the paper preparation. JH fab-
Dibb, J. E., Arsenault, M., Peterson, M. C., and Honrath, R. E.:
ricated the instrumental equipment and data acquisition system and
Fast nitrogen oxide photochemistry in Summit, Greenland snow,
participated in the fieldwork. JS contributed to the study design, par-
Atmos. Environ., 36, 2501–2511, 2002.
ticipated in fieldwork, conducted data analyses and interpretation,
Dibb, J. E., Albert, M., Courville, Z., Anastasio, C., Galbavy, E.
and contributed to the manuscript preparation.
S., Atlas, E., Beyersdorf, A. J., Blake, D. R., Meinardi, S., Row-
land, F. S., Swanson, A. L., Blake, N. J., Bocquet, F., Cohen, L.,
Helmig, D., Burkhart, J. F., Frey, M. M., Friel, D. K., Hutterli,
Competing interests. The authors declare that they have no conflict M. A., Chen, G., Conway, T. J., and Oltrnans, S. J.: An overview
of interest. of air-snow exchange at Summit, Greenland: Recent experiments
and findings, Atmos. Environ., 41, 4995–5006, 2007a.
Dibb, J. E., Whitlow, S. I., and Arsenault, M.: Seasonal
Acknowledgements. We thank all staff and scientists who helped variations in the soluble ion content of snow at Sum-
with the setup and maintenance of the experiment at Concordia Sta- mit. Greenland: Constraints from three years of daily
tion. Alexandra Mass, William Vicars, and Albane Barbero helped surface snow samples, Atmos. Environ., 41, 5007–5019,
with some of the field experimental work and data processing. Al- https://doi.org/10.1016/j.atmosenv.2006.12.010, 2007b.
bane Barbero provided the photograph in Fig. 3. Eisele, F. L. and Davis, D. D.: Antarctic tropospheric chemistry
investigation (ANTCI) 2003, Atmos. Environ., 42, 2747–2748,
https://doi.org/10.1016/j.atmosenv.2007.09.074, 2008.
Financial support. The French partners recognize technical sup- Erbland, J., Vicars, W. C., Savarino, J., Morin, S., Frey, M. M.,
port from the C2FN (French National Center for Coring and Frosini, D., Vince, E., and Martins, J. M. F.: Air–snow transfer of
Drilling, handled by INSU), a grant from Labex OSUG@2020 (In- nitrate on the East Antarctic Plateau – Part 1: Isotopic evidence
for a photolytically driven dynamic equilibrium in summer, At-
www.the-cryosphere.net/14/199/2020/ The Cryosphere, 14, 199–209, 2020208 D. Helmig et al.: Impact of exhaust emissions on chemical snowpack composition mos. Chem. Phys., 13, 6403–6419, https://doi.org/10.5194/acp- face ozone in the polar regions, Atmos. Environ., 41, 5138–5161, 13-6403-2013, 2013. https://doi.org/10.1016/j.atmosenv.2006.09.053, 2007b. Fibiger, D. L., Dibb, J. E., Chen, D., Thomas, J. L., Burkhart, Helmig, D., Johnson, B., Oltmans, S. J., Neff, W., Eisele, J. F., Huey, L. G., and Hastings, M. G.: Analysis of nitrate F., and Davis, D. D.: Elevated ozone in the bound- in the snow and atmosphere at Summit, Greenland: Chem- ary layer at South Pole, Atmos. Environ., 42, 2788–2803, istry and transport, J. Geophys. Res.-Atmos., 121, 5010–5030, https://doi.org/10.1016/j.atmosenv.2006.12.032, 2008a. https://doi.org/10.1002/2015jd024187, 2016. Helmig, D., Johnson, B. J., Warshawsky, M., Morse, T., Neff, W. France, J. L., King, M. D., Frey, M. M., Erbland, J., Picard, G., D., Eisele, F., and Davis, D. D.: Nitric oxide in the boundary- Preunkert, S., MacArthur, A., and Savarino, J.: Snow optical layer at South Pole during the Antarctic Tropospheric Chemistry properties at Dome C (Concordia), Antarctica; implications for Investigation (ANTCI), Atmos. Environ., 42, 2817–2830, 2008b. snow emissions and snow chemistry of reactive nitrogen, At- Helmig, D., Hueber, J., Liptzin, D., and Savarino, J.: Photo-reactive mos. Chem. Phys., 11, 9787–9801, https://doi.org/10.5194/acp- gases in the snowpack, atmosphere, and their surface exchanges 11-9787-2011, 2011. at Dome C, Antarctica, J. Geophys. Res., in preparation, 2020. Frey, M. M., Savarino, J., Morin, S., Erbland, J., and Martins, J. Honrath, R. E., Peterson, M. C., Guo, S., Dibb, J. E., Shepson, P. B., M. F.: Photolysis imprint in the nitrate stable isotope signal in and Campbell, B.: Evidence of NOx production within or upon snow and atmosphere of East Antarctica and implications for ice particles in the Greenland snowpack, Geophys. Res. Lett., 26, reactive nitrogen cycling, Atmos. Chem. Phys., 9, 8681–8696, 695–698, 1999. https://doi.org/10.5194/acp-9-8681-2009, 2009. Honrath, R. E., Lu, Y., Peterson, M. C., Dibb, J. E., Arsenault, M. Frey, M. M., Brough, N., France, J. L., Erland, J., King, M. D., A., Cullen, N. J., and Steffen, K.: Vertical fluxes of NOx , HONO, Savarino, J., Anderson, P., Jones, A., and Wolff, E. W.: Atmo- and HNO3 above the snowpack at Summit, Greenland, Atmos. spheric nitrogen oxides (NO and NO2 ) at Dome C: first obser- Environ., 36, 2629–2640, 2002. vations & implications for reactive nitrogen cycling above the Jacobi, H. W., Bales, R. C., Honrath, R. E., Peterson, M. East Antarctic Ice Sheet, presented at Air-Ice Chemistry Inter- C., Dibb, J. E., Swanson, A. L., and Albert, M. R.: Re- actions workshop, 6–7 June, Columbia University, New York, active trace gases measured in the interstitial air of surface USA, 2011. snow at Summit, Greenland, Atmos. Environ., 38, 1687–1697, Frey, M. M., Brough, N., France, J. L., Anderson, P. S., Traulle, https://doi.org/10.1016/j.atmosenv.2004.01.004, 2004. O., King, M. D., Jones, A. E., Wolff, E. W., and Savarino, J.: Jones, A. E., Weller, R., Wolff, E. W., and Jacobi, H. W.: Speciation The diurnal variability of atmospheric nitrogen oxides (NO and and rate of photochemical NO and NO2 production in Antarctic NO2 ) above the Antarctic Plateau driven by atmospheric stabil- snow, Geophys. Res. Lett., 27, 345–348, 2000. ity and snow emissions, Atmos. Chem. Phys., 13, 3045–3062, Jones, A. E., Weller, R., Anderson, P. S., Jacobi, H. W., Wolff, E. W., https://doi.org/10.5194/acp-13-3045-2013, 2013. Schrems, O., and Miller, H.: Measurements of NOx emissions Frey, M. M., Roscoe, H. K., Kukui, A., Savarino, J., France, J. L., from the Antarctic snowpack, Geophys. Res. Lett., 28, 1499– King, M. D., Legrand, M., and Preunkert, S.: Atmospheric ni- 1502, 2001. trogen oxides (NO and NO2 ) at Dome C, East Antarctica, dur- Jones, A. E., Wolff, E. W., Salmon, R. A., Bauguitte, S. J.-B., ing the OPALE campaign, Atmos. Chem. Phys., 15, 7859–7875, Roscoe, H. K., Anderson, P. S., Ames, D., Clemitshaw, K. C., https://doi.org/10.5194/acp-15-7859-2015, 2015. Fleming, Z. L., Bloss, W. J., Heard, D. E., Lee, J. D., Read, Grannas, A. M., Jones, A. E., Dibb, J., Ammann, M., Anastasio, C., K. A., Hamer, P., Shallcross, D. E., Jackson, A. V., Walker, S. Beine, H. J., Bergin, M., Bottenheim, J., Boxe, C. S., Carver, G., L., Lewis, A. C., Mills, G. P., Plane, J. M. C., Saiz-Lopez, A., Chen, G., Crawford, J. H., Dominé, F., Frey, M. M., Guzmán, Sturges, W. T., and Worton, D. R.: Chemistry of the Antarctic M. I., Heard, D. E., Helmig, D., Hoffmann, M. R., Honrath, R. Boundary Layer and the Interface with Snow: an overview of E., Huey, L. G., Hutterli, M., Jacobi, H. W., Klán, P., Lefer, B., the CHABLIS campaign, Atmos. Chem. Phys., 8, 3789–3803, McConnell, J., Plane, J., Sander, R., Savarino, J., Shepson, P. B., https://doi.org/10.5194/acp-8-3789-2008, 2008. Simpson, W. R., Sodeau, J. R., von Glasow, R., Weller, R., Wolff, Kramer, L. J., Helmig, D., Burkhart, J. F., Stohl, A., Oltmans, E. W., and Zhu, T.: An overview of snow photochemistry: evi- S., and Honrath, R. E.: Seasonal variability of atmospheric ni- dence, mechanisms and impacts, Atmos. Chem. Phys., 7, 4329– trogen oxides and non-methane hydrocarbons at the GEOSum- 4373, https://doi.org/10.5194/acp-7-4329-2007, 2007. mit station, Greenland, Atmos. Chem. Phys., 15, 6827–6849, Hagler, G. S. W., Bergin, M. H., Smith, E. A., Town, M., and Dibb, https://doi.org/10.5194/acp-15-6827-2015, 2015. J. E.: Local anthropogenic impact on particulate elemental car- Legrand, M., Preunkert, S., Jourdain, B., Gallee, H., Goutail, bon concentrations at Summit, Greenland, Atmos. Chem. Phys., F., Weller, R., and Savarino, J.: Year-round record of sur- 8, 2485–2491, https://doi.org/10.5194/acp-8-2485-2008, 2008. face ozone at coastal (Dumont d’Urville) and inland (Con- Helmig, D.: Reactive gases in the Dome C snow- cordia) sites in East Antarctica, J. Geophys. Res., 114, 1–12, pack, Antarctica, 2012–2014, Arctic Data Center, https://doi.org/10.1029/2008jd011667, 2009. https://doi.org/10.18739/A2FP03, 2017. Legrand, M., Preunkert, S., Savarino, J., Frey, M. M., Kukui, A., Helmig, D., Bocquet, F., Cohen, L., and Oltmans, S. Helmig, D., Jourdain, B., Jones, A. E., Weller, R., Brough, J.: Ozone uptake to the polar snowpack at Sum- N., and Gallée, H.: Inter-annual variability of surface ozone at mit, Greenland, Atmos. Environ., 41, 5061–5076, coastal (Dumont d’Urville, 2004–2014) and inland (Concordia, https://doi.org/10.1016/j.atmosenv.2006.06.064, 2007a. 2007–2014) sites in East Antarctica, Atmos. Chem. Phys., 16, Helmig, D., Oltmans, S. J., Carlson, D., Lamarque, J. F., Jones, A., 8053–8069, https://doi.org/10.5194/acp-16-8053-2016, 2016. Labuschagne, C., Anlauf, K., and Hayden, K.: A review of sur- The Cryosphere, 14, 199–209, 2020 www.the-cryosphere.net/14/199/2020/
D. Helmig et al.: Impact of exhaust emissions on chemical snowpack composition                                                        209

Libois, Q., Picard, G., France, J. L., Arnaud, L., Dumont, M., Car-   Shi, G., Hastings, M. G., Yu, J., Ma, T., Hu, Z., An, C., Li, C., Ma,
  magnola, C. M., and King, M. D.: Influence of grain shape              H., Jiang, S., and Li, Y.: Nitrate deposition and preservation in
  on light penetration in snow, The Cryosphere, 7, 1803–1818,            the snowpack along a traverse from coast to the ice sheet summit
  https://doi.org/10.5194/tc-7-1803-2013, 2013.                          (Dome A) in East Antarctica, The Cryosphere, 12, 1177–1194,
Molina, M. J. and Molina, L. T.: Megacities and atmospheric pollu-       https://doi.org/10.5194/tc-12-1177-2018, 2018.
  tion, J. Air Waste Manage., 54, 644–680, 2004.                      Steinbacher, M., Zellweger, C., Schwarzenbach, B., Bugmann, S.,
Murray, K. A., Kramer, L. J., Doskey, P. V., Ganzeveld, L.,              Buchmann, B., Ordonez, C., Prevot, A. S. H., and Hueglin, C.:
  Seok, B., Van Dam, B., and Helmig, D.: Dynamics of ozone               Nitrogen oxide measurements at rural sites in Switzerland: Bias
  and nitrogen oxides at Summit, Greenland. II. Simulating               of conventional measurement techniques, J. Geophys. Res., 112,
  snowpack chemistry during a spring high ozone event with               D11307, https://doi.org/10.1029/2006jd007971, 2007.
  a 1-D process-scale model, Atmos. Environ., 117, 110–123,           Van Dam, B., Helmig, D., Toro, C., Doskey, P., Kramer, L.,
  https://doi.org/10.1016/j.atmosenv.2015.07.004, 2015.                  Murray, K., Ganzeveld, L., and Seok, B.: Dynamics of ozone
Neff, W., Helmig, D., Grachev, A., and Davis, D.: A study of bound-      and nitrogen oxides at Summit, Greenland: I. Multi-year ob-
  ary layer behavior associated with high NO concentrations at           servations in the snowpack, Atmos. Environ., 123, 268–284,
  the South Pole using a minisodar, tethered balloon, and sonic          https://doi.org/10.1016/j.atmosenv.2015.09.060, 2015.
  anemometer, Atmos. Environ., 42, 2762–2779, 2008.                   Warren, S. G., Brandt, R. E., and Grenfell, T. C.: Visible and
Preunkert, S., Ancellet, G., Legrand, M., Kukui, A., Kerbrat, M.,        near-ultraviolet absorption spectrum of ice from transmission
  Sarda-Esteve, R., Gros, V., and Jourdain, B.: Oxidant Produc-          of solar radiation into snow, Appl. Optics, 45, 5320–5334,
  tion over Antarctic Land and its Export (OPALE) project: An            https://doi.org/10.1364/ao.45.005320, 2006.
  overview of the 2010–2011 summer campaign, J. Geophys. Res.,        Wolff, E. W. and Cachier, H.: Concentrations and seasonal
  117, 6689–6705, https://doi.org/10.1029/2011jd017145, 2012.            cycle of black carbon in aerosol at a coastal Antarc-
Preunkert, S., Legrand, M., Frey, M. M., Kukui, A., Savarino, J.,        tic station, J. Geophys. Res.-Atmos., 103, 11033–11041,
  Gallée, H., King, M., Jourdain, B., Vicars, W., and Helmig,            https://doi.org/10.1029/97jd01363, 1998.
  D.: Formaldehyde (HCHO) in air, snow, and interstitial air          Wolff, E. W., Legrand, M. R., and Wagenbach, D.: Coastal Antarctic
  at Concordia (East Antarctic Plateau) in summer, Atmos.                aerosol and snowfall chemistry, J. Geophys. Res.-Atmos., 103,
  Chem. Phys., 15, 6689–6705, https://doi.org/10.5194/acp-15-            10927–10934, https://doi.org/10.1029/97jd03454, 1998.
  6689-2015, 2015.
Seok, B., Helmig, D., Williams, M. W., Liptzin, D., Chowan-
  ski, K., and Hueber, J.: An automated system for continu-
  ous measurements of trace gas fluxes through snow: an eval-
  uation of the gas diffusion method at a subalpine forest
  site, Niwot Ridge, Colorado, Biogeochemistry, 95, 95–113,
  https://doi.org/10.1007/s10533-009-9302-3, 2009.

www.the-cryosphere.net/14/199/2020/                                                             The Cryosphere, 14, 199–209, 2020
You can also read