Beirut explosion TNT equivalence from the fireball evolution in the first 170 milliseconds
←
→
Page content transcription
If your browser does not render page correctly, please read the page content below
Noname manuscript No.
                                                  (will be inserted by the editor)

                                                  Beirut explosion
                                                  TNT equivalence from the fireball evolution in the first 170 milliseconds

                                                  Charles J.Aouad1 · Wissam Chemissany2 · Paolo Mazzali1,3 · Yehia
                                                  Temsah 4 · Ali Jahami 4
arXiv:2010.13537v2 [physics.pop-ph] 25 May 2021

                                                  Received: date / Accepted: date

                                                  Abstract The evolution of the fireball resulting from          within which the fire ball is used to measure the shock
                                                  the August 2020 Beirut explosion is traced using am-           wave are in excellent agreement with other experimen-
                                                  ateur footage taken during the first 400 ms after the          tal data. A total TNT equivalence of 200 ± 80 tons at a
                                                  detonation. 39 frames separated by 16.66 - 33.33 ms            distance d ≈ 130 m is found. Finally, the dimensions of
                                                  are extracted from six different videos located precisely      the crater size taken from a hydro-graphic survey con-
                                                  on the map. Measurements of the time evolution of the          ducted 6 days after the explosion are scaled with known
                                                  radius of the shock wave are traced by the fireball at         correlation equations yielding a close range of results.
                                                  consecutive time sequence until about t ≈ 170 ms and           A recent published article by Dewey [12] shows that the
                                                  a distance d ≈ 128 meters. Pixel scales for the videos         Beirut explosion TNT equivalence is an increasing func-
                                                  are calibrated by de-projecting the existing grains si-        tion of distance. The results of the current paper are
                                                  los building for which accurate as built drawings are          quantitatively in excellent agreement with this finding.
                                                  available using the length, the width and the height           These results present an argument that the actual mass
                                                  and by defining the line of sight incident angles. In the      of ammonium nitrate that participated in the detona-
                                                  distance range d ≈ 60-128 m from the explosion cen-            tion is much less than the quantity that was officially
                                                  ter, the evolution of the fireball follows a Sedov-Taylor      claimed available.
                                                  model with spherical geometry and an almost instanta-
                                                                                                                 Keywords Explosion physics · Beirut explosion ·
                                                  neous energy release. This model is used to derive the
                                                                                                                 Fireball · Shock wave · Blast · ammonium nitrate
                                                  energy available to drive the shock front at early times.
                                                                                                                 explosion
                                                  Additionally, a drag model is fitted to the fireball evo-
                                                  lution until its stopping distance at time t ≈ 500 ms at
                                                  distance d ≈ 145± 5 m. Using the derived TNT equiv-            1 Introduction
                                                  alent yield, the scaled stopping distance reached by the
                                                  fireball and the shock wave-fireball detachment epoch              On the 4th of August 2020, an explosion occurred in
                                                                                                                 the port of Beirut, Lebanon, after a fire ignited in ware-
                                                  Charles Aouad                                                  house number 12. This tragic event resulted in massive
                                                                                                                 large scale destruction, severe damage to buildings in
                                                  E-mail: charlesaouad@aascid.ae
                                                                                                                 an extended radius around the center and loss of lives.
                                                  1
                                                     Astrophysics Research Institute, Liverpool John Moores      It was claimed by officials that this hangar contained
                                                  University, IC2, Liverpool Science Park, 146 Brownlow Hill,
                                                  Liverpool L3 5RF, UK
                                                                                                                 an amount of 2750 tons of ammonium nitrate kept in
                                                  · 2 Institute for Quantum Information and Matter, California   the port for around 6 years.
                                                  Institute of Technology, 1200 E California Blvd, Pasadena,         A few attempts have already been made to quantify
                                                  CA 91125, USA                                                  the amplitude of this explosion. Several of these studies
                                                  · 3 Max-Planck Institut fur Astrophysik, Karl-Schwarzschild-
                                                  Str. 1, D-85748 Garching, Germany
                                                                                                                 use the time of arrival of the shock wave (from audio
                                                  · 4 Faculty of engineering, Beirut Arab University, Beirut,    and visual inspection of footage) up to distances rang-
                                                  Lebanon.                                                       ing from 500 to about 2000 m [38, 43, 35]. These studies
                                                                                                                 use empirical relations linking the scaled time of arrival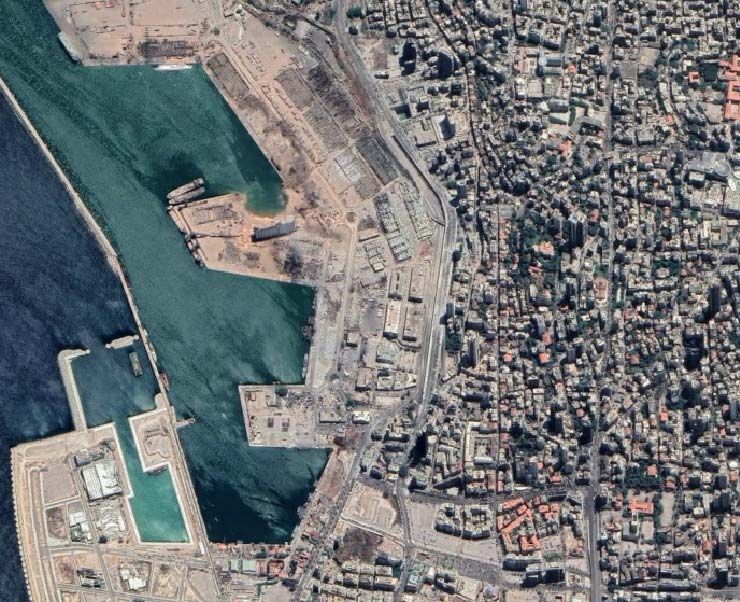
2                                                                                               Charles J.Aouad1 et al.

with the scaled distance to report a TNT equivalence         [47, 31]. These energetic burning explosive phenomena
range of 0.3-1.1 kt. Pilger et al. [36] use open access      are observed in nuclear and in chemical reactions on
seismic data to yield a range of 0.5-1 kt TNT.               a wide range of magnitudes ranging from small con-
    Diaz [14] measures the evolution of the fireball until   trolled industrial activities to large astrophysical con-
about 200 m distance from the center. He uses 26 data        texts (e.g. solar flares, supernovae). It is usually ac-
points taken from publicly available videos to yield a       cepted that a deflagration can transit to a detonation
range of 0.5-0.6 kt of TNT. The data of Rigby et al. [38]    in suitable conditions [28, 23, 34], although this tran-
is used by Dewey [12] to compare the peak hydrostatic        sition is still an extensive theoretical area of research.
overpressures with experimental measurements for both        Once the shock wave reaches the outer boundary of the
TNT and ANFO explosions. He finds that Beirut explo-         burning fuel, it will be transmitted to the surrounding
sion produces overpressures that are weaker than over-       medium (whether a fluid or a solid) and will propagate
pessures that would have been produced by a TNT ex-          isotropically in the form of a blast wave.
plosion of the same energy at close distances to the cen-           This sudden increase in pressure will cause the
ter, while at larger distances it produces slightly larger   ignited hot material and the gaseous residues of the re-
over-pressures. He concludes that the TNT equivalence        action to expand rapidly with high velocities pushing on
of the Beirut explosion is an increasing function of dis-    the fluid around them [22, 25]. Furthermore, the sudden
tance (refer to Fig 3 in [12]).                              increase in pressures at the vicinity of the detonation
    In this paper we report the TNT equivalence by           will cause an increase in temperature (few thousands
measuring the kinematics of the fireball in the close        degree kelvin). Finally the transfer of momentum be-
proximity of the center (in a distance range of 60-145       tween the shock front and solid particles will also cause
m from the explosion center in the first 170 ms). We         these solid particles to accelerate spherically away from
base our study on both experimental observations of          the center [48, 19, 39]. The combined effect will result
the fireball evolution generated by chemical explosions      in the creation of an optically thick visible fireball. Im-
as reported by Gordon, Gross, and Perram [17], and           mediately after the explosion, both the fireball and the
using a Sedov-Taylor model to derive our results [45,        shock front rapidly expand. However, the expansion of
46, 40].                                                     the fireball will decelerate until it halts and reaches a
    The paper is divided as follows: in section 2, we        stopping distance while the shock front will detach and
present our methodology, in section 3, we present our        keep expanding depositing energy until it decays into a
results and observations and we discuss these results.       sonic wave. As the rate of fireball expansion decreases,
In section 4, we compare our work to the literature and      both temperatures and atmospheric over-pressures will
in section 5 we present some additional thoughts. We         also drop making its sharp edge less defined and less
draw our conclusions and discuss possible lines of future    luminous [see also 4, sect303-304] [17, 8, 46, 40].
work in section 6.
                                                             2.2 Mathematical description
2 Methodology
                                                                    The theoretical models for the study of the shock
2.1 Background                                               wave generation and propagation were developed by
                                                             studying nuclear explosions [8, 40, 45]. Taylor [45] con-
       Explosions are the swift release of a large amount    sidered the solution where the energy is released in-
of energy [24, 27, 6]. This process is usually caused by     stantaneously, in a very small volume (point source)
the ignition of a ‘fuel’. A burning front is then formed     and where the mass of the explosives is insignificant:
and propagates within the medium burning it as it pro-       i.e. nuclear explosion. He then derived the evolution of
ceeds. The power of this process: i.e. the energy release    the shock wave by solving numerically three differential
per unit time, depends not only on the chemical or nu-       equations, namely an equation of motion, a continu-
clear potential of the fuel, but also on the velocity of     ity equation and an equation of gas state taking the
propagation of this burning front throughout the ma-         boundary conditions given by the Rankine-Hugoniot
terial. In a pure deflagration, this burning front propa-    equations [37, 18]. Later, he was able to experiment
gates subsonically and causes burning by heat transfer       the accuracy of his work after the publication of the
[20, 33].                                                    photographs of the Trinity nuclear explosion test [44,
       A more powerful form of burning is a detona-          29]. Although Taylor analysis describes best a nuclear
tion, in which case, the burning front travels super-        explosion, he later provided evidence, based on exper-
sonically creating a shock front ahead of it and can         imental data, and showed the boundaries (scaled dis-
cause the burning of the fuel by compressive heating         tance) where a chemical explosion can resemble a nu-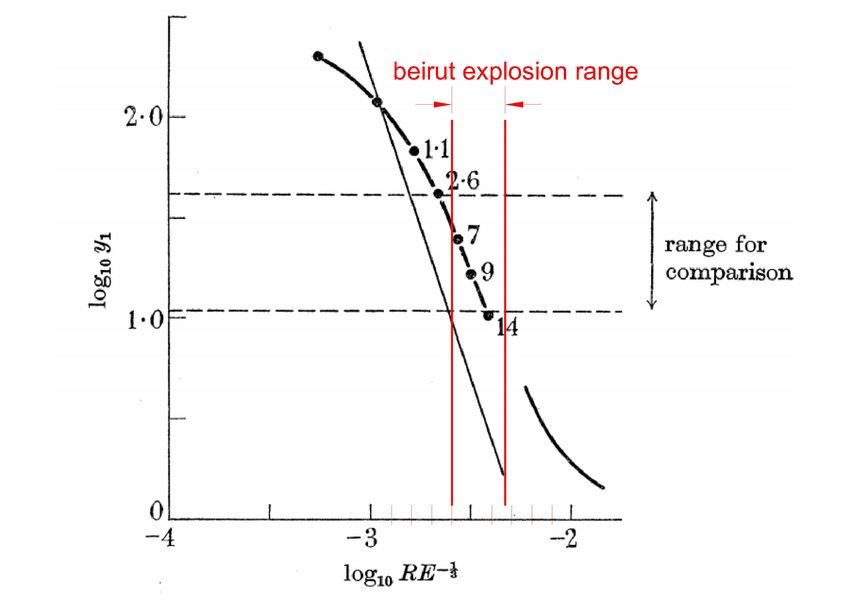
Beirut explosion                                                                                                       3

clear explosion and where his model can still be applied
[46].
       The Taylor model has the form:
R5 = t2 EK −1 ρ−1
               0 .                                   (1)
      Here ρ0 is the undisturbed gas density, K is a
constant that depends on γ the ratio of specific heats
of the gas and E the part of the energy that has not
been radiated away.
This relation can be written as
5
  log10 R = a log10 t + b                           (2)
2
where a is the slope of this linear relation and is ex-
pected to be equal to unity if the observation follows
the theoretical prediction. In that case, the energy E      Fig. 1 Video 2 taken from 1400 m distance. 8 frames sepa-
can be calculated from Equations 1 and 2 as:                rated by 33.33 ms showing the fireball along with the circle
                                                            fit. The detonation is assumed to have happened anytime be-
E = 102b Kρo                                         (3)    tween the first and second frame.
where
                                                            Table 1 Videos used to extract frames. Column 1 shows the
102b = R5 t−2 .                                      (4)    video label, column 2 shows the frame rate in frames per sec-
                                                            ond (FPS) for each video. Column 3 shows the distance in
the term b can be calculated from a linear fitting to the   meters, column 4 shows the incident line of sight in degrees.
observed data [46].                                         The last column shows the video reference as taken from so-
                                                            cial media.
      Sedov [40] developed a more general form which
depends on the geometry of the explosion and on the          video rate distance α Ref
                                                             label FPS meters ◦
rate of energy release, this model is also a power law
whose exponent depends on the dimensionality of the          1    30   1146     83 [15, Tweet]
                                                             2    30   1400     22 [3, Youtube]
event and on the rate of energy release. It has the form     3    30   550      24 [3, Youtube]
of:                                                          4    30   666      14 [10, Tweet]
                                                             5    60   630      NA [26, Youtube]
Rs (t) = atb ,                                       (5)     6    30   1026     24 [1, Youtube]

       where
     s+2                                                    2.3 Data
b=         .                                          (6)
     n+2
       Here n is the dimensionality of the expansion:              The data used in the current analysis consist of
n = 1 for a planar expansion, n = 2 for cylindrical         six different videos taken by smartphones from vari-
and n = 3 for spherical, s is a factor describing the       ous locations overlooking the explosion site. The videos
rate of energy release: s = 0 for instantaneous energy      used are located on the general map in fig 2 and are
release and s = 1 for continuous energy release. In the     listed in table 1. The videos are taken at different frame
case where n = 3 and s = 0 the Sedov solution will          rates (FPS) which are also shown in table 1. The time
be similar to Taylor solution: i.e. a power law with an     separation between extracted still images is thus con-
exponent of 0.4.                                            strained by this limitation.
       The applicability of the Sedov-Taylor model is
valid in the region where the shock wave has expanded
to displace a mass of air exceeding the explosives mass     2.4 Measuring the time evolution of the fireball
and where the pressure differential across the shock is
high compared to the ambient background [17]. Imme-               What we exactly need in this study is to trace
diately after the explosion, the location of the shock      the evolution of the fireball radius Rt as a function of
wave radius can be traced by the fireball before these      time t0 which is considered to be the time zero of the
two separate. This has been demonstrated before [46,        explosion.
17, 39, 38, 19, 12, 14, 48]. Therefore, tracing the fire-         We use the building of the grain silos to calibrate
ball kinematics can trace the shock wave and the blast      the pixel scale of the videos by defining the location of
energy can be calculated accordingly.                       each footage and defining the incident line of sight an-
4                                                                                                       Charles J.Aouad1 et al.

Fig. 2 A Google earth map of Beirut showing the location of the 6 videos used in the current report. For each video an incident
line of site is determined along the long facade of the grain silos building. Video 5 is calibrated using another technique since
this video does not show the silos building in the frames (see appendix). The explosion center is marked with black circles.

gle taken with respect to the grain silos building long            3. The building is not a pure rectangle; it has semi
facade. We use its accurate as-built drawings to de-                  cylinders projected from the sides. These cylinders
project the width, the length and the height whenever                 have to be taken accurately when performing a de-
these three are visible. We determine accordingly a pixel             tailed projection. We accurately overlay the rotated
scale θ from both the width and the length θ[L+l] and                 building as per our incident angles over the images
separately from the height θ[h] , we then calculate an av-            and make sure that all projected cylinders and edges
erage of these two θ[mean] in which a pixel corresponds               are aligned with the rotated drawings. Thus we limit
to a physical measurement in meters.                                  the propagation of errors associated with this pro-
                                                                      cess. This is clearly seen in fig 4 and in the appendix.
      Here we highlight the precision of our scaling method
and the differences with Diaz [14]:                         4. Different than Diaz [14], we trace the fire ball as rep-
1. We use not only the length of the silos, rather our         resentative of the shock wave radius only in the first
   method combines the de-projected length, width and          few frames where its boundaries are clearly defined
   height. This method reduces the systematic errors           with a reasonable error margin up to about 170 ms
   associated with calibration. We take a mean value           after the explosion. The Fireball cannot track the
   between the three measurements. Our results show            shock wave at all times, therefore, we provide scal-
   excellent convergence to within not more than few           ing arguments that the epoch within which we use
   meters.                                                     the fire ball as representative of the shock wave and
2. We use the accurate as built drawings of the si-            consequently their detachment time are valid (refer
   los building and we do not use google map images            to section 3.2). Thus we limit our data points to
   to calibrate its length. The accurate drawings have         within this limitation.
    been provided through private communication with                    We measure the total length of the building pro-
    the local port authorities.                                   jection in pixels as measured on the CCD. This includes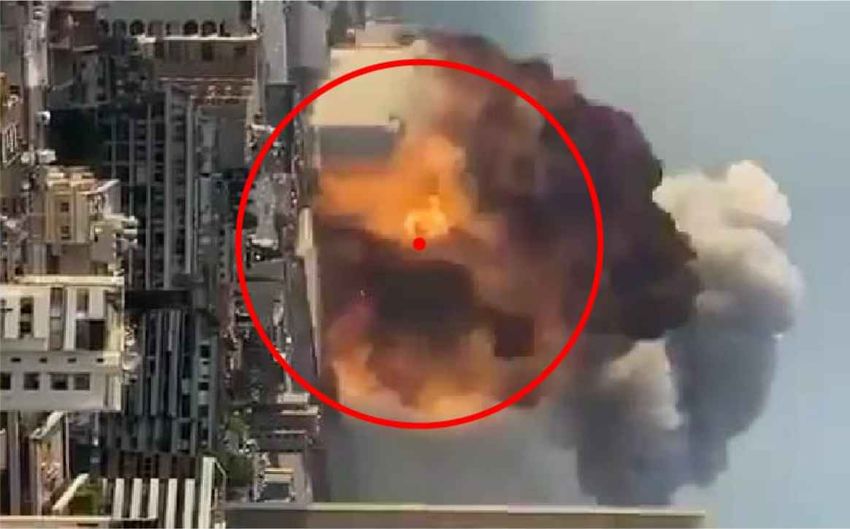
Beirut explosion                                                                                                            5

     R        pixel scale θ   R         T          video
     pixels   m/pixel         meters    seconds
     58       1.373           79.634    0.05       1
     72       1.373           98.856    0.083      1
     82       1.373           112.586   0.116      1
     90       1.373           123.570   0.149      1
     97       1.373           133.181   0.183      1
     102      1.373           140.046   0.216      1
     71       1.12            79.52     0.05       2
     89       1.12            99.68     0.083      2
     99       1.12            110.88    0.116      2
     110      1.12            123.20    0.149      2
     119      1.12            133.28    0.183      2
     127      1.12            142.24    0.216      2
     189      0.3443          64.827    0.033      3
     255      0.343           87.465    0.066      3
     300      0.343           102.900   0.099      3
     332      0.343           113.876   0.133      3
     62       1.105           68.510    0.033      4
     70       1.105           77.350    0.050      4
     83       1.105           91.715    0.066      4
     91       1.105           100.555   0.083      4
     97       1.105           107.185   0.100      4
     105      1.105           116.025   0.116      4             Fig. 3 Video 5 taken from a distance of 630 meters from
     109      1.105           120.445   0.133      4             the explosion. 9 frames separated by 16.66 ms showing the
     114      1.105           125.970   0.150      4             fireball along with the circle fit. The detonation is assumed
     116      1.105           128.180   0.166      4             to have happened anytime between the first and the second
     77       N/A             65.848    0.033      5             frame. For pixel calibration method see appendix.
     100      N/A             84.619    0.066      5
     120      N/A             101.812   0.099      5
     135      N/A             114.802   0.133      5
     145      N/A             126.138   0.166      5
                                                                 2. The physical value Rm in meters, will thus be given
     157      N/A             134.031   0.199      5             by:
     168      N/A             143.734   0.233      5
     115      0.565           64.975    0.033      6             Rm = θ[mean] × R[px] .                                   (7)
     155      0.565           87.575    0.066      6
     190      0.565           107.350   0.099      6                    Here Rm is the radius of the fireball in meters and
     205      0.565           115.825   0.133      6             Rpx is the measured radius in pixels. The values of θ
     224      0.565           126.560   0.166      6
     233      0.565           131.645   0.199      6             are shown in table 2.
     249      0.565           140.685   0.233      6                    This procedure does not apply to Video 5 in which
                                                                 the grains silos building is not visible. To calibrate this
Table 2 Fireball evolution in the first 230 ms. The first col-
umn shows the radius of the fireball in pixels; the second       video, we determine the angular field of view in which a
column shows the pixel scale calculated for each video. Col-     pixel corresponds to an angle resolution. Using this an-
umn 3 shows the radius in meters. Column 4 shows the time        gular pixel resolution, we can calculate the dimensions
from explosion for each frame. Column 5 shows the videos         of the fireball knowing its distance (630 meters) using
labels. For V5 refer to appendix.
                                                                 basic trigonometry. This is described in the appendix.
                                                                 Surprisingly, we find comparable numbers with differ-
                                                                 ent videos taken from completely different locations and
                                                                 using different scaling methods.
the side elevation length l = 30.5 m (including the                     The separation between consecutive frames changes
half cylinder projection as it defines the border of the         with the videos. For most of them (video 1-2-3-4-6), the
projected visible width), and the front elevation length         rate is 30 FPS corresponding to time intervals 33.33 ms.
L = 152 m. The total projected length as measured                For video 5, the rate is 60 FPS corresponding to time
on the camera plane is thus given by L sin α + l cos α           intervals of 16.66 ms.
where α is the incident angle of sight. A pixel scale θ[L+l]            For each frame, we measure the size of the fire-
is then given by LLsin   α+l cos α
                      total[pixels]
                                    . Wherever the ground is     ball by manually fitting a circle to the luminous edge
visible, we use the height of the silos as an additional         and converting the pixels to physical measurements in
scaling parameter and we compute the height scaling              meters using the pixel scale θ[mean] derived earlier. Mea-
parameter θ[h] , we then take the average between these          surements are executed to the largest visible width of
two θ[mean] . This is shown in Fig. 4, and in table 3 and        the projected visible sphere.(refer to fig 4)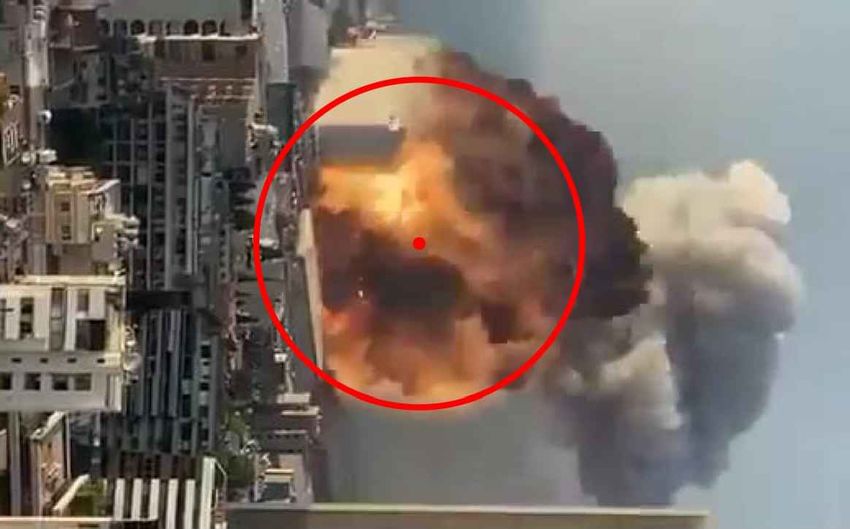
6                                                                                                          Charles J.Aouad1 et al.

Fig. 4 For each video the incident angle of sight towards the silos long facade is shown along with the actual picture of the
silos and the de-projection lines. Drawings are provided by the Arab center for architecture [2].

         Video    L          l         α      L sin α + l cos α   L+l       h         h         θ[L+l]   θ[h]     θ[mean]
                                                                                                meter    meter    meter
                  [meter]    [meter]   [◦ ]   [meter]             [pixel]   [meter]   [pixel]   pixel    pixel    pixel

         1        152        30.5      83     154.592             109       48        36        1.413    1.333    1.373
         2        152        30.5      22     85.194              73        48        43        1.167    1.0116   1.141
         3        152        N/A       24     61.794              182       48        138       0.339    0.347    0.343
         4        152        30.5      14     66.348              60        N/A       N/A       1.124    N/A      1.105
         6        152        30.5      23     87.440              156       48        91        0.602    0.527    0.565

Table 3 Calibration parameters.The first column shows the video label. The second and the third columns show the length
and the width of the silos in meters, the third shows the incident angle, the fourth shows the total projected length against
the line of sight, the fifth shows the total projected length in pixels as measured on the CCD, the seventh and the eight show
the height of the silos in meters and pixels respectively. The last three columns show the pixel scale for the values derived
respectively from [L + l], θ[L+l] , from[h], θ[h] and the final mean value θ[mean] used for the final calibrations. The width l for
V3 is not visible in the footage and the height for V4 could not be measured because the video does not show a clear view to
the ground. V5 is calibrated using another method (refer to the appendix).

It is important to note that some of the videos (namely              of the explosion is seen. Thus, t0 can be taken anytime
1,2 and 4) were taken by a shaking hand. In that case,               between this frame and the previous frame. We con-
defining the center of the explosion is executed taking              sider an error on determining t0 of 16 ms. (We refer
a fixed reference from the picture for which the coor-               the reader to section 2.5 for a complete error analysis
dinates of the center are corrected for each and every               review).
frame. We identify the time of the explosion t0 by vi-               Using this procedure we can build the time evolution
sually checking the frame at which the first bright light            of Rt with respect to t0 .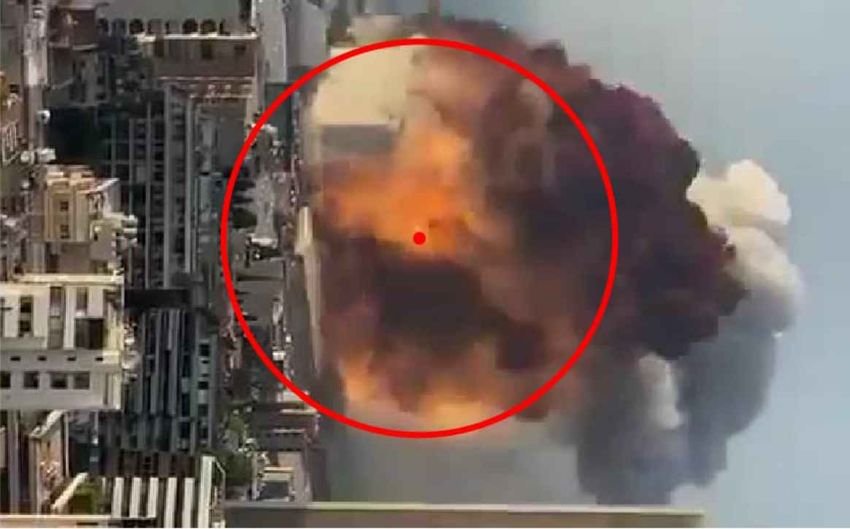
Beirut explosion                                                                                                                                          7

The luminous sphere is bound by a pseudo-sharp edge                               be seen in the first two frames of Figures 3-7. We
in the first 100 ms, as this edge starts becoming less                            consider an average error on t0 of δt ≈ ±17 ms.
sharply defined at later stages, we do not extend our                             The error on the term log10 t is given by
measurements further. Our values are shown in table 2.                                             1 δt          δt
                                                                                  δ log10 t =             = 0.434 .                                 (10)
                                                                                                logn 10 t         t
2.5 Error analysis                                           Taking the combined effect of these errors will cause
                                                             a very large error propagation on the value of the en-
      Two main uncertainties can cause the error on          ergy E if this will be computed only using equation 1
the estimation done in the current study, namely the         with only few measurements of R and t. Our 39 mea-
error on measuring the radius R and the error in as-         surements and the linear fitting will reduce the effect
suming the time t0 of the detonation.                        of these errors and will limit the error to only the one
We are measuring pixels in frames extracted form videos      on the fitting parameters, namely the slope a and the
taken by handheld smart phones of limited frame rates        intercept b of equation 2.
cameras.
      These errors can be divided into three main cat-
egories.
1. Errors in determining the pixel scale: this is mainly
                                                                                  5.2
   due to uncertainties in defining the precise location
   of the camera within at least 1◦ and errors in defin-                          5.1

                                                                                                      ns
                                                                                                     to
   ing the boundaries of the silos border due to noise
                                                                                                 00
   in the frames and the low resolution for some of                                 5           10
                                                             5/2log10R [meters]

   the videos. The combined effect is assumed to cause                                                ns
                                                                                  4.9
                                                                                                     to
                                                                                                 0

   an uncertainty in the pixel scale determination of
                                                                                                50
                                                                                                      ns

   δθ                                                                             4.8
    θ ≈ 5%.
                                                                                                     to
                                                                                                 0
                                                                                                30

2. Errors in fitting the circles and measuring the pixel
                                                                                  4.7
                                                                                                      ns

   size of the fireball: this is especially at later times                                                                 V1
                                                                                                     to
                                                                                                 0

                                                                                                                           V2
                                                                                                20

   when the edge of the fireball becomes less sharply                             4.6                                      V3
                                                                                                      ns
                                                                                                     to

   defined. We estimate this uncertainty to about 4                                                                        V4
                                                                                                 0
                                                                                                10

                                                                                  4.5                                      V5
   pixels as an average from all measurements. This                                                                        V6
   leads to an average value taken from all measure-                              4.4                                      1.032t+6.08
           δRpixels                                                                                                        equivalent TNT models
   ments Rpixels     = 3%. Using eq 5 we can write:
            s                                                                   4.3
                       2             2                                            -1.6         -1.4       -1.2      -1           -0.8            -0.6
   δRm            δθ         δRpixels
         =               +               .             (8)                                                 log10t [seconds]
    Rm             θ          Rpixels
                                                             Fig. 5 Fireball radius evolution with time. 52 log10 R on the
   Here δRm is the error on the radius of the fireball
                                                             Y -axis and log10 t on the X-axis. The dots represent the fire-
   in meters and δθ θ is the error on the pixel scale.       ball radius taken from different videos for data points taken
   Taking the average relative pixel scale δθ
                                            θ of 5% and      at a distance less than about 130 m at an epoch less than
               δRpixels
   an average Rpixels of 3% leads to a relative error        about 170 ms where the fireball is assumed to trace the
                                                             shock wave. The best linear fit has the form Y = ax + b
    δRm
     Rm  = 0.058.                                            where a=1.024[0.955-1.092] and b = 6.052[5.977-6.127]. The
   Thus the propagation of error on the value 25 log10 R     red lines represent the equivalent TNT yields from surface
                                                             blast explosions: i.e. corrected by a factor of 1.8 to include
   is given by differentiating with respect to R leading     reflection from the ground.
   to

       5              δRm      5
   δ     log10 Rm =                  ≈ 0.063.        (9)
       2               Rm 2 logn 10
3. Error on the assumption of time t0 of the detona-         3 Results and Observations
   tion: by checking the frames, it can be seen that the
   detonation causes a sudden bright light seen in the              A clear sharply defined hemispherical fireball was
   frames sequence, thus, the detonation is assumed          visible in approximately the first 100 ms after the det-
   to happen anytime between these two consecutive           onation. The boundaries of its expanding surface be-
   frames (after the frame without intense light and         came less sharply pronounced as it expanded. Later, its
   before the frame with the intense light) which can        boundary rapidly faded until it was not clearly defined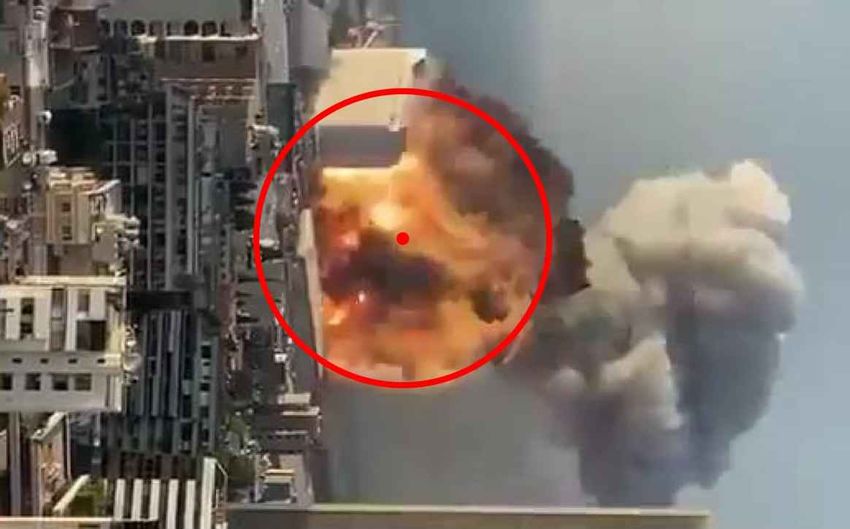
8                                                                                                       Charles J.Aouad1 et al.

                                                                     refer the reader to section 3.1 for a complete discus-
             180                                                     sion). At this stage, when the temperatures drop, the
                                                                     shock wave causes the formation of the vapour cloud,
                                                                     a.k.a Wilson cloud, clearly spotted in the videos rapidly
             160
                                                                     growing, leading a massive damage front ahead of its
                                                                     boundary. The formation of this cloud is caused by the
             140                                                     negative phase following the passage of the sudden in-
                                                                     crease in pressure, and the adiabatic cooling causing
R [meters]

                                                                     the atmospheric water vapour to condensate and cre-
             120
                                                                     ate the white appearance. It is important to mention
                                                                     that at these epochs the boundary of the shock wave
             100                                                     is not traced by the boundary of the Wilson cloud due
                             Beirut data(60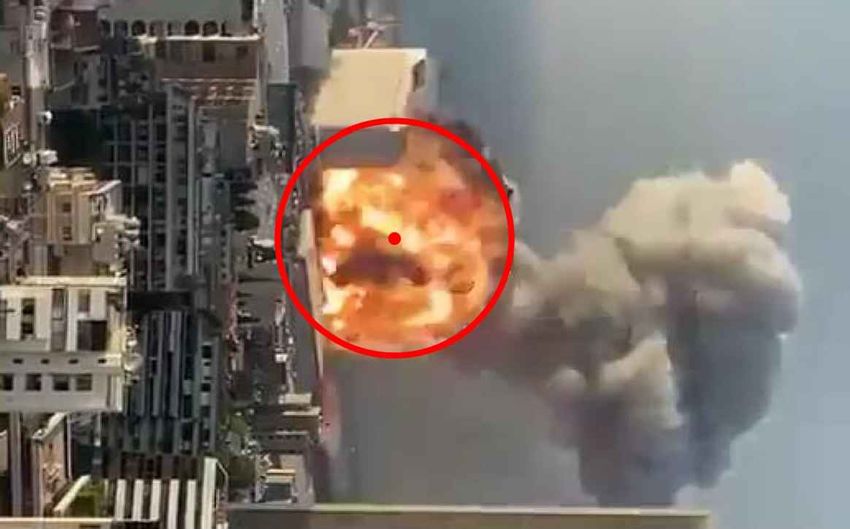
Beirut explosion                                                                                                           9

tor of 1.8 has to be used. This will yield an energy of        for distances between 60 and 130 m. This falls comfort-
E ≈ 0.85 ± 0.3 × 10¹² J or an equivalent of 200 ± 80           ably within the comparison range. This is shown in fig
tons TNT.                                                      7. It is worth stressing that our data show a remark-
       The ammonium nitrate conversion to TNT is var-          able consistency. Points taken in a distance range of
iously reported in the literature (56 % [32] 38% [21]          60 − 130 meters still follow the trend as expected from
and recently 42% [9]). Even if we use the lowest con-          theory. Note that, as previously stated, this data are
version value of Karlos and Solomos [21], we estimate          severely limited (taken from 6 different videos at 6 dif-
that the ammonium nitrate equivalence of Beirut ex-            ferent locations using different approximate scaling and
plosion is 526 ± 210 tons. This is much less than the          limited by the resolution).
quantity of ammonium nitrate claimed by the local of-
ficial authorities records of 2750 tons originally stored
at the port. This can be explained by two scenarios:
either a significant fraction of the stored quantity was
consumed by a deflagration before the detonation oc-
curred and thus had limited input in the blast energy,
or the missing quantity was not physically available at
the time of the explosion. The current study cannot
confirm one of these two scenarios. Here it is impor-
tant to mention that this approach does not consider
the amount of energy that has been radiated as heat in
the form of electromagnetic radiation, however, these
effects are considered insignificant in a chemical explo-
sion [8], contrary to a nuclear explosion. Moreover, part
of this energy has been used in demolishing the steel
structure hangar in which the explosives where kept,           Fig. 7 Original data fromTaylor [46][see fig5]. The continu-
which is also assumed to be insignificant. In general,         ous straight line shows the blast pressures on the Y axis de-
the errors accumulated because of these assumptions            rived from a theoretical Taylor model, the thick line with the
                                                               dots are data taken from observations for a chemical explo-
will still be contained within the error margin within         sion with the same release of energy.  The
which we state our estimation.                                                                   h     1
                                                                                                        i X axis shows the
                                                               log10 of the scaled distance log RE − 3 . The Vertical red
                                                               lines show the boundaries of Beirut data between distances
                                                               of 60 and 120 m scaled to our TNT equivalent yield.
3.1 The applicability of the Sedov-Taylor model

       It is well known that Taylor model assumes a
point source solution in which the mass of the explosives
is insignificant and the release of energy is assumed to       3.2 The fireball kinematics and stopping distance
be instantaneous. Although this approximation is valid         compared with experimental observations
for a nuclear explosion, it is not valid for a chemical
explosion because these assumptions do not hold. How-                 It can be seen in Fig. 6 that the radius of the
ever, using experimental data and comparing it to the-         fireball decelerates until it stabilizes at some distance
oretical work, Taylor [45] has provided a range where          Rm ≈ 140 − 145 m after about 200 ms. The shock wave
a chemical explosion behaves similar to a nuclear ex-          at this epoch has already detached from the fireball and
plosion and the two can be comparable. This range is           moves ahead of it. This has been observed before [see
provided in Taylor [45, (see page 170-173- Fig. h5)] and iis   46, 29, 44, 17]. At this epoch the shock wave is driven
                                                        1
given as a function of the scaled distance log RE − 3 .        by the remaining energy that has not been radiated as
Here E is the energy yielded from the explosion given          heat or consumed during the expansion of the heated
in ergs, and R is the distance in cm. Taylor proposes          air. The epoch during which the shock wave can be
thath the window
              i     of comparison lies between values of       traced by the fireball is thus limited.
         − 13
log RE          = −2.3 to about −2.7.
                                                                    We use a drag model [16, 17] to describe the kine-
     We perform the necessary units conversion and
                                                               matics of the fireball. This is given by:
compare our results for the range
                              h   of our
                                     i distances (60-
                                       1
130 m), we find values of log RE − 3 = −2.6 to −2.3            Rf (t) = Rm [1 − exp(−κt)].                              (11)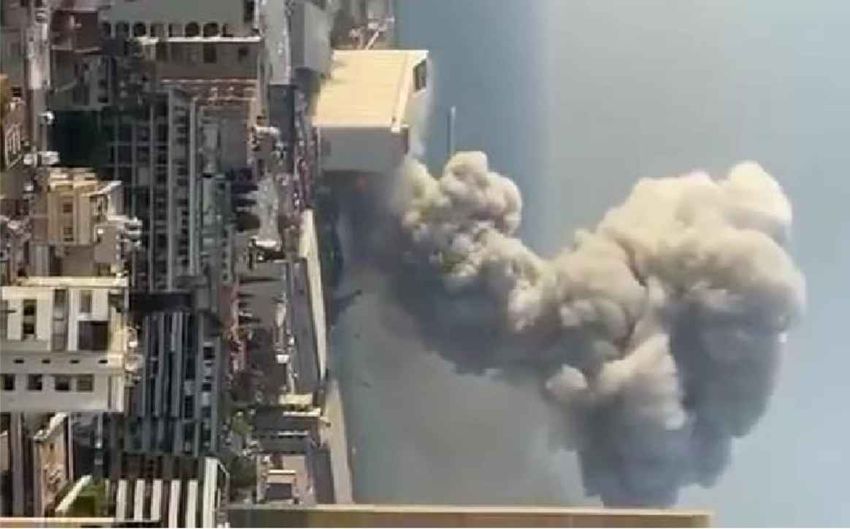
10                                                                                               Charles J.Aouad1 et al.

Here Rf (t) is the radius of the fireball, Rm is the stop-    height of the fireball was obscured by the dark smokes
ping distance, a distance at which the fireball expansion     and could not be measured at later times.
becomes asymptotic, and κ is the drag coefficient. The
drag model with κ = 14.44 and Rm ≈ 144 m is in                      The follow-up of the shock wave beyond this epoch
good agreement with the observed evolution of the fire-       is out of the scope of the current work. However it is
ball. This can be clearly seen in fig 6. One can notice       worth noting that such a follow-up is stringently lim-
that the drag model curve follows the observed points         ited and tracing it with these videos is challenging for
within the range of error. The drag model significantly       the following reasons:
departs from the Sedov-Taylor model at about 100-130
                                                               • Tracing the shock wave using the vapour cloud is not
m, a point after which the assumption of the fireball
                                                                 consistent because of the delay in the formation of
tracing the shock wave does not hold any further for
                                                                 the vapour after the passage of the positive phase of
the evaluation of the energy.
                                                                 the over-pressure. This time delay makes the actual
      Gordon, Gross, and Perram [17] measure sepa-               location of the pressure front ahead of the vapour
rately the evolution of both the fireball and the shock          cloud. Additionally, pixel scaling set with reference
wave using high speed photographs from several charge            to the silos building holds only in the vicinity of the
loads sufficiently elevated from the ground. On Fig. 6,          explosion center. However, this cannot be accurate
we plot our data compared with the observations of               for extended distances where the dimensional pixel
Gordon, Gross, and Perram scaled using Hopkinson’s               scaling does not hold anymore.
                           W1 13
cube root scaling R R2 = ( W2 ) . It can be seen that the
                     1
                                                               • Tracing the shock wave using time of arrival of the
evolution of the two fireballs are very similar. For a           shock from frame by frame analysis of the videos
charge load of about 20 kg TNT equivalence, the fire-            may be affected by the urban pattern. In fact, the
ball reaches a stopping distance at about 5.5 m, this            interaction of the shock wave with the dense urban
corresponds to a scaled distance Z = Rm1 = 2.02 m1 .             structures causes complex interactions and diffrac-
                                          W   3       kg 3
Taking our TNT equivalent yield and using the same               tion patterns, making the assumption of an isotrop-
scaled distance we find a stopping distance of about 145         ical spherical flow of the shock wave inaccurate [42,
m. This is in excellent agreement with our results and           7, 41]. The interaction of the shock wave with the
provides an additional check on the validity of our find-        existing grains silos, for example, has created a visi-
ings.                                                            ble dark spot within the vapour cloud, signaling the
Furthermore, Gordon, Gross, and Perram [17] find that            absence of strong over-pressures and therefore the
the distance at which the sock wave detaches from the            absence of the shock wave in this particular loca-
fireball is about 5 m for a charge load of 20 kg, this cor-      tion. Later this spot has disappeared due to inter-
responds to a scaled distance Z ≈ 1.84 m1 . Using this           ference of the reflected wave from the ground and
                                          kg 3
                                                                 the edges of the building. This can be clearly seen in
scaled distance and our derived TNT equivalent yield,
                                                                 fig 12 in the last panel. Furthermore, at later times,
we find a detachment distance of about 130 m also in
                                                                 the TNT equivalence cannot be derived using the
perfect agreement with the range over which we used
                                                                 current method and other relations have to be used
the fireball to trace the shock wave.
                                                                 (see for example Rigby et al. [38]).

       It is worth to mention that the fireball hemisphere
does not stay centered on the ground, and this is clearly     4 Comparison with the literature
seen in the frames (see fig4). Part of this is due to buoy-
ancy and part is due to the reaction from the ground.               Dewey [12] calculates the TNT and ANFO equiv-
This has been observed before [17, 46, 29] . Gordon,          alences as functions of radial distances from the centre
Gross, and Perram [17] measure the lift of the fireball.      of Beirut explosion. He uses the time of arrival of the
In the first 3 ms the fireball has already reached a height   shock wave data taken from Rigby et al. [38] to derive
of about 4.5 m for a charge weight of 20 kg TNT equiva-       the velocity of the shock wave. Then using Rankine-
lence. Using Hopkinson’s cube root scaling for our TNT        Hugoniot relations he derives the hydrostatic overpres-
equivalent value this corresponds to a height of 115 m        sures behind the shock and compares the results to ex-
at around 100 ms. From observing the height of our            perimental data taken from Dewey and McMillin [13].
fireball by comparing it to the silos building top level      He shows that Beirut explosion was weaker than a TNT
in the first 3 frames, we find a value of about 120 ± 10      explosion with the same energy close to the center of the
m in the first 100 ms which is consistent with Gordon,        explosion. The two blasts became identical at about 500
Gross, and Perram [17] observations. Unfortunately the        m (see fig 2 & 4 of [12]). At larger distances the Beirut
Beirut explosion 11
explosion was slightly stronger than that of a TNT. He is in a close range to the upper margin of the results
explains this result by variations in the change of en- of the current study. Another form used by the same
tropy: an originally weaker blast will result in a smaller authors is given as V = 0.68(WAN )0.81 where WAN is
change in entropy and thus will keep more energy at the ammonium nitrate mass in kg and V is the volume
larger distances. in m3 . Using the same crater physical volume range we
Using this result he showed that the TNT equivalence find an ammonium nitrate mass of 840 − 980 tons, also
of the Beirut explosion is an increasing function of dis- in the same order of magnitude of the results of the
tance (see fig 3 of [12]). It increases from 0.15kt to 0.7 current study.
kt TNT between distances of 80 to 1000 meters.
This is in excellent agreement with the results
presented in this paper. We find a TNT equivalence for 5 Additional thoughts
the Beirut explosion of about 200 tons at a distance
range between 60 and 130 meters. Most studies using A question here arises. What is the actual charge
time of arrival of the shock wave (from audio and vi- load of the Beirut explosion? The TNT equivalence of
sual data)[38, 43, 35] report values of 500-700 tons of an event is derived by comparing distances at which
TNT at distance between 500 and 1000 meters, also in physical values such as hydrostatic overpessure, velocity
accordance with Dewey [12]. of the shock or impulse are comparable [12]. This may
not be valid for different explosive compounds. It is
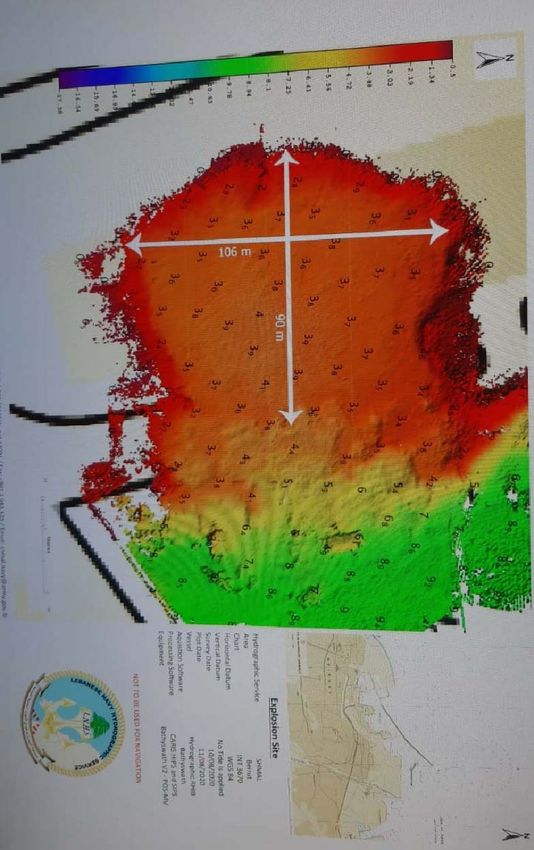
4.1 The dimensions of the crater sure that all the attempts done in this effort have some
degree of uncertainty and each method is associated
The diameter and the depth of the crater are with a margin of error. The data used for the Beirut
known to correlate with the explosive mass, however, explosion is taken from amateur footage and was never
this relation depends on several parameters (nature of designed to conduct an accurate experimental analysis.
the soil and its density, nature of the explosive com- Methods using the time or arrival of the shock
pound) and is prone to large uncertainties. The litera- wave at large distances suffer from interference with
ture reports large variations in these relations. the dense urban structure. Methods using the measure-
An essay of measuring the energy yield from the ments of the fireball evolution are restricted by the
crater dimensions has been done by Pasman et al. [35]. frame rate limits of the smartphones and associated
They report a diameter of 124 m and varying values with large margin of errors.
of the depth 13.7, 23 and 43 meters. (The value of 43 Finally, taking the uncertainties and the large
meters was reported in the news without any physi- error margins of the different methods, the best way
cal proof and the value of 13.7 and 21 meters were would be to model the explosion using the exact urban
scaled from the diameter value). Although scaling re- structure, but then again, this requires an established
lations report a much larger depth/diameter ratio for material model/equation of state of the ammonium ni-
the craters, Beirut explosion does not seem to follow trate and the actual physical conditions at the time of
this trend. In fact, a hydrographic survey was executed the explosion. This is beyond the reach and purpose of
on 10/08/2020, 6 days after the event by the Lebanese the current study. Much still needs to be learnt.
navy (communicated to us through a private communi-
cation and can be seen in fig 8). The crater shape was
an ellipsoid whose major axis was measured to about 6 Conclusions and Future Work
117 m and a maximum depth from the surface of the
water of only about 4 m. The fireball evolution created by the detonation
Here we reuse the same equations as used by these in Beirut port on the 4th of August 2020 is traced us-
authors, to derive a TNT and AN equivalent mass. The ing publicly available videos. The footage are used to
first equation is given by Mannan [30] and has the form extract frames separated by 16.66 − 33.33 milliseconds.
8
of v = 0.4W 7 where W is the mass explosives in [lb] Pixel calibration is done using the existing silos build-
and V the volume of the crater in [ft3 ]. We calculate the ing and defining accurate line of sight incident angles.
volume of the crater by building the sectional profile as Here we draw our main conclusions :
shown on the survey and extruding it along a circular
path of 117 m and 124 m diameter and noting that the 1. The evolution of the fireball is used to track the
deck is 1.2 m higher than the surface of the water. This shock front in the first 170 milliseconds until 130
yields a total volume range of 42700 − 48600 m3 and meters from the explosion center, at a scaled dis-
therefore an explosive mass of 257−287 tons TNT. This tance of z = 1.84 m1 in excellent agreement with
kg 312 Charles J.Aouad1 et al.
Fig. 8 Hydrographic survey on the 10/08/2020, 6 days after the explosion. The survey was executed by the Lebanese Navy
and communicated to us through a private communication. The deepest point below the water level is 4 meters. Height of the
concrete deck is 1.2 meters above water level. A schematic section is shown below. The volume is calculated by extruding the
profile along a circular path of 117-124 m diameter.
scaled distances for the shock wave/fireball separa- nation is 526 ± 210 tons, much less than the quan-
tion derived from experimental data. The Evolution tity claimed available by the authorities (2750 tons).
of the fireball follows a power law with exponent This can be due either to a late deflagration to det-
≈ 0.4 consistent with a Sedov-Taylor model with onation transition thus reducing the input in the
spherical dimensionality and instantaneous energy blast energy, either the missing quantity was not
release. physically available at the time of the explosion.
2. The fireball radius evolution follows a theoretical 5. A rapidly expanding vapour cloud has been clearly
drag model and reaches an asymptotic limit at about seen; it is caused by the negative phase after the
140−145 meters, a distance beyond which its expan- passage of the pressure wave. Future work shall in-
sion is brought to a halt. The scaled distance of this clude observational investigations of its kinematics
stopping distance using our derived TNT equivalent and possible links to theoretical models.
charge weight z = 2.02 m1 is in excellent agreement
kg 3
with other stopping scaled distances observed from
Acknowledgements The authors would like to thank the
published experimental data.
referees for their valuable comments which improved the con-
3. We have found a total TNT equivalence of the ex- tent of the current study. Additionally, the authors express
plosion of 200±80 tons at a distance range of 60-140 their thoughts to the victims of this tragic event and wishes
meters in accordance with Dewey [12]. for the recovery of the wounded. We express our thoughts for
the city of Beirut, hoping a prompt and efficient reconstruc-
4. Using a TNT to ammonium nitrate conversion fac-
tion. We primarily thank the eyewitnesses who posted their
tor of 38% [32], we find that the actual mass of videos on social media, for without them this article would
ammonium nitrate that participated in the deto- not have been possible (ex: Elias Abdelnour). We are alsoBeirut explosion 13
[4] United States. Department of the Army. NATO
Handbook on the Medical Aspects of NBC Defen-
sive Operations. Depts. of the Army, the Navy,
and the Air Force, 1973.
[5] W.E. Baker and Southwest Research Institute.
Explosions in Air. v. 1. University of Texas Press,
1973. isbn: 9780292720039. url: https://books.
google.ae/books?id=iv4oAQAAMAAJ.
[6] F A Baum, KP Stanyukovich, and Bo Io Shekhter.
Physics of an Explosion. Tech. rep. Army Engi-
neer Research and Development Labs Fort Belvoir
VA, 1959.
[7] TV Bazhenova, LG Gvozdeva, and MA Nettle-
ton. “Unsteady interactions of shock waves”. In:
Progress in Aerospace Sciences 21 (1984), pp. 249–
331.
[8] Hans A Bethe et al. Blast wave. Tech. rep. LOS
ALAMOS NATIONAL LAB NM, 1958.
[9] M Braithwaite. Ammonium nitrate–fertiliser, ox-
idiser and tertiary explosive. a review of ammo-
nium nitrate safety issues based on incidents, re-
Fig. 9 Video 3, taken from a distance of 666 meters from
the explosion. 6 frames separated by 33.33 ms. The fireball search and experience in the safety field, Table p.
fits are shown in red circles. 29, UKELG; 10 September 2008; Loughborough;
33 pp. 2020.
[10] CNW. Close in footage of the Beirut explosion
thankful to, Alexandra Elkhatib, Samuel Rigby, Jorge Diaz,
Gerard-Philippe Zehil, Philip James, Toni el Massih, Nabil from just 500 meters away. https://twitter.
Abou Reyali and Igor Chilingarian for useful discussions, and com/ConflictsW/status/1292101616657666048.
Ranjesh Valavil and Abbas Chamseddine for their help. [06:13 PM. 08 August, 2020.Tweet]. 2020.
[11] David Cormie, Geoff Mays, and Peter Smith. Blast
effects on buildings. ICE publishing, 2019.
Conflict of interest [12] JM Dewey. “The TNT and ANFO equivalences
of the Beirut explosion”. In: Shock Waves (2021),
The authors declare that they have no conflict of
pp. 1–5.
interest. The authors wish to state that referencing a
[13] JM Dewey and DJ McMillin. “Compendium of
social media profile does not indicate endorsement of
blast wave properties”. In: Def. Res. Est. Suffield,
the political or other views of that user.
Contract Rept ().
[14] Jorge S Diaz. “Explosion analysis from images:
References Trinity and Beirut”. In: arXiv preprint
arXiv:2009.05674 (2020).
[1] Németh Ágoston. ORIGINAL Beirut explosion [15] Abir Ghattas. My brother sent me this, we live 10
frame by frame HD, slow motion. https://www. KM away from the explosion site and the glass of
Youtube.com/watch?v=0tQ80Sj3QUs. [07:30 PM. our bldgs got shattered. https://twitter.com/
04 August, 2020. AbirGhattas/status/1290671474269986822. [07:30
Online; accessed 04-August-2020.Youtube]. 2020. PM. 04 August, 2020. Online; accessed 04-August-
[2] Arab center for architecture. [through private com- 2020.Tweet]. 2020.
munication]. 2020. [16] SD Gilev and VF Anisichkin. “Interaction of alu-
[3] Al-Arabiya. Compilation of videos show moment minum with detonation products”. In: Combus-
explosions rip at Beirut port. https : / / www . tion, Explosion and Shock Waves 42.1 (2006), pp. 107–
Youtube . com / watch ? v = NFjDq - Rsyjo. [07:30 115.
PM. 04 August, 2020. Youtube]. 2020. [17] JM Gordon, KC Gross, and GP Perram. “Fire-
ball and shock wave dynamics in the detonation
of aluminized novel munitions”. In: Combustion,14 Charles J.Aouad1 et al.
Fig. 10 For each video the incident angle of sight towards the silos long facade is shown along with the actual picture of the
silos and the de-projection lines. Drawings provided by the [2]. For calibration of video 5 refer to appendix.
Explosion, and Shock Waves 49.4 (2013), pp. 450– Development Center, Ballistic Research Labora-
462. tory, 1984.
[18] Henri Hugoniot. “Memoir on the propagation of [25] Ho-Young Kwak, Ki-Moon Kang, and Ilgon Ko.
movements in bodies, especially perfect gases (first “Expanding of Fire-Ball and Subsequent Shock
part)”. In: J. de l’Ecole Polytechnique 57 (1887), Wave Propagation by Explosives Detonation in
pp. 3–97. Underwater”. In: Fluids Engineering Division Sum-
[19] Charles M Jenkins et al. “Explosively driven par- mer Meeting. Vol. 44403. 2011, pp. 2833–2840.
ticle fields imaged using a high speed framing [26] La Nación Costa Rica. Beirut EXPLOSION that
camera and particle image velocimetry”. In: In- killed dozens of people CLOSE VIEW. https :
ternational journal of multiphase flow 51 (2013), / / www . Youtube . com / watch ? v = Nr9 _ kvw2aO0.
pp. 73–86. [07:30 PM. 04 August,2020. Youtube]. 2020.
[20] Satoshi Kadowaki. “Instability of a deflagration [27] Bernard Lewis and Guenther Von Elbe. Com-
wave propagating with finite Mach number”. In: bustion, flames and explosions of gases. Elsevier,
Physics of Fluids 7.1 (1995), pp. 220–222. 2012.
[21] Vasilis Karlos and George Solomos. “Calculation [28] MA Liberman et al. “Deflagration-to-detonation
of blast loads for application to structural com- transition in highly reactive combustible mixtures”.
ponents”. In: Luxembourg: Publications Office of In: Acta Astronautica 67.7-8 (2010), pp. 688–701.
the European Union (2013). [29] Julian Ellis Mack. Semi-popular motion-picture
[22] Kaori Kato et al. “A numerical scheme for strong record of the Trinity explosion. Vol. 221. Tech-
blast wave driven by explosion”. In: International nical Information Division, Oak Ridge Directed
journal for numerical methods in fluids 51.12 (2006), Operations, 1946.
pp. 1335–1353. [30] Sam Mannan. Lees’ Process Safety Essentials: Haz-
[23] AM Khokhlov, ES Oran, and GO Thomas. “Nu- ard Identification, Assessment and Control.
merical simulation of deflagration-to-detonation Butterworth-Heinemann, 2013.
transition: the role of shock–flame interactions [31] Paolo A Mazzali et al. “A common explosion mech-
in turbulent flames”. In: Combustion and flame anism for type Ia supernovae”. In: Science 315.5813
117.1-2 (1999), pp. 323–339. (2007), pp. 825–828.
[24] Charles N Kingery and Gerald Bulmash. Airblast [32] R Merrifield and TA Roberts. “A COMPARI-
parameters from TNT spherical air burst and hemi- SON OF THE EXPLOSION HAZARDS ASSO-
spherical surface burst. US Army Armament and CIATED WITH THE TRANSPORT OF EXPLO-Beirut explosion 15
SIVES AND INDUSTRIAL CHEMICALS WITH [46] Geoffrey Ingram Taylor. “The formation of a blast
EXPLOSIVE PROPERTIES.” In: IChemE Sym- wave by a very intense explosion.-II. The atomic
posium. Vol. 124. 1991, pp. 209–224. explosion of 1945”. In: Proceedings of the Royal
[33] Ken’ichi Nomoto, Daiichiro Sugimoto, and Sa- Society of London. Series A. Mathematical and
dayuki Neo. “Carbon deflagration supernova, an Physical Sciences 201.1065 (1950), pp. 175–186.
alternative to carbon detonation”. In: Astrophysics [47] SE Woosley. “Type Ia supernovae: burning and
and Space Science 39.2 (1976), pp. L37–L42. detonation in the distributed regime”. In: The As-
[34] Elaine S Oran and Vadim N Gamezo. “Origins of trophysical Journal 668.2 (2007), p. 1109.
the deflagration-to-detonation transition in gas- [48] Fan Zhang, Paul A Thibault, and Rick
phase combustion”. In: Combustion and Flame Link. “Shock interaction with solid particles in
148.1-2 (2007), pp. 4–47. condensed matter and related momentum trans-
[35] Hans J Pasman et al. “Beirut ammonium nitrate fer”. In: Proceedings of the Royal Society of Lon-
explosion: Are not we really learning anything?” don. Series A: Mathematical, Physical and Engi-
In: Process Safety Progress 39.4 (2020), e12203. neering Sciences 459.2031 (2003), pp. 705–726.
[36] Christoph Pilger et al. “Yield estimation of the
2020 Beirut explosion using open access waveform
and remote sensing data”. In: (2020). Appendix
[37] William John Macquorn Rankine. “XV. On the
A Calibration of video 5
thermodynamic theory of waves of finite longi-
tudinal disturbance”. In: Philosophical Transac- Since the silos building is not visible in this video. We
tions of the Royal Society of London 160 (1870), locate the position of the camera on the map and determine
pp. 277–288. the distance to a visible face-on a car in the frame. Angular
calibration of pixels λ (in which a pixel corresponds to an
[38] SE Rigby et al. “Preliminary yield estimation of
angular measurement) is given by:
the 2020 Beirut explosion using video footage from −1 4.5 m
2β tan
social media”. In: Shock Waves (2020). ◦ −1
λ[ px ] = = 132 m
. (12)
[39] SE Rigby et al. “Reflected near-field blast pres- 26 px 26 px
sure measurements using high speed video”. In: Here 4.5 m is assumed to be a common length for a car and
132 m and 26 px are the distance to the car and the pixel size
Experimental Mechanics 60.7 (2020), pp. 875–888. of the car respectively.
[40] LI Sedov. “Propagation of strong blast wave”. In: The radius of the fireball in meters Rfm is thus given by
Prikl. Mat. Mech 10 (1946), pp. 235–247. Rf m = 630m × tan φ = 630m × tan(Rfpx λ). (13)
[41] Yanchao Shi, Hong Hao, and Zhong-Xian Li. “Nu- Here, 630 meters is the distance from the camera to the ex-
merical simulation of blast wave interaction with plosion, and Rfpx is the radius of the fireball in pixels. This
structure columns”. In: Shock Waves 17.1-2 (2007), is illustrated in Fig. 9. We do not perform further corrections
pp. 113–133. due to the deviation of the camera angle with respect to the
center of the explosion. These deviations will not cause varia-
[42] Peter D Smith and Timothy A Rose. “Blast wave tions larger than 2 % on the fireball radius. This is much less
propagation in city streets—an overview”. In: than the error margin propagated from all other variables.
Progress in structural engineering and materials
8.1 (2006), pp. 16–28.
Table 4 Scaling parameters for V5
[43] Chris Stennett, Sally Gaulter, and Jackie Akha-
van. “An Estimate of the TNT-Equivalent Net R λ tan φ Rf m T
Explosive Quantity (NEQ) of the Beirut Port Ex- pixels [◦ px−1 ] [meters] seconds
78 0.0765 0.101 65.84 0.033
plosion Using Publicly-Available Tools and Data”.
100 0.0765 0.131 84.61 0.066
In: Propellants, Explosives, Pyrotechnics 45.11 ( 120 0.0765 0.158 101.81 0.099
2020), pp. 1675–1679. 135 0.0765 0.178 114.80 0.133
[44] Ferenc Morton Szasz. The day the sun rose twice: 148 0.0765 0.192 126.13 0.166
157 0.0765 0.208 134.03 0.199
The story of the Trinity site nuclear explosion,
168 0.0765 0.223 143.734 0.233
July 16, 1945. UNM Press, 1984.
[45] Geoffrey Ingram Taylor. “The formation of a blast
wave by a very intense explosion I. Theoretical
discussion”. In: Proceedings of the Royal Society
of London. Series A. Mathematical and Physical B Frames from videos 1-4-6
Sciences 201.1065 (1950), pp. 159–174.
Frames extracted from different videos located on the
map in fig 2. For frame rates refer to table 1. Each frame16 Charles J.Aouad1 et al.
Fig. 11 Scale calibration for video 5: on the right panel the
length of a passing car is measured in pixels. By determin-
ing the distance from the general map and assuming a total
length of the car of 4.5 meters we calculate the angular field
of view per pixel λ. Using the value of λ and knowing the
distance to the explosion site, we can measure the angle φ
and convert the pixel measurements of the fireball to meters.
shows the fireball along with the circle fit to determine the
physical length. The detonation is assumed to have happened
anytime between the first and the second frame. For pixel Fig. 13 Video4-distance 550 m
calibration method see section 2.
Fig. 14 Video6-distance 1126 m
Fig. 12 Video 1-distance 1146 meters. The dark spot seen
within the vapour cloud in the last frame is a trace of the
diffraction/interaction of the pressure wave with the existing
silos building.You can also read