Monitoring the response of volcanic CO2 emissions to changes in the Los Humeros hydrothermal system - Nature
←
→
Page content transcription
If your browser does not render page correctly, please read the page content below
www.nature.com/scientificreports
OPEN Monitoring the response of volcanic
CO2 emissions to changes
in the Los Humeros hydrothermal
system
Anna Jentsch1,2*, Walter Duesing1, Egbert Jolie1 & Martin Zimmer1
Carbon dioxide is the most abundant, non-condensable gas in volcanic systems, released into the
atmosphere through either diffuse or advective fluid flow. The emission of substantial amounts of
CO2 at Earth’s surface is not only controlled by volcanic plumes during periods of eruptive activity
or fumaroles, but also by soil degassing along permeable structures in the subsurface. Monitoring
of these processes is of utmost importance for volcanic hazard analyses, and is also relevant for
managing geothermal resources. Fluid-bearing faults are key elements of economic value for
geothermal power generation. Here, we describe for the first time how sensitively and quickly
natural gas emissions react to changes within a deep hydrothermal system due to geothermal fluid
reinjection. For this purpose, we deployed an automated, multi-chamber CO2 flux monitoring system
within the damage zone of a deep-rooted major normal fault in the Los Humeros Volcanic Complex
(LHVC) in Mexico and recorded data over a period of five months. After removing the atmospheric
effects on variations in CO2 flux, we calculated correlation coefficients between residual CO2 emissions
and reinjection rates, identifying an inverse correlation of ρ = − 0.51 to − 0.66. Our results indicate
that gas emissions respond to changes in reinjection rates within 24 h, proving an active hydraulic
communication between the hydrothermal system and Earth’s surface. This finding is a promising
indication not only for geothermal reservoir monitoring but also for advanced long-term volcanic risk
analysis. Response times allow for estimation of fluid migration velocities, which is a key constraint for
conceptual and numerical modelling of fluid flow in fracture-dominated systems.
Worldwide, a large number of caldera-hosted geothermal systems are located along volcanic arcs, such as the Los
Humeros Volcanic caldera (LHVC) in the Trans-Mexican Volcanic Belt (Mexico) or Onikobe in the Honshu Arc
(Japan). Such geothermal systems contain a vast potential of geothermal energy1,2. Calderas are very complex,
large-scale3 geological structures that provide elevated heat flow within relatively shallow depths (< 2 km) lasting
for several thousands of years. This makes them a preferred target in geothermal e xploration4–6. Their structural
evolution is of particular interest, since a comprehensive understanding of the localization of permeable fluid
pathways, as well as of their structural controls, are key objectives for the successful utilization of geothermal
energy7,8. Deep-rooted fault zones and fracture networks connecting geothermal reservoirs to Earth’s surface
channel vast amounts of hydrothermal fluids9–12. In undisturbed conditions, migrating fluids can form stable
and long-lasting geothermal surface manifestations such as fumaroles or hot springs, which provide valuable
information about reservoir conditions13,14. However, volcano-tectonic activity or the development of geothermal
resources for power generation can change this equilibrium.
A sustainable field management requires comprehensive monitoring of physical and chemical changes in
geothermal reservoirs during production and reinjection of fluids for a timely reaction to pressure decline and
temperature depletion, respectively15. Reinjection of extracted geothermal fluids (brine) into the feed, or loss
zones, of a geothermal system is essential to maintain reservoir pressure and fluid recharge, control subsidence
and avoid contamination of local ground water16,17. This requires site-specific strategies for reinjection at suitable
locations, thus avoiding any interference in the production zone by thermal breakthrough, mineral precipitation
or induced s eismicity18,19.
1
Helmholtz Centre Potsdam German Research Centre for Geosciences GFZ, Telegrafenberg, 14473 Potsdam,
Germany. 2Institute of Geosciences, University of Potsdam, Karl‑Liebknecht‑Str. 24‑25, 14476 Potsdam,
Germany. *email: ajentsch@gfz-potsdam.de
Scientific Reports | (2021) 11:17972 | https://doi.org/10.1038/s41598-021-97023-x 1
Vol.:(0123456789)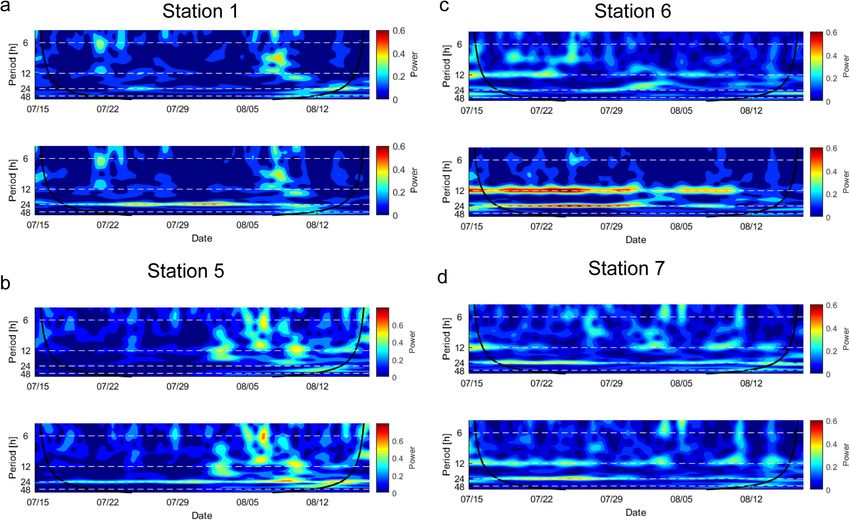
www.nature.com/scientificreports/
Figure 1. (a) Location of the Los Humeros Volcanic Complex (LHVC) on the border of the federal states
Puebla and Veracruz on a 120 m-resolution digital elevation model (DEM), available at https://www.inegi.org.
mx/app/geo2/elevacionesmex/. (b) Overview of the main production field of Los Humeros (Installed capacity
93.9 MWe21) on a shaded relief image obtained from a 1 m-resolution D EM22. White solid and dashed lines
illustrate known and inferred faults, respectively. Orange circles represent locations of seismic events from
September 2017 to September 201823. The inset map, illustrated by the white dashed rectangle, shows the extent
of the LHVC and Los Potreros calderas hosting the active geothermal field. The maps were generated using
ArcGIS 10.4.1 software. (c) Setup of the C O2 monitoring array within the fault damage zone of the Los Humeros
fault. Ts values indicate ground temperatures measured during the initial site selection survey, while black
arrows show the direction and extension of fault geometry parameters.
For the first time, in this study we investigated the relationship between induced C O2 flux variability and
changes in reinjection rates in a geothermal system. We deployed a multi-chamber CO2 flux monitoring system
within the damage zone of a large normal fault crossing the Los Humeros geothermal field, in combination
with an on-site meteorological station. After we quantified the variations in C
O2 flux induced by atmospheric
parameters, we used the time series of residual CO2 emissions to calculate their correlation coefficients with
daily reinjection rates. The results show an inverse correlation between the two parameters within a time win-
dow of ≤ 24 h. We additionally discuss further unmonitored variables and nonlinear processes that could have
a potential impact on C O2 variations.
Our approach combines geochemical surface data and physical subsurface data in order to develop a thor-
ough understanding of induced fluid migration from the geothermal reservoir along specific flow paths to the
Earth’s surface.
Los Humeros geothermal system. The Los Humeros Volcanic Complex (LHVC) is the result of the larg-
est caldera-forming eruption in the 1000 km-long Trans-Mexican Volcanic Belt (TMVB) (Fig. 1a). Ref. 20 deter-
mined that the LHVC contains a volume of 290 km3,1b).
The LPC hosts the high-temperature (~ 380 °C at > 2100 m below surface), two-phase, liquid-dominated
Los Humeros geothermal reservoir, which is controlled by secondary permeability, e.g., faults and f ractures24.
The reservoir fluids are rich in C O2 and other non-condensable gases25,26. Helium isotopic ratios, determined
in fluid samples from wells, are characteristic of the sub-continental mantle and suggest heat supply from an
active magmatic system27.
Both volcanic activity and regional tectonics are the dominant forces on the structural architecture of the
caldera. The volcano-tectonic interaction is responsible for the fault system’s c omplexity28. Formation perme-
ability of the andesitic to basaltic geothermal reservoir is very low (K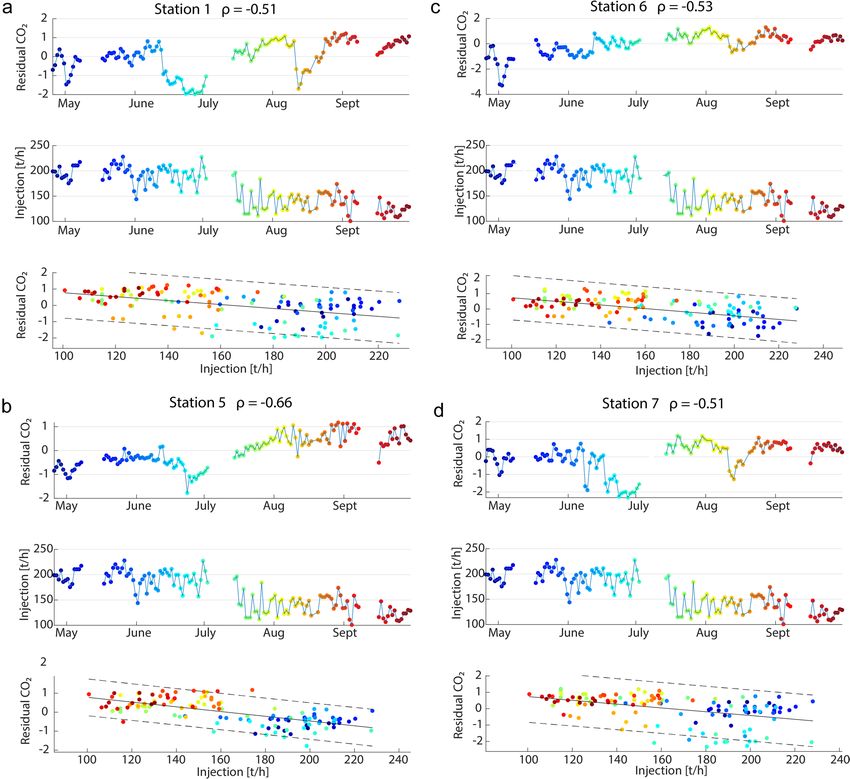
www.nature.com/scientificreports/
Cuesta, Loma Blanca, Los Conejos) build a horsetail structure forming a wide zone of substantial hydrothermal
alteration28. Within this structure, increased CO2 degassing and multiple thermal anomalies with ground tem-
peratures up to 92 °C at 50 cm d epth30,31 are observed. The Los Humeros fault is a deep-seated, permeable fault
zone facilitating the migration of geothermal fluids. It is therefore targeted by both production and reinjection
wells (Fig. 1b). This makes the fault an ideal location in which to study the response of natural gas emissions at
Earth’s surface to reinjection-induced changes in the geothermal reservoir.
Data and methods
We installed an LI-COR Li-8100 automated soil C O2 flux monitoring system with seven accumulation chambers
on an area of 50 m2 in combination with an on-site weather station (MWS 9-5; Fig. 1c, Fig. S1; Table S1 in the
supplemental material) for continuous observation of air temperature, barometric pressure, air humidity, pre-
cipitation, and wind speed and direction. The monitoring site was chosen to be well-linked to a fault displaying
thermal anomalies and increased degassing, distinctive from background C O2 emissions. For this reason, C O2
flux and ground temperatures at 50 cm depth were measured before the monitoring network was deployed.
The vegetation cover of the study site is sparse and characterized by irregular tufts of grass, small shrubs,
cacti and agaves. Several pine trees border the eastern side of the monitoring area; thus, we cannot exclude the
influence of root respiration32 on CO2 flux at stations 3, 4 and 6 (Fig. S1). Most of the study site lacks a surficial
organic layer due to anomalous ground temperatures ( Ts > 30 °C) that control the distribution of argillic altera-
tion, as recognized by clay minerals such as k aolinite33. The subsurface consists of alternating layers of uncon-
solidated pumice and scoria lapilli, which have a wide range of grain sizes34. Each monitoring station measured
soil CO2 flux on an hourly basis following the accumulation chamber method11,35,36 over a period of five months,
from April to September 2018. The setup with multiple accumulation chambers was chosen due to the follow-
ing advantages compared to single monitoring stations: (i) monitoring CO2 fluxes of different magnitudes and
origins (hydrothermal/biogenic), (ii) continuous datasets for benchmarking between individual sampling sites,
(iii) robust quantitative assessment of the influence of meteorological parameters on gas flux, and (iv) under-
standing the spatial variability of C O2 flux on small areas in relation to (sub)surface heterogeneities (fault zone
architecture, soil type, alteration).
The geothermal reservoir has been the site of more than 60 wells in the past 40 years37. Infield reinjection
began five years after the commercial utilization of geothermal energy started in 1 99038. Currently, three wells
with depths of 2200 m are used to reinject geothermal fluids at a total average rate of 171 t/h and 28 production
wells with a production of 663 t/h (2018, unpublished data from CFE Comisión Federal de Electricidad; Fig. 1b).
The amount of reinjected fluids at Los Humeros depends on the available brine, which has always been low
compared to the amount of produced fluids (liquid and steam). An increase in reinjection rates usually occurs
in response to an observed decline in productivity, but it is a balancing act to inject the appropriate amount of
fluids without decreasing production enthalpies. In recent years, geothermal operators at Los Humeros have
incorporated condensing technologies into the power units to increase the amount of fluids used for reinjection
(personal communication). Daily reinjection and monthly production rates were provided by the geothermal
power plant operator CFE.
From September 2017 to September 2018, seismic activity was continuously monitored using 25 broadband
and 20 short-period stations across the Los Humeros geothermal fi eld23. Three distinct clusters of induced/
natural seismicity (MLV ≤ 2.1) are indicated in the vicinity of production and reinjection wells (Fig. 1b) at depths
between 1 and 3.5 km, corresponding to the depth of the geothermal reservoir. During C O2 flux monitoring, the
magnitude of seismic events (124 in total) ranged from − 0.61 to 2.1 M LV (unpublished data).
The collected datasets were statistically analysed using MATLAB software version R2019b. The statistical
correlations among (i) the C O2 flux chambers and (ii) each CO2 flux chamber and the meteorological parameters
were calculated using a spearman’s rank correlation matrix. Removing atmospheric effects on C O2 flux data
is crucial for determining the influence of endogenous processes on C O2 variations37–41. This was conducted
by computing a stepwise multiple linear regression model (SMLRM)42 for each CO2-flux time series. For the
SMLRM, we excluded all data gaps, thereby reducing the multidimensional data set from 3552 to 2971 data
points. The stepwise regression is a systematic method that describes the relationship between the response
variable (CO2 flux) and the predictor variables (atmospheric parameters) by first adding and then removing
one variable at a time to the model. The final model is reached when the residual sum of squares ( R2) no longer
changes. The adjusted R2 value explains the amount of variation computed by the linear regression model.
The p-value is a criterion which defines whether variables should be removed or added to the model, with the
default threshold set to 0.05. A p-value below 0.05 is usually considered to be a sufficient rejection of the null
hypothesis43. The major advantage of this algorithm is that only predictor variables which significantly influence
the response variable are included in the model. To further interpret the results from the SMLRM, we gener-
ated several continuous wavelet transformations (CWTs) from the hourly-measured CO2 flux time series and
the residuals of the stepwise regression models. Finally, we calculated the Spearman correlation coefficients (ρ)
between residual CO2 time series and fluid reinjection rates. In order to compare the two different time series,
we reduced the hourly-measured C O2 fluxes to daily averages. This was done in two steps. We first used a 24-h
Gaussian filter providing zero phase shift by running in both the forward and reverse directions, smoothing
the hourly measured C O2 fluxes. As a second step, we used a shape-preserving piecewise cubic interpolation to
identify adequate numbers of sampling points from the hourly-measured C O2 data and down sample the C O2
fluxes to the time series of the lower-resolution daily injection data (Fig. 2). Additionally, a linear regression
analysis was performed to model the relationship between CO2 flux residuals and reinjection rates and calculate
of a 95% confidence interval.
Scientific Reports | (2021) 11:17972 | https://doi.org/10.1038/s41598-021-97023-x 3
Vol.:(0123456789)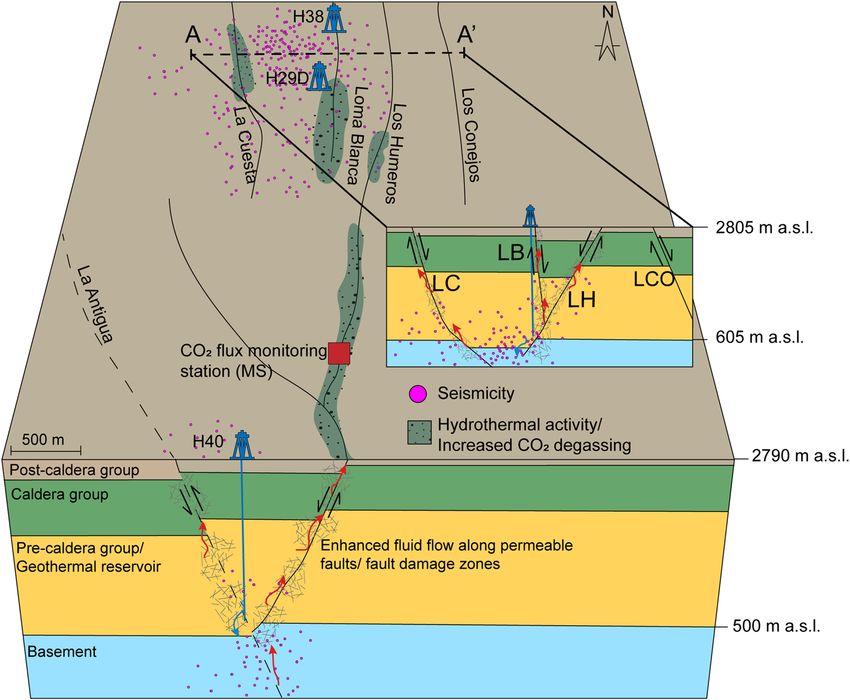
www.nature.com/scientificreports/
Figure 2. Workflow of the statistical analysis of the monitored data. Part I shows a flow chart of the stepwise
multiple linear regression model (SMLRM). The SMLRM requires two input variables, the predictor variable,
and the response variable. While the predictor variable usually consists of a multidimensional data set, as in our
case atmospheric parameters (e.g., air temperature, wind speed), the response variable is a one-dimensional data
set (measured C O2 flux). The output of the SMLRM is a linear regression model that represents the variability
of the response variable according to the predictor variables. The remaining residuals represent the variability
of the response variable which is not explained by the predictor variables. In this study we focused on the
residuals. Part II visualizes the resampling of the residuals. (a) Describes the application of the 24-h Gaussian
filter running in both, forward and reverse directions, (b) to smooth the hourly measured C O2 fluxes. (c)
Shows the application of a shape-preserving piecewise cubic interpolation and finally, (d) resampling of hourly
resolved residuals of the SMLRM to daily resolution. Consequently, we obtain daily resolved residuals that can
be correlated with daily reinjection rates.
Results and discussion
Each CO2 emissions time series is characterized by strong variability in daily mean flux rates and a decrease
at all stations from April to June, followed by a moderate increase from July to September (Fig. 3a, Fig. S2 and
Table S2). Despite the close proximity of the seven monitoring stations, the different time series do not always
indicate coherent behaviour. Given that background/biogenic CO2 fluxes at Los Humeros usually do not exceed
20 g m−2 d−1, the mean C
O2 flux value of each station suggests input from hydrothermal degassing, as also sup-
ported by carbon isotopic samples taken at two sites within the monitoring area (δ13CCO2 = − 3.3 and − 3.1‰)44.
Scientific Reports | (2021) 11:17972 | https://doi.org/10.1038/s41598-021-97023-x 4
Vol:.(1234567890)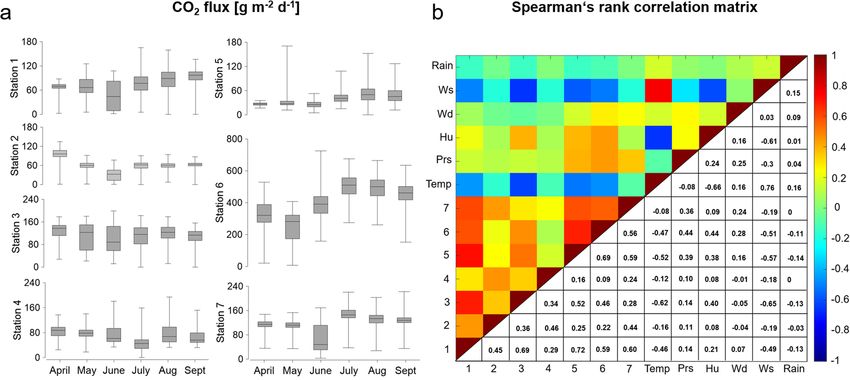
www.nature.com/scientificreports/
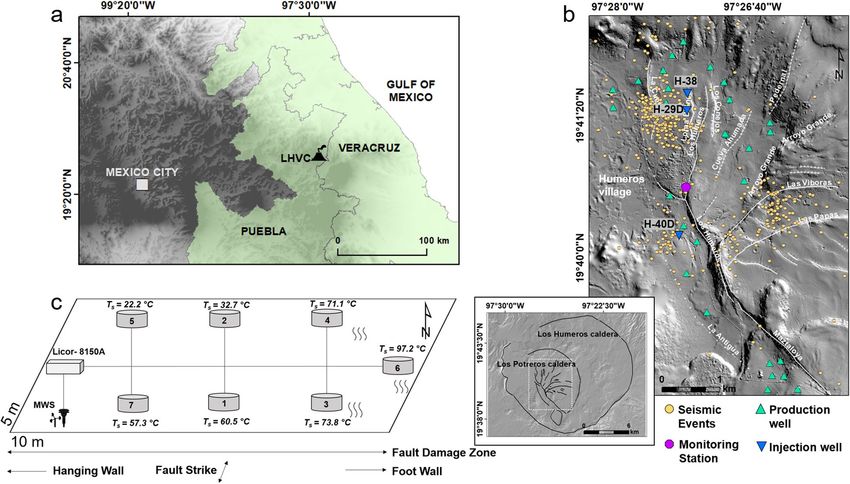
Figure 3. (a) Boxplots showing the variability of CO2 flux values during the monitoring period. (b) Spearman
correlation coefficients showing the relationship between stations and atmospheric parameters. The y-axis labels
are defined as follows: Temp air temperature, Prs barometric pressure, Hu air humidity, Wd wind direction, Ws
wind speed, Rain.
In fact, hydrothermal degassing at rates similar to biogenic fluxes can result from low permeability of soil/rocks
or low-pressure g radients31. At Station 6, C
O2 flux values were observed to be twice as high compared to values
at the other monitoring stations. Along with a ground temperature of 97.2 °C, this is indicative of advective fluid
transport. However, low degassing rates, as observed at station 2, 4 and 5, provide evidence for mixed diffusive-
advective gas transport. Diurnal variations between 130–475 g m−2 d−1 (Station 6) demonstrate the dynamic
behaviour of fluid migration within this highly-permeable fault zone. The strong variations of C O2 flux in such
a constrained area are affected by (i) different transport mechanisms of fluid flow (advective/diffusive), (ii) vari-
able intensities of hydrothermal alteration, (iii) subsurface heterogeneities, (iv) fault zone architecture/migration
pathways, and eventually, (v) atmospheric parameters. Stations 1, 5, 6 and 7 demonstrate similar behavior to
each other and to meteorological parameters (Fig. 3b).
Atmospheric effects on CO2 flux. The Spearman´s rank correlation revealed that the strongest negative
correlations occurred between CO2 flux and wind speed as well as air temperature. Both of these atmospheric
parameters are strongly positively correlated with each other. Atmospheric pressure, on the other hand, shows
only a weak positive correlation with CO2 flux at stations 5, 6, and 7, while at the other stations no correlation
is detected.
Wind speed demonstrates the greatest influence on C O2 flux for the majority of stations (Table S4). The
moderate to strong inverse correlation between wind speed and CO2 flux at stations 1, 3, 5, and 6, shown in blue
(Fig. 3b), suggests that either high wind speeds inhibit the migration of C O2 from the soil or that C
O2 is diluted
with ambient air, that penetrates the shallow and partially porous subsurface favoured by topography. In fact,
the west-facing topographic scarp of the NNE-SSW-striking Los Humeros fault is exposed to the main wind
directions measured during the monitoring period (Fig. S4). A possible link between surface topography and
CO2 flux has already been discussed in a study performed at Mammoth Mountain in California45,46. Considering
that barometric pressure was relatively stable during the monitoring period (Fig. S3 and Table S3), we suspect
that the positive correlation with CO2 flux (stations 5, 6 and 7) is either a spurious correlation or a superposition
by stronger atmospheric parameters, such as wind speed, that masks the barometric pumping e ffect47.
Although rainfall and C O2 flux do not have significant correlation coefficients (Fig. 3b), we observe an effect
of heavier rain periods on CO2 emissions (Fig. S2). We assume that with increased precipitation, the upper,
altered soil layer becomes saturated with water, forming a gas seal that prevents CO2 degassing. To protect the
equipment from condensation, no measurements were taken when air humidity exceeded 90%, resulting in a
few data gaps during the end of June and in the first half of August. An overview of the statistical distribution of
atmospheric parameters is provided in the supplementary material (Table S3).
Application of the SMLRM revealed that between 7 to 39% of CO2 flux variations can be explained by atmos-
pheric parameters, with less than 10% of the variations explained by atmospheric parameters at stations 2 and 4.
In comparison to the other stations, station 4 shows more spike-like variations and no cyclic behavior (Fig. S2,
S5). A detailed summary of the results at each station can be found in Table S4 in the supplementary material.
The results of the CWT on CO2 flux and model residuals show that a 24-h cycle is evident at nearly all stations,
while semi-diurnal cycles are less pronounced (Fig. 4, Fig. S5). It is not surprising that stations 2 and 4 do not
show any cyclic behavior, as the results of the SMLRM show the least influence from atmospheric parameters,
thus emphasizing the impact of unmonitored variables on their variations. The residual C O2 flux rates at stations
Scientific Reports | (2021) 11:17972 | https://doi.org/10.1038/s41598-021-97023-x 5
Vol.:(0123456789)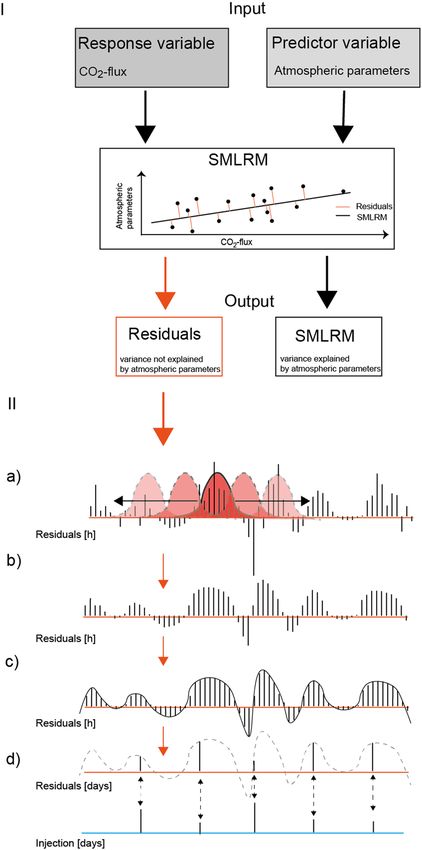
www.nature.com/scientificreports/
Figure 4. Wavelet power spectrum for the period from mid-July to mid-August at: (a) station 1, (b) station 5,
(c) station 6, and (d) station 7. The lower spectrogram at each station shows the initial C
O2 flux, while the upper
spectrogram shows the residual CO2 flux. The time period shown here was chosen because of its continuous
data coverage. Black solid lines represent the cone of influence, with areas outside the black line potentially
affected by edge-effect artefacts. The wavelets were created with the MATLAB software, version R2019b.
1 and 5 show no cyclic behavior, while for stations 3, 6 and 7, the strengths of 12-h and 24-h cycles become weaker
but are still visible. Consequently, the SMLRM and CWT prove that further unmonitored variables affect C O2
flux variations, which are discussed in the following paragraph.
Effects of the shallow subsurface on CO2 flux. Soil porosity and intrinsic permeability play major roles
in the vadose zone, since they determine fluid flow mechanisms (advection/ diffusion) and flow directions39,47,48.
On average, the uppermost layer in the geological succession of the Los Humeros geothermal reservoir consists
of 100 m-thick, unconsolidated pumice and scoria fall deposits with porosities of up to 50%29. Hydrothermal
alteration of varying intensity, as seen throughout the study area, is induced by fluid-rock interactions and affects
petrophysical rock properties26.
Some studies have shown that soil temperature and soil water content contribute significantly to variations in
CO2 flux due to increased biological oxidation, or near-surface steam c ondensation47,49,50, while others did not
identify any significant r elationship45. These parameters have not been measured continuously at our study site
due to technical difficulties with the sensors. However, a strong correlation between ground temperatures and
mean CO2 flux is supported by data from the initial site selection survey (e.g., station 1: 73 g m−2 d−1, 60.5 °C;
station 3: 109 g m−2 d−1, 73.8 °C; station 6: 418 g m−2 d−1, 97.2 °C; and station 7: 120 g m−2 d−1, 57.3 °C; Fig. 1c) and
reinforces the assumption that ground temperatures may explain some of the CO2 flux variation. Ultimately, the
damage zone of the Los Humeros fault substantially influences fluid migration from the hydrothermal reservoir
to the surface, as indicated by the strong variability of increased C O2 fluxes and hot ground temperatures. The
increase in permeability of fault damage zones as a result of extensive fracture networks has previously been
noted49–54. We relate heterogeneities and anisotropies in the shallow subsurface to a complex fracture network,
acting as a fluid conduit-barrier system, with the geometry and distribution of fractures related to normal dip-slip
kinematics and recent uplift of small magma b odies55. Mineral precipitation of quartz and calcite in fractures and
faults is the result of silica-rich geothermal waters and loss of CO2 at the boiling point33,56. Together with hydro-
thermal alteration at the surface, these processes may impede lateral and vertical fluid migration in certain areas,
while directing fluid flow to areas of higher permeability as previously observed in other geological systems57.
CO2 flux vs. fluid reinjection—implication for geothermal reservoir management. The key
finding of this study is the inverse correlation between the rate of low-temperature (approx. 90 °C) reinjected
fluids and residual CO2 flux (Fig. 5, Fig. S7). We identified this inverse correlation by removing the effects of
measured atmospheric parameters and calculating Spearman’s rank correlation coefficients between both time
Scientific Reports | (2021) 11:17972 | https://doi.org/10.1038/s41598-021-97023-x 6
Vol:.(1234567890)www.nature.com/scientificreports/
Figure 5. Temporal relationship between daily residual CO2 flux (upper plot) and total reinjected fluids (middle
plot) at: (a) station 1, (b) station 5, (c) station 6, and (d) station 7 and corresponding spearman correlation
coefficients (ρ). Linear regression analysis (bottom plots) illustrates the relationship between the C O2 flux
residuals and reinjection rates within the 95% confidence interval. Colours are used to visualize the data of the
respective time periods. The interrupted lines in the C O2 flux and reinjection curves represent data gaps that are
not considered in the determination of correlation coefficients.
series. For this purpose, we used the summarized flow rate of all three reinjection wells, referred to as total rein-
jected fluids (Fig. S6), and obtained moderate to strong negative correlation coefficients (ρ = − 0.51 to − 0.66) at
stations 1, 5, 6, and 7 (Fig. 5). These stations are also intercorrelated and show intermediate to strong correlations
with atmospheric parameters (Fig. 3b).
The spectral signatures of the residual time series from stations 1 and 5, visualized in their respective wavelet
power spectra, no longer show diurnal variations (Fig. 4). These results demonstrate that the SMLRM successfully
modelled atmospheric influences and that the residual time series are free of variations caused by atmospheric
changes. Therefore, they may represent variability related to changes in the geothermal reservoir, which could
explain the stronger correlation to reinjection of stations 1 and 5 compared to other stations. For example, the
lowest mean CO2 flux (40 g m−2 d−1) of all stations was measured at station 5. However, a temporal relationship
between low degassing rates, similar to those at station 5, and deep seismic activity has been monitored at Piton
de la Fournaise58 and supports our finding that lower CO2 emissions can provide information about dynamic
changes at depth. At stations 2, 3, and 4, no significant correlations to reinjection rates were calculated (Fig. S7).
As mentioned earlier, stations 2 and 4 differed in their response to daily atmospheric variations. They showed
strongly reduced power within the 24- and 12-h bands, indicating that those fluxes may not correspond as
strongly to atmospheric changes as other stations (Fig. S6).
Scientific Reports | (2021) 11:17972 | https://doi.org/10.1038/s41598-021-97023-x 7
Vol.:(0123456789)www.nature.com/scientificreports/
Station 3 shows strong 24- and 12-h cycles and a low correlation to reinjection rates of the respective residual
CO2 flux time series. Comparing the wavelet power spectrum of station 3 with the wavelet power spectrum of its
residuals, strong 24- and 12-h cycles remain, indicating that an atmospheric influence is still present (Fig. S6).
We assume that stations not correlated with reinjection rates are more strongly influenced by unmonitored
variables, e.g., soil temperature or soil humidity, as well as nonlinear processes such as: (i) fluid-rock interactions
(dissolution, mineralization) leading to changes in fracture permeability and soil/rock properties33,59, (ii) changes
in effective stresses by pore pressure perturbations from ascending fl uids60, and (iii) local and regional stress field
changes28,61 due to volcanic-tectonic forces influencing fracture distribution and geometry.
It is therefore unreliable to consider only one parameter when trying to understand which processes are
affecting CO2 in the subsurface, as complex physical, thermal, chemical and mechanical (THCM) processes
occur during the reinjection of cold geothermal brine into geothermal s ystems60–65.
To understand the inverse correlation of surface C O2 emissions and reinjection of cold water, we will discuss
some hypotheses below. However, we want to point out that none of these hypotheses is true on its own, but
rather they become valid when combined.
1st hypothesis: The natural upflow of andesitic and fossil fluids from the deep volcanic system can be sup-
pressed by high reinjection rates, reducing the ascendance of CO2 into the geothermal reservoir. This process
has already been described by a numerical model reported in Ref.63.
2nd hypothesis: Ref.63 also determined that a large amount of non-condensable gases such as CO2 can be
stored in reservoir rocks through mineral dissolution and precipitation.
Dissolved CO2 reacts with divalent cations such as Ca2+ and precipitates calcite, which is in agreement
with hydrothermal zones composed of calcite and other hydrothermal minerals found in well cuttings at Los
Humeros56. This trapping mechanism can be numerically modelled by either chemical or physical adsorption
of gases on the rock m atrix63.
3rd hypothesis: The deep reinjection of fluids into the low permeable rock matrix at 2000 m depth results
on the one hand in a pressure buildup, causing C O2 to remain in the dissolved phase and on the other hand a
reduction in boiling, which also has a positive effect on CO2 solubility66.
Future studies should focus on numerical models of coupled THCM processes, in order to evaluate the pro-
posed hypotheses and the role of discrete fracture networks and multi-phase fluid flow.
However, the response of C O2 emissions to a decrease or increase in reinjection rates within 24 h indicates
that the Los Humeros fault is a highly permeable structure, connecting the geothermal reservoir and Earth’s
surface. To exclude a potential time delay between the response of C O2 emissions and fluid reinjection, we also
calculated correlation coefficients when testing variable time lags, and did not observe an increase in correlation.
Consequently, we can define the response time of gas emissions to changes in reinjection rates as ≤ 24 h. A global
review paper on tracer tests summarizes that tracer velocities in the order of one to several tens of meters per
hour are not exceptional64. Increased fluid migration velocities are also indicated by tracer studies performed in
wells at Los Humeros67, thus supporting our results.
Natural gas emissions vs. seismic activity. Induced seismicity triggered by geothermal exploitation
causes changes in the thermal and poroelastic stresses of a r eservoir68. During our monitoring period, recorded
seismicity did not exceed a local magnitude of MLV 2.1 (unpublished data) with the majority of hypocentres
located at > 2 km depth, corresponding to the depth of the exploited geothermal reservoir23. In this study, we
found no clear relationship between residual CO2 flux and seismicity rate or associated magnitudes. However, we
suggest further study involving longer observation periods and seismic tremor analyses to validate this relation-
ship. In addition, C
O2 flux could be compared with more sensitive data such as structural changes obtained with
coda wave i nterferometry69. For this purpose, we would place the gas monitoring system along the fault trace of
seismically active faults with geothermal surface activity.
Conclusion
The characterization of fluid migration in geothermal fields plays an important role for the safe and sustainable
management of a reservoir. In this study, we have discussed various factors influencing the variation on CO2
emissions and demonstrated the effect of fluid reinjection on surface gas emissions. Our results indicate an
active hydraulic communication between the target zones of reinjection wells and hydrothermal surface mani-
festations along the Los Humeros fault, as illustrated by a simplified conceptual model (Fig. 6). This finding has
implications for novel reservoir monitoring concepts, including automated gas analytics for real-time analyses of
reservoir responses to geothermal reservoir operations (including stimulations). Multi-chamber systems provide
a fundamental tool for studying the high spatial and temporal variability of surface CO2 flux due to external fac-
tors, particularly within active structural settings where fluid flow is controlled by extensive fracture networks.
Several open questions remain; therefore future studies should investigate long-term monitoring of gas emis-
sions (≥ 12 months, ideally 24 months) and multiple gas monitoring systems should be installed across geother-
mal fields. In addition, coupled THCM models considering discrete fracture networks, integrated multi-phase
flow and reactive transport simulations could model the complexities discussed here, which is beyond the scope
of this publication.
Nevertheless, we have provided important evidence that surface CO2 flux responds to reservoir-induced
changes caused by reinjection of cold geothermal brine.
Regular sampling of carbon and noble gas isotopes using automated sampling techniques could complement
the analysis of changing reservoir conditions driven by geothermal exploitation.
Scientific Reports | (2021) 11:17972 | https://doi.org/10.1038/s41598-021-97023-x 8
Vol:.(1234567890)www.nature.com/scientificreports/
Figure 6. A simplified conceptual model showing enhanced fluid migration along steeply-dipping faults/
fault damage zones cutting through the Los Humeros geothermal system. Cross sections show the orientation
and connectivity of injection wells to faults. Red arrows illustrate the migration of hot reservoir fluids, while
blue arrows show the migration of colder reinjected fluids. Note that cross section A–A′ is located between
injection well H29D (deviated to the NW) and H38 and is intended to represent a buffer zone for this area. For
the exact location of seismicity, the reader is referred to Fig. 1b. The abbreviations are defined as follows: LH
Los Humeros, LB Loma Blanca, LC La Cuesta, LCO Los Conejos, a.s.l. above sea-level. Detailed descriptions of
lithologies referring to the different caldera groups can be found in Ref.70.
Geochemical and geophysical methods should be more commonly combined in integrated monitoring sys-
tems for optimized reservoir management. This also applies to other utilization concepts of the geological under-
ground, such as carbon capture storage systems.
Data availability
A data publication is available for this paper at https://doi.org/10.5880/GFZ.4.8.2021.003.
Received: 2 March 2021; Accepted: 3 August 2021
References
1. Stelling, P. et al. Geothermal systems in volcanic arcs: Volcanic characteristics and surface manifestations as indicators of geothermal
potential and favorability worldwide. J. Volcanol. Geotherm. Res. 324, 57–72 (2016).
2. Carrasco-Núñez, G. et al. Reappraisal of Los Humeros volcanic complex by new U/Th Zircon and 40Ar/39Ar dating: Implications
for greater geothermal potential. Geochem. Geophys. Geosyst. 19, 132–149 (2018).
3. Suñe-Puchol, I. et al. The Ilopango caldera complex, El Salvador: Origin and early ignimbrite-forming eruptions of a graben/
pull-apart caldera structure. J. Volcanol. Geotherm. Res. 371, 1–19 (2019).
4. Sorey, M. L. Evolution and present state of the hydrothermal system in Long Valley Caldera. J. Geophys. Res. 90, 11219–11228
(1985).
5. Amanda, F. F., Yamada, R., Uno, M. & Okumura, S. Evaluation of caldera hosted geothermal potential during volcanism and
magmatism in subduction system, NE Japan. Geofluids 2019, 1–14 (2019).
6. Wohletz, K. & Grant, H. Volcanology and Geothermal Energy (University of California Press, 1992).
7. Banerjee, A. et al. Deep permeable fault-controlled helium transport and limited mantle flux in two extensional geothermal systems
in the Great Basin, United States. Geology 39, 195–198 (2011).
8. Jolie, E., Klinkmueller, M., Moeck, I. & Bruhn, D. Linking gas fluxes at Earth’s surface with fracture zones in an active geothermal
field. Geology 44, 187–190 (2016).
9. Werner, C. & Cardellini, C. Comparison of carbon dioxide emissions with fluid upflow, chemistry, and geologic structures at the
Rotorua geothermal system, New Zealand. Geothermics 35, 221–238 (2006).
10. Taussi, M. et al. Soil CO2 flux and temperature from a new geothermal area in the Cordón De Inacaliri volcanic complex (northern
Chile). Geothermics 89, 101961 (2021).
Scientific Reports | (2021) 11:17972 | https://doi.org/10.1038/s41598-021-97023-x 9
Vol.:(0123456789)www.nature.com/scientificreports/
11. Chiodini, G., Cioni, R., Guidi, M., Raco, B. & Marini, L. Soil CO2 flux measurements in volcanic and geothermal areas. Appl.
Geochem. 13, 543–552 (1998).
12. BatistaCruz, R. Y. et al. Mantle degassing through continental crust triggered by active faults: The case of the Baja California
Peninsula, Mexico. Geochem. Geophys. Geosyst. 20, 1912–1936 (2019).
13. Kristmannsdóttir, H. & Ármannsson, H. Environmental aspects of geothermal energy utilization. Geothermics 32, 451–461 (2003).
14. Jolie, E. et al. Geological controls on geothermal resources for power generation. Nat. Rev. Earth Environ. 2, 324–339 (2021).
15. DiPippo, R. (ed.) Geothermal Power Generation: Developments and Innovation (Woodhead Publishing, 2016).
16. Stefansson, V. Geothermal reinjection experience. Geothermics 26, 99–139 (1997).
17. Kamila, Z., Kaya, E. & Zarrouk, S. J. Reinjection in geothermal fields: An updated worldwide review 2020. Geothermics 89, 101970
(2021).
18. Gaucher, E. et al. Induced seismicity in geothermal reservoirs: A review of forecasting approaches. Renew. Sustain. Energy Rev. 52,
1473–1490 (2015).
19. Horne, R. N. Reservoir engineering aspects of reinjection. Geothermics 14, 449–457 (1985).
20. Cavazos-Álvarez, J. A. & Carrasco-Núñez, G. Anatomy of the Xáltipan ignimbrite at Los Humeros Volcanic Complex; The largest
eruption of the Trans-Mexican Volcanic Belt. J. Volcanol. Geotherm. Res. 392, 106755 (2020).
21. Negrín, L. C. A. G. Current status of geothermal-electric production in Mexico. IOP Conf. Ser. Earth Environ. Sci. https://doi.org/
10.1088/1755-1315/249/1/012017 (2019).
22. Carrasco-Núñez, G. et al. Geologic map of Los Humeros volcanic complex and geothermal field, eastern Trans-Mexican Volcanic
Belt. Terra Digit 1, 1–11 (2017).
23. Toledo, T. et al. Local earthquake tomography at Los Humeros Geothermal Field (Mexico). J. Geophys. Res. Solid Earth 125, 1–29
(2020).
24. Elders, W. A., Izquierdo, G. M., Alfonso, A., Tovar, R. A. & Flores, M. A. Significance of deep zones of intense bleaching and
silicification in the Los Humeros high-temperature geothermal field, Mexico: Evidence of the effects of acid alteration. Trans.
Geotherm. Resour. Counc. 38, 497–502 (2014).
25. González-Partida, E., Barragán, R. M. & Nieva-G, D. Análisis geoquímico-isotópico de las especies carbónicas del fluido geotérmico
de Los Humeros, Puebla, Mexico. Geofísica Int. 32, 299–309 (1993).
26. Prol-Ledesma, R. M. Pre- and post-exploitation variations in hydrothermal activity in Los Humeros geothermal field, Mexico. J.
Volcanol. Geotherm. Res. 83, 313–333 (1998).
27. Pinti, D. L. et al. Fluid circulation and reservoir conditions of the Los Humeros Geothermal Field (LHGF), Mexico, as revealed by
a noble gas survey. J. Volcanol. Geotherm. Res. 333–334, 104–115 (2017).
28. Norini, G. et al. The structural architecture of the Los Humeros volcanic complex and geothermal field. J. Volcanol. Geotherm. Res.
381, 312–329 (2019).
29. Weydt, L. M. et al. Outcrop analogue study to determine reservoir properties of the Los Humeros and Acoculco geothermal fields,
Mexico. Adv. Geosci. 45, 281–287. https://doi.org/10.5194/adgeo-45-281-2018 (2018).
30. Jentsch, A. et al. Magmatic volatiles to assess permeable volcano-tectonic structures in the Los Humeros geothermal field, Mexico.
J. Volcanol. Geotherm. Res. 394, 106820 (2020).
31. Peiffer, L. et al. Fluid geochemistry and soil gas fluxes (CO2-CH4-H2S) at a promissory Hot Dry Rock Geothermal System: The
Acoculco caldera, Mexico. J. Volcanol. Geotherm. Res. 284, 122–137 (2014).
32. Raich, J. & Tufekcioglu, A. Vegetation and soil respiration: Correlations and controls. Biogeochemistry 48, 71–90 (2000).
33. Gutiérrez-Negrín, L. C. A. & Izquierdo-Montalvo, G. Review and update of the main features of the Los Humeros geothermal
field, Mexico. in World Geothermal Congress, Bali, Indonesia, 25–29 April 2010 (2010). https://doi.org/10.1016/j.bmc.2011.02.011.
34. Dávila-Harris, P. & Carrasco-Núñez, G. An unusual syn-eruptive bimodal eruption: The Holocene Cuicuiltic Member at Los
Humeros caldera, Mexico. J. Volcanol. Geotherm. Res. 271, 24–42 (2014).
35. Cardellini, C. et al. Monitoring diffuse volcanic degassing during volcanic unrests: The case of Campi Flegrei (Italy). Sci. Rep. 7,
6757 (2017).
36. Parkinson, K. J. An improved method for measuring soil respiration in the field. J. Appl. Ecol. 18, 221–228 (1981).
37. Aragón-Aguilar, A., Izquierdo-montalvo, G., López-blanco, S. & Arellano-gómez, V. Analysis of heterogeneous characteristics in
a geothermal area with low permeability and high temperature. Geosci. Front. 8, 1039–1050 (2017).
38. Arellano, V. M. et al. The response to exploitation of the Los Humeros (México) Geothermal Reservoir. World Geotherm. Congr.
2, 7 (2015).
39. Rinaldi, A. P., Vandemeulebrouck, J., Todesco, M. & Viveiros, F. Effects of atmospheric conditions on surface diffuse degassing. J.
Geophys. Res. 117, 1–14 (2012).
40. Liuzzo, M. et al. Ten years of soil CO2 continuous monitoring on Mt. Etna: Exploring the relationship between processes of soil
degassing and volcanic activity. Geochem. Geophys. Geosyst. 14, 2886–2899 (2013).
41. Cannata, A. et al. Relationship between soil C O2 flux and volcanic tremor at Mt. Etna: Implications for magma dynamics. Environ.
Earth Sci. 61, 477–489 (2010).
42. Oliveira, S., Viveiros, F., Silva, C. & Pacheco, J. E. Automatic filtering of soil CO2 flux data; different statistical approaches applied
to long time series. Front. Earth Sci. 6, 1–14 (2018).
43. Wilks, D. S. Statistical Methods in the Atmospheric Sciences (Academic Press, 2006).
44. Jentsch, A. et al. Magmatic volatiles to assess permeable volcano-tectonic structures in the Los Humeros geothermal field, Mexico.
J. Volcanol. Geotherm. Res. 394, 1–14 (2020).
45. Lewicki, J. L. & Hilley, G. E. Multi-scale observations of the variability of magmatic C O2 emissions, Mammoth Mountain, CA,
USA. J. Volcanol. Geotherm. Res. 284, 1–15 (2014).
46. Lewicki, J. L. et al. Dynamic coupling of volcanic C O2 flow and wind at the Horseshoe Lake tree kill, Mammoth Mountain, Cali-
fornia. Geophys. Res. Lett. 34, 1–5 (2007).
47. Viveiros, F. et al. Permanent monitoring of soil CO2 degassing at Furnas and Fogo volcanoes (São Miguel Island, Azores). In Volcanic
Geology of S. Miguel Island (eds Gaspar, J. L. et al.) 271–288 (Geological Society London, 2015). https://doi.org/10.1144/M44.20.
48. Forde, O. N., Cahill, A. G., Beckie, R. D. & Mayer, K. U. Barometric-pumping controls fugitive gas emissions from a vadose zone
natural gas release. Sci. Rep. https://doi.org/10.1038/s41598-019-50426-3 (2020).
49. Viveiros, F. et al. Deep CO2 emitted at Furnas do Enxofre geothermal area (Terceira Island, Azores archipelago). An approach for
determining CO2 sources and total emissions using carbon isotopic data. J. Volcanol. Geotherm. Res. 401, 106968 (2020).
50. Reth, S., Reichstein, M. & Falge, E. The effect of soil water content, soil temperature, soil pH-value and the root mass on soil C O2
efflux—A modified model. Plant Soil 268, 21–33 (2005).
51. Bense, V. F., Gleeson, T., Loveless, S. E., Bour, O. & Scibek, J. Fault zone hydrogeology. Earth-Sci. Rev. 127, 171–192 (2013).
52. Caine, J. S., Evans, J. P. & Forster, C. B. Fault zone architecture and permeability structure. Geology 24, 1025–1028 (1996).
53. Rowland, J. V. & Sibson, R. H. Structural controls on hydrothermal flow in a segmented rift system, Taupo Volcanic Zone, New
Zealand. Geofluids 4, 259–283 (2004).
54. Curewitz, D. & Karson, J. A. Structural settings of hydrothermal outflow: Fracture permeability maintained by fault propagation
and interaction. J. Volcanol. Geotherm. Res. 79, 149–168 (1997).
55. Urbani, S. et al. Estimating the depth and evolution of intrusions at resurgent calderas: Los Humeros (Mexico). Solid Earth 11,
527–545 (2020).
Scientific Reports | (2021) 11:17972 | https://doi.org/10.1038/s41598-021-97023-x 10
Vol:.(1234567890)www.nature.com/scientificreports/
56. Martínez-Serrano, R. G. Chemical variations in hydrothermal minerals of the Los Humeros geothermal system, Mexico. Geother-
mics 31, 579–612 (2002).
57. Yehya, A. & Rice, J. R. Influence of fluid-assisted healing on fault permeability structure. J. Geophys. Res. Solid Earth 125,
e2020JB020553 (2020).
58. Boudoire, G. et al. Small-scale spatial variability of soil CO2 flux: Implication for monitoring strategy. J. Volcanol. Geotherm. Res.
366, 13–26 (2018).
59. Zhang, Y. et al. Fault-related dilation, permeability enhancement, fluid flow and mineral precipitation patterns: Numerical models.
Geol. Soc. Spec. Publ. 299, 239–255 (2008).
60. Talwani, P., Chen, L. & Gahalaut, K. Seismogenic permeability. J. Geophys. Res. Solid Earth 112, B07309 (2007).
61. Norini, G. et al. Structural analysis and thermal remote sensing of the Los Humeros Volcanic Complex: Implications for volcano
structure and geothermal exploration. J. Volcanol. Geotherm. Res. 301, 221–237 (2015).
62. Parisio, F., Vilarrasa, V., Wang, W., Kolditz, O. & Nagel, T. The risks of long-term re-injection in supercritical geothermal systems.
Nat. Commun. 10, 4391 (2019).
63. Kaya, E. & Zarrouk, S. J. Reinjection of greenhouse gases into geothermal reservoirs. Int. J. Greenh. Gas Control 67, 111–129 (2017).
64. Bödvarsson, G. S. Some theoretical and field aspects of reinjection in geothermal reservoirs. Water Resour. Res. 25, 1235–1248
(1989).
65. Bödvarsson, G. S. & Tsang, C. F. Injection and thermal breakthrough in fractures geothermal reservoirs. J. Geophys. Res. 87,
1031–1048 (1982).
66. Pistone, S., Stacey, R. & Horne, R. The significance of CO2 Solubility in Geothermal Reservoirs. in PROCEEDINGS, Thirty-Sixth
Workshop on Geothermal Reservoir Engineering (Stanford University, 2011).
67. Iglesias, E. R. et al. Tracer testing at Los Humeros, Mexico, High-enthalpy geothermal field. in Proceedings World Geothermal
Congress 2015, Melbourne, Australia, 19–25 April 2015 (2015).
68. Urban, E. & Lermo, J. Fracture and stress evaluation using well logs and microseismicity, in the exploitation of Los Humeros
geothermal field, Mexico. Trans. Geotherm. Resour. Counc. 41, 1756–1780 (2017).
69. Obermann, A., Kraft, T., Larose, E. & Wiemer, S. Potential of ambient seismic noise techniques tomonitor the St. Gallen geothermal
site (Switzerland). J. Geophys. Res. Solid Earth 120, 4301–4316 (2015).
70. Carrasco-Núñez, G., López-Martínez, M., Hernández, J. & Vargas, V. Subsurface stratigraphy and its correlation with the surficial
geology at Los Humeros geothermal field, eastern Trans-Mexican Volcanic Belt. Geothermics 67, 1–17 (2017).
Acknowledgements
This paper presents results of the GEMex Project, funded by the European Union’s Horizon 2020—Research
and Innovation Program under Grant Agreement No. 727550, and by the Mexican Energy Sustainability Fund
CONACYT-SENER, Project 2015-04-268074. We wish to thank the Comisión Federal de Electricidad of Mexico
(CFE) for their support and access to the Los Humeros geothermal field. In particular, we thank Rafael Alfaro
and Elidee Juárez Hilarios for regularly downloading data and maintaining the monitoring stations. We would
also like to thank Guido Blöcher, Mauro Cacace and Henning Francke for valuable discussions during the review
process.
Author contributions
A.J. coordinated the study and field work, analyzed the data, prepared all figures and wrote the manuscript.
W.D. carried out data analysis with MATLAB and contributed to the interpretation of the data. E.J. revised the
manuscript, contributed to the writing and provided support during field work. M.Z. set up the monitoring
station. All authors reviewed the manuscript and were involved in discussions throughout the development.
Funding
Open Access funding enabled and organized by Projekt DEAL.
Competing interests
The authors declare no competing interests.
Additional information
Supplementary Information The online version contains supplementary material available at https://doi.org/
10.1038/s41598-021-97023-x.
Correspondence and requests for materials should be addressed to A.J.
Reprints and permissions information is available at www.nature.com/reprints.
Publisher’s note Springer Nature remains neutral with regard to jurisdictional claims in published maps and
institutional affiliations.
Open Access This article is licensed under a Creative Commons Attribution 4.0 International
License, which permits use, sharing, adaptation, distribution and reproduction in any medium or
format, as long as you give appropriate credit to the original author(s) and the source, provide a link to the
Creative Commons licence, and indicate if changes were made. The images or other third party material in this
article are included in the article’s Creative Commons licence, unless indicated otherwise in a credit line to the
material. If material is not included in the article’s Creative Commons licence and your intended use is not
permitted by statutory regulation or exceeds the permitted use, you will need to obtain permission directly from
the copyright holder. To view a copy of this licence, visit http://creativecommons.org/licenses/by/4.0/.
© The Author(s) 2021
Scientific Reports | (2021) 11:17972 | https://doi.org/10.1038/s41598-021-97023-x 11
Vol.:(0123456789)You can also read