Individual tree extraction from terrestrial laser scanning data via graph pathing
←
→
Page content transcription
If your browser does not render page correctly, please read the page content below
Wang et al. Forest Ecosystems     (2021) 8:67
https://doi.org/10.1186/s40663-021-00340-w

    RESEARCH                                                                                                                                  Open Access

Individual tree extraction from terrestrial
laser scanning data via graph pathing
Di Wang1 , Xinlian Liang2,3* , Gislain II Mofack4 and Olivier Martin-Ducup5

    Abstract
    Background: Individual tree extraction from terrestrial laser scanning (TLS) data is a prerequisite for tree-scale
    estimations of forest biophysical properties. This task currently is undertaken through laborious and time-consuming
    manual assistance and quality control. This study presents a new fully automatic approach to extract single trees from
    large-area TLS data. This data-driven method operates exclusively on a point cloud graph by path finding, which
    makes our method computationally efficient and universally applicable to data from various forest types.
    Results: We demonstrated the proposed method on two openly available datasets. First, we achieved
    state-of-the-art performance on locating single trees on a benchmark dataset by significantly improving the mean
    accuracy by over 10% especially for difficult forest plots. Second, we successfully extracted 270 trees from one hectare
    temperate forest. Quantitative validation resulted in a mean Intersection over Union (mIoU) of 0.82 for single crown
    segmentation, which further led to a relative root mean square error (RMSE%) of 21.2% and 23.5% for crown area and
    tree volume estimations, respectively.
    Conclusions: Our method allows automated access to individual tree level information from TLS point clouds. The
    proposed method is free from restricted assumptions of forest types. It is also computationally efficient with an
    average processing time of several seconds for one million points. It is expected and hoped that our method would
    contribute to TLS-enabled wide-area forest qualifications, ranging from stand volume and carbon stocks modelling to
    derivation of tree functional traits as part of the global ecosystem understanding.
    Keywords: Point cloud, Segmentation, Tree extraction, Graph pathing

Background                                                                          retrieval of conventional forest inventories parameters
Past two decades have witnessed the great advancements                              such as stem location (Liang et al. 2014), diameter at the
of terrestrial laser scanning (TLS) technique in delineating                        breast height (DBH) (Wang et al. 2017), stem curve (Wang
the unprecedented three-dimensional (3D) structures of                              et al. 2019), and estimate of tree physiological properties
trees and forests (Calders et al. 2020). By far, TLS provides                       such as leaf angle distribution (Liu et al. 2019), branch-
the most accurate measures at the scale of individual trees                         ing architecture (Lau et al. 2018), and standing volume
through its product named point cloud (Liang et al. 2016).                          (Calders et al. 2015) have shown the promising capability
A point cloud contains highly precised 3D coordinates                               of TLS in quantifying ecosystem structure and function.
in combination with radiometric information of objects                                A key prerequisite to these applications is the proper
(Pfeifer et al. 2008). A range of applications including                            interpretation of the information content of point clouds
                                                                                    (Burt et al. 2019). In particular, individual trees have to
*Correspondence: xinlian_liang@hotmail.com
                                                                                    be extracted first from plot level or wider area data to
2
  State Key Laboratory of Information Engineering in Surveying Mapping and          enable the retrieval of interested parameters at tree-scale.
Remote Sensing, Wuhan University, 430079 Wuhan, China                               For example, newly developed shape-fitting approaches
3
  Department of Remote Sensing and Photogrammetry, Finnish Geospatial
Research Institute, 02430 Masala, Finland
                                                                                    such as quantitative structure model (QSM) allow the 3D
Full list of author information is available at the end of the article

                                       © The Author(s). 2021 Open Access This article is licensed under a Creative Commons Attribution 4.0 International License, which
                                       permits use, sharing, adaptation, distribution and reproduction in any medium or format, as long as you give appropriate credit
                                       to the original author(s) and the source, provide a link to the Creative Commons licence, and indicate if changes were made. The
                                       images or other third party material in this article are included in the article’s Creative Commons licence, unless indicated
                                       otherwise in a credit line to the material. If material is not included in the article’s Creative Commons licence and your intended
                                       use is not permitted by statutory regulation or exceeds the permitted use, you will need to obtain permission directly from the
                                       copyright holder. To view a copy of this licence, visit http://creativecommons.org/licenses/by/4.0/.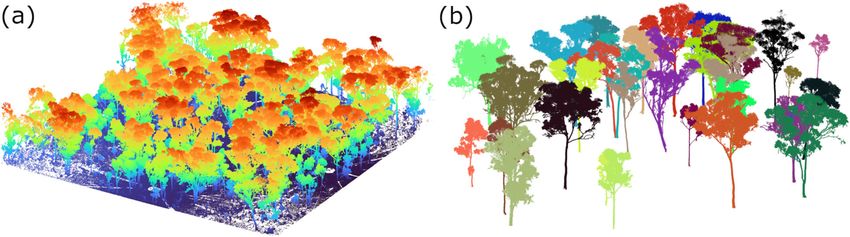
Wang et al. Forest Ecosystems   (2021) 8:67                                                                        Page 2 of 11

reconstruction of tree woody structures (Raumonen et               The objective of this study is to present a fully automatic
al. 2013; Hackenberg et al. 2015; Du et al. 2019). Based         approach for individual tree extraction from TLS data.
on QSMs, tree above-ground volume, biomass, carbon               Specifically, we propose a graph pathing algorithm that
stocks, branching structures (Lau et al. 2018), and also         operates on the point cloud graph only. We jointly search
species (Åkerblom et al. 2017) can be accurately estimated       for tree bases or roots and allocate other points to respec-
and recognized. Such applications all require the point          tive roots within the graph by using graph path finding
cloud of individual trees to be identified first. Currently,     techniques. In this way, we also ensure a fast computation
this task is often carried out by laborious and time-            even for wide-area data. Moreover, this study aims to pro-
consuming manual manipulations, which is impractical             vide the first quantitative assessments of point-wise crown
for large-area data delineation. An automated solution           segmentation in real forests.
with high effectiveness and efficiency is greatly desirable.
   Over the past years, a number of approaches were devel-       Materials
oped to tackle the task of individual tree extraction from       The assessments of the effectiveness of single tree extrac-
TLS data. Most methods followed a bottom-up mental-              tion involve two metrics, tree location and detailed crown
ity by first identifying tree bases or stems, then gradually     segmentation. Among them, tree location can be manu-
allocating crown points to respective bases. In earlier          ally measured in the field or identified in the point clouds,
developments, only tree stems were extracted using meth-         whereas single tree crowns are very challenging to delin-
ods such as feature-based filtering (Liang et al. 2014),         eate even visually (Heinzel and Huber 2018). Therefore,
Euclidean clustering (Hackenberg et al. 2015), circle fit-       most studies on single tree extraction evaluated their
ting (Pueschel et al. 2013), and point cloud projection          methods on tree locations (i.e., stem mapping) only. The
(Wang et al. 2016). Consequently, less attentions were           assessment of point-wise crown segmentation has rarely
paid on detailed crown segmentation. Nevertheless, sev-          been materialized. To the best of our knowledge, there
eral methods were proposed, especially in past five years,       exists no open datasets with both ground-truth tree loca-
to focus on crown segmentation. Raumonen et al. (2015)           tions and detailed crown boundaries, except synthetic
proposed a morphological approach that locates tree stem         ones (Wang 2020). On account of this, we used two sep-
first. Then detected stems were expanded to crowns using         arate datasets in this study to evaluate our method on
fixed distance connectivity assumptions. The same idea           locating single trees and isolating crowns, respectively.
was later implemented by Trochta et al. (2017). Limitation       One dataset from Finland was included to benchmark
of this method is its restricted applicability on open forests   our study with others on stem mapping. Additionally,
with sparsely distributed trees only (Burt et al. 2019). A       we included a large-area dataset from Australia that pro-
popular group of methods used graph based theory and             vided selected manually extracted single trees to assess
technique. Tao et al. (2015) was among the firsts to apply       our method on crown segmentation.
graph shortest path algorithm to resemble the nature of
trees for transporting water and nutrients in a most effi-       Finland data
cient way. Wang (2020) also used the same principle by           We acquired openly available TLS datasets of six forest
constructing a superpoint graph instead, and achieved            plots from the international TLS benchmarking project,
single tree extraction and leaf-wood separation simulta-         which was organized by the Finish Geospatial Research
neously. Zhong et al. (2016) utilized normalized graph           Institute (FGI) (Liang et al. 2018). We provide here an
cut as an energy minimization technique to group crown           overview of this dataset, and the readers are referred to
points to candidate stems. Similarly, Heinzel and Huber          Liang et al. (2018) for a full description of these bench-
(2018) developed a graph-based constrained spectral clus-        marking plots.
tering approach which minimized the energy of a Markov             Overall, these datasets were acquired from southern
Random Field. In a recent development, deep learning             boreal forests in Evo, Finland. The dominant tree species
based approach has been explored for tree extraction as          were Scots pine (Pinus sylvestris L.), Norway spruce (Picea
well (Wang et al. 2019). In general, all these methods           abies L. Karst.), silver birch (Betula pendula Roth), and
demand the tree bases or stems to be identified first prior      downy birch (Betula pubescens Ehrh.). The openly avail-
to graph-based manipulations. Moreover, some automatic           able six plots covered various tree species, stem densities,
methods required manual assistance either in field (Bar-         developing stages, and abundance of understory vegeta-
beito et al. 2017) or in post-processing (Calders et al. 2015;   tion. These characteristics were further used to categorize
Burt et al. 2019). In addition, quantitative assessment of       the plots into three complexity types (i.e., easy, medium,
point-wise crown segmentation was only carried out for           and difficult) by the benchmarking organizer FGI.
synthetic data before (Wang 2020). The available datasets          The Leica HDS1600 scanner (Leica Geosystems AG,
with ground-truth crown boundaries are still very rare           Heerbrugg, Switzerland) was used to obtain the point
nowadays.                                                        cloud data of each 32 × 32 m plot. Multi-scan mode was

Wang et al. Forest Ecosystems        (2021) 8:67                                                                                  Page 3 of 11

 Fig. 1 The Australia RUSH06 dataset. (a) Point cloud of the one hectare plot. (b) Point clouds of 36 selected trees

deployed in the field, and both single- and multi-scan data                    biomasses were precisely measured. The authors then
were provided. Since we focus on full-tree extraction with                     semi-automatically extracted corresponding tree point
a specific interest on detailed crown segmentation, only                       clouds and reconstructed individual trees to compare the
multi-scan data were used in this study. Moreover, we fil-                     estimated biomass with destructive ones. In total, 36 trees
tered out terrain points and normalized the height of each                     were included from the RUSH06 forest (Fig. 1b). Point
point to its above-ground value by using the open-source                       clouds of these trees were manually corrected and visually
cloth simulation method (Zhang et al. 2016).                                   inspected. Consequently, they were used in this study to
                                                                               assess our results on detailed crown segmentation.
Australia data
The Australia data were gathered and shared by Calders
                                                                               Methods
et al. (2015). These data were collected from a native
                                                                               The proposed approach operates exclusively on the point
Eucalypt temperate Forest (dry sclerophyll Box-Ironbark
                                                                               cloud graph. The key idea is to walk each node through
forest) in Victoria, Australia. We acquired a subset dataset
                                                                               the graph edges and search for the correct root nodes. We
RUSH06 from the Rushworth forest, which had a stem
                                                                               use the height information that is inherently embedded
density of 347 stems per hectare and a basal area of 13 m2
                                                                               in the node features to find valid root nodes. Ultimately,
per hectare, respectively.
  TLS data were collected using the Riegl VZ-400 scan-                         all nodes that arrive to the same root node belong to the
ner (Riegl Laser Measurement Systems GmbH). The                                same cluster (i.e., tree). The entire flowchart is illustrated
scan sampling setting deployed one center scan and four                        in Fig. 2. We describe below in details the key steps in
other scans at 40 m from the center. In this study, we                         constructing the point cloud graph, pathing through the
cropped the plot to one hectare (100 × 100 m) (Fig. 1a),                       graph, and determining the node clusters.
which contains approximately 37.5 million points. The
study of (Calders et al. 2015) aimed for estimating tree                       Graph construction
above ground biomass from TLS data. A number of                                A point cloud graph G = (V , E , W ) consists of a set
selected trees were thus destructively harvested and their                     of vertices V (i.e., nodes), edges E representing a set of

 Fig. 2 Flowchart of this study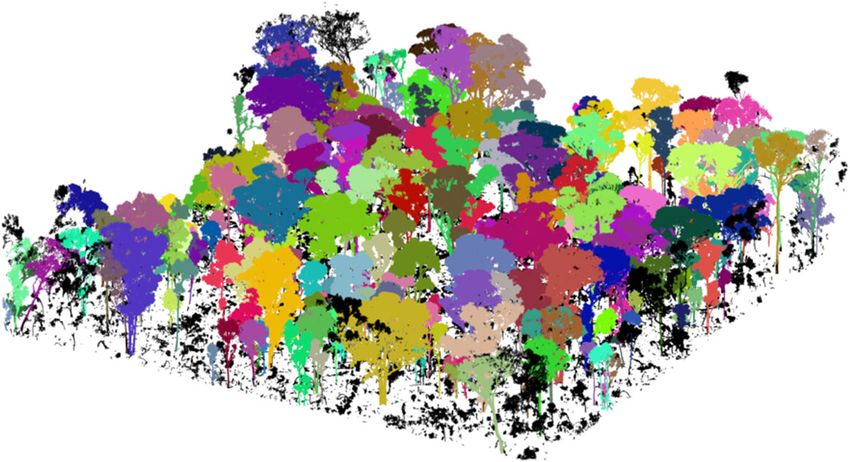
Wang et al. Forest Ecosystems      (2021) 8:67                                                                                      Page 4 of 11

unordered pairs of vertices, and edge weights W : E ∈ R                   prune the Delaunay graph to remove long edges. However,
mapping the Euclidean distances between graph nodes.                      the pruning is instead performed globally by excluding
  Conventionally, there exists several methods to convert                 edges whose lengths are longer than the 80th percentile of
a point cloud into a graph. The most widely used k-nearest                all edge. A sensitivity analysis of these pruning criteria is
neighbors (KNN) graph connects a point to its neighbors                   give in the results section. Consequently, the pruned edges
to generate a graph. Similarly, the neighboring connectiv-                from both graphs are then merged. To do so, we achieve
ity can otherwise be defined by bounding points in a given                a hybrid graph with rich and continuous point connectiv-
radius R. On the other hand, such connectivity property                   ity by taking advantages of both techniques and avoided
can be directly modeled by the Delaunay triangulation.                    undesirable edges. Figure 3 illustrates the advantage of
Each method has certain advantages and drawbacks. For                     such as a hybrid graph.
example, KNN generates a balanced graph, but is vulner-
able to distanced neighbors with dispersed edges. More-                   Node pathing
over, KNN may be trapped to locally dense regions and                     The key step of our method is to walk each note within
results in a disconnected graph. R radius graph is robust                 the graph (i.e., pathing or path finding). Initially, we move
to distanced neighbors but is sensitive to heterogeneous                  each note to its lowest neighboring node (Fig. 4b) by
point densities. Lastly, Delaunay triangulation produces                  assuming that the tree root node would have the lowest
a fully connected graph but is vulnerable to noise and                    height. The neighboring relationship is bounded by graph
distanced neighbors as well. Ben-Shabat et al. (2018) com-                edges. The reached lowest node in the neighbors then
pared all these methods for constructing a graph while                    becomes the seed node, and this procedure is continued
aiming for point cloud segmentation, and recommended                      until the reached node cannot be moved anymore (i.e., the
KNN based on their results.                                               lowest in the vicinity). Accordingly, we achieve an initial
  In our study, we leverage the advantages of KNN and                     clustering result, in which the nodes that reach the same
Delaunay triangulation graph by merging them to gener-                    lowest node are grouped (Fig. 4c). The reached lowest
ate a hybrid graph (Fig. 2). Specifically, we first construct             nodes are denoted as root nodes. Nevertheless, it is obvi-
a KNN (i.e., k = 10) graph based on the KD-Tree struc-                    ous that tree branching structures will not follow a rigid
ture. We then prune the graph to remove dispersed edges.                  downward centripetal orientation. Some graph nodes will
For each node, its edges that are one standard deviation                  eventually land at their local lowest, rather than the global
anyway from the average length of edges connected to it                   lowest which is expected to be the tree root node (Fig. 4c).
are removed. In this way, the graph is locally pruned and                   We then refine the detected root nodes to locate the
optimized. Subsequently, the Delaunay triangulation is                    desirable root nodes that represent tree roots. First, we
applied to generate a fully connected graph. Similarly, we                prune root nodes that are higher than a threshold H. This

 Fig. 3 (a) Unpruned KNN edges. (b) Unpruned Delaunay edges. (c) Generated hybrid graph. Note that the dispersed edges in KNN were pruned, and
 the gap was further completed by the pruned Delaunay edges to generate a connected graph with rich and continuous point connectivity as in (c)
Wang et al. Forest Ecosystems        (2021) 8:67                                                                                             Page 5 of 11

 Fig. 4 Visualization of steps in graph pathing. (a) The hybrid graph that is generated from the point cloud. (b) Walk each node to the lowest node in
 its neighbors. The neighbors (e.g., light purple) of a node (e.g., purple) are bounded by nodes having edges connected to it. (c) The process in (b) is
 continued until the reached node is already the lowest in its vicinity. The nodes reaching the same node are then grouped, and the reached node of
 each group is denoted as a root node (e.g., node 1, 2, and 3). (d) Root nodes are further pruned (e.g., node 1 in (c)) and merged (e.g., node 2 and 3 in
 (c)). Finally, the nodes connected to invalid roots are corrected to the valid roots by shortest pathing

simple step already eliminates a majority of invalid root                      points from uniformly distributed 10 cm voxels to extract
nodes. The determination of H depends on the quality                           trees first, and the results are encoded with original reso-
of point clouds. For example, if a plot is well sampled                        lution. This further accelerates the processing.
by multi-scan TLS so that tree stems are clearly repre-
sented in the point cloud, the H value can be set to low                       Assessments
such as 1 m. Otherwise, H can be increased to e.g., 3 m                        The assessments of our method is on two parts, tree
to mitigate the impacts from poorly sampled tree stems.                        locations and detailed crown segmentation.
Second, the remaining root nodes are further merged, as                          Tree locations are assessed following the metrics used
some nodes can be from the same tree stem. Specifically,                       in the TLS benchmarking project (Liang et al. 2018).
we merge two root nodes if their Euclidean distance is                         Three metrics including the completeness, the correct-
shorter than a threshold Ed, and their graph distance is                       ness, and the mean accuracy of detection are calculated.
shorter than n (e.g., 3) times that of Ed. The graph dis-                      The completeness measures the percentage of detected
tance is defined as the shortest path distance resolved by                     reference trees. The correctness measures the percentage
the Dijkstra algorithm (Dijkstra 1959). Indubitably, Ed is                     of detected trees against references. The mean accuracy is
linked to the distance between two adjacent tree stems.                        the joint metric based on the completeness and correct-
Furthermore, the graph distance is a more robust measure                       ness, given by:
than Euclidean distance in this circumstance. For exam-                                                    nmatch
ple, two root nodes form two neighboring trees can be                                         Completeness =        ,                                  (1)
                                                                                                            nref
spatially near, but their graph distance is either infinite                                                nmatch
or very large. Therefore, by evaluating the graph distance,                                 Correctness =           ,                                  (2)
                                                                                                            nextr
two spatially near root nodes can be further investigated if
                                                                                                       2nmatch
they are from the same tree or not.                                                 Mean accuracy =                 ,                                  (3)
                                                                                                    (nref + nextr )
   Consequently, only valid root nodes are retained. All
graph nodes that are initially landed at those invalid nodes                   where nmatch is the number of detected reference trees,
are routed to a specific corresponding valid root node that                    nref is the number of reference trees, and nextr is the
has the shortest path to them (Fig. 4d).                                       number of detected trees.
                                                                                  On the contrary, the Intersection over Union (IoU), a
Node clustering                                                                standard metric for segmentation evaluation measure, is
The above-mentioned pathing step allocates each graph                          used to assess the detailed crown segmentation. For an
node to a root, which is essentially a clustering proce-                       N × N confusion matrix (N = 36 in this study), each entry
dure. Therefore, the outcome of this method is a num-                          cij refers to the number of points from reference tree i pre-
ber of point clusters that represent individual trees. It is                   dicted as tree j. Then the IoU of tree i is calculated as:
noted that our method can be easily operated on a coarse
point cloud first (e.g., superpoints), and the results can be                                                   cii
                                                                                    IoUi =                                     .                     (4)
mapped back to full resolution. In this study, we sampled                                     cii +       j =i cij +  k =i cki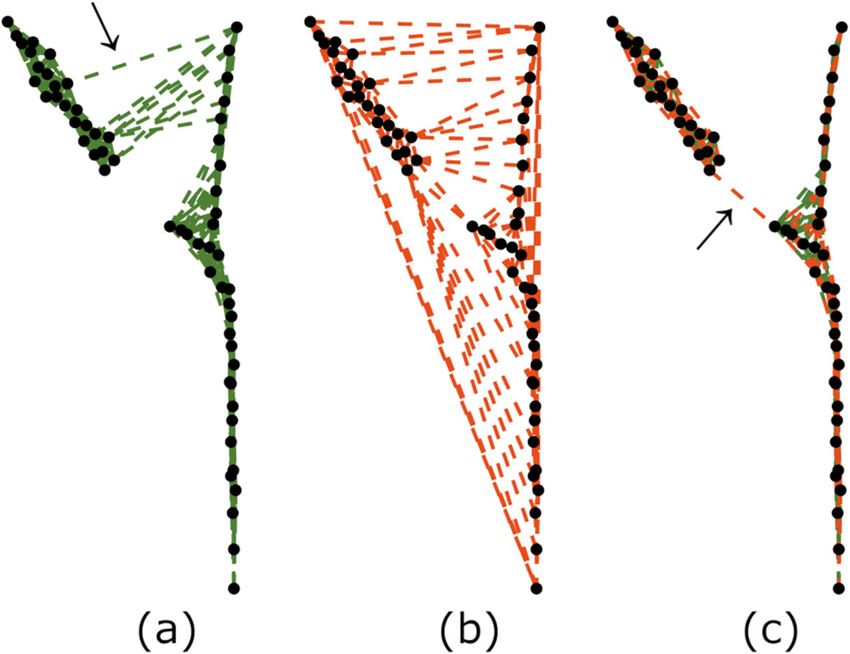
Wang et al. Forest Ecosystems      (2021) 8:67                                                                              Page 6 of 11

The mean IoU (mIoU) of all trees is then estimated by:
              N
                    IoUi
    mIoU = i=1           .                             (5)
                  N
  We additionally assessed our results for estimating
crown area and tree volume. Crown area was calculated as
the vertically projected bounding area of a tree, and tree
volume was the volume of convex hull of the entire tree.
The root mean square error (RMSE) and its relative value
were reported as:
                                                                Fig. 5 Sensitivity test of pruning criteria for graph construction.
                k
               1                                               Residual was against the default criteria with one standard deviation
     RMSE =            (yi −
                             yi )2 ,                   (6)       for KNN and 80th percentile for Delaunay edges. std is short for
                  k                                              standard deviation
                       i=1
                                RMSE
    RMSE(%) = 100% ×                 ,                    (7)
                                 ȳ
where k is the number of observation data,   y denotes the     the results worsened by about 0.03 in mIoU. This, how-
reference value and ȳ is the mean value of the variable.       ever, was well expected as increasing this value meant that
                                                                fewer long edges were removed. So the final graph was
Method comparisons                                              more vulnerable to dispersed edges from Delaunay trian-
Several studies that also used the benchmark dataset from       gulation. Overall, we showed that the pruning criteria for
Finland reported their accuracies of locating single trees.     graph construction were insensitive.
We hereby performed quantitative comparisons of our
results with two state-of-the-art approaches in Zhang et        Finland data
al. (2019) and Wang (2020). However, unfortunately, it is       The results of our method on locating single trees, and the
unfeasible to compare our results on detailed crown seg-        comparisons with other two state-of-the-art approaches
mentation with both approaches, as only Wang (2020)             proposed in Zhang et al. (2019) and Wang (2020) were
was able to segment individual crowns, while Zhang et al.       summarized in Table 1. Overall, our method outper-
(2019) only detected tree locations.                            formed others by a wide margin in terms of mean accu-
                                                                racy. The improvement was more significant for difficult
Results                                                         plots with over 10% increase. Our method achieved 76.9%
Sensitivity of pruning criteria for graph construction          completeness for difficult plots, whereas Zhang et al. (2019)
In this study, we generated a hybrid graph by merging           and Wang (2020) reported 36.1% and 58.3%, respectively.
pruned KNN and Delaunay edges. The pruning operation            However, we were not able to compete with Zhang et al.
involved two criteria, one standard deviation for KNN           (2019) on correctness. In general, our method resulted
edges and 80th percentile for Delaunay edges, respec-           in a more balanced performance with the highest overall
tively. Theoretically, these criteria were only set to ensure   accuracy.
a graph with rich and continuous point connectivity, and
were not directly influential to the downstream analyses.       Australia data
Nonetheless, we provide here a sensitive analysis of these      In total, we extracted 270 trees from the one hectare
two pruning criteria for crown segmentation from the            RUSH06 Australia data (Fig. 6). The mIoU was 0.82 for
Australia dataset.                                              detailed crown segmentation, with a standard deviation
  We tested the multiplication factor of standard devia-        of 0.14 and individual IoUs ranging from 0.51 to 1.00.
tion from one to three for KNN edges, and from 80th             As a comparison, Wang (2020) also achieved a mIoU of
and 90th percentile with an increment of 5 percentile           0.82, but with a higher standard deviation of 0.19. As
for Delaunay edges. In total, nine different combinations       for the estimations of crown area and tree volume, our
were tested. The results of mIoU for crown segmen-              results showed an RMSE of 11.5 m2 (21.2%) and 139.5 m3
tation of the Australian dataset were shown in Fig. 5.          (23.5%), respectively (Fig. 7). The R2 of the linear regres-
Overall, the manipulations of pruning criteria did not          sion line (Fig. 7a black line) for crown area estimation was
impact the results significantly. The standard deviation of     0.91, with a slope of 0.88. Similarly, the R2 of the linear
mIoUs from nine criteria combinations were only 1.5%.           regression line (Fig. 7b black line) for tree volume estima-
Specifically, the multiplication factor of standard devi-       tion was 0.91 as well. The slope was 0.95. These results
ation had negligible impacts. While by increasing the           indicate that our method is able to precisely segment indi-
pruning threshold for Delaunay edges from 80th to 90th,         vidual crowns and is effective in estimating tree attributes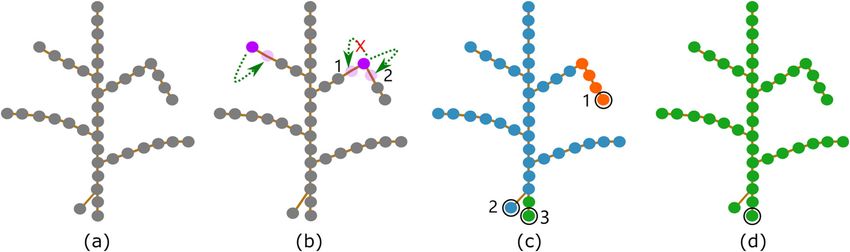
Wang et al. Forest Ecosystems (2021) 8:67 Page 7 of 11
Table 1 Tree extraction performance on Finland dataset
Plot Completeness(%) Correctness(%) Mean accuracy(%)
Complexity Z W Ours Z W Ours Z W Ours
Easy 86.3 90.2 96.1 97.8 95.8 96.1 91.7 92.9 96.1
Easy 82.1 92.9 92.9 95.8 81.3 89.7 88.5 86.7 91.2
Medium 61.5 79.1 84.5 100.0 72.2 90.6 76.2 75.5 87.4
Medium 57.5 78.2 89.7 97.8 70.1 74.5 72.6 74.0 81.4
Difficult 45.8 64.1 77.1 93.8 67.2 68.7 61.5 65.6 72.7
Difficult 26.3 52.5 76.7 98.4 70.9 80.8 41.5 60.3 78.7
59.9 76.2 82.3 97.3 76.3 83.4 72.0 75.8 84.6
Last row corresponds to mean values. Z: results from Zhang et al. (2019). W: results from Wang (2020)
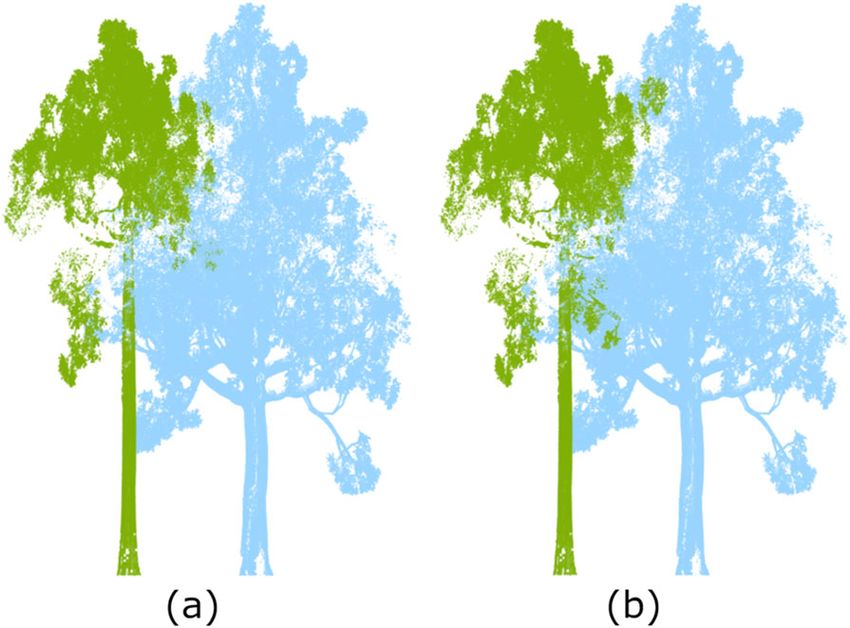
associated to crowns. However, as shown in Fig. 8, accu- Discussion
rate point-wise segmentation was always very challenging Although TLS had made promising progress in forest
to achieve especially for heavily intersected crowns, for applications in past two decades, the automation of data
which the shortest path analysis generally failed (Wang processing remains a crucial challenge and very often
2020). Nonetheless, our results indicated that despite the time-demanding manual works are still needed (Calders
challenge in point-wise segmentation, automatic crown- et al. 2020). Meanwhile, a key prerequisite is to prop-
level metrics retrieval was instead reliable. erly understand the information contents embedded in
the forest plots so that individual tree level attributes can
Method efficiency be retrieved (Burt et al. 2019). This requirement generally
One of the advantages of our method is its computational involves two fundamental tasks, single tree extraction and
efficiency. The runtime of our method depends on both leaf-wood separation (Wang 2020). Our study focuses on
total number of points and number of trees to be extracted automated individual tree extraction from large area data.
(Fig. 9). In average, the processing time was 1.6 min for
one plot from the FGI benchmark dataset (i.e., averaging Challenges of tree extraction in complex forests
12.5 million points and 119 trees). For the one hectare With regard to the practical application of a certain tree
Australia dataset with 37.5 million points, the runtime was extraction method, forest types and data quality are two
8.5 min and we managed to extract 270 trees. The machine primary factors that defy its effectiveness, transferability,
we used to run the algorithm had the following specifica- and universality. Most tree extraction methods developed
tions: Windows 10, Intel® CoreTM i9-10900X and 32 GB for TLS data follow a bottom-up approach by first rec-
RAM. Although different machines were used, our run- ognizing tree bases or stems, and then expanding the
time is generally much lower than previous studies for full bases to branches to constitute the entire crowns. Obvi-
tree extraction (Burt et al. 2019; Wang 2020). ously, this mentality coincides with the mechanism of
Fig. 6 Extracted individual trees. Each tree is colored randomly, and black color indicates non-tree objects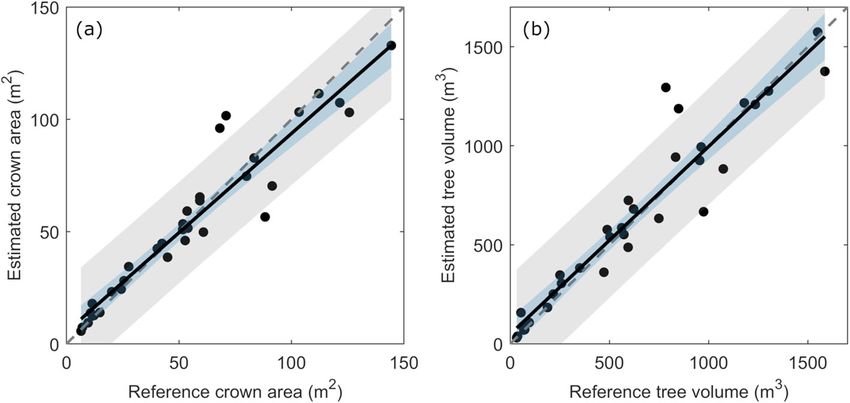
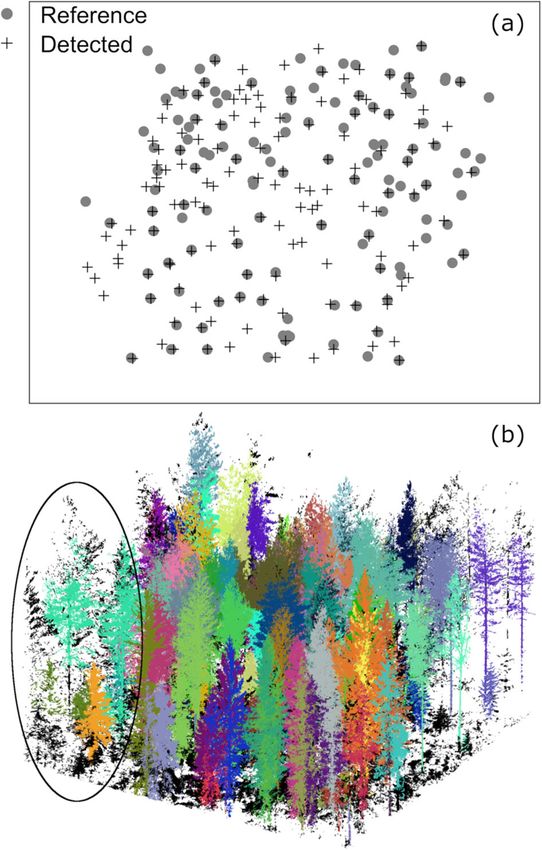
Wang et al. Forest Ecosystems        (2021) 8:67                                                                                          Page 8 of 11

 Fig. 7 Assessments of (a) crown area and (b) tree volume. Black line indicates fitted regression. Regions bounded by light blue represents
 confidence interval, whereas light gray stands for prediction interval

TLS measurements for acquiring data from near ground                         Advantages of graph pathing
with an upward field of view. For structurally simple and                    Our method operates exclusively on the point cloud graph
sparse forest types with distanced trees and minimal inter-                  and seeks for tree bases directly by node pathing, thus
action between crowns, it is plausible that many tree                        avoids point clustering or shape fitting that are more vul-
extraction methods are equally effective. However, more                      nerable to data quality. This advantage is demonstrated
complex forests such as tropical rainforests and other nat-                  in our results for locating trees from the FGI bench-
ural ecosystems would impose significant challenges. For                     mark dataset. We achieved much higher completeness
example, dense low vegetation and complex terrain con-                       (i.e., 76.9%) especially for difficult plots compared to other
ditions would greatly defect the data quality, as occlusions                 methods (Table 1), indicating that our method is more
and limitations in setting up multi-scan TLS are often                       robust to occlusions and low points densities. However,
unavoidable. Consequently, the conventionally used clus-                     we still noticed the impacts of occlusions in our results.
tering and primitive (e.g., circle or cylinder) fitting meth-                In Fig. 10a, it was discovered that our method was able to
ods may fail in this circumstance when tree stems are not
well resolved in the point clouds (Trochta et al. 2017; Tao
et al. 2015; Burt et al. 2019). Thereby, many extraction
methods are essentially semi-automatic and require man-
ual assistance and quality control to correct omission or
commission errors (Calders et al. 2020).

 Fig. 8 Crown segmentation. (a) Reference. (b) Our result                      Fig. 9 The runtime of our method
Wang et al. Forest Ecosystems        (2021) 8:67                                                                              Page 9 of 11

                                                                          detect most trees in the central part of the plot, whereas
                                                                          missed a relatively large portion of trees on the plot edge.
                                                                          A visual inspection in Fig. 10b revealed that plot edges had
                                                                          severe occlusions with very sparse points. Several trees
                                                                          were mistakenly merged into one tree due to low confi-
                                                                          dences in locating tree bases. This impact may potentially
                                                                          be mitigated by leveraging the information from vertically
                                                                          stacked points (Wang et al. 2016), but would only be fea-
                                                                          sible for single layered forests. Overall, our method seems
                                                                          fall into the “Aggressive” algorithm principle according to
                                                                          the benchmarking summary, which strives to achieve the
                                                                          highest stem detection rate by sacrificing the correctness
                                                                          of stem detection (Liang et al. 2018). This was indeed
                                                                          revealed in our results for having much higher complete-
                                                                          ness compared to previous studies. However, the achieved
                                                                          state-of-the-art mean accuracy also indicated that our
                                                                          method was robust at the same time. It is noted that by
                                                                          tweaking the parameters such H and Ed, our method may
                                                                          turn into a more "Conservative" principle. As the bench-
                                                                          marking project concluded, the preference and selection
                                                                          of a specific algorithm all depend on the final objective of
                                                                          the applications (Liang et al. 2018). The flexibility of our
                                                                          method has the potential to ease such algorithm selection
                                                                          or design, thus facilitates its applicability in a wide variety
                                                                          of forest applications.
                                                                            An additional advantage of our method is its capabil-
                                                                          ity to identify non-tree points that are linked to invalid
                                                                          roots (Figs. 2 and 6), which adds a particular value to
                                                                          tropical forests that have excessive undergrowth. A quick
                                                                          experiment on a 40 × 40 m plot data from a tropical
                                                                          forest in Eastern Cameroon (Martin-Ducup et al. 2021)
 Fig. 10 Results of tree extraction of a difficult plot in the FGI        showed that around 30% points were attributed to non-
 benchmark dataset. (a) Comparison between reference tree locations       tree objects such as shrubs (Fig. 11). Our method does not
 and our results. (b) Each extracted tree is colored randomly. Non-tree   rely on point clustering or shape fitting, and it is free from
 points are colored in black. The region highlighted by the ellipsoid
 indicates a challenging occluded region
                                                                          assumptions such as tabular shapes when detecting stems,

 Fig. 11 An example of our method applied on tropical forest
Wang et al. Forest Ecosystems (2021) 8:67 Page 10 of 11
which makes our method uniquely capable of segment- new realm of untapped research questions and applica-
ing and identifying undergrowth as well. Intrinsically, this tions of TLS in forest ecosystems.
approach is able to discover all possible roots including
Abbreviations
trees, shrubs, and other low vegetation. A large portion 3D: Three dimensional; AGB: above-ground biomass; DBH: diameter at the
of undergrowth then can be easily identified by limiting brest height; FGI: Finish geospatial research institute; IoU: Intersection over
their heights at the object level. This advantage makes our Union; KNN: k-nearest neighbors; mIoU: mean Intersection over Union; QSM:
quantitative structure model; RAM: Random access memory; RMSE: Root mean
method particular valuable in complex forests with dense square error; TLS: Terrestrial laser scanning
undergrowth.
We have also shown that our method is able to precisely Acknowledgements
We are grateful to the FGI and Wageningen University (Dr. Kim Calders, now at
segment tree crowns. The yielded mIoU of 0.82 was com- Ghent University) for sharing TLS data.
parable to a recent study from Wang (2020) on synthetic
forests. Although it is expected that the precise isolation Authors’ contributions
D. W, XL. L, and O. MD together conceived the research idea and designed the
of tree crowns is extremely changeling especially in com- experiments. D. W and G. M processed the data and analyzed the results. All
plex forests where trees have their crowns interact with authors contributed to the manuscript writing and editing. All authors read
each other, we showed that a fully automatic method can and approved the final manuscript.
produce a reasonable segmentation that leads to a relative Funding
RMSE at the magnitude of 20% for crown area estimates. This work was partially funded by the Scientific Research Foundation of Xidian
It is, however, remains unknown how such a fully auto- University, and was part of 3DForMod project (ANR-17-EGAS-0002-01) funded
in the frame of the JPI FACCE ERA-GAS call funded under European Union’s
matic tree extraction would impact the estimation of more Horizon 2020 research and innovation program (grant agreement No. 696356).
advanced tree physiological attributes such as tree leaf
angle distribution (Liu et al. 2019) and above-ground Availability of data and materials
The datasets analysed during the current study are available from two hosts.
biomass (AGB) (Calders et al. 2020). The TLS data from Finland are owned by the FGI, and are freely available from
Lastly, by restricting the computations on the graph the following repository (https://helsinkifi-my.sharepoint.com/:f:/g/personal/
only, we significantly reduced the computation overhead jpyorala_ad_helsinki_fi/
EvL7Zbq8VOpCqWMViRlswsIB06GH3HyOAQ1rupwb3fOEXg?e=KdWmd7). The
and runtime (Fig. 9). Currently, the efforts in collect- Australia dataset is provided through the original publication (Calders et al.
ing more and more TLS data from different geographical 2015), and can be freely accessed from the TERN AusCover data archive
locations and ecosystems across the globe are rapidly (http://dx.doi.org/10.4227/05/542B766D5D00D).
accelerating, and a method that is computationally effi-
cient and robust to different data characteristics is partic-
ularly wanted. Declarations
Conclusions Ethics approval and consent to participate
Not applicable.
Individual tree extraction form TLS data is a crucial and
fundamental step in tree-scale analysis. In this study, we Consent for publication
presented a simple and effective automatic approach for Not applicable.
this task. The proposed method was exclusively based on
Competing interests
a point cloud graph using path finding algorithms and The authors declare that they have no competing interests.
avoided using conventional processing techniques such as
Author details
point cloud feature calculation, clustering, and geometric 1 Department of Remote Sensing Science and Technology, School of
primitive fitting that are more sensitive to data quality. Electronic Engineering, Xidian University, 710077 Xi’an, China. 2 State Key
Experiment results showed that the proposed method Laboratory of Information Engineering in Surveying Mapping and Remote
Sensing, Wuhan University, 430079 Wuhan, China. 3 Department of Remote
achieved state-of-the-art performance on locating single
Sensing and Photogrammetry, Finnish Geospatial Research Institute, 02430
trees when compared with previous studies. In particu- Masala, Finland. 4 Plant Systematics and Ecology Laboratory, Higher Teacher’s
lar, our method outperformed others by a wide margin in Training College, University of Yaoundé I, BP 337 Yaoundé, Cameroon. 5 AMAP,
structurally complex forests. We also demonstrated that Univ Montpellier, IRD, CNRS, CIRAD, INRAE, F-34000 Montpellier, France.
the proposed method was able to precisely segment tree Received: 29 April 2021 Accepted: 10 August 2021
crowns in large-area forests.
This study facilitates the application of TLS in forest
research for which automatic and effective tree extraction References
Åkerblom M, Raumonen P, Mäkipää R, Kaasalainen M (2017) Automatic tree
in complex and large-area forests remains a crucial chal- species recognition with quantitative structure models. Remote Sens
lenge. The proposed method is computationally efficient Environ 191:1–12. https://doi.org/10.1016/j.rse.2016.12.002
and can process one hectare forest with nearly 300 trees Barbeito I, Dassot M, Bayer D, Collet C, Drössler L, Löf M, Del Rio M,
Ruiz-Peinado R, Forrester DI, Bravo-Oviedo A, et al (2017) Terrestrial laser
in 10 min with a standard machine. We argue that our scanning reveals differences in crown structure of fagus sylvatica in mixed
method provides a significant advance in confronting the vs. pure european forests. For Ecol Manag 405:381–390Wang et al. Forest Ecosystems (2021) 8:67 Page 11 of 11
Ben-Shabat Y, Avraham T, Lindenbaum M, Fischer A (2018) Graph based Trochta J, Kru̇ček M, Vrška T, Král K (2017) 3d forest: An application for
over-segmentation methods for 3d point clouds. Comp Vision Image descriptions of three-dimensional forest structures using terrestrial lidar.
Underst 174:12–23 PLoS ONE 12(5):1–17
Burt A, Disney M, Calders K (2019) Extracting individual trees from lidar point Wang D (2020) Unsupervised semantic and instance segmentation of forest
clouds using treeseg. Methods Ecol Evol 10(3):438–445 point clouds. ISPRS J Photogramm Remote Sens 165:86–97. https://doi.
Calders K, Adams J, Armston J, Bartholomeus H, Bauwens S, Bentley LP, Chave org/10.1016/j.isprsjprs.2020.04.020
J, Danson FM, Demol M, Disney M, Gaulton R, Krishna Moorthy SM, Levick Wang J, Chen X, Cao L, An F, Chen B, Xue L, Yun T (2019) Individual rubber tree
SR, Saarinen N, Schaaf C, Stovall A, Terryn L, Wilkes P, Verbeeck H (2020) segmentation based on ground-based lidar data and faster r-cnn of deep
Terrestrial laser scanning in forest ecology: Expanding the horizon. Remote learning. Forests 10(9):793
Sens Environ 251:112102. https://doi.org/10.1016/j.rse.2020.112102 Wang D, Hollaus M, Puttonen E, Pfeifer N (2016) Automatic and self-adaptive
Calders K, Newnham G, Burt A, Murphy S, Raumonen P, Herold M, Culvenor D, stem reconstruction in landslide-affected forests. Remote Sens 8(12):974
Avitabile V, Disney M, Armston J, et al (2015) Nondestructive estimates of Wang D, Kankare V, Puttonen E, Hollaus M, Pfeifer N (2017) Reconstructing
above-ground biomass using terrestrial laser scanning. Methods Ecol Evol stem cross section shapes from terrestrial laser scanning. IEEE Geosci
6(2):198–208 Remote Sens Lett 14(2):272–276
Dijkstra EW (1959) A note on two problems in connexion with graphs. Numer Zhang W, Qi J, Wan P, Wang H, Xie D, Wang X, Yan G (2016) An easy-to-use
Math 1(1):269–271 airborne lidar data filtering method based on cloth simulation. Remote
Du S, Lindenbergh R, Ledoux H, Stoter J, Nan L (2019) Adtree: Accurate, Sens 8(6):501
detailed, and automatic modelling of laser-scanned trees. Remote Sens Zhang W, Wan P, Wang T, Cai S, Chen Y, Jin X, Yan G (2019) A novel approach
11(18):2071. http://doi.org/10.3390/rs11182074 for the detection of standing tree stems from plot-level terrestrial laser
Hackenberg J, Wassenberg M, Spiecker H, Sun D (2015) Non destructive scanning data. Remote Sens 11(2):211
method for biomass prediction combining tls derived tree volume and Zhong L, Cheng L, Xu H, Wu Y, Chen Y, Li M (2016) Segmentation of individual
wood density. Forests 6(4):1274–1300 trees from tls and mls data. IEEE J Sel Top Appl Earth Obs Remote Sens
Heinzel J, Huber M (2018) Constrained spectral clustering of individual trees in 10(2):774–787
dense forest using terrestrial laser scanning data. Remote Sens 10(7):1056
Lau A, Bentley LP, Martius C, Shenkin A, Bartholomeus H, Raumonen P, Malhi Y,
Jackson T, Herold M (2018) Quantifying branch architecture of tropical
trees using terrestrial lidar and 3d modelling. Trees 32(5):1219–1231
Liang X, Hyyppä J, Kaartinen H, Lehtomäki M, Pyörälä J, Pfeifer N, Holopainen
M, Brolly G, Francesco P, Hackenberg J, et al (2018) International
benchmarking of terrestrial laser scanning approaches for forest
inventories. ISPRS J Photogramm Remote Sens 144:137–179
Liang X, Kankare V, Hyyppä J, Wang Y, Kukko A, Haggrén H, Yu X, Kaartinen H,
Jaakkola A, Guan F, et al (2016) Terrestrial laser scanning in forest
inventories. ISPRS J Photogramm Remote Sens 115:63–77
Liang X, Kankare V, Yu X, Hyyppa J, Holopainen M (2014) Automated stem
curve measurement using terrestrial laser scanning. IEEE Trans Geosci
Remote Sens 52(3):1739–1748. https://doi.org/10.1109/TGRS.2013.2253783
Liu J, Wang T, Skidmore AK, Jones S, Heurich M, Beudert B, Premier J (2019)
Comparison of terrestrial lidar and digital hemispherical photography for
estimating leaf angle distribution in european broadleaf beech forests.
ISPRS J Photogramm Remote Sens 158:76–89
Martin-Ducup O, Mofack GI, Wang D, Raumonen P, Ploton P, Sonké B, Barbier
N, Couteron P, Pélissier R (2021) Evaluation of automated pipelines for tree
and plot metrics estimation from tls data in a tropical forest. Ann Bot.
https://doi.org/10.1093/aob/mcab051
Peng W, Zhang W, Liang X, Skidmore A, Yan G (2019) Quantification of
occlusions influencing the tree stem curve retrieving from single-scan
terrestrial laser scanning data. For Ecosyst 4:285–297. https://doi.org/10.
1186/s40663-019-0203-1
Pfeifer N, Höfle B, Briese C, Rutzinger M, Haring A (2008) Analysis of the
backscattered energy in terrestrial laser scanning data. Int Arch
Photogramm Remote Sens Spat Inf Sci 37:1045–1052
Pueschel P, Newnham G, Rock G, Udelhoven T, Werner W, Hill J (2013) The
influence of scan mode and circle fitting on tree stem detection, stem
diameter and volume extraction from terrestrial laser scans. ISPRS J
Photogramm Remote Sens 77:44–56. https://doi.org/10.1016/j.isprsjprs.
2012.12.001
Raumonen P, Casella E, Calders K, Murphy S, Åkerblom M, Kaasalainen M (2015)
Massive-scale tree modelling from tls data. ISPRS Ann Photogramm
Remote Sens Spat Inf Sci II-3/W4:189–196
Raumonen P, Kaasalainen M, Åkerblom M, Kaasalainen S, Kaartinen H,
Vastaranta M, Holopainen M, Disney M, Lewis P (2013) Fast automatic
precision tree models from terrestrial laser scanner data. Remote Sens
5(2):491–520
Tao S, Wu F, Guo Q, Wang Y, Li W, Xue B, Hu X, Li P, Tian D, Li C, Yao H, Li Y, Xu
G, Fang J (2015) Segmenting tree crowns from terrestrial and mobile lidar
data by exploring ecological theories. ISPRS J Photogramm Remote Sens
110:66–76. https://doi.org/10.1016/j.isprsjprs.2015.10.007You can also read