Generating Landmark Navigation Instructions from Maps as a Graph-to-Text Problem
←
→
Page content transcription
If your browser does not render page correctly, please read the page content below
Generating Landmark Navigation Instructions from Maps as a
                                                                 Graph-to-Text Problem

                                                          Raphael Schumann                   Stefan Riezler
                                                       Computational Linguistics    Computational Linguistics & IWR
                                                     Heidelberg University, Germany  Heidelberg University, Germany
                                                            {rschuman|riezler}@cl.uni-heidelberg.de

                                                               Abstract                          sentation from OpenStreetMap1 as input and gen-
                                                                                                 erates navigation instructions that contain salient
                                             Car-focused navigation services are based on        landmarks, learned directly from human natural
arXiv:2012.15329v3 [cs.CL] 26 May 2021

                                             turns and distances of named streets, whereas       language instructions.
                                             navigation instructions naturally used by hu-          In our framework, routes on the map are learned
                                             mans are centered around physical objects           by discretizing the street layout, connecting street
                                             called landmarks. We present a neural model
                                                                                                 segments with adjacent points of interest, thus en-
                                             that takes OpenStreetMap representations as
                                             input and learns to generate navigation in-         coding visibility of landmarks, and encoding the
                                             structions that contain visible and salient land-   route and surrounding landmarks in a location- and
                                             marks from human natural language instruc-          rotation-invariant graph. Based on crowd-sourced
                                             tions. Routes on the map are encoded in a           natural language instructions for such map rep-
                                             location- and rotation-invariant graph repre-       resentations, a graph-to-text mapping is learned
                                             sentation that is decoded into natural language     that decodes graph representations into natural lan-
                                             instructions. Our work is based on a novel
                                                                                                 guage route instructions that contain salient land-
                                             dataset of 7,672 crowd-sourced instances that
                                             have been verified by human navigation in
                                                                                                 marks. Our work is accompanied by a dataset of
                                             Street View. Our evaluation shows that the nav-     7,672 instances of routes in OpenStreetMap and
                                             igation instructions generated by our system        corresponding crowd-sourced natural language in-
                                             have similar properties as human-generated in-      structions. The navigation instructions were gen-
                                             structions, and lead to successful human navi-      erated by workers on the basis of maps including
                                             gation in Street View.                              all points of interest, but no street names. They
                                                                                                 were verified by different workers who followed
                                         1   Introduction                                        the navigation instructions on Google Street View2 .
                                                                                                    Experimental results on randomly sampled test
                                         Current navigation services provided by the au-         routes show that our graph-to-text model produces
                                         tomotive industry or by Google Maps generate            landmarks with the same frequency found in hu-
                                         route instructions based on turns and distances of      man reference instructions. Furthermore, the time-
                                         named streets. In contrast, humans naturally use        normalized success rate of human workers finding
                                         an efficient mode of navigation based on visible        the correct goal location on Street View is 0.664.
                                         and salient physical objects called landmarks. As       Since these routes can have a partial overlap with
                                         shown by Tom and Denis (2004), route instructions       routes in the training set, we further performed an
                                         based on landmarks are easier processed and mem-        evaluation on completely unseen routes. The rate
                                         orized by humans. May et al. (2003) recommend           of produced landmarks drops slightly compared
                                         that in pedestrian navigation systems, ”landmarks       to human references, and the time-normalized suc-
                                         should be used as the primary means of providing        cess rate also drops slightly to 0.629. While there
                                         directions”. Another navigation scenario where          is still room for improvement, our results show-
                                         landmarks are useful is if GPS tracking is poor or      case a promising direction of research, with a wide
                                         not available, and if information is inexact regard-    potential of applications in various existing map
                                         ing distances (e.g., in human estimates) or street
                                         names (e.g., for users riding a bicycle). We present       1
                                                                                                        www.openstreetmap.org
                                                                                                    2
                                         a neural model that takes a real-world map repre-              www.google.com/streetview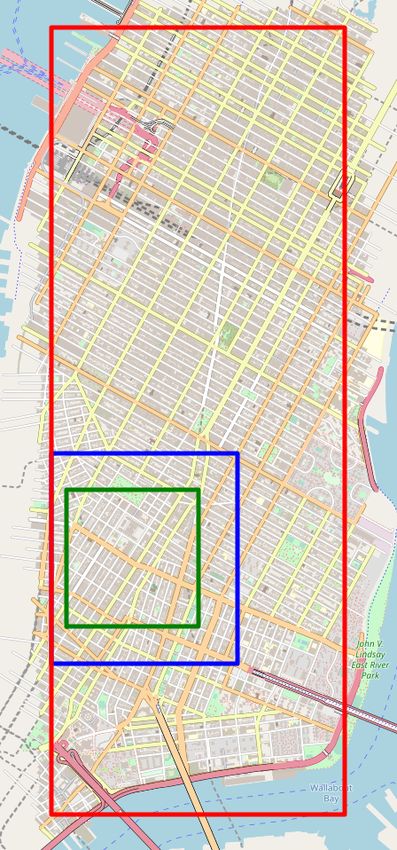
Figure 1: The data collection is split into two tasks. In the navigation instructions task (top) annotators see a
rendered map and write instructions to follow the route. The navigation run task (bottom) is used to validate
navigation instructions. A different annotator tries to find the goal location in Street View.

applications and navigation systems.                      Street View in order to find a hidden teddy bear.
  The main contributions of this paper are:               The data for that task is obtained from annotation
• We collect and publish a large scale dataset of         workers that follow a predefined route in Street
  natural language landmark navigation instruc-           View and write down navigation instructions along
  tions that are validated by human navigation runs       the way. A central difference between Touchdown
  in Street View.                                         and our dataset is the annotation modality: Touch-
• We present a method to represent geospatial             down annotators use panorama images along the
  routes as a graph and propose an appropriate            route, while our instruction writers only see the
  graph-to-text architecture that learns to generate      rendered route on a map. See Section 4.3 for a
  navigation instructions from real-world data.           more detailed discussion.

2       Related Work and Datasets                            Our work puts the task of natural language navi-
                                                          gation upside down by learning to generate human-
Mirowski et al. (2018) published a subset of Street       like navigation instructions from real-world map
View covering parts of New York City and Pitts-           data instead of training an agent to follow human
burgh. Street View is a navigable environment that        generated instructions. Prior work in this area
is build from connected real-world 360◦ panoramas.        has used rule-based systems to identify landmarks
This data is used by Hermann et al. (2020) to train       (Rousell and Zipf, 2017) or to generate landmark-
a visual agent to follow turn-by-turn instructions        based navigation instructions (Dräger and Koller,
generated by Google Maps API. Chen et al. (2019)          2012; Cercas Curry et al., 2015). Despite having
published a Street View dataset3 with more recent         all points of interest on the map available, our ap-
and higher resolution panorama images that covers         proach learns to verbalize only those points of inter-
the lower half of Manhattan. They further introduce       est that have been deemed salient by inclusion in a
the Touchdown task that has the goal to navigate          human navigation instruction. Previous approaches
    3
        www.streetlearn.cc                                that learn navigation instructions from data have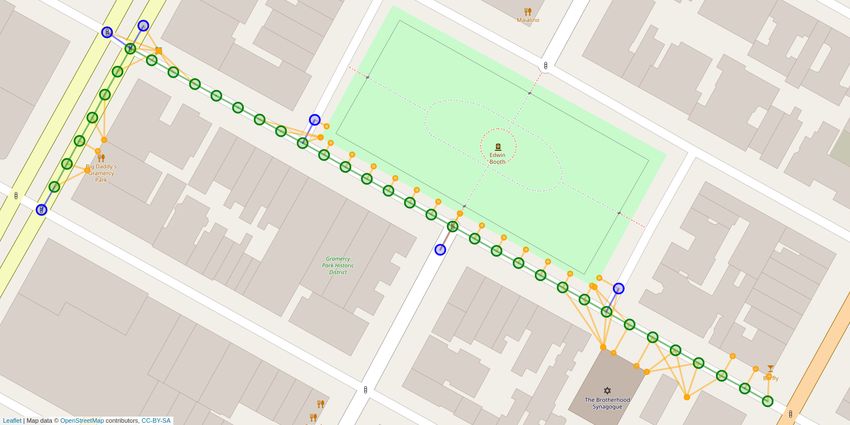
been confined to simplified grid-based representa-       4       Data Collection
tions of maps for restricted indoor environments
(Daniele et al., 2017). de Vries et al. (2018) tackles   Because there is no large scale dataset for NLLNI
the problem in a more sophisticated outdoor en-          that is generated from map information only, we
vironment but the model fails to verbalize useful        collect data via crowdsourcing. The annotator is
instructions when conditioned on more than one           shown a route on the map and writes navigation in-
possible landmark. Other work generates naviga-          structions based on that information (Figure 1, top).
tion instructions from indoor panoramas along a          We take the approach of Chen et al. (2019) and
path but provides no explicit evaluation like human      determine correctness of navigation instructions by
navigation success. They rather use the instruc-         showing them to other annotators that try to reach
tions to augment the training routes for a vision        the goal location in Street View (Figure 1, bottom).
and language navigation agent (Fried et al., 2018).      4.1      Resources and Preparation
                                                         We use the static Street View dataset provided by
3   Task                                                 Chen et al. (2019). This allows us to make the
                                                         experiments in this work replicable. Because the
The task addressed in our work is that of au-            panorama pictures were taken at the end of 2017,
tomatically generating Natural Language Land-            we export an OpenStreetMap extract of Manhat-
mark Navigation Instructions (NLLNI) from real-          tan from that time. OpenStreetMap (OSM) is an
world open-source geographical data from Open-           open source collection of geodata that can be used
StreetMap. The instructions are generated a pri-         to render maps of the world. It features detailed
ori (Janarthanam et al., 2012) for the whole route.      street layouts and annotations for points of interest
Training data for NLLNI was generated by human           (POI) like amenities, infrastructure or land use4 .
crowdsourcing workers who were given a route on          We discretize the street layout by creating a node
an OpenStreetMap rendering of lower Manhattan,           every ten meters along the roads. The resulting
with the goal of producing a succinct natural lan-       structure is further referenced to as the OSM graph
guage instruction that does not use street names or      with nodes consisting of street segments. Based on
exact distances, but rather is based on landmarks.       that graph, we sample routes of length between 35
Landmarks had to be visible on the map and in-           and 45 nodes. A route is the shortest path between
cluded, e.g., churches, cinemas, banks, shops, and       its start and end node. It includes a minimum of
public amenities such as parks or parking lots. Each     three intersections (i.e., a node with more than two
generated navigation instruction was validated by        edges) and ends in proximity to a POI. We further
another human crowdsourcing worker who had to            assure that it is possible to follow the route in Street
reach the goal location by following the instruction     View by verifying that a corresponding subgraph
on Google Street View.                                   exists in the Street View graph.
   NLLNI outputs are distinctively different from
                                                         4.2      Crowdsourcing
navigation instructions produced by OpenRoute-
Service, Google Maps, or car navigation systems.         We use Amazon Mechanical Turk (AMT)5 to ac-
While these systems rely on stable GPS signals           quire annotators. Before working on the actual
such that the current location along a grid of streets   tasks, workers were required to pass a tutorial and
can be tracked exactly, we aim at use cases where        qualification test. The tutorial introduces the tasks,
GPS tracking is not available, and knowledge of          teaches basic mechanics of Street View and ex-
distances or street names is inexact, for example,       plains meaning of map icons. A feature of AMT
pedestrians, cyclists, or users of public transporta-    and additional IP address6 lookup ensures that an-
tion. The mode of NLLNI is modeled after human           notators are located in the United States. This in-
navigation instructions that are naturally based on a    creases the probability of working with native En-
small number of distinctive and visible landmarks        glish speakers and people familiar with US street
in order to be memorizable while still being in-         environments. We paid $0.35 per navigation in-
formative enough to reach the goal. A further ad-        structions task and $0.20 for the navigation run
vantage of NLLNI is that they are based on map               4
                                                               openstreetmap.org/wiki/Map_Features
inputs which are more widely available and less              5
                                                               www.mturk.com
                                                             6
time dependent than Street View images.                        IP addresses were not saved and are not part of the dataset.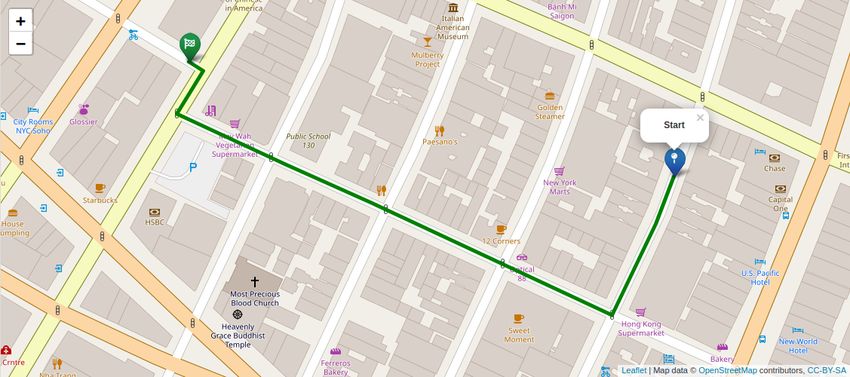
Dataset             #Instructions    Environment   Data Source              #Nodes     Avg. Length      Vocabulary      Avg. Tokens
 Talk the Walk                 786    gridworld     3D rendering                 100            6.8             587             34.5
 Room-to-Room               21,567    indoor        panoramas                 10,800            6.0           3,156             29.0
 Touchdown                   9,326    outdoor       panoramas                 29,641           35.2           4,999             89.6
 Talk2Nav                   10,714    outdoor       panoramas and map         21,233           40.0           5,240             68.8
 Room-X-Room               126,069    indoor        panoramas                 10,800            7.0           388K              78.0
 map2seq                     7,672    outdoor       map                       29,641           40.0           3,826             55.1

Table 1: Overview of natural language navigation instructions datasets. The instructions in our dataset rely solely
on information present in OpenStreetMap. Dataset: Talk the Walk (MacMahon et al., 2006); Room-to-Room (An-
derson et al., 2018b); Touchdown (Chen et al., 2019); Talk2Nav (Vasudevan et al., 2020); Room-X-Room (Ku
et al., 2020); map2seq (this work). #Instructions: Number of instructions in the dataset. Environment: Type of
navigation environment. Data Source: Type of information the annotator uses to write the navigation instructions.
#Nodes: Number of nodes in the discretized environment. Avg. Length: Average number of nodes per route.
Vocabulary: Number of unique tokens in the instructions. Avg. Tokens: Number of tokens per route instruction.

                                    R-to-R   Touchdown   map2seq
           Phenomenon                                                                           Example
                                     c   µ    c    µ      c   µ
     Reference to unique entity     25 3.7   25   9.2    25 6.3     ...   turn right where Dough Boys is on the corner ...
     Coreference                    8 0.5    15   1.1    8   0.5    ...   is a bar, Landmark tavern, stop outside of it ...
     Comparison                     1 0.0     3   0.1    0   0.0    ...   there are two lefts, take the one that is not sharp ...
     Sequencing                     4 0.2    21   1.6    24 1.8     ...   continue straight at the next intersection ...
     Count                          4 0.2     9   0.4    11 0.6     ...   go through the next two lights ...
     Allocentric spatial relation   5 0.2    17   1.2    9   0.5    ...   go through the next light with Citibank at the corner. ...
     Egocentric spatial relation    20 1.2   23   3.6    25 3.2     ...   at the end of the park on your right...
     Imperative                     25 4.0   25   5.2    25 5.3     ...   head down the block and go through the double lights ...
     Direction                      22 2.8   24   3.7    25 3.5     ...   head straight to the light and make a right ...
     Temporal condition             7 0.4    21   1.9    7   0.3    ...   go straight until you come to the end of a garden area ...
     State verification             2 0.1    18   1.5    12 0.6     ...   you should see bike rentals on your right ...

Table 2: Linguistic analysis of 25 randomly sampled navigation instructions. Numbers for Room-to-Room (An-
derson et al., 2018b) and Touchdown (Chen et al., 2019) taken from the latter. c is the number of instructions out
of the 25 which contain the phenomenon at least once. µ is the mean number of times each phenomenon occurs.

task. Furthermore, we paid a bonus of $0.15 for                    white arrows. In addition there is a button on the
successfully reaching the goal location and $0.25                  bottom left to backtrack which proved to be very
for validated navigation instructions. The amounts                 helpful. The initial position is the start of the route
were chosen on the basis of $10/hour. The anno-                    facing in the correct direction. The annotators fin-
tation procedure involved two phases. First, an                    ish the navigation run with the bottom right button
annotator wrote navigation instructions for a given                either when they think the goal location is reached
route. Afterwards, a different annotator used the in-              or if they are lost. The task is successful if the
structions to navigate to the goal location. If one of             annotator stops the run within a 25 meter radius
two annotators did so successfully, the navigation                 around the goal location.
instructions were considered valid.
Navigation Instructions Task As shown in Fig-
                                                                   4.3       Dataset
ure 1 (top), the annotator sees a route on a map
which is rendered without street names. Workers
                                                                   The data collection resulted in 7,672 navigation
were told to write navigation instructions as if ”a
                                                                   instructions that were manually validated in
tourist is asking for directions in a neighborhood
                                                                   Street View. For additional 1,059 instructions, the
you are familiar with” and to ”mention landmarks
                                                                   validation failed, which amounts to a validation
to support orientation”. The navigation instructions
                                                                   rate of 88%. Of the validated instructions, 1,033
were written in a text box below the map which is
                                                                   required a second try in the navigation run task. On
limited to 330 characters.
                                                                   average, instructions are 257 characters long, with
Navigation Run Task Figure 1 (bottom) shows                        a minimum length of 110, and a maximum of 330
the Street View interface with navigation instruc-                 characters. We release the segmented OSM graph,
tions faded-in at the bottom. It is possible to look               the routes in that graph paired with the collected
around 360◦ and movement is controlled by the                      navigation instructions, and the data split used in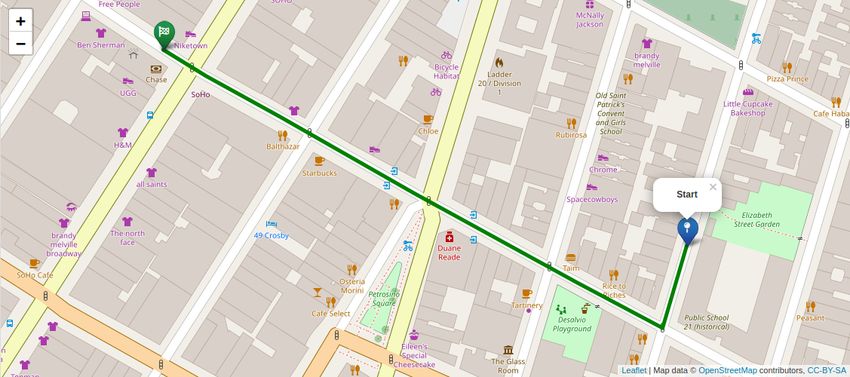
node token directed edge
park
node type directed edge with angle
bicycle_rental leisure Gramercy Park 90°
Barfly
amenity bar
90° 270° amenity
35°
90°
133° 90° 90° 90°
63°
90° 90°
90°
91° 88° 89°
6° 0° 359° 0° 0° 1° 358° 0°
1° 3°
271°
332° 219° 270° 321°
Big 269°
359° amenity place_of_worship
214°
amenity Daddy's
0°
The Brotherhood Synagogue
restaurant
Figure 2: Graph representation of the route in Figure 3. The framed middle part is magnified for readability. Some
nodes are left out for sake of clear visualization. Also, node colors are for visualization only and not encoded in
the graph. Green nodes are part of the route. Blue nodes are neighboring street segments. Orange nodes belong to
OSM points of interest. Angles are relative to route direction and start clockwise at 0◦ which is facing forward.
the starting direction and can infer the facing di-
rection for the rest of the route. Because the initial
facing direction in Touchdown is random, the first
part of their instructions is about rotating the agent.
This explains the higher number of occurrences of
the state verification phenomenon. In our dataset,
state verification is usually used to ensure the cor-
rect stopping position. The different setting of data
collection is also reflected by the temporal condi-
Figure 3: Route rendered on the map with street seg- tion phenomenon. Annotators of Touchdown write
ments and landmark visibility.
down instructions while navigating Street View and
thus experience the temporal component first hand,
our experiments7 . Table 1 gives a comparison of while our annotators have a time independent look
different datasets with natural language landmark at the route.
navigation instructions. Our dataset is the only one
that uses only map information to generate naviga- 5 Method
tion instructions. The advantage of relying solely The underlying OSM geodata of the rendered map
on map data is the global availability and longevity is an XML tree of nodes located in the latitude-
of the encoded features. In contrast, navigation longitude coordinate system. The nodes are com-
instructions written from Street View include tem- posed into ways and polygons8 . These elements
porary features like construction utilities, street in connection with their annotations are used to
advertisements, or passing vehicles. Table 2 shows render the visual map. In the next subsection we
a qualitative linguistic analysis of the navigation propose our approach to represent a route and its
instructions of different datasets. In general, navi- surrounding map features as a graph that includes
gation instructions are driven by giving directions all necessary information for generating landmark
in imperative formulation while referencing to en- navigation instructions. The second subsection de-
tities along the route. In contrast to the Touchdown scribes the neural graph-to-text architecture that
task where including store names was prohibited, is trained to learn inductive representations of the
the entities in our instructions are often referenced individual route graphs and to decode navigation
to by their name. Although the instruction writers instructions from them.
in our setting did not see the route in first person
perspective, objects are vastly referenced to in ego- 5.1 Map-to-Graph Representation
centric manner (egocentric with respect to the navi-
The basis of the graph for a single route is the
gating agent). This is because the annotator knows
OSM subgraph (Section 4.1) that includes the ac-
7
www.cl.uni-heidelberg.de/
8
statnlpgroup/map2seq/ www.openstreetmap.org/wiki/Elements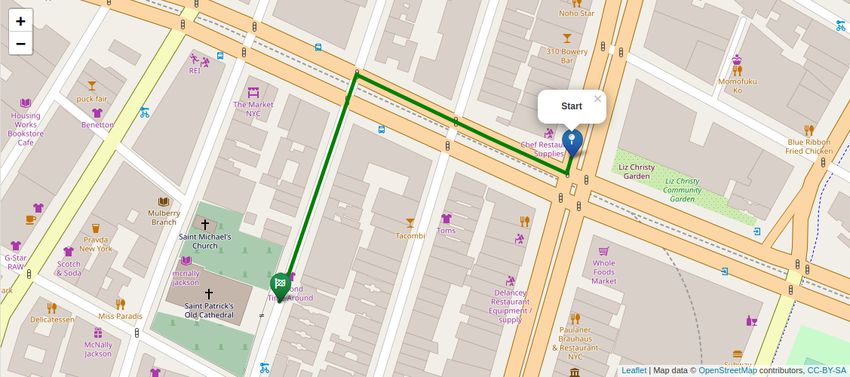
tual route nodes. Further, neighboring street seg-      other. Some edges have a geometric interpretation.
ment nodes are added. This is depicted in Figure 3      This is true for edges connecting a street segment
as green and blue circles, respectively. In order to    with either a POI or with another street segment.
decide on the visibility of the POIs, we employ a       These edges (u, v) ∈ EA , EA ⊂ E have a label
technique similar to that of Rousell and Zipf (2017).   attached. The label ang(u, v) is the binned angle
For each street segment, the POIs in a radius of 30     between the nodes relative to route direction. The
meters are identified. If a line drawn between the      continuous angle [0◦ , 360◦ ) is assigned to one of 12
street segment and the POI is not interrupted by        bins. Each bin covers 30◦ with the first bin starting
a building polygon, the POI is considered visible       at 345◦ . The geometric distance between nodes is
from that particular street segment. If the POI it-     not modeled explicitly because street segments are
self is (inside) a polygon, then the line is drawn to   equidistant and POI visibility is determined with a
the closest point on the POI polygon. The orange        maximum distance. The proposed representation of
circles in Figure 3 show the results of the visibil-    a route and its surroundings as a directed graph with
ity check and how they naturally fit into the graph     partially geometric edges is location- and rotation-
structure. Each point of interest in OSM has one or     invariant, which greatly benefits generalization.
more tags in the form of key and value pairs. They
store properties like type or name. Note that we        5.2   Graph-to-Text Architecture
only determine the geometric visibility of the POIs     By representing a route as a graph, we can frame
and do not incorporate any hand-crafted salience        the generation of NLLNI from maps as a graph-
scores as to what would be a good landmark. In-         to-text problem. The encoder learns a neural rep-
stead, saliency of a landmark is implicitly learned     resentation of the input graph and the sequence
from natural language verbalization of the POI in       decoder generates the corresponding text. The ar-
the human-generated instruction.                        chitecture follows the Transformer (Vaswani et al.,
   An example graph representation of the route in      2017) but uses graph attentional layers (Veličković
Figure 3 is given in Figure 2. Formally, a route rep-   et al., 2018) in the encoder. Graph attention in-
resentation is a directed graph G = (V, E), where       jects the graph structure by masking (multi-head)
V denotes the set of nodes and E the set of edges. A    self-attention to only attend to nodes that are first-
node v consists of a node type v t and a node token     order neighbors in the input graph. The geomet-
v w . There are V t node types and V w node tokens.     ric relations between some nodes are treated as
Street segments are of type . A point of        edge labels which are modeled by distinct fea-
interest has the node type . An OSM tag            ture transformation matrices during node aggre-
key has the node type  and an OSM tag          gation (Schlichtkrull et al., 2018).
value has the node type . The node              The input to a layer of the encoder is a set of node
token further specifies nodes in the graph. Street      representations, x = {x1 , x2 , . . . , xN }, xi ∈
segments that belong to the route have a node token     Rdm , where N is the number of nodes and dm
 according to their sequential position P. The       is the model size. Each layer l : Rdm → Rdm
last route segment has the special token .        takes x and produces new node representations x0 .
Other street segment nodes have the           The input to the first layer is constructed from the
token. The actual key and value literals of an OSM      concatenation of type and token embedding: xi =
tag are the node tokens of the respective node. The     ReLU (W F [EvTt ||EvWw ]) where W F ∈ R2dm ×dm
                                                                           i      i
OSM name tag is split into multiple nodes with          is a weight matrix, E T ∈ Rdm and E W ∈ Rdm
type  where N is the word position            are embedding matrices for node types and node
and the node token is the word at that position.        tokens, respectively.
   All adjacent street segment nodes are connected         The output of a single graph attention head is the
with an edge in both directions. If a POI is visible    weighted sum of neighboring node representations:
from a particular street segment, there is an edge                             X
                                                                                                U
from the corresponding POI node to that street                    x̄i =                   αij (Wr(i,j) xj )   (1)
segment node. Each POI node is connected with                             j|(vj ,vi )∈E
their tag key nodes. A tag value node is connected
to its corresponding tag key node. The name tag         The weight coefficient is computed as αij =
                                                                               exp (eij )
nodes of the same POI are connected with each           softmaxj (eij ) = P           exp (eik ) where eij
                                                                                  k|(vk ,vi )∈E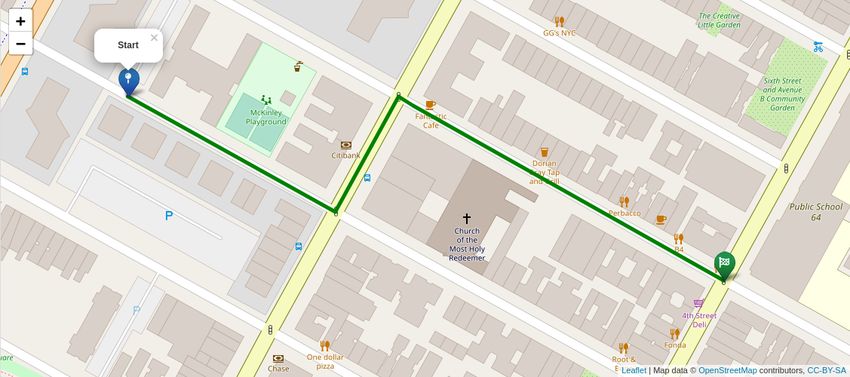
BLEU    Len.   Landm. SDTW            SR     SNT                    BLEU    Len.   Landm. SDTW            SR     SNT
                                200 instances test set                                              200 instances test set
    reference        -     53.5     2.76       .728      .855   .878    reference        -     57.5     2.68       .725      .824   .791
    rule based     0.71    53.1    12.44       .405      .460   .455    rule based     0.67    52.3    10.96       .472      .525   .512
    seq2seq        13.12   52.9     1.95       .139      .160   .206    seq2seq        11.12   51.8     1.58       .074      .100   .137
    graph2text     18.60   52.6     2.41       .475      .540   .676    graph2text     14.07   50.5     1.74       .344      .400   .534
    g2t+pretrain   18.81   52.5     2.44       .471      .540   .537    g2t+pretrain   15.64   50.3     2.33       .367      .429   .530
                                700 instances test set                                              700 instances test set
    reference        -     53.5     2.72       .726      .861   .830    reference        -     54.2     2.69       .727      .843   .807
    g2t+pretrain   17.39   53.0     2.41       .475      .551   .664    g2t+pretrain   16.27   53.2     2.30       .407      .473   .629

Table 3: Evaluation of navigation instructions produced                Table 4: Evaluation of navigation instructions produced
by models and human reference on partially seen test                   by models and human reference on unseen test routes.
routes. Evaluation metrics are explained in Section 6.3.

                                                                       of the street they appear. The end of the route
measures the compatibility of two node representa-                     is signaled by the ’stop’ token. The second base-
tions:                                                                 line is a seq2seq (sequence-to-sequence) model
                                                                       that is trained on pairs of rule based navigation
     eij = LeakyReLU (aT [W V xi ||Wr(i,j)
                                    U      xj ]) (2)
                                                                       instructions and crowdsourced instructions. The
                                                                       seq2seq model follows the Transformer architec-
where a ∈ R2dh , W V ∈ Rdm ×dh , dh = dm /h is
                                                                       ture (Vaswani et al., 2017) with copy mechanism
the attention head dimension and h is the number
                                                                       and is trained with the same hyperparameters as
of heads. In the case of a geometric relation be-
                                                                       the graph-to-text model. Examples are given in
                                     U
tween nodes, the weight matrix Wr(i,j)    ∈ Rdm ×dh
                                                                       Figure 4.
is selected according to the angle label between the
nodes: r(i, j) = ang(ui , uj ), otherwise r(i, j) =                    6.2   Experimental Setup
unlabeled. The output of each head is concate-
                                                                       We construct a graph for each route as described
nated and after a skip connection forwarded to the
                                                                       above. On average there are 144 nodes in a graph
next encoder layer. The encoder layer is applied
                                                                       and 3.4 edges per node. There are 8 different node
L times and the final node representations x∗ are
                                                                       types and a vocabulary of 3,791 node tokens. The
used in the decoder context attention mechanism.
                                                                       hyperparameters for the graph-to-text architecture
Thus, no modification of the Transformer decoder
                                                                       are set as follows: The embedding and hidden size
is necessary and L decoder layers are used. Further,
                                                                       is set to 256. We use 6 encoder and decoder lay-
the decoder can copy node tokens from the input
                                                                       ers with 8 attention heads. Cross entropy loss is
into the output sequence (See et al., 2017).
                                                                       optimized by Adam (Kingma and Ba, 2015) with a
   The described architecture is able to model all
                                                                       learning rate of 0.5 and batch size of 12. The em-
aspects of the input graph. Graph attention models
                                                                       bedding matrix for node tokens and output tokens is
directed edges. Edge labels model the geometric
                                                                       shared. Additionally we experiment with pretrain-
relation between nodes. Heterogeneous nodes are
                                                                       ing the graph-to-text model with above mentioned
represented by their type embedding and token em-
                                                                       rule based instructions as target. This teaches the
bedding. The sequentiality of the route is encoded
                                                                       model sequentiality of route nodes and basic in-
by tokens (, , ...) of the respective nodes.
                                                                       terpretation of the angle labels. We generate 20k
This is analogous to absolute position embeddings
                                                                       instances for pretraining and further fine tune on
which provide word order information for text en-
                                                                       the human generated instances. Both models and
coding (Vaswani et al., 2017; Devlin et al., 2019).
                                                                       the seq2seq baseline are trained on 5,667 instances
6      Experiments                                                     of our dataset. The best weights for each model are
                                                                       selected by token accuracy based early stopping on
6.1      Baselines                                                     the 605 development instances.
We consider two baselines. A rule based system
                                                                       6.3   Evaluation Metrics
that uses a single heuristic to construct instructions
by stringing together all POIs and intersections                       BLEU is calculated with SacreBLEU (Post, 2018)
along the route, and following each intersection                       on lower-cased and tokenized text.
by the turning direction. Similar, POIs are fol-                       Length is the average length in number of tokens.
lowed by ’left’ or ’right’ depending on which side                     Landmarks is the number of landmark occur-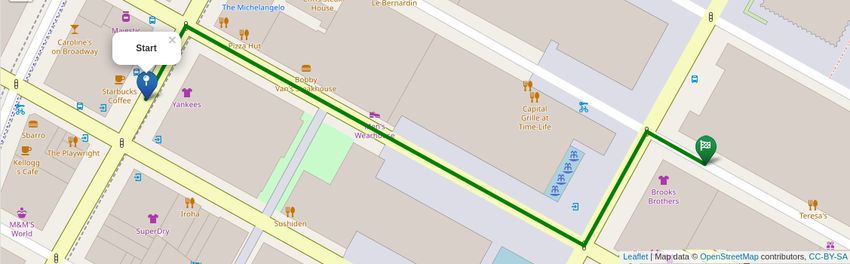
reference: At the light with Fridays on the corner, turn right. Continue down the long street to the next light with Nine West on the right corner, then turn left. Go
to the next light with Brooks Brothers on the right corner, then turn right and stop.
rule based: Starbucks Coffee left subway entrance right Best Buy Mobile left Yankees right bus stop left bus stop left light right The Michelangelo left TGI Fridays
left Pizza Hut left Bobby Van ’s left park right Men ’s Wearhouse left fountain left fountain left subway entrance left light left Nine West right Rockefeller Center
left subway entrance right Brooks Brothers right light right stop
seq2seq: Go straight to the light and make a left. Go straight to the next light and make a left. Go straight to the light and make a right. Stop one step after turning
with Brooks Brothers to your right.
graph2text: Walk to the light with TGI Fridays on the corner and turn right. Walk down the long block to the next light with Nine West on the left corner, then turn
left. Walk to the next light with Brooks Brothers on the far right corner, then turn right.
g2t+pretrain: Turn right at the first set of lights with TGI Fridays on the left corner. Pass a park on the right and turn left at the lights. Pass the fountain on the
right and turn right at the lights. Take two steps and stop. Brooks Brothers is on the right corner.

           Figure 4: Route from partially seen test set paired with instructions generated by different systems.

rences per instance. Occurrences are identified                                        randomly sampled from the training area with par-
by token overlap between navigation text and tag                                       tial overlaps.10 For the baseline models we perform
values of POIs along the route. E.g., landmarks                                        the human evaluation on a 200 instances subset of
in the instructions in Figure 1 are: Dunkin Donuts,                                    the full 700 instances test set.
Bubble Tea & Crepes, Chipotle, Broadway Hotel.                                            On the partially seen test set with 200 instances,
SDTW is success weighted by normalized Dy-                                             our proposed graph-to-text models outperform the
namic Time Warping (Ilharco et al., 2019). Dis-                                        baseline models in terms of the success based met-
tance between two nodes is defined as meters along                                     rics. In the unseen setup, the rule based baseline
the shortest path between the two nodes and thresh-                                    achieves a better success rate, but falls short when
old distance is 25 meters.                                                             success is weighted by navigation time. This result
SR is the first try success rate in the navigation run                                 shows that the instructions generated by the rule
task. Success is achieved if the human navigator                                       based system are exact by including all possible
stops within a radius of 25 meters around the goal.                                    landmarks, but obviously do not resemble natural
SNT    is success weighted by navigation time:                                         language and high evaluation time suggests that
 1 PN        t̄i                                                                       they are hard to read. Despite moderate BLEU
N     i=1 Si ti , where Si is a binary success indi-
cator that is 1 if the annotator stops within a 25                                     scores and reasonable amount of produced land-
meter radius around the goal. ti is the time un-                                       marks, the seq2seq baseline fails to generate useful
til the navigation run is finished. We empirically                                     navigation instructions. The pretrained graph-to-
estimate the expected navigation time t̄i as 1.3 sec-                                  text model performs better than its plain counter-
onds9 per node in the route. This estimation ranges                                    part in the unseen setup. It produces more correct
from 45.5 seconds for routes with 35 nodes to 58.5                                     landmarks and higher success rates. In the extended
seconds for routes with 45 nodes. SNT is inspired                                      evaluation the pretrained graph-to-text model is
by SPL (Anderson et al., 2018a) but considers tra-                                     compared with the reference on 700 instances in
jectory time instead of trajectory length.                                             each test set. Under the central evaluation metric
                                                                                       of success normalized by time (SNT), our model
6.4       Experimental Results and Analysis                                            reaches .664 and .629 on partially seen and unseen
Results of our experimental evaluation are shown                                       test data, respectively.
in Table 3 and 4. We evaluate on unseen data,                                             An example output for each system together
i.e., routes without any overlap with routes in the                                    with the input map is shown in Figure 4. The rule
training set, and on partially seen data, i.e., routes                                 based instruction is complete, but ignores saliency
    9                                                                                     10
        Average over all successful navigation runs in the dataset.                            The data split is shown in the Appendix.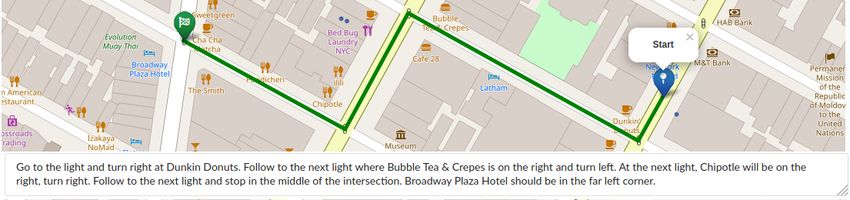
of landmarks and is hard to read. The seq2seq base-       ments. In Proceedings of the 15th European Work-
line generates a navigation instruction that sounds       shop on Natural Language Generation (ENLG),
                                                          pages 90–94, Brighton, UK. Association for Com-
human-like and also includes salient landmarks
                                                          putational Linguistics.
found on the map. However, the directions are in-
correct in this example. The graph-to-text based        H. Chen, A. Suhr, D. Misra, N. Snavely, and Y. Artzi.
models get the directions right and produce fluent        2019. Touchdown: Natural language navigation
natural language sentences. They include land-            and spatial reasoning in visual street environments.
                                                          In 2019 IEEE/CVF Conference on Computer Vi-
marks at the correct sequential position. A further       sion and Pattern Recognition (CVPR), pages 12530–
qualitative evaluation of instructions generated by       12539.
the graph-to-text models is given in the Appendix.
                                                        Andrea F. Daniele, Mohit Bansal, and Matthew R.
7   Conclusion                                            Walter. 2017. Navigational instruction generation
                                                          as inverse reinforcement learning with neural ma-
We presented a dataset and suitable graph-to-text ar-     chine translation. 2017 12th ACM/IEEE Inter-
                                                          national Conference on Human-Robot Interaction
chitecture to generate landmark navigation instruc-       (HRI, pages 109–118.
tions in natural language from OpenStreetMap ge-
ographical data. Our neural model includes novel        Jacob Devlin, Ming-Wei Chang, Kenton Lee, and
aspects such as a graphical representation of a route      Kristina Toutanova. 2019. BERT: Pre-training of
                                                           deep bidirectional transformers for language under-
using angle labels. Our dataset consists of a few          standing. In Proceedings of the 2019 Conference
thousand navigation instructions that are verified         of the North American Chapter of the Association
for successful human navigation. The dataset is            for Computational Linguistics: Human Language
large enough to train a neural model to produce           Technologies, Volume 1 (Long and Short Papers),
                                                           pages 4171–4186, Minneapolis, Minnesota. Associ-
navigation instructions that are very similar in sev-
                                                           ation for Computational Linguistics.
eral aspects to human-generated instructions on
partially seen test data. However, performance nat-     Markus Dräger and Alexander Koller. 2012. Genera-
urally drops on unseen data including new types of       tion of landmark-based navigation instructions from
landmarks in new combinations.                           open-source data. In Proceedings of the 13th Con-
                                                         ference of the European Chapter of the Association
Acknowledgments                                          for Computational Linguistics, pages 757–766, Avi-
                                                         gnon, France. Association for Computational Lin-
We would like to thank Christian Buck and Mas-           guistics.
similiano Ciaramita for initial fruitful discussions
about this work. The research reported in this pa-      Daniel Fried, Ronghang Hu, Volkan Cirik, Anna
                                                          Rohrbach, Jacob Andreas, Louis-Philippe Morency,
per was supported by a Google Focused Research            Taylor Berg-Kirkpatrick, Kate Saenko, Dan Klein,
Award on ”Learning to Negotiate Answers in Multi-         and Trevor Darrell. 2018. Speaker-follower models
Pass Semantic Parsing”.                                   for vision-and-language navigation. In Advances in
                                                          Neural Information Processing Systems, volume 31,
                                                          pages 3314–3325. Curran Associates, Inc.
References                                              Karl Moritz Hermann, Mateusz Malinowski, Piotr
Peter Anderson, Angel X. Chang, Devendra Singh            Mirowski, Andras Banki-Horvath, Keith Anderson,
  Chaplot, Alexey Dosovitskiy, Saurabh Gupta,             and Raia Hadsell. 2020. Learning to follow di-
  Vladlen Koltun, Jana Kosecka, Jitendra Ma-              rections in street view. Proceedings of the AAAI
  lik, Roozbeh Mottaghi, Manolis Savva, and               Conference on Artificial Intelligence, 34(07):11773–
  Amir Roshan Zamir. 2018a. On evaluation of em-          11781.
  bodied navigation agents. CoRR, abs/1807.06757.
                                                        Gabriel Ilharco, Vihan Jain, Alexander Ku, Eugene
Peter Anderson, Qi Wu, Damien Teney, Jake Bruce,          Ie, and Jason Baldridge. 2019. Effective and gen-
  Mark Johnson, Niko Sünderhauf, Ian Reid, Stephen       eral evaluation for instruction conditioned naviga-
  Gould, and Anton van den Hengel. 2018b. Vision-         tion using dynamic time warping. NeurIPS Visually
  and-language navigation: Interpreting visually-         Grounded Interaction and Language Workshop.
  grounded navigation instructions in real environ-
  ments. In Proceedings of the IEEE Conference on       Srinivasan Janarthanam, Oliver Lemon, and Xingkun
  Computer Vision and Pattern Recognition (CVPR).          Liu. 2012. A web-based evaluation framework for
                                                           spatial instruction-giving systems. In Proceedings
Amanda Cercas Curry, Dimitra Gkatzia, and Verena           of the ACL 2012 System Demonstrations, pages 49–
 Rieser. 2015. Generating and evaluating landmark-         54, Jeju Island, Korea. Association for Computa-
 based navigation instructions in virtual environ-         tional Linguistics.
Diederik P. Kingma and Jimmy Ba. 2015. Adam: Arun Balajee Vasudevan, Dengxin Dai, and Luc Van
A method for stochastic optimization. In ICLR Gool. 2020. Talk2nav: Long-range vision-and-
(Poster). language navigation with dual attention and spatial
memory.
Alexander Ku, Peter Anderson, Roma Patel, Eugene
Ie, and Jason Baldridge. 2020. Room-Across-Room: Ashish Vaswani, Noam Shazeer, Niki Parmar, Jakob
Multilingual vision-and-language navigation with Uszkoreit, Llion Jones, Aidan N Gomez, Ł ukasz
dense spatiotemporal grounding. In Conference on Kaiser, and Illia Polosukhin. 2017. Attention is all
Empirical Methods for Natural Language Process- you need. In I. Guyon, U. V. Luxburg, S. Bengio,
ing (EMNLP). H. Wallach, R. Fergus, S. Vishwanathan, and R. Gar-
nett, editors, Advances in Neural Information Pro-
Matt MacMahon, Brian Stankiewicz, and Benjamin cessing Systems 30, pages 5998–6008. Curran Asso-
Kuipers. 2006. Walk the talk: Connecting lan- ciates, Inc.
guage, knowledge, and action in route instructions. Petar Veličković, Guillem Cucurull, Arantxa Casanova,
In Proceedings of the 21st National Conference on Adriana Romero, Pietro Liò, and Yoshua Bengio.
Artificial Intelligence - Volume 2, AAAI’06, page 2018. Graph attention networks. In International
1475–1482. AAAI Press. Conference on Learning Representations.
Andrew J. May, Tracy Ross, Steven H. Bayer, and Harm de Vries, Kurt Shuster, Dhruv Batra, Devi Parikh,
Mikko J. Tarkiainen. 2003. Pedestrian naviga- Jason Weston, and Douwe Kiela. 2018. Talk the
tion aids: information requirements and design im- walk: Navigating new york city through grounded
plications. Personal and Ubiquitous Computing, dialogue. CoRR, abs/1807.03367.
7(6):331–338.
Piotr Mirowski, Matt Grimes, Mateusz Malinowski,
Karl Moritz Hermann, Keith Anderson, Denis
Teplyashin, Karen Simonyan, koray kavukcuoglu,
Andrew Zisserman, and Raia Hadsell. 2018. Learn-
ing to navigate in cities without a map. In S. Bengio,
H. Wallach, H. Larochelle, K. Grauman, N. Cesa-
Bianchi, and R. Garnett, editors, Advances in Neu-
ral Information Processing Systems 31, pages 2419–
2430. Curran Associates, Inc.
Matt Post. 2018. A call for clarity in reporting BLEU
scores. In Proceedings of the Third Conference on
Machine Translation: Research Papers, pages 186–
191, Belgium, Brussels. Association for Computa-
tional Linguistics.
Adam Rousell and Alexander Zipf. 2017. Towards
a landmark-based pedestrian navigation service us-
ing osm data. ISPRS International Journal of Geo-
Information, 6(3):64.
Michael Schlichtkrull, Thomas N. Kipf, Peter Bloem,
Rianne van den Berg, Ivan Titov, and Max Welling.
2018. Modeling relational data with graph convolu-
tional networks. In The Semantic Web, pages 593–
607, Cham. Springer International Publishing.
Abigail See, Peter J. Liu, and Christopher D. Manning.
2017. Get to the point: Summarization with pointer-
generator networks. In Proceedings of the 55th An-
nual Meeting of the Association for Computational
Linguistics (Volume 1: Long Papers), pages 1073–
1083, Vancouver, Canada. Association for Computa-
tional Linguistics.
Ariane Tom and Michel Denis. 2004. Language and
spatial cognition: comparing the roles of landmarks
and street names in route instructions. Applied Cog-
nitive Psychology, 18(9):1213–1230.Appendices TEST UNSEEN 200 INSTANCES
1.0
reference
rule_based
A Dataset Split 0.8 graph2text
g2t+pretrain
NAVIGATION SUCCESS RATE
0.6
0.4
0.2
0.0
35-36 (40) 37-38 (36) 39-41 (51) 42-43 (42) 44-45 (36)
ROUTE LENGTH IN NUMBER OF NODES (#INSTANCES)
TEST PARTIALLY SEEN 200 INSTANCES
1.0
reference
rule_based
0.8 graph2text
g2t+pretrain
NAVIGATION SUCCESS RATE
0.6
0.4
0.2
0.0
35-36 (41) 37-38 (28) 39-41 (47) 42-43 (42) 44-45 (42)
ROUTE LENGTH IN NUMBER OF NODES (#INSTANCES)
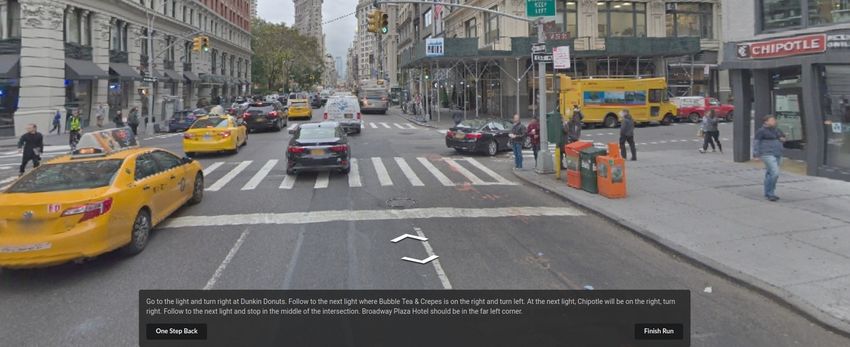
Figure 6: Navigation success rate in respect of route
length. Length is measured in number of nodes in a
route.
shows that the length of the route has little influ-
ence on the navigation success rate on the partially
seen test set. On the unseen data there is tendency
in favor of shorter routes for the g2t+pretrain model.
The reference instructions do not show such bias.
Figure 8 shows navigation success with respect to
Figure 5: Dataset splits number of turns in a route which is another com-
plexity indicator. The success rate drops with an
All 700 routes that are exclusively in the green increasing number of turns for all systems but not
rectangle are in the unseen test set. All 605 routes for the reference instructions. The analysis reveals
that cross the green border are in the development that performance of our model drops with increas-
set. None of those development set routes extend ing route complexity while it is stable for reference
further than the blue rectangle. The training set instructions. The rule based system appears to be
consists of routes within the red rectangle but out- more stable with increasing number of turns in
side of the green rectangle. The partially seen test comparison to the learned models.
set consists of 700 randomly sampled routes from
the training set (and removed from the training set). C Landmarks
Partially seen means that subsequences of those
Table 5 and 6 presents a scoring of types of land-
routes can be present in the training set.
marks produced by our pretrained model. A com-
B Evaluation Navigation Success Rate parison of landmarks produced in human-generated
Analysis reference instructions to those produced in model-
generated instructions shows a large overlap on
We analyze the navigation success rate with respect partially seen data, and ranking is similar to hand-
to properties of the corresponding routes. Figure 6 crafted salient scores used in work in geoinformat-TEST UNSEEN 200 INSTANCES Reference Model
1.0 Top OSM tag Score OSM tag Score
reference
rule_based 1 amenity: bank 0.41 amenity: pharmacy 0.39
0.8 graph2text 2 leisure: park 0.35 shop: furniture 0.38
g2t+pretrain
NAVIGATION SUCCESS RATE
3 amenity: pharmacy 0.32 amenity: bank 0.37
4 shop: furniture 0.30 leisure: garden 0.29
5 cuisine: burger 0.29 cuisine: burger 0.28
0.6 6 leisure: garden 0.29 shop: supermarket 0.25
7 cuisine: coffee shop 0.26 cuisine: coffee shop 0.25
8 amenity: place of worship 0.25 cuisine: american 0.24
0.4
9 cuisine: american 0.23 shop: convenience 0.22
10 amenity: bicycle rental 0.23 cuisine: italian 0.21
0.2
Table 5: Frequency of OSM tags of landmark occur-
0.0 rences in the instructions for the partially seen test set,
3 (51) 4 (94) 5 (46) >=6 (14)
NUMBER OF INTERSECTIONS IN ROUTE (#INSTANCES) normalized by the number of occurrences in the input
TEST PARTIALLY SEEN 200 INSTANCES graph.
1.0
reference
rule_based Reference Model
0.8 graph2text Top OSM tag Score OSM tag Score
g2t+pretrain
NAVIGATION SUCCESS RATE
1 amenity: cinema 0.58 cuisine: juice 0.64
2 shop: wine 0.53 amenity: pharmacy 0.55
0.6 3 shop: computer 0.53 shop: convenience 0.50
4 amenity: pharmacy 0.51 amenity: cinema 0.46
5 cuisine: coffee shop 0.49 cuisine: coffee shop 0.46
0.4
6 tourism: hotel 0.44 shop: computer 0.45
7 shop: convenience 0.42 tourism: hotel 0.41
0.2 8 shop: houseware 0.31 shop: pet 0.39
9 shop: supermarket 0.31 shop: beauty 0.38
10 amenity: bank 0.28 shop: wine 0.38
0.0
3 (69) 4 (74) 5 (35) >=6 (22)
NUMBER OF INTERSECTIONS IN ROUTE (#INSTANCES) Table 6: Frequency of OSM tags of landmark occur-
rences in the instructions for the unseen test set, nor-
Figure 7: Navigation success rate in respect of number malized by the number of occurrences in the input
of intersections in a route. Each node in the route with graph.
more than two neighbors is counted as an intersection.
TEST UNSEEN 200 INSTANCES ics (Rousell and Zipf, 2017). The distribution of
1.0
reference
rule_based landmarks in the unseen test data is different from
0.8 graph2text
g2t+pretrain the partially seen data. To some extent, the model
NAVIGATION SUCCESS RATE
is able to adapt to the unseen environment.
0.6
D Annotation Instructions
0.4
The AMT workers got the following instructions
0.2 for the writing task:
The goal of this task is to write navigation in-
0.0
1 (61) 2 (100) 3 (36) >=4 (8) structions for a given route. Imagine a tourist is
NUMBER OF TURNS IN ROUTE (#INSTANCES)
asking for directions in a neighborhood you are
TEST PARTIALLY SEEN 200 INSTANCES
1.0 familiar with and try to mention useful landmarks
reference
rule_based to support orientation. Another annotator will later
0.8 graph2text
g2t+pretrain
NAVIGATION SUCCESS RATE
read your instructions in order to find the goal lo-
0.6
cation in StreetView (Navigation Run Task). If the
other annotator successfully navigates to the goal
0.4 location, your instruction is validated.
0.2 E Examples
0.0
1 (60) 2 (98) 3 (30) >=4 (12)
NUMBER OF TURNS IN ROUTE (#INSTANCES)
Figure 8: Navigation success rate in respect of number
of turns in a route. A turn is defined as an intersection
that isn’t crossed in straight direction (345◦ to 15◦ ).reference: Head straight past the playground and turn left at the light. Turn right at the next light with Fantastic Cafe on the right. Continue down the very long
street and stop at the next light with turntable 5060 on the near left corner.
rule based: parking left pitch left playground left pitch left bus stop right light left Citibank left light right Fantastic Cafe left Church of the right Dorian Gray Tap
left Perbacco left Matcha Cafe Wabi left B4 left stop
seq2seq: Go straight to the light and turn left. Go straight to the first light and turn left. Go straight to the first light and stop a couple of steps before the next light.
You should see Perbacco on your left.
graph2text: Head to the light and turn left. At the next light with Fantastic cafe on your near right corner, turn right. Go to the next light and stop in the middle of
the intersection. B4 Gray Tap should be on your left.
g2t+pretrain: Head to the light and turn left. At the following light with Fantastic cafe on the far left corner, turn right. Go to the next light with 4th street Deli on
the near left corner and stop in the middle of the intersection.
Figure 9: Route from partially seen test set with successful navigation for g2t+pretrain.
reference: Turn right at the light right ahead of you. Go through the following light. The next light is a double intersection. Turn left at the first of the lights, and
go through the second one. Pass a graveyard on the right and stop at the end of it, right as the church starts. It’s about 2/3 down the block.
rule based: Garden left light right Chef Restaurant Supplies right light straight bus stop left light left light straight grave yard right stop Saint Patrick’s right
seq2seq: Go to the light and turn right. Go through the following light, Restaurant on the corner. Pass a bus stop on the right, and go through the light. At the
following light, bus stop on the corner, turn left. Go through the following light, and stop after a step or two. Saint Mary’s church will be on the right.
graph2text: Turn right at the first set of lights. Go through the next set of lights and then turn left at the following lights. Pass Second Time Around half way down
the block. Stop at Saint’s around Saint’s church on the right.
g2t+pretrain: Go to the light and turn right. Go straight through 1 light and at the following light, there should be a bus stop on the far left corner. Turn left and
go about 1/2 to the next light, stopping in front of Saint Patrick’s church on the right and graveyard Memorial’s on the right.
Figure 10: Route from unseen test set with successful navigation for g2t+pretrain.reference: Go to the light and turn right. Go through the following light with Optical 88. The next light will have Da Gennaro on the far right corner, go through
the light. Go through the following light as well, with a school on the corner. Turn right at the following light. Take the first left possible and stop after a few steps.
rule based: Hong Kong Supermarket left light right Sweet Moment left light straight 12 Corners right light straight Da Gennaro right Public School 130 right
light straight parking left May Wah Vegetarian right Hair Lounge right light right intersection left stop
seq2seq: Go straight and take a right at the intersection where Hong Kong supermarket is. Go through the next three intersections and at the fourth one take a
right and stop at Hair Lounge.
graph2text: Go to the light and turn right. Go through the following light, Optical 88 on the corner. Go through the following light as well, Da Gennaro on the
corner. At the following light, Hair Lounge on the corner, turn right. Take a step and stop.
g2t+pretrain: Head to the light and turn right. Go past the next 2 lights with Da Gennaro on the right corner. At the 3rd light with May Wah Vegetarian on the far
right corner, turn left. Take one step and stop.
Figure 11: Route from partially seen test set with unsuccessful navigation for g2t+pretrain.
reference: Go straight to the light and turn right. Go through the next 3 lights. At the 4th, there is a Chase and Nike store on the corners. Go through the
intersection and stop on the other side at your destination.
rule based: Public School 21 left light right Lombardi’s Pizza left park left Rice to Riches right drinking water left playground left Taı̈m right light straight
Tartinery left Duane Reade left light straight restaurant left Premium Laces right Starbucks left light straight MUJI at MoMA right Balthazar left SoHo left light
straight Niketown right stop Chase left Chase left shelter left
seq2seq: Head to the light and turn right. Go past the next 3 lights with Starbucks on the left corner. At the 4th light with Chase bank on the near left corner, cross
the street and stop.
graph2text: Head to the light and turn right. Go past the next 2 lights with Starbucks on the far left corner. At the 3rd light with Chase on the far left corner, cross
the street and stop. Chase should be on your left.
g2t+pretrain: Head to the light and turn right. Go past the next 3 lights with Starbucks on the left corner. At the 4th light with Chase on the near left corner, cross
the street. Take one step and stop.
Figure 12: Route from unseen test set with unsuccessful navigation for g2t+pretrain.You can also read