Phantom rivers filter birds and bats by acoustic niche
←
→
Page content transcription
If your browser does not render page correctly, please read the page content below
ARTICLE
                   https://doi.org/10.1038/s41467-021-22390-y                 OPEN

                  Phantom rivers filter birds and bats by
                  acoustic niche
                  D. G. E. Gomes            1 ✉,   C. A. Toth1, H. J. Cole1, C. D. Francis                 2,3   & J. R. Barber        1,3 ✉

                  Natural sensory environments, despite strong potential for structuring systems, have been
                  neglected in ecological theory. Here, we test the hypothesis that intense natural acoustic
1234567890():,;

                  environments shape animal distributions and behavior by broadcasting whitewater river noise
                  in montane riparian zones for two summers. Additionally, we use spectrally-altered river
                  noise to explicitly test the effects of masking as a mechanism driving patterns. Using data
                  from abundance and activity surveys across 60 locations, over two full breeding seasons, we
                  find that both birds and bats avoid areas with high sound levels, while birds avoid frequencies
                  that overlap with birdsong, and bats avoid higher frequencies more generally. We place 720
                  clay caterpillars in willows, and find that intense sound levels decrease foraging behavior in
                  birds. For bats, we deploy foraging tests across 144 nights, consisting of robotic insect-wing
                  mimics, and speakers broadcasting bat prey sounds, and find that bats appear to switch
                  hunting strategies from passive listening to aerial hawking as sound levels increase. Natural
                  acoustic environments are an underappreciated niche axis, a conclusion that serves to
                  escalate the urgency of mitigating human-created noise.

                  1 BoiseState University, Boise, ID, USA. 2 California Polytechnic State University, San Luis Obispo, CA, USA. 3These authors jointly supervised this work: C. D.
                  Francis, J. R. Barber. ✉email: dylangomes@u.boisestate.edu; jessebarber@boisestate.edu

                  NATURE COMMUNICATIONS | (2021)12:3029 | https://doi.org/10.1038/s41467-021-22390-y | www.nature.com/naturecommunications                                      1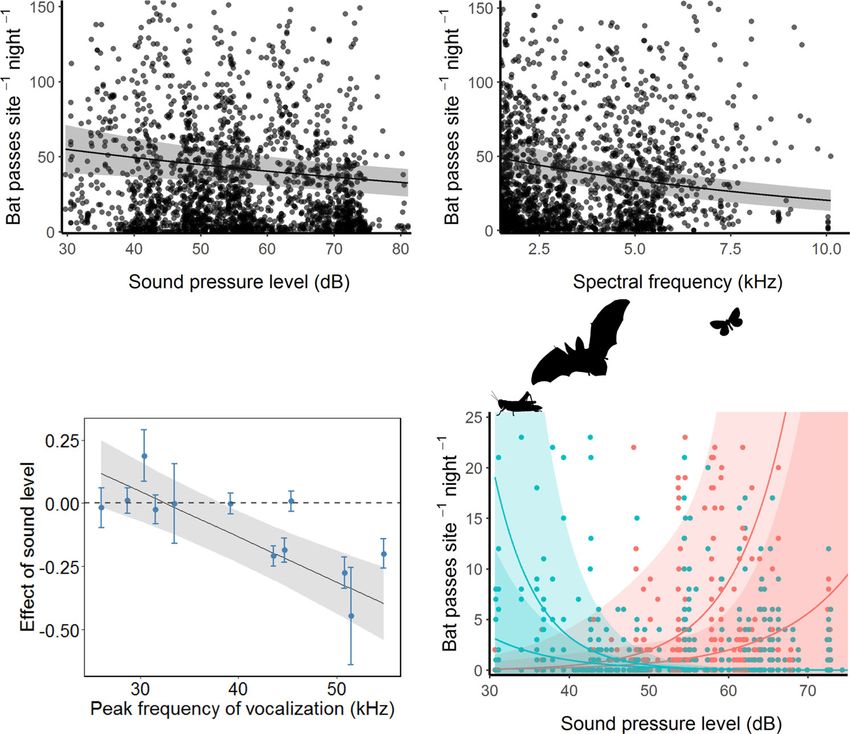
ARTICLE                                                                 NATURE COMMUNICATIONS | https://doi.org/10.1038/s41467-021-22390-y

A
         nimals surveil the environment to extract information               Results and discussion
         important for decision making. Bats alter roost emergence           Bird abundance. Leveraging data from 2969 point counts (~150
         in the presence of rain noise1 and bees use ultraviolet2 and        count hours), we found bird abundance declined by 7.0% (95%
electromagnetic3 signals created by flowers to learn the location             CI: 3.4–10.5%) for each 12 dB increase in sound level (Fig. 2A;
of nectar rewards. The information an animal can extract from                Table S1). High-intensity noise makes detection and dis-
the world, its umwelt4, has long been appreciated as important for           crimination of acoustic signals and cues more difficult, either
explaining animal behavior5, yet we often fail to account for the            because of energetic masking at the periphery of the auditory
filtering effects of these umwelten when explaining larger ecolo-             system, or because of limited central attentional resources6. To
gical patterns. Despite recent advances in understanding the role            explore masking of communication, we took the difference
that anthropogenic noise and artificial light play on wildlife6–10, it        between the median background frequency and individual bird
is surprising that natural sensory environments, such as gradients           species’ peak vocalization frequency as a measure of spectral
of light and sound, are rarely used in ecological analyses11. In one         overlap with the acoustic environment. Birds with a peak voca-
of the few exceptions, noise from nearby streams had the most                lization frequency closer to the median of the background spec-
power in explaining where frogs chose to call relative to other              trum showed lower abundances, with declines of 10.0%
habitat variables12. Recent experimental evidence further sup-               (5.1–15.3%) for each 2 kHz increase in spectral overlap (Fig. 2B).
ports a potentially widespread role of sensory environments in               However, these overlap-mediated effects interact with sound level
shaping animal behavior and ecology. Playback of river noise                 in a diminishing way (Table S1): higher amplitude background
alters spider abundance13, healthy coral reef sounds increases fish           noise resulted in weaker relationships between spectral overlap
settlement on degraded reefs14, and stream noise, paired with                and bird abundance. It seems that when acoustic environments
male advertisement calls, attracts more female torrent frogs15.              are intense, masking of specific vocalizations is no longer the
   The cacophony of an insect chorus and the thunder of a                    primary mechanism underlying distributional changes (Fig. S14).
mountain river are examples of intense acoustic sources that                    Individual species models (Table S2) combined with phylo-
characterize many environments. There are 150,000 km of marine               genetically-informed, trait-based analyses indicate that birds
shoreline (NOAA 2014) and 5.6 million km of rivers and streams               with lower-frequency songs avoid noise with similar spectra,
in the United States alone (US EPA 2014) that expose adjacent                while birds with higher frequency vocalizations do not
environments to the sounds of moving water. We hypothesize                   (t = −3.73; p < 0.01; Fig. 2C). Previous work (2011)20 found that
that such intense natural acoustic sources have the power to                 lower-frequency vocalizers more strongly avoid high sound levels.
structure habitat use11. To test this hypothesis, we select 60               Here, no distributional patterns related to song frequency
locations within 20 sites, which we match for elevation and                  emerged in response to the sound level or median frequency of
riparian vegetation, along streams in the Pioneer mountain range             the acoustic environment (Table S3).
of Idaho (Fig. 1A) and monitor two taxonomic groups dependent
upon the acoustic environment5 that are abundant, diverse, and
                                                                             Bird foraging. Animals that remain in anthropogenic noise can
widespread across our system—birds and bats. Ten sites remain
                                                                             bear costs, such as reduced body condition6. To examine one
acoustically unaltered (controls) and span a natural range of
                                                                             potential behavioral cost of exposure to natural noise, we placed
sound levels; from quiet, slow-moving streams to loud, white-
                                                                             720 clay caterpillars across our sites (Fig. S8). While controlling
water rapids (30.6–73.8 dBA, 24-h L50). We broadcast whitewater
                                                                             for bird abundance, the odds of a caterpillar being depredated
river noise from speaker arrays powered by solar panels and
                                                                             by a bird decreased by 37.2% (95% CI: 22.7–49.1%) for each 12
banks of batteries at five additional, naturally quiet streams using
                                                                             dB increase in sound level (Fig. 2D; Table S4). As this task was
acoustic recordings taken from the highest sound level control
                                                                             entirely visual, it seems likely that cross-modal attentional
sites. These phantom rivers thus present the amplitude and
                                                                             limitations underlie this effect21. Birds that persist in high
spectral profiles of raging, whitewater rapids (avg. median fre-
                                                                             sound-level environments will likely suffer negative foraging
quency ± SD: 2.1 ± 1.3 kHz). To understand the mechanisms
                                                                             consequences under noise exposure and such effects may have
underlying responses to the acoustic environment, we also create
                                                                             indirect consequences for arthropods13.
a gradient of background spectra by broadcasting shifted river
noise of an identical temporal profile, but shifted upwards in
frequency (4.8 ± 1.3 kHz) at five additional quiet-stream sites               Bat activity. The direct effects of the acoustic environment are a
(Fig. 1B). We create these files so that the average broadcast                potential driver of bat distributions. Limited evidence suggests
energy, weighted by birds’ hearing thresholds, is the same (see              that space-use by bats is shaped by anthropogenic noise22, and
supplement for details; Fig. 1C).                                            laboratory work has shown that gleaning bats have difficulty
   Energetic masking occurs when there is spectral overlap                   hunting in both anthropogenic and natural noise17,18. Using
between the signal and background noise. Masking of vocaliza-                ~100,000 identified bat call sequences, we found that overall bat
tions, like birdsong, can drive distributional shifts of animals in          activity decreased 8.2% (95% CI: 4.8–11.4%) for each 12 dB
areas exposed to anthropogenic noise16. Similarly, the masking of            increase in sound level, and decreased 19.5% (16.1–22.8%) for
prey cues is suggested to be a primary mechanism structuring the             each 2 kHz increase in median background frequency (Fig. 3A,
space use of acoustically-mediated predators, such as gleaning               B; Table S5). Individual species models reveal consistently
bats17,18.                                                                   similar inferences (Table S6). Bats likely perceive higher fre-
   In this work, we predict that overlap between song and back-              quency noise as louder23, yet masking of echolocation is an
ground noise is an important predictor of bird distributions if              improbable explanation for these results as bat sonar does not
masking of birdsong is underlying noise effects (Fig. 1D). Because           spectrally overlap with the acoustic environments we studied
most bat echolocation is higher frequency than the acoustic                  (although see Bunkley et al.22 for frequency shifts in non-
environments we created, we do not expect changes in bat activity            overlapping noise). Phylogenetically controlled trait-based
to be related to sonar frequency, yet we do predict that gleaning            analyses revealed that bats with increasingly high-frequency
bats will avoid sites with energy in higher frequencies (>3 kHz)19           sonar exhibited increasingly lower activity with rising sound
due to masking of prey-generated sounds (Fig. S11)17,18. Our                 levels (t = −5.39; p < 0.001; Fig. 3C; Table S8), further counter to
experimental design allows us to explicitly test the effects of              masking as an explanatory mechanism. This finding may reflect
sound level separately from those of background spectra.                     indirect drivers if small insects disproportionately avoid noise,

2                NATURE COMMUNICATIONS | (2021)12:3029 | https://doi.org/10.1038/s41467-021-22390-y | www.nature.com/naturecommunications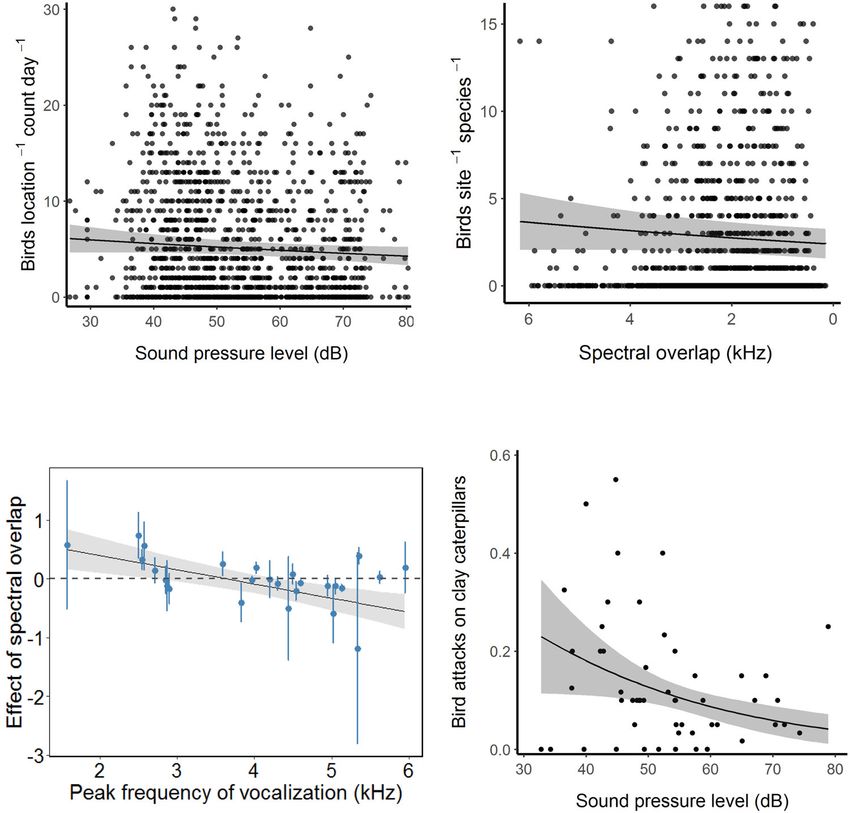
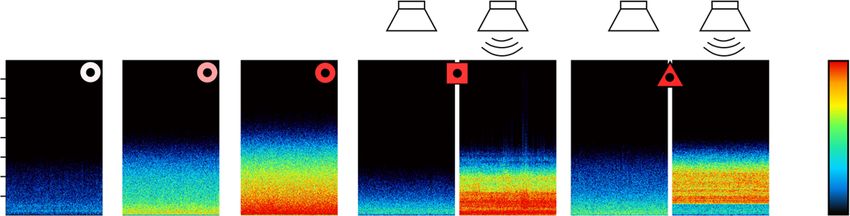
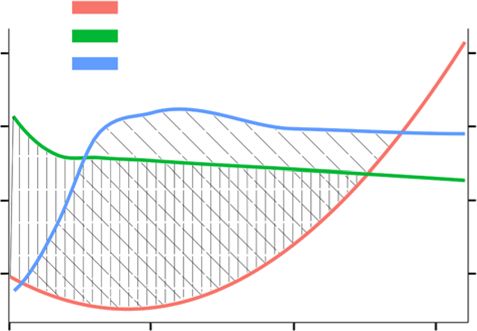
NATURE COMMUNICATIONS | https://doi.org/10.1038/s41467-021-22390-y                                                                           ARTICLE

Fig. 1 Design and predictions for phantom rivers playback experiment. A Twenty sites were monitored across the Pioneer Mountains of Idaho,
comprising a gradient of sound levels (indicated by color scale). Control sites are indicated by circles, phantom river playback sites by squares, and shifted-
river playback sites by triangles. B These symbols are matched with their geographically referenced representative spectrograms (linked between A, B via
black dots in center of symbols) to show the gradient of noise exposure at control sites and playback sites with speakers both on and off. C Both playback
files were created so that the average broadcast energy, weighted by birds’ hearing thresholds, was the same. D Predicted responses of birds and bats to
the playback treatments. Silhouettes placed on frequency axis as a heuristic representation of vocalization frequency (not to scale).

as these are most accessible to high-frequency echolocators24.                   is at odds with previous laboratory work17, and might indicate
Alternatively, high-frequency echolocators (and listeners23)                     that wild bats are behaviorally flexible enough to cope with
experience a reduced sensing area, since high-frequencies                        noise18. Indeed, those bats that are obligate aerial hawkers are
attenuate quickly, which may compromise risk assessments in                      more likely to avoid higher frequency acoustic environments (t =
a noisy world.                                                                   −4.1; p < 0.01).
   While these data suggest that masking of echolocation is not
responsible for patterns of bat activity, they do indicate that
limited attentional resources available for sonar processing and                 Bat foraging. To quantify bats’ use of passive listening and active
perhaps masking of lower-frequency environmental cues25 might                    sonar strategies, and to explore if bats employ flexibility in
be two underappreciated drivers of bat distributions. We used                    hunting techniques to circumvent the costs of noise (Fig. S11),
additional trait-based analyses to test a component of the latter                we deployed custom-designed assays at 36 locations across our
hypothesis and found that bats capable of hunting via passive                    sites. We placed small speakers playing insect walking and
listening are not more likely to avoid noise (Table S8). This result             orthopteran mating sounds on the ground to evaluate bats’

NATURE COMMUNICATIONS | (2021)12:3029 | https://doi.org/10.1038/s41467-021-22390-y | www.nature.com/naturecommunications                                     3
ARTICLE                                                                   NATURE COMMUNICATIONS | https://doi.org/10.1038/s41467-021-22390-y

Fig. 2 Bird responses to noise. A Bird abundance declines with increasing sound levels. B Bird abundance declines with increasing spectral overlap with
song (note reversed x axis; 0 = complete spectral overlap). C Phylogenetically-informed trait analyses reveal that lower-frequency singers are more likely
to be masked by background noise with similar spectra (n = 26 species). D Bird foraging rates decrease in high sound levels. For all plots, points represent
raw data (species estimates for C), error bars represent standard errors (C only), the plotted lines (estimated conditional means) and shaded gray regions
(95% confidence intervals) represent predicted values of the response variable over the range of the variable on the x axis, given constant mean values of
all other variables in the model.

attraction to prey-generated cues (Fig. S13). To query bats’ use of            switch is unlikely to be universal, which may allow flexible bat
sonar-mediated aerial hawking, we used a motor-driven syn-                     species to persist where others cannot18.
thetic wingsensu 26 placed at 1 m above the ground to echo-
acoustically mimic the wingbeat frequency of insect prey (250                  Detectability in noise. We experimentally show that natural
Hz, e.g., Diptera27; Fig. S12). We focused our analysis on bat                 noise can have strong effects on animal abundance, activity, and
species that employ both strategies (i.e., behaviorally flexible bats;          behavior, yet our findings are dependent on the probability of
including Corynorhinus townsendii, Myotis evotis, Myotis luci-                 detecting vocalizing animals in noise28,29. For birds, we controlled
fugus, and Myotis thysanodes; see Supplementary Information)                   for this potential problem using four approaches. We turned off
and predicted that high sound-level acoustic environments                      speakers during counts so that most observations occurred below
would hinder bats’ use of passive listening (which requires the                sound levels known to interfere with detection28 (Fig. S6). To
processing of lower-frequency sounds) and result in heightened                 implement imperfect detection into our models, we both directly
use of sonar18,26. Indeed, while controlling for changes in bat                measured observer detection in noise with a birdsong playback
abundance, for every 12 dB increase in sound pressure level and                experiment (Fig. S7), and estimated bird detection probabilities
2 kHz increase in median background frequency, bat activity at                 with a noise-informed removal model (Table S11). We wore
speakers playing prey cues decreased by a factor of 0.58 (95% CI:              earplugs and earmuffs during a duplicate set of point counts so
0.38–0.87; Fig. 3D; Table S7), while aerial hawking activity                   that observations were visual-only (Table S12), which suggest
increased by a factor of 8.1 (95% CI: 1.5–44.1) at simultaneously              similar inferences as above (Table S1). For bats, a laboratory test
deployed robo-insects. This strategy switching only seemed to                  verified acoustic recording units were triggered similarly in a
occur at sites with relatively higher frequency acoustic environ-              gradient of noise levels. Further, we validated that identification
ments, likely because the bulk of the energy of prey-generated                 software correctly classified bats by experimentally adding noise
sounds are within these frequencies25. The ability to behaviorally             to files (see Supplementary information).

4                  NATURE COMMUNICATIONS | (2021)12:3029 | https://doi.org/10.1038/s41467-021-22390-y | www.nature.com/naturecommunications
NATURE COMMUNICATIONS | https://doi.org/10.1038/s41467-021-22390-y                                                                                ARTICLE

Fig. 3 Bat responses to noise. A Bat activity declines with increasing sound levels. B Bat activity declines with increasing frequency of the acoustic
environment. C Phylogenetically-informed trait analyses reveal that higher frequency echolocators are more likely to avoid high sound-level environments
(n = 12 species). D Foraging modality for flexible bat species appear to shift from passive listening to aerial-hawking with variation in background sound
level and frequency. Blue lines denote predicted declines in bat detections at artificial prey sounds speakers with increased sound level where the top and
bottom lines reflect median background frequencies at 10 and 8 kHz, respectively. Red lines denote the predicted increase in bat detections at robotic
fluttering insects with higher noise levels at 8 kHz (top line) and 6 kHz (bottom line). For all plots, points represent raw data (species estimates for C),
error bars represent standard errors (C only), the plotted lines (estimated conditional means) and shaded regions (95% confidence intervals) represent
predicted values of the response variable over the range of the variable on the x axis, given constant mean values of all other variables in the model
(except in D).

Concluding remarks. Our results demonstrate that natural                        20 sites into 10 noise playback sites, and 10 control sites (Fig. 1A; S1). The control
acoustic environments represent an underappreciated dimension                   sites ranged from quiet, slow-moving streams to relatively loud whitewater tor-
                                                                                rents. Noise playback sites, on the other hand, were relatively quiet (not white-
of the niche and are clearly important in shaping animal behavior               water) sites, where we broadcast loud whitewater river recordings with speaker
and distributions. Incorporating this axis into our understanding               arrays hung from towers (Fig. S1; S2; S3; S4; see supplementary information for
of the natural world will provide stronger inference for both basic             more details on noise file creation, playback equipment, and experimental setup).
and applied questions11. Because the spatial and temporal foot-                 At five of the noise playback sites we broadcast normal river noise (hereafter
print of human-generated noise is orders of magnitude greater                   referred to as ‘river noise’ sites), and at the other five noise sites we broadcast
                                                                                spectrally-altered river recordings (hereafter referred to as “shifted noise” sites).
than loud natural acoustic environments, it is critical to under-                   Our field sites were oriented along the riparian zone, with data collection
stand that the insights provided by our data increase the                       occurring at three primary locations within each site (Fig. S1): (1) roughly in the
importance of mitigating noise pollution impacts on animals and                 middle of the speaker tower systems, (2) at a shorter distance from the middle
their habitats. Our results reveal age-old strategies for dealing               location (mean: 198.2 ± 54.5 m SD; range: 117.6–384.5 m), and (3) and a longer
                                                                                distance from the middle location (in the opposite direction from the nearer
with the long-standing problem of noise and help explain con-                   location; mean: 312.7 ± 64.7 m SD; range: 249.1–479.6 m). Thus, sites were
temporary responses to anthropogenic noise. A renewed focus on                  approximately 510.9 ± 98.3 m long (range: 374.7–850.6 m), along the riparian
animal umwelten will redefine our understanding of ecological                    corridor. All control sites were, at minimum, 1 km apart along the riparian corridor
niche axes that have been canalized by our own sensory biases11.                from any noise site, to maintain acoustic independence (see Fig. 1A; S1).

                                                                                Data collection
Methods
IACUC approval: all work described below was approved by the Boise State
                                                                                Birds
Institutional Animal Care and Use Committee: AC15-021.
                                                                                We conducted three-minute avian point counts between one half hour before sunrise and
                                                                                6 h after sunrise (roughly 0530–1130 h). During the project, we conducted 1330 point-
Site layout. We selected 20 sites, across five drainages, within the Pioneer     counts from 28 May to 20 July 2017 and 1639 point-count events occurred from 7 May
Mountains of Idaho—matched for elevation and riparian habitat. We split these   to 24 July in 2018.

NATURE COMMUNICATIONS | (2021)12:3029 | https://doi.org/10.1038/s41467-021-22390-y | www.nature.com/naturecommunications                                            5
ARTICLE NATURE COMMUNICATIONS | https://doi.org/10.1038/s41467-021-22390-y
Caterpillar deployment. We deployed a total of 720 clay caterpillars throughout the First, we selected only recordings made on control sites in 2017 and 2018 (n =
2018 breeding season. Forty caterpillars were glued to stems and branches of trees 740,848 calls), as echolocation call characteristics may be affected by local acoustic
between 1 and 2.5 m high at each site (Fig. S8). Twenty caterpillars surrounded the environments (e.g., Bunkley et al.)22. Secondly, we averaged all call parameters per
middle point count location at each site (a set of 10 were placed upstream, and species per hour at each site to decrease the possible effects of few individuals
another set of 10 were placed downstream starting from the middle ARU location), driving measurements. This resulted in 9538 species-hours of recordings, which
while the other twenty were at upstream and downstream sampling locations themselves were averaged per species (Table S13).
(10 each at upstream and downstream locations). We placed each caterpillar along
the riparian corridor, at least 1 m apart from each other30. See Supplementary
Quantifying environmental variables. We used long-term monitoring of the
information for details on caterpillar predation scoring.
acoustic environment (via Roland R05 recorders) to calculate daily sound pressure
level (L50 dBA) and median frequency (kHz) values for each location (see sup-
Bird trait analysis. We performed a trait-based analysis to understand the plementary information for details on quantification of all predictor variables).
mechanistic patterns of bird distributions in our study paradigm. Avian vocal
frequencies and body mass were collected from Hu and Cardoso 2009, Cardoso
Sound pressure level (SPL). We converted 106,769 h of long-term ARU recordings
2014, and Francis 201516,31,32. When multiple sources contained data, the values
into daily-averaged median sound pressure levels (L50; measured as dBA rel. 20
were averaged. There were a few cases where none of those sources contained a
µPa) see refs. 13,44 using custom software ‘AUDIO2NVSPL’ and ‘Acoustic Mon-
vocal frequency or mass measurement for species of interest. Thus, representative
itoring Toolbox’ (Damon Joyce, Natural Sounds and Night Skies Division, National
songs were downloaded from the Macaulay Library of the Cornell Lab of Orni-
Park Service).
thology based on recording quality and geographical relevance (MacGillivray’s
warbler: ML42249; dusky flycatcher: ML534684; red-naped sapsuckers: ML6956),
and analyzed with Avisoft SASLab Pro to obtain a peak frequency measure. Mass Acoustic environment spectrum. We used custom software45 in the programming
measurements for these ‘missing’ birds were taken from the ‘All about birds’ language R and the package ‘FFmpeg’ in command prompt to convert 106,769 h of
webpage of the Cornell Lab of Ornithology. long-term recordings into 71,282 individual 3-minute files starting each hour of the
day (Fig. S5). Thus 24, 3-min files were created per acoustic recording location
per day (one for every hour). We then used the packages “tuneR” and “seewave” to
Bats read in and measure the median frequency of sound files, respectively45–47. These
Measuring and identifying bat calls. We measured bat activity using Song Meter 3 hourly metrics were then averaged by date to create a daily metric.
(hereafter “SM3”) recording units (Wildlife Acoustics Inc., Massachusetts, USA)
equipped with a single SMU (Wildlife Acoustics Inc.) ultrasonic microphone. One Statistics. All models of abundance, activity, and foraging transects were gen-
recording unit was used at each site and we pseudo-randomly rotated the unit eralized linear mixed effects models (glmm) in R48 using the package ‘lme4’49,50 or
between the three point-count locations so that each location was monitored for at ‘glmmTMB’51. All distribution families were selected based on theoretical sampling
least 21 days. We mounted microphones on metal conduit at a height of ~3 m, processes of the data, models were checked for collinearity (VIF scores)52, and
oriented perpendicular to the ground and facing away from the stream to optimize model fits were visually checked with residual plots (see supplemental R code)53.
recording conditions (Fig. S9; S10; see Supplementary information for more
information). Bird abundance and bat activity
Model predictors and covariates
Robotic insects. We used a modified version of Lazure and Fenton’s26 apparatus to
Both bird and bat models had the following variables in a glmm: site and bird/bat species
present bats with a fluttering target (Fig. S12). This consisted of a 3 cm2 piece of
masking tape affixed to a metal rod [30.48 cm length × 3.25 mm diameter], which were random effects terms and sound pressure level (dBA L50), sound spectrum (median
itself was connected to a 12-volt brushed DC motor (AndyMark 9015 12 V, frequency), the interaction between sound pressure level and spectrum, elevation, percent
AndyMark Inc., Kokomo, IN, USA). The no-load revolution speed of these motors riparian vegetation, ordinal date (and a quadratic version of this), and year as fixed
(267 Hz) falls within the range of wingbeat frequency measured in effects. While year is sometimes used as a random-effect term, it is suggested to be used
Chironomidae27,33, a group that is an important food source for many North as a fixed effect if fewer than five levels exist for that factor, as variance estimates become
American bat species34. imprecise54,55. Additionally, moon phase was a fixed effect in the bat models56, while
We attached each motor to a tripod made of PVC piping and positioned the spectral overlap (the absolute difference between sound spectrum and bird species
tripod such that the target was approximately 1.2 m above the ground. Each motor vocalization frequencies) and the interaction between sound pressure level and spectral
was powered by a 12 V battery (35Ah AGM; DURA12-35C, Duracell) which was overlap were fixed effects in bird models.
controlled by a programmable 12 V timer (CN101, FAVOLCANO) to We attempted to fit both sound pressure level and spectrum as having random slopes
automatically start and stop the motor each night. The rotors were powered for 2 h for each species, yet both bat and bird models would not converge with such complex
following sunset. model structure. Thus, we followed group models with individual species models (see
Supplementary information).
Prey-sound speaker playback. We created a playlist composed of several insect
acoustic cues to present gleaning bats: a beetle (Tenebrio molitor) walking on dried Model family distribution and link function
grass, a cricket (Acheta domesticus) walking on leaves, mealworm larvae (Tenebrio For both bird and bat counts, we used a negative binomial distribution with a log link,
molitor) on leaves, fall field cricket (Gryllus pennsylvanicus) calls, and fork-tailed rather than a Poisson distribution, because data were over-dispersed. We plotted
bush katydid (Scudderia furcata) calls. The cricket and katydid calls were sourced variance-mean relationships and residuals of multiple models to select the appropriate
from the Macaulay Library (ML527360 and ML107505, respectively). variance structure, and compared these with AIC to select the best-fitting distribution
(see R script for further justification of these methods)54.
Experimental setup for bat foraging tests. Most sites received two rotors
(Fig. S12) and two speakers (Fig. S13): one of each at the center of the site, and one
of each at approximately 125 m from the center of the site (in opposite directions in Individual species models
order to have tests in a range of acoustic environments), placed roughly 10 m from Individual species models were parameterized the same as above (except without the
the edge of the riparian zone. Rotors and speakers at the center locations were species term). All 12 bat species (see Tables S6; S10) and 26 of the most common birds
separated by at least 50 m. The exception to this setup were the four positive (see Tables S2; S9) were modeled individually to be able to interpret model parameter
control (loud whitewater river) sites, which only received a single rotor and speaker estimates, with complex interactions, for each species.
separated by 50 m because of logistical difficulties of accessing those sites. We
paired each rotor and speaker with an SM2BAT + bat detector equipped with an Clay caterpillar predation. We modeled caterpillar predation with a glmm (bino-
SMX-US microphone (Wildlife Acoustics Inc.)35, using tripods to elevate the mial family; logit link function), using the number of individual scorers as weights
microphones approximately 1 m off the ground and ~1 m from the speaker/rotor. in the model. Like the bird abundance model, we used site as a random effect and
We programmed the bat detectors with a gain of 36 dB and a trigger level of 18 dB sound pressure level (dBA L50), spectral frequency (median), elevation, percent
to limit recordings to bats that were passing within the immediate vicinity. To riparian vegetation, ordinal date, and year as fixed effects (Table S4). Additionally,
allow for a comparison of activity between speakers and rotors, bat activity was the predicted number of birds at a site were modeled as fixed effects to control for
only considered for the first two hours following sunset. varying amounts of foraging birds on the landscape.
Bat trait analysis. We collected bat foraging behavior and peak echolocation fre- Robotic moths and prey-sound speakers. Robotic moth and prey-sound speaker
quency information to use as predictors in a phylogenetically controlled trait models were parameterized exactly the same as the overall bat activity model. That
analysis (Tables S8; S13). We based our behavioral foraging classifications on the is, the model was fit with a negative binomial family (log link) with site and species
categories of Ratcliffe et al.36 and followed the classifications of Gordon et al.37 as random effects and sound pressure level (dBA L50), sound spectrum (median
where possible, and others38–43 where necessary. We extracted peak echolocation frequency), the interaction between sound pressure level and spectrum, moon
frequency from the 2017 and 2018 SM3 field recordings and employed two controls phase, elevation, percent riparian vegetation, ordinal date (and a quadratic version
to decrease variability in call parameters potentially introduced via this method. of this), and year as fixed effects. Additionally, the predicted number of bats at a
6 NATURE COMMUNICATIONS | (2021)12:3029 | https://doi.org/10.1038/s41467-021-22390-y | www.nature.com/naturecommunicationsNATURE COMMUNICATIONS | https://doi.org/10.1038/s41467-021-22390-y ARTICLE
site were modeled as fixed effects to control for varying amounts of foraging bats 18. Gomes, D. G. E. et al. Bats perceptually weight prey cues across sensory
on the landscape. systems when hunting in noise. Science 353, 1277–1280 (2016).
19. Fuzessery, Z. M., Buttenhoff, P., Andrews, B. & Kennedy, J. M. Passive sound
Trait analyses. We performed trait analyses with phylogenetic generalized least localization of prey by the pallid bat (Antrozous p. pallidus). J. Comp. Physiol.
squares (PGLS) to control for relatedness while predicting species responses to A 171, 767–777 (1993).
noise12. We performed PGLS analyses with the gls function in the R package 20. Francis, C. D., Ortega, C. P. & Cruz, A. Noise pollution filters bird
nlme57, and accounted for error in the response variable with a fixed-variance communities based on vocal frequency. PLoS ONE 6, e27052 (2011).
weighting function of one divided by the square root of the standard error of the 21. Halfwerk, W. & Slabbekoorn, H. Pollution going multimodal: the complex
response estimate58,59. We accounted for phylogenetic structure by estimating impact of the human-altered sensory environment on animal perception and
Pagel’s λ60. When λ estimates fell outside of the zero to 1 range, we fixed λ at the performance. Biol. Lett. 11, 20141051 (2015).
nearest boundary. For bird models, we used a pruned consensus tree from a recent 22. Bunkley, J. P., McClure, C. J. W., Kleist, N. J., Francis, C. D. & Barber, J. R.
class-wide phylogeny61. For bats, we used a pruned mammalian tree62. We used Anthropogenic noise alters bat activity levels and echolocation calls. Glob.
initial global models with all traits as variables that explained the responses to Ecol. Conserv. 3, 62–71 (2015).
sound pressure level (SPL; birds and bats), spectral overlap with birdsong (birds), 23. Koay, G., Heffner, H. E. & Heffner, R. S. Audiogram of the big brown bat
background frequency (bats), and the interaction between SPL and each measure of (Eptesicus fuscus). Hearing Res. 105, 202–210 (1997).
frequency (birds and bats). We then used AIC model selection63 to choose top 24. Houston, R. D., Boonman, A. M. & Jones, G. Do echolocation signal parameters
models in explaining these patterns. Models with dAIC ≤4 are included in Table S3 restrict bats’ choice of prey. Echolocation bats dolphins 339, 345 (2004).
(birds) and Table S8 (bats), and the top model is interpreted in the main text. 25. Goerlitz, H. R., Greif, S. & Siemers, B. M. Cues for acoustic detection of prey:
insect rustling sounds and the influence of walking substrate. J. Exp. Biol. 211,
Reporting summary. Further information on research design is available in the Nature 2799–2806 (2008).
Research Reporting Summary linked to this article. 26. Lazure, L. & Fenton, M. B. High duty cycle echolocation and prey detection by
bats. J. Exp. Biol. 214, 1131–1137 (2011).
27. Dudley, R. The Biomechanics of Insect Flight: Form, Function, Evolution.
Data availability (Princeton University Press, 2002).
All source data are provided with this paper at Dryad Data Repository (https://doi.org/ 28. Ortega, C. P. & Francis, C. D. Chapter 7: Effects of gas-well-compressor noise
10.5061/dryad.n5tb2rbsv). on the ability to detect birds during surveys in northwest New Mexico.
Ornithol. Monogr. 74, 78–90 (2012).
Code availability 29. Pacifici, K., Simons, T. R. & Pollock, K. H. Effects of vegetation and
All code and materials used in the analysis are available as a fully-reproducible workflow background noise on the detection process in auditory avian point-count
from Dryad Data Repository (https://doi.org/10.5061/dryad.n5tb2rbsv). surveys. Auk 125, 600–607 (2008).
30. Roslin, T. et al. Higher predation risk for insect prey at low latitudes and
elevations. Science 356, 742–744 (2017).
Received: 30 October 2020; Accepted: 25 February 2021; 31. Hu, Y. & Cardoso, G. C. Are bird species that vocalize at higher frequencies
preadapted to inhabit noisy urban areas? Behav. Ecol. 20, 1268–1273 (2009).
32. Cardoso, G. C. Nesting and acoustic ecology, but not phylogeny, influence
passerine urban tolerance. Glob. change Biol. 20, 803–810 (2014).
33. Ogawa, K. & Sato, H. Relationship between male acoustic response and female
wingbeat frequency in a chironomid midge, Chironomus yoshimatsui
References (Diptera: Chironomidae). Med. Entomol. Zool. 44, 355–360 (1993).
1. Geipel, I., Smeekes, M. J., Halfwerk, W. & Page, R. A. Noise as an 34. Barclay, R. M. Population structure of temperate zone insectivorous bats in relation
informational cue for decision-making: the sound of rain delays bat to foraging behaviour and energy demand. J. Anim. Ecol. 60, 165–178 (1991).
emergence. J. Exp. Biol. 222, jeb192005 (2019). 35. Acoustics, W. Wildlife Acoustics—Bioacoustics Monitoring Systems for bats,
2. Giurfa, M., Nunez, J., Chittka, L. & Menzel, R. Colour preferences of flower- birds, frogs, whales, dolphins and many other species. (2018).
naive honeybees. J. Comp. Physiol. A 177, 247–259 (1995). 36. Ratcliffe, J. M., Fenton, M. B. & Shettleworth, S. J. Behavioral flexibility
3. Clarke, D., Whitney, H., Sutton, G. & Robert, D. Detection and learning of positively correlated with relative brain volume in predatory bats. Brain.
floral electric fields by bumblebees. Science 340, 66–69 (2013). Behav. Evol. 67, 165–176 (2006).
4. von Uexküll, J. Umwelt und innenwelt der tiere (Springer, 1909). 37. Gordon, R. et al. Molecular diet analysis finds an insectivorous desert bat
5. Bradbury, J. W. & Vehrencamp, S. L. Principles of animal communication community dominated by resource sharing despite diverse echolocation and
(1998). foraging strategies. Ecol. Evol. 9, 3117–3129 (2019).
6. Dominoni, D. M. et al. Why conservation biology can benefit from sensory 38. Kunz, T. H. Lasionycteris noctivagans. Mammalian Species 1–5 (1982).
ecology. Nat. Ecol. Evol. 4, 502–511 (2020). 39. Barclay, R. M. Long-versus short-range foraging strategies of hoary (Lasiurus
7. Swaddle, J. P. et al. A framework to assess evolutionary responses to cinereus) and silver-haired (Lasionycteris noctivagans) bats and the
anthropogenic light and sound. Trends Ecol. evolution 30, 550–560 (2015). consequences for prey selection. Can. J. Zool. 63, 2507–2515 (1985).
8. Kight, C. R. & Swaddle, J. P. How and why environmental noise impacts 40. Faure, P. A. & Barclay, R. M. R. Substrate-gleaning versus aerial-hawking:
animals: an integrative, mechanistic review. Ecol. Lett. 14, 1052–1061 plasticity in the foraging and echolocation behaviour of the long-eared bat.
(2011). Myotis evotis. J. Comp. Physiol. A 174, 651–660 (1994).
9. Barber, J. R., Crooks, K. R. & Fristrup, K. M. The costs of chronic noise 41. Ratcliffe, J. M. & Dawson, J. W. Behavioural flexibility: the little brown bat,
exposure for terrestrial organisms. Trends Ecol. evolution 25, 180–189 (2010). Myotis lucifugus, and the northern long-eared bat, M. septentrionalis, both
10. Francis, C. D. & Barber, J. R. A framework for understanding noise impacts on glean and hawk prey. Anim. Behav. 66, 847–856 (2003).
wildlife: an urgent conservation priority. Front. Ecol. Environ. 11, 305–313 42. Jung, K. & Kalko, E. K. Where forest meets urbanization: foraging plasticity of
(2013). aerial insectivorous bats in an anthropogenically altered environment. J.
11. Gomes, D. G. E., Francis, C. D. & Barber, J. R. Using past to understand Mammal. 91, 144–153 (2010).
present: coping with natural and anthropogenic noise. BioScience biaa161, 43. Denzinger, A., Tschapka, M. & Schnitzler, H.-U. The role of echolocation
1–12 (2021). strategies for niche differentiation in bats. Can. J. Zool. 96, 171–181 (2018).
12. Goutte, S., Dubois, A. & Legendre, F. The importance of ambient sound level 44. Levenhagen, M. J. et al. Ecosystem services enhanced through soundscape
to characterise anuran habitat. PLoS ONE 8, e78020 (2013). management link people and wildlife. People and Nature 3, 176–189 (2020).
13. Gomes, D. G. E., Hesselberg, T. & Barber, J. R. Phantom river noise alters orb- 45. Gomes, D. G. E. A guide to analyzing spectral information from large sound
weaving spider abundance, web size, and prey capture. Funct. Ecol. 35, files (with R and ffmpeg) (2020).
717–726 (2020). 46. Ligges, U. tuneR–analysis of music (2013).
14. Gordon, T. A. et al. Acoustic enrichment can enhance fish community 47. Sueur, J., Aubin, T. & Simonis, C. Seewave, a free modular tool for sound
development on degraded coral reef habitat. Nat. Commun. 10, 1–7 (2019). analysis and synthesis. Bioacoustics 18, 213–226 (2008).
15. Zhao, L. et al. Sometimes noise is beneficial: stream noise informs vocal 48. R Core Team. R: A language and environment for statistical computing.
communication in the little torrent frog Amolops torrentis. J. Ethol. 35, Vienna, Austria: R Foundation for Statistical Computing; 2016 (2017).
259–267 (2017). 49. Bates, D. M. lme4: Mixed-effects modeling with R (Berlin, 2010).
16. Francis, C. D. Vocal traits and diet explain avian sensitivities to anthropogenic 50. Bates, D. et al. Package ‘lme4’. R Package Version 1.1-26 (2012).
noise. Glob. Change Biol. 21, 1809–1820 (2015). 51. Magnusson, A. et al. Package ‘glmmTMB’. R Package Version 0.2. 0 (2017).
17. Schaub, A., Ostwald, J. & Siemers, B. M. Foraging bats avoid noise. J. Exp. Biol. 52. Lüdecke, D., Makowski, D., Waggoner, P. & Patil, I. performance: assessment
211, 3174–3180 (2008). of regression models performance. R package version 0.4. 0 (2019).
NATURE COMMUNICATIONS | (2021)12:3029 | https://doi.org/10.1038/s41467-021-22390-y | www.nature.com/naturecommunications 7ARTICLE NATURE COMMUNICATIONS | https://doi.org/10.1038/s41467-021-22390-y
53. Hartig, F. DHARMa: residual diagnostics for hierarchical (multi-level/mixed) experiments. J.R.B. supervised implementation of the experiment. D.G.E.G. coor-
regression models. R package. (2019). dinated and led the field team. D.G.E.G. and C.A.T. processed sound files. D.G.E.G.,
54. Harrison, X. A. et al. A brief introduction to mixed effects modelling and C.A.T., and H.J.C. collected data. C.A.T. and H.J.C. processed acoustic monitoring
multi-model inference in ecology. PeerJ 6, e4794 (2018). data. All authors interpreted data. D.G.E.G. led data analysis. C.D.F. and J.R.B.
55. Silk, M. J., Harrison, X. A. & Hodgson, D. J. Perils and pitfalls of mixed-effects contributed to data analysis. D.G.E.G. and J.R.B. drafted the initial manuscript.
regression models in biology. PeerJ 8, e9522 (2020). D.G.E.G., C.A.T., C.D.F., and J.R.B. critically revised the manuscript. All authors
56. Gomes, D. G., Appel, G. & Barber, J. R. Time of night and moonlight structure approved of the final version of the manuscript.
vertical space use by insectivorous bats in a Neotropical rainforest: an acoustic
monitoring study. PeerJ 8, e10591 (2020).
57. Pinheiro, J., Bates, D., DebRoy, S., Sarkar, D. & Team, R. C. nlme: Linear and
Competing interests
The authors declare no competing interests.
nonlinear mixed effects models. R. package version 3, 111 (2013).
58. Ives, A. R., Midford, P. E. & Garland, T. Jr Within-species variation and
measurement error in phylogenetic comparative methods. Syst. Biol. 56, Additional information
252–270 (2007). Supplementary information The online version contains supplementary material
59. Garamszegi, L. Z. in Modern Phylogenetic Comparative Methods and their available at https://doi.org/10.1038/s41467-021-22390-y.
Application in Evolutionary Biology 157–199 (Springer, 2014).
60. Revell, L. J. Phylogenetic signal and linear regression on species data. Methods Correspondence and requests for materials should be addressed to D.G.E.G. or J.R.B.
Ecol. Evolution 1, 319–329 (2010).
61. Jetz, W., Thomas, G. H., Joy, J. B., Hartmann, K. & Mooers, A. O. The global Peer review information Nature Communications thanks Arjan Boonman and the other,
diversity of birds in space and time. Nature 491, 444–448 (2012). anonymous, reviewer(s) for their contribution to the peer review of this work. Peer
62. Upham, N. S., Esselstyn, J. A. & Jetz, W. Inferring the mammal tree: species- reviewer reports are available.
level sets of phylogenies for questions in ecology, evolution, and conservation.
PLoS Biol. 17, e3000494 (2019). Reprints and permission information is available at http://www.nature.com/reprints
63. Burnham, K. P. & Anderson, D. R. Multimodel inference: understanding AIC
and BIC in model selection. Sociol. Methods Res. 33, 261–304 (2004). Publisher’s note Springer Nature remains neutral with regard to jurisdictional claims in
published maps and institutional affiliations.
Acknowledgements
Special thanks to Brian and Kathleen Bean for allowing us access to their land, Lava Lake Open Access This article is licensed under a Creative Commons
Ranch, where this research took place. We thank Elizeth Cinto-Mejia, Krystie Miner, Attribution 4.0 International License, which permits use, sharing,
Will McDonald, Laura Grace Barta, Ben Sweet, Kate Sweet, Nicholas Carlson, Yael adaptation, distribution and reproduction in any medium or format, as long as you give
Lehnardt, William Prum, Christine Petersen, Amanda Emmel, Charlotte Cumberworth,
appropriate credit to the original author(s) and the source, provide a link to the Creative
and Blair Boyt for their help with fieldwork, Juliette Rubin for assistance with detection
Commons license, and indicate if changes were made. The images or other third party
of bat calls in noise, Ian Robertson, Trevor Caughlin, Matt Williamson, and the students
material in this article are included in the article’s Creative Commons license, unless
of EEB 607 for helpful comments on early versions of this manuscript, Kurt Fristrup for
indicated otherwise in a credit line to the material. If material is not included in the
frequent and valuable consultation, and Greg Carr for offering us a quiet place to write
article’s Creative Commons license and your intended use is not permitted by statutory
this paper. We thank NSF for funding (GRFP ID 2018268606 to D.G.E.G., DEB 1556192
regulation or exceeds the permitted use, you will need to obtain permission directly from
to C.D.F., and DEB 1556177 and IOS 1920936 to J.R.B.).
the copyright holder. To view a copy of this license, visit http://creativecommons.org/
licenses/by/4.0/.
Author contributions
J.R.B. and C.D.F. conceived of the overall project design and designed the main
© The Author(s) 2021
experiments. J.R.B., D.G.E.G., and C.A.T. designed the bird and bat foraging
8 NATURE COMMUNICATIONS | (2021)12:3029 | https://doi.org/10.1038/s41467-021-22390-y | www.nature.com/naturecommunicationsYou can also read