Critical Repetition Rates for Perceptual Segregation of Time-Varying Auditory, Visual and Vibrotactile Stimulation
←
→
Page content transcription
If your browser does not render page correctly, please read the page content below
Timing & Time Perception (2021) DOI: 10.1163/22134468-bja10043

    Critical Repetition Rates for Perceptual Segregation of
  Time-Varying Auditory, Visual and Vibrotactile Stimulation

             Carlos Jurado1,*, Marcelo Larrea1,**, David Rosero1, Juan Vizuete1,*** and
                                     Torsten Marquardt2,****
       1
         Escuela de Ingeniería en Sonido y Acústica, Universidad de Las Américas, Avenue Granados
                                     and Colimes, EC170125, Ecuador
       2
         UCL Ear Institute, University College London, 332 Grays Inn Road, London, WC1X 8EE, UK
                                  Received 14 April 2021; accepted 21 July 2021

Abstract
What sound quality has led to exclude infrasound from sound in the conventional hearing range? We
examined whether temporal segregation of pressure pulses is a distinctive property and evaluated
this perceptual limit via an adaptive psychophysical procedure for pure tones and carriers of differ-
ent envelopes. Further, to examine across-domain similarity and individual covariation of this limit,
here called the critical segregation rate (CSR), it was also measured for various periodic visual and
vibrotactile stimuli. Results showed that sequential auditory or vibrotactile stimuli separated by at
least ~80‒90 ms (~11‒12-Hz repetition rates), will be perceived as perceptually segregated from one
another. While this limit did not statistically differ between these two modalities, it was significantly
lower than the ~150 ms necessary to perceptually segregate successive visual stimuli. For the three
sensory modalities, stimulus periodicity was the main factor determining the CSR, which appar-
ently reflects neural recovery times of the different sensory systems. Among all experimental condi-
tions, significant within- and across-modality individual CSR correlations were observed, despite the
visual CSR (mean: 6.8 Hz) being significantly lower than that of both other modalities. The auditory
CSR was found to be significantly lower than the frequency above which sinusoids start to elicit a
tonal quality (19 Hz; recently published for the same subjects). Returning to our initial question, the
latter suggests that the cessation of tonal quality — not the segregation of pressure fluctuations — is
the perceptual quality that has led to exclude infrasound (sound with frequencies < 20 Hz) from the
conventional hearing range.

  *
    ORCID: 0000-0003-2799-8977
  **
     ORCID: 0000-0002-7026-6926
  ***
      ORCID: 0000-0001-6571-992X
  ****
       To whom correspondence should be addressed. E-mail: t.marquardt@ucl.ac.uk

© Koninklijke Brill NV, Leiden, 2021                                                           DOI: 10.1163/22134468-bja10043
This is an open access article distributed under the terms of the cc by 4.0 license.
                                                                                       Downloaded from Brill.com10/07/2021 11:39:20AM
                                                                                                                        via free access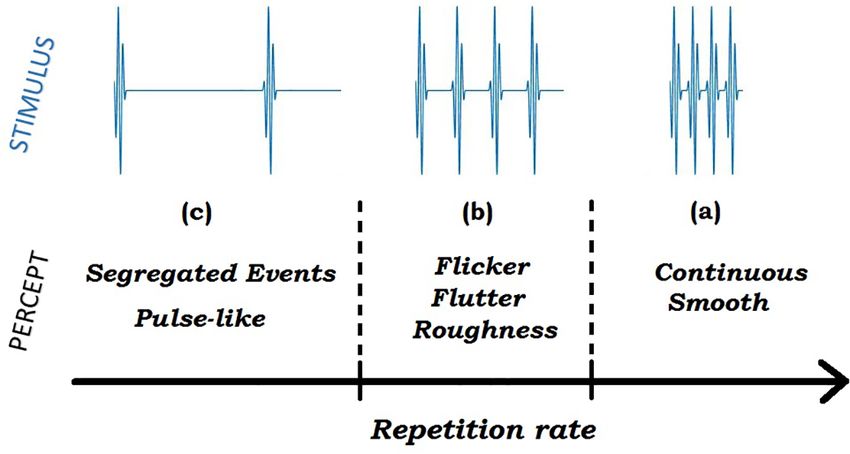
2                            C. Jurado et al. / Timing & Time Perception (2021)

Keywords
Temporal processing, temporal segregation, perception, sensory modality, auditory, visual, vibrotac-
tile, infrasound

1. Introduction
Although humans are able to hear sounds with frequencies well down to a few
Hertz, the frequency range of hearing is often — misleadingly — reported to span
20 Hz‒20 kHz (for a review, see Møller & Pedersen, 2004). Sounds with frequen-
cies < 20 Hz have even been given their own term, infrasound, to distinguish
them from those in the higher ‘audible’ or ‘audio’ range. Although infrasound has
become a useful label, it is not quite clear what perceptual sound quality or com-
bination of them has led to exclude it from the conventional hearing range. On
the one hand, it has been reported that for repetition rates below about 20 Hz,
the sensation of pitch ceases (Guttman & Pruzansky, 1962; Warren & Bashford,
1981). On the other hand, reports have also described infrasound as having a ‘dis-
continuous’ perceptual quality (Jurado et al., 2020; Møller & Pedersen, 2004).
This notion of perceptual segregation at low repetition rates is shared among dif-
ferent sensory modalities. For example, if motion picture frames are presented too
slowly, the illusion of continuity/flow is broken. With the initial aim of identify-
ing whether perceptual discontinuity is a key quality that sets infrasound apart
from the conventional hearing range, we determined the upper cutoff frequency
of this perceptual quality for a group of subjects using pure tones, and compared
it to that for amplitude-modulated auditory stimuli. In addition, we determined
this frequency limit also for various visual and vibrotactile stimuli, to examine its
crossmodal similarity as well as across-domain individual correlations.
    In common for the abovementioned sensory systems, as the frequency of a
periodic stimulus is decreased, its perceived quality changes from (a) continu-
ous to that of (b) flicker/flutter, and at very low rates (c) separate repeating pulses
(i.e., single periods) can be clearly distinguished from one another and even be
counted; i.e., they will be perceived as segregated events (see Fig. 1). Much work
(see below) has been done on vision, auditory and to some extent somatosensory
perception to describe the transition between (a) and (b), a limit that has been
called the critical flicker-fusion frequency (CFF) in vision and which demarks the
upper limit of roughness/flutter perception in audition and somatosensation. In
contrast, relatively little focus has been given to the transition between (b) and
(c), a demarcation which will be referred to in this work as the critical segregation
rate (CSR). It is defined as the repetition rate below which the pulses constitut-
ing a periodic stimulus can be segregated as separate perceptual events. In other
words, below the CSR, each stimulus period will lead to a sensory event perceived
as clearly separated from the previous and the next one. Above this limit, even
though a flicker/flutter/roughness quality will be perceived, periodic pulses will

                                                                   Downloaded from Brill.com10/07/2021 11:39:20AM
                                                                                                    via free access
Timing & Time Perception (2021) DOI: 10.1163/22134468-bja10043 3
Figure 1. Perceived qualities of a periodic stimulus (see contextual waveforms) as function of rep-
etition rate.
appear to be merged into one long stimulus. Surprisingly, although such a limit for
temporal-event segregation might reflect key temporal-processing properties of
perception, to the authors’ knowledge no study has evaluated the CSR systemati-
cally and in more than one sensory modality.
In the auditory domain, amplitude-modulated sounds that fluctuate at fre-
quencies between about 15 to 300 Hz are perceived to have a roughness quality
(e.g. see Fastl & Zwicker, 2007, Chapter 11). While this quality disappears above
~300 Hz, for modulation frequencies reportedly below 12–20 Hz, the percep-
tual quality changes to that of fluctuation strength, i.e., the sound envelope can
be tracked (Daniel, 2008; Fastl & Zwicker, 2007, Chapter 10). Although this sen-
sation has a maximum at around 4 Hz (which is in remarkable match with the
typical syllable rate of speech produced at a normal pace), this perceptual quality
has been broadly attributed to modulations below 20 Hz (Fastl, 1983). We are,
however, not aware of a specific study that measured the modulation frequency at
which the percept of fluctuation strength transitions into a percept of roughness.
At least for pure tones of very low frequency, it has been reported informally that
below about 10 Hz, sound cycles can be perceived as ‘distinct pressure pulses’ and
even be counted (Jurado et al., 2020; Møller & Pedersen, 2004). This agrees with
early results by Lechelt (1975), who showed that a series of short sound clicks
presented at low repetition rates (their highest rate was 8 Hz) can be counted with
accuracy.
Also in somatosensory perception, varying the repetition rate of vibrotactile
stimuli can lead to different perceptual qualities. Above modulation frequencies
of ~100 Hz, vibrotactile stimuli are perceived as smooth while between about 10
to 50‒80 Hz these adopt a flutter quality (Hwang & Choi, 2010; Park & Choi, 2011;
Tan, 1996; Tan et al., 1999). For modulation frequencies ≤ 10 Hz, Park and Choi
Downloaded from Brill.com10/07/2021 11:39:20AM
via free access4 C. Jurado et al. / Timing & Time Perception (2021)
(2011) found that amplitude-modulated vibrotactile stimulation (150-Hz carrier)
produced instead a marked ‘pulse-like sensation’, which became less discernible
above 10 Hz. We are, however, unaware of more systematic somatosensory studies
of the CSR.
In vision, the CFF has been commonly used to evaluate the temporal resolu-
tion of the visual system and it is thought to reflect limitations in the encoding
of time-varying luminance levels (Eisen-Enosh et al., 2017; Lakshminarayanan,
2012). While the CFF has been found to depend on several parameters (such as
stimulus luminance, visual angle, light adaptation and age), typical reported val-
ues range ~30‒50 Hz (Lakshminarayanan, 2012). In other words, if the peaks of a
modulated light are separated by less than 20 ms, it will be indistinguishable from
an unmodulated light. Although intensity modulations below 50 Hz can lead to
the perception of flicker, successive modulation periods are not necessarily dis-
tinguished from one another as clearly separate/segregated visual events (Fig. 1).
We are, however, unaware of systematic studies of the transition frequency to this
perceptual quality for visual stimuli. At least for modulation frequencies below ~8
Hz, it has been found that single fluctuations in light intensity can be followed and
numerosity studies have shown that fluctuation periods (i.e., single light flashes)
can be counted (Lechelt, 1975; Philippi et al., 2008; albeit with a tendency to
underestimate their number unless the repetition rate is lower than ~3 Hz). Other
tasks that at least partly depend on the visual system’s temporal resolution, such
as synchrony and binding judgements for visual pulse trains, have found a tempo-
ral limit of 5‒9 Hz (Fujisaki & Nishida, 2010; see their result for within-attribute
conditions).
In this work we evaluated the CSR, i.e., the transition frequency from the per-
ception of segregated events to that of roughness/flicker/flutter, via an adaptive
psychophysical procedure by asking subjects directly (and after each stimulus pre-
sentation) as to whether its series of periodic pulses were perceived as segregated
or not. Periodic auditory, vibrotactile and visual stimuli were applied on a com-
mon subject group (n = 10). This allowed direct comparison of the CSR among
the three sensory modalities, as well as to evaluate individual correlations across
modalities.
2. Material and Methods
2.1. General Experiment Outline
Applying different types of periodic stimuli, temporal resolution was measured
in human subjects for three sensory modalities: auditory, vibrotactile and visual.
The target psychophysical parameter was the CSR. To track this limit, in the
procedure described below the stimulus repetition rate was varied. This corre-
sponded either to the frequency of sinusoidal waves, fundamental frequency of
Downloaded from Brill.com10/07/2021 11:39:20AM
via free accessTiming & Time Perception (2021) DOI: 10.1163/22134468-bja10043 5
square waves, the modulation frequency of sinusoidally amplitude-modulated
(SAM) carriers, or the repetition rate of sinusoidal bursts. Figure 2 illustrates
the stimuli used for each modality. For all conditions, the upper repetition rate
of the stimulus was limited to 40 Hz, excepting the CFF measurements where it
was increased to 65 Hz. All stimuli were 3000-ms long and are detailed below
for each sensory modality.
The psychophysical tests were split into two sessions on different days: a train-
ing and a data-collection session. Each lasted ~2 ½ to 3 h, including breaks after
every ~10 min of measurements and longer breaks between modalities. The
data-collection session took place no more than three days after the training ses-
sion. Measurements started with the visual tests, as instructions were more easily
understood for this modality. They continued with the auditory tests (for practical
reasons, as both of these tests were run in the audiometric cabin; see apparatus),
and ended with the vibrotactile tests. Within a given sensory modality, the order
of stimuli was randomized. Experiments were approved by the ethical committee
of Universidad de Las Américas (approval code 2020-0626).
Auditory Vibrotactile
1 1
Normalized amplitude
(a) (d)
0.5 Aud-Sin 0.5 Vib-Sin
0 0
-0.5 -0.5
-1 -1
0 0.05 0.1 0.15 0.2 0 0.05 0.1 0.15 0.2
Time (s)
(b) Visual
1 1
Normalized amplitude
Normalized amplitude
SAM-125 (f)
SAM-1000
0.5 Vis-Sin
0 0.5
-0.5
-1 0
0 0.05 0.1 0.15 0.2 0 0.05 0.1 0.15 0.2
1 1 1
Normalized amplitude
(c) (e) (g)
0.5 Pip-125 0.5 Vib-Sq Vis-Sq
Pip-1000
0 0 0.5
-0.5 -0.5
-1 -1 0
0 0.05 0.1 0.15 0.2 0 0.05 0.1 0.15 0.2 0 0.05 0.1 0.15 0.2
Time (s) Time (s) Time (s)
Figure 2. Waveforms of the different stimuli used in each modality: (a) Auditory-sinusoidal (b)
Auditory-SAM (c) Sequence of auditory tone-pips (d) Vibrotactile-sinusoidal (e) Vibrotactile-square
(f) Visual-sinusoidal modulation. For ease in visualization, the fine structure of the pulse-width
modulation applied in the Arduino microcontroller has been omitted. (g) Visual-square modulation.
Abbreviations shown in the panels are the same as those used in Fig. 3. For illustration purposes, all
amplitudes were normalized and all stimuli have a 10-Hz repetition rate (two cycles are shown).
SAM, sinusoidally amplitude-modulated.
Downloaded from Brill.com10/07/2021 11:39:20AM
via free access6 C. Jurado et al. / Timing & Time Perception (2021)
2.2. Procedure
An adaptive one-up one-down, one-interval two-alternative-forced choice (1i-2-
AFC) procedure was used, which started after the subject pressed any of the two
pushbuttons on a response box. The procedure started with the highest frequency
of 40 Hz, based on pilot tests that showed that this frequency was well above the
CSRs of all modalities. Subjects were instructed to evaluate if periodic pulses form-
ing the stimulus were perceived as segregated or not. If not, they pressed the left
button (which led to a frequency decrease), while if pulses were perceived as seg-
regated, they pressed the right button (which led to a frequency increase). In this
manner, they crossed their CSR in both directions. This was done with decreasing
step sizes (see below) as the run progressed. As general guidance, subjects were
instructed to “think if they would be able to count” the periodic stimulus pulses.
However, they were not instructed to count them (see Note 1). In a training ses-
sion, subjects familiarized themselves with the different stimulus qualities in the
range of repetition rates used.
A 6-Hz step size was used at the beginning, which decreased to 3 Hz after
two reversals. After two more reversals, the step size was reduced to 1 Hz and
remained there. After eight reversals with the latter step size were completed, the
procedure stopped. The CSR for a given run was obtained from averaging the last
six reversal frequencies. At least two runs per condition were measured. If their
result differed by more than Δ (Hz), an additional run was performed. The CSR of
the corresponding condition was obtained from averaging the CSRs from the two
or three runs. The value of Δ was determined in the following manner: First, the
absolute differences between first- and second-run CSR estimates were obtained
from all available data up to that point in the experiment. (For the first subjects,
differences were based on pilot data.) To identify outliers in the distribution of
differences (denoting low reproducibility), the value of Δ corresponded to the
third quartile (Q3) plus 1.5 interquartile ranges (Tukey, 1977). This estimate was
updated as the experiment progressed and defined per sensory modality. By the
end of the experiment, Δ was 2.4, 2.5, and 2.1 Hz for the auditory, vibrotactile and
visual tests, respectively.
The procedure was implemented in MATLAB (The MathWorks, Inc., Natick,
MA, USA), where responses as well as in-situ calibration levels were monitored
(see below).
2.3. Critical Segregation Rate for Periodic Auditory Stimuli
The auditory CSR was measured for pure tones, SAM tones, and sequences of tone-
pips. Peak amplitudes of all sound stimuli were equivalent to the peak amplitude
of a 65-phon pure tone (according to Møller and Pedersen, 2004, for frequencies
< 20 Hz and according to ISO-226, 2003, otherwise). In total, five sound-stimuli
conditions were tested per subject, in random order.
Downloaded from Brill.com10/07/2021 11:39:20AM
via free accessTiming & Time Perception (2021) DOI: 10.1163/22134468-bja10043 7
2.3.1. Stimuli
Pure tones. Their 3000-ms duration included 200-ms cosine-squared ramps at
start and end. To maintain the desired loudness level during measurements, the
pure-tone levels were updated each time their frequency was varied (accord-
ing to Møller & Pedersen, 2004, below 20 Hz, and according to ISO-226, 2003,
otherwise).
SAM tones. These had a 100% modulation depth and carrier frequencies of
125 Hz and 1000 Hz were used.
Tone-pip trains. Each tone pip was a 24-ms Hanning-windowed sinusoid of
either 125 Hz or 1000 Hz.
The auditory stimuli are illustrated in the leftmost column of Fig. 2.
2.3.2. Apparatus
Digital signals were created in MATLAB, and sent to a Fireface-802 audio inter-
face (RME Audio AG, Haimhausen, Germany) for D/A conversion (24-bit, 48 kHz
sampling frequency). The higher frequency stimuli (SAM tones and tone-pip
trains) were generated by one of the two miniature transducers of an ER10C mea-
surement system (Etymotics Research Inc., Elk Grove Village, IL, USA) that was
connected directly to a line output of the audio interface. The pure tones (≤40
Hz) were produced by a DA270-8 10-inch aluminium-cone subwoofer (Dayton
Audio, Springboro, OH, USA), driven directly by a headphone output of the audio
interface. The speaker cone was enclosed tightly by an acrylic cover to enhance its
low-frequency response (see e.g. a similar setup by Kühler et al., 2015). A narrow
silicone tube (0.8 m in length, ~0.7 mm inner diameter) was inserted in a small
opening of this cover and at the other end went through a piercing of the ER10C
earplug (Etymotic 14A, B or C depending on ear-canal size), tightly fitted in the
subject’s right ear. Experiments took place in an audiometric cabin, placed inside
a double-walled sound-isolated room of the Acoustics Laboratory at Universidad
de Las Américas.
2.3.3. Calibration
First, the transfer function of the ER10C microphone and receiver, as well as that
of the sound source for the pure tones, were measured. This was done using a
GRAS (Holte, Denmark) 46AZ ½-inch microphone set, connected to the audio
interface. A 1.3 cm3 calibration cavity was used for this purpose and white noise
(20 s) was used as measurement signal. The latter was split into fifty 400-ms long
buffers, later averaged to improve the SNR. Responses were defined on an absolute
sound pressure level (SPL) scale from recording a reference sound-calibrator sig-
nal [CESVA (Barcelona, Spain) CB006; 1000 Hz at 94 dB SPL].
Second, during the tests, in-situ responses of all sound sources were measured
in the subject’s ear at the beginning and subsequently after every other mea-
surement (run) with the ER10C microphone. This allowed to compensate for
Downloaded from Brill.com10/07/2021 11:39:20AM
via free access8 C. Jurado et al. / Timing & Time Perception (2021)
differences in sound pressure gain between the calibration cavity and the ear (and
thus considered the SPL changes produced by different ear-canal volumes or pos-
sible earplug leaks). More details of these procedures are given in Jurado et al.
(2017).
2.4. Critical Segregation Rate for Periodic Vibrotactile Stimuli
In this part of the experiment, subjects sat in a comfortable armchair (outside the
cabin used for the auditory and visual tests) and had their right-hand index fin-
ger placed above a subwoofer’s aluminium membrane (Prestige-L26RFX, 10-inch;
SEAS, Oslo, Norway; driven directly by a headphone output of the Fireface-802
audio device), that was mounted in a 0.35-m2 cabinet and placed ~30 cm below
their shoulder. The two-pushbutton response box was fixed at a comfortable posi-
tion so that they used their left hand to give their responses.
In order to maintain contact with the membrane, a double-sided tape was fixed
to the speaker membrane (the only point of contact with the subject), at the posi-
tion where the subject placed their index finger. To focus only on vibrotactile cues
from the speaker displacement while avoiding auditory cues, the subject listened
to white noise via headphones while the test was running. To prevent visual dis-
traction, the subject’s eyes were covered by a sleeping mask. To indicate that a run
had finished, a series of seven vibrotactile square-wave pulses at a rate of 1 Hz
were applied following their last response in a run.
Two stimulus types were used: (a) sinusoids and (b) square waves (Note 2) (Fig.
2d, e). The membrane displacement was approximately frequency-independent
in the relevant range of the procedure (3‒40 Hz), presenting for both stimulus
types an average peak value of ~0.4 ±0.05 (SD) mm (measured with a type 352c34
accelerometer connected to a NTI-XL2 vibrometer (NTi Audio, Tigard, OR, USA);
the accelerometer was fixed with wax at the position where the finger was placed).
2.5. Critical Segregation Rate for Periodic Visual Stimuli
Visual CSRs were measured in a binocular condition. A green light-emitting diode
(LED; through-hole, diffuse, 5-mm size, wavelength: 565 nm, 4 mcd), controlled
with an Arduino UNO (Arduino, Somerville, MA, USA) microcontroller was used.
Subjects sat facing the LED, inside the audiometric cabin. The LED’s height was
adjusted with a holder to be in front of the glabella (~0° angle), with a distance
between LED and glabella of ~0.5 m. At this distance, the 5-mm LED has a visual
angle of ~0.6°. Responses were delivered using two pushbuttons in a response
box. In the experiment, light intensity was varied at a frequency according to the
procedure described above. Two types of light intensity modulation were used
(a) sinusoidal and (b) square-wave. In (a), the pulse-width modulation feature
of Arduino (analogWrite function, which uses an 8-bit resolution and a 490-Hz
update frequency) was used to approximate a sinusoidal waveform. The light
started (and ended) at a modulation minimum and a 100% modulation depth
Downloaded from Brill.com10/07/2021 11:39:20AM
via free accessTiming & Time Perception (2021) DOI: 10.1163/22134468-bja10043 9
was used (Fig. 2f). In (b), intensity modulation was achieved by turning the LED’s
voltage (using the digitalWrite function of Arduino) on during half of the cycle and
off during the other half (Fig. 2g). The Arduino microcontroller was controlled by
MATLAB, which also was used to record the subject’s responses. Timing accuracy
of the electrical signal was verified with an oscilloscope. Gamma calibration of the
LED was not performed.
Although pilot tests by two subjects with room lights switched on did not reveal
an effect of lighting conditions, the task was deemed easier with the room lights
off. Thus, the lights of the audiometric cabin and external laboratory room were
turned off and there was only minor background illumination produced by the
control-PC screen (outside the cabin and facing in the opposite direction).
Control tests were performed to assess possible effects of the stimulus’ lumi-
nous intensity on the visual CSR. Besides the original 4-mcd LED, same-size and
colour LEDs of 1000 mcd and 16,000 mcd were used. These tests were performed
in a single (and separate) session on a subset of five participants.
An additional control test was performed on four subjects, where the CSR as
well as the CFF were measured on the same day for two conditions: (1) with the
LED at the original distance (~0.5 m, visual angle ~0.6°) and (2) with a distance
between LED and glabella of ~0.25 (m), which produced a visual angle about
twice the original. For the CFF measurement, in a 1i-2-AFC task subjects now had
to decide whether the stimulus was perceived as continuous/smooth or if flicker
was perceived. In case of the former stimulus quality, they pressed the left button
(resulting in a frequency decrease), while they pressed the right button (resulting
in a frequency increase) if flicker was perceived. Other aspects of the method were
the same as described in section 2.2. The control measurements were made with
the square-wave modulation only.
2.6. Subjects
Ten subjects, one female and nine males, aged 25 to 43 years (mean: 34 years) par-
ticipated in the experiments. Subjects had normal tympanometry (ear-canal pres-
sure between −20 and +20 daPA) and normal audiometric thresholds (10 C. Jurado et al. / Timing & Time Perception (2021)
25
Auditory Vibrotactile Visual
20
Critical segregation rate (Hz)
15
10
5
0
SAM-125 SAM-1000 Pip-125 Pip-1000 Aud-Sin Vib-Sin Vib-Sq Vis-Sin Vis-Sq
Stimulus condition
Figure 3. Critical segregation rates for each sensory modality and stimulus condition. Large sym-
bols show mean values, with ± 1-SD error bars. Note that the error bars on the average markers
correspond to the uncertainty range of the procedure, obtained from averaging the SDs of the last
six turnpoint frequencies across all runs and subjects for each stimulus condition. SAM, sinusoidally
amplitude-modulated.
the CSR), averaged across all runs and subjects. They show that the range in which
subjects varied the stimulus frequency around the CSR in the procedure was small
compared to the inter-subject variability in CSR. Individual markers are the same
across all result figures to facilitate observation of individual differences and indi-
vidual CSR correlations (described below).
An overall similarity between the auditory and vibrotactile CSRs is evident,
with mean values per condition spanning only ~10‒13 Hz. Visual CSRs were
instead noticeably lower, being on average well below 8 Hz (Fig. 3, right). A one-
way ANOVA, run on all CSR data with modality (auditory, vibrotactile, or visual) as
factor, showed a highly significant effect of modality (F2,87 = 17.7, p = 3.5 × 10⁻⁷).
While no significant difference between the auditory and vibrotactile CSRs (with
means of 12.0 and 10.8 Hz, respectively) was found from post-hoc multiple com-
parisons (Hochberg & Tamhane, 1987), the same analysis indicated CSRs were
significantly lower for vision (mean: 6.8 Hz) than for the two other modalities.
The similarity among auditory CSRs for the various stimulus conditions (mini-
mum average CSR: 10.5 Hz for 125-Hz SAM; maximum average CSR: 13.3 Hz for
1000-Hz pip train) occurred in spite of their marked differences in spectral con-
tent. Still, according to a two-way ANOVA performed on the modulated stimuli,
with stimulus envelope (sinusoidal or burst) and carrier frequency (125 or 1000
Hz) as factors, the effect of stimulus envelope was significant (F1,36 = 5.4, p =
0.026). Subsequent post-hoc comparisons indicated that the pip trains presented
significantly higher CSRs than the SAM tones. On the other hand, the effect of
Downloaded from Brill.com10/07/2021 11:39:20AM
via free accessTiming & Time Perception (2021) DOI: 10.1163/22134468-bja10043 11
carrier frequency was not significant (F1,36 = 0.11, p = 0.75). No significant differ-
ence was found between the CSRs of both SAM tones and the pure tones, accord-
ing to a one-way ANOVA with stimulus condition as factor (125-Hz SAM, 1000-Hz
SAM, or pure tone; F2,27 = 0.23, p = 0.80).
Mean vibrotactile CSRs were 11.3 (3.9) Hz and 10.3c (3.2) Hz (across-sub-
ject SDs in parentheses) for the sinusoidal and square waveforms, respectively.
According to a one-way ANOVA, they were statistically indistinguishable (F1,18 =
0.40, p = 0.54). As to the visual CSRs, these had mean values of 6.5 (2.5) Hz and
7.1 (2.6) Hz, for sinusoidal and square-wave modulation, respectively. They did
not differ significantly according to a one-way ANOVA (F1,18 = 0.34, p = 0.57).
The control tests on the visual CSR, shown in Fig. 4 for subsets of subjects,
reveal independence on stimulus luminous intensity and stimulus visual angle
(Figs. 4a and b, respectively). The CSRs were on average 6.3, 6.3 and 6.5 Hz, for
55
(a) Luminous intensity (b) Visual angle (c) CFF
50
45
Critical segregation rate / CFF (Hz)
40
35
30
25
20
15 S1
S2
10
S3
S4
5
S5
0
4 mcd 1000 mcd 16000 mcd CSR-V.1 CSR-V.2 CFF-V.1 CFF-V.2
Figure 4. (a) The critical segregation rate (CSR) independence on LED’s luminous intensity as well
as (b) its independence on visual angle (V.1 and V.2: visual angles of ~0.6° and ~1.2°, respectively)
are shown for subsets of subjects (n = 5 and 4, respectively). (c) The critical flicker-fusion frequency
(CFF) was also measured for the two visual-angle conditions, on the same subject group as in (b).
Mean values (large symbols) ± 1 (across-subject) SD are also shown.
Downloaded from Brill.com10/07/2021 11:39:20AM
via free access12 C. Jurado et al. / Timing & Time Perception (2021)
4, 1000, and 16,000 mcd, respectively, and the mean CSR remained practically
unchanged for both visual angles (6.3 Hz).
Regarding the CFFs, it should first be mentioned that subjects had no difficulty
distinguishing between this and the CSR task, determined using the same proce-
dure (i.e., they understood the percepts of flicker and segregated pulses). Besides
their overall values being higher than those of CSR, the CFFs (Fig. 4c) showed their
known increase with enlarging of visual angle (means of 39.9 and 46.3 Hz for V.1
and V.2, respectively; this was significant according to a paired t-test: T = −10.1,
p = 0.002). Note the apparent correlation across individual data within the CSR
and CFF measures (see vertical order of connected individual data within panels),
but not across them [compare e.g. vertical order of individual markers across pan-
els (a) and (c)].
Another sound quality that changes towards infrasonic frequencies is the per-
ception of tonal quality or pitch (Møller & Pedersen, 2004). Recently we measured
the lower-limit of pitch (LLP) for pure tones in our laboratory (Jurado et al., in
press). The method was similar but the task was instead to identify whether sound
presented a ‘tonal/humming’ quality. As the same subject group (Note 3) and stim-
uli were used, it was of interest to compare the LPP with the CSR of pure tones. As
shown in Fig. 5, LLPs (mean: 19.0 Hz) were generally well above CSRs (mean: 11.6
Hz), and the difference was highly significant (F1,18 = 23.3, p = 1.35×10⁻⁴).
30
25
20
Frequency (Hz)
15
10
5
Critical segregation Lower limit of pitch
Target criterion
Figure 5. Comparison between critical segregation rate (CSR) and lower-limit of pitch (LLP)
obtained for 10 subjects using pure tones. (LPP data taken from Jurado et al., in press.) Large symbols
show mean data, with ± 1 (across-subject) SD error bars.
Downloaded from Brill.com10/07/2021 11:39:20AM
via free accessTiming & Time Perception (2021) DOI: 10.1163/22134468-bja10043 13
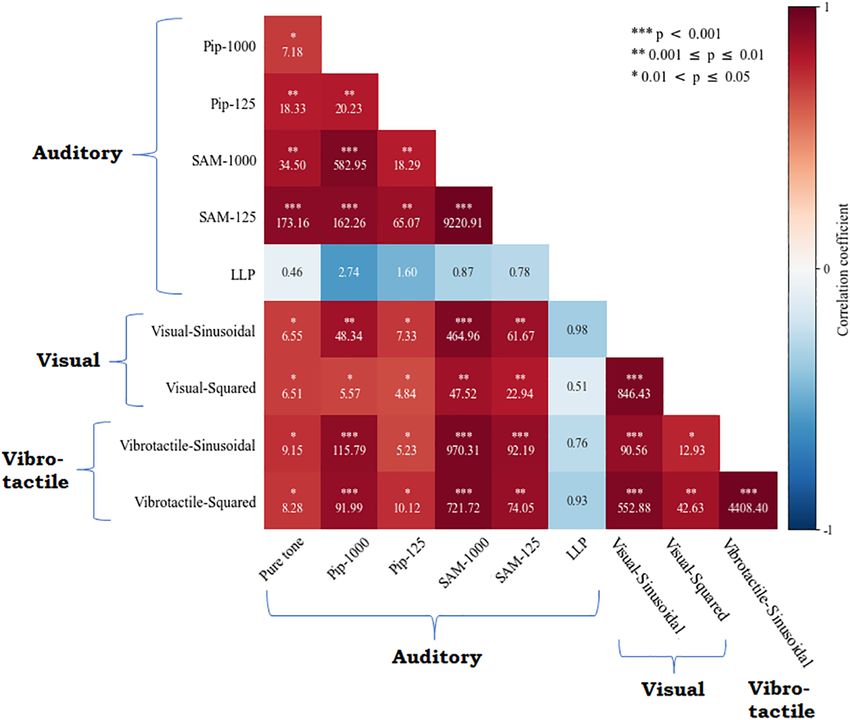
Throughout all CSR results, notable individual correlations are evident within
and across modalities, and even in the additional control tests. For example in
Fig. 3, the subject marked with blue crosses had generally high CSRs through-
out the three sensory modalities, while the subject marked with red downward
triangles had consistently some of the lowest. These systematic positive corre-
lations are illustrated in Fig. 6, as well as their significance level. As shown, all
CSRs — irrespective of sensory domain — presented high correlation coeffi-
cients (on average R = 0.83; minimum: 0.66, maximum: 0.97), and all were sig-
nificant. To assess evidence towards the hypothesis of positive correlation (H1)
versus no correlation between CSRs (H0), the Bayes Factor (BF10) was obtained
(and indicated in each box of Fig. 6). As seen, there is overall substantial evi-
dence supporting positive correlations, with BF10 often >10 or 30 (strong and
very strong evidence, according to Jeffreys, 1961) and even >100 (extreme),
Figure 6. Correlations in critical segregation rate (CSR) across all stimulus conditions (see colour-
map). Correlations with the auditory–lower-limit of pitch (LLP) data for the same subjects are also
shown. (LPP data taken from Jurado et al., in press.) Significance levels (see legend) of the correla-
tions are given with asterisks in each box, as well as the Bayes Factor (BF10). For the CSR pairs, BF10
evaluated the hypothesis of no correlation (H0) against the alternative hypothesis of a positive cor-
relation (H1), while for the LLP, the alternative hypothesis was a negative correlation. SAM, sinusoi-
dally amplitude-modulated.
Downloaded from Brill.com10/07/2021 11:39:20AM
via free access14 C. Jurado et al. / Timing & Time Perception (2021)
with only a few moderate cases (BF10 in the range 3–10). Notably, the visual
CSRs were significantly correlated with those of the auditory and vibrotactile
modalities, in spite of being significantly lower. The LLP provides a notable con-
trast, generally presenting slightly negative values of R. Here, evidence of nega-
tive correlation (H1) was compared against that of no correlation (H0). As shown
in Fig. 6 (see values in boxes), BF10 was for all these cases < 3, indicating that
this can be considered an anecdotal trend in the data, even between LLPs and
auditory CSRs that shared the same sensory modality.
4. Discussion
Critical segregation rates for different types of auditory, vibrotactile and visual
periodic stimuli were measured in this study by directly tracking (with an adap-
tive procedure) the maximum repetition rate at which periodic pulses forming
the stimuli were still perceived as clearly separate from one another. It must first
be mentioned that, regardless of the condition and sensory modality tested, sub-
jects had no difficulty tracking this subjective stimulus quality as evidenced by the
small average SDs of the last six turning-point frequencies (error bars in Fig. 3).
These SDs were relatively similar across modalities and had a maximum value of
only 1.3 Hz. Also, the reproducibility was high, as seen by rather small differences
between the two measurements per condition for each subject, that resulted in an
outlier criterion of less than 2.6 Hz for all three modalities (see section 2.2).
In their now classic review paper on low-frequency hearing, Møller and
Pedersen (2004) described the following changes in perceived sound quality
for tones as their frequency is lowered: “If the frequency is gradually lowered
from 20 Hz, the tonal sensation disappears, the sound becomes discontinuous
in character and it changes into a sensation of pressure at the eardrums. At even
lower frequencies it turns into a sensation of discontinuous, separate puffs, and
it is possible to follow and count the single cycles of the tone.” The observed dif-
ference between our pure-tone auditory CSR and available LLP data allows to
disentangle the loss of pitch/tonal quality and sound discontinuity/segregation as
separate perceptual qualities, each occurring at their own well-differentiated fre-
quency limit. The significantly lower CSR than LLP, the latter just below 20 Hz,
suggests that the loss of tonal quality is the main factor that has led to exclude
infrasound from the conventional hearing range, commonly defined to start
from 20 Hz. The two separate perceptual limits likely reflect different demands
on the auditory system. On the one hand, for effective object/speaker recogni-
tion it must extract the fundamental frequency of sound sources (LLP). On the
other hand, for speech comprehension it must also be able to follow very slow
and mostly non-periodic — but information-bearing — amplitude fluctuations,
such as those produced by vocal tract changes (CSR; see further discussion below
regarding the auditory CSR).
Downloaded from Brill.com10/07/2021 11:39:20AM
via free accessTiming & Time Perception (2021) DOI: 10.1163/22134468-bja10043 15
Results also showed that the ability to temporally resolve sequential pressure
pulses is not unique to infrasound stimulation: CSRs were also measurable in SAM
carriers and tone-pip trains (both with spectral content >100 Hz). While for the
former, CSRs were about the same as for infrasound (perhaps as ‘duty cycles’ are
expected to be similar in the auditory nerve for both stimulus types); for the latter
these were slightly (~ 2 Hz) but systematically higher. This likely reflects the fact
that the shorter duty cycle in the pip train stimuli gives comparatively more time
for loudness to decay; the temporal integration of loudness has been modelled
as an automatic-gain control system (see e.g., Glasberg & Moore, 2002; Moore,
2014), with attack and release/decay response properties.
The CSR does not appear to be a modality-independent perceptual limit, as at
least it differs between vision and the other two modalities. The CSRs observed
for vision are much lower than variations produced by modification of the stim-
ulus conditions within the modalities (e.g., envelope types and luminance; all
producing weak or absent effects). Distortions in luminance modulation due to
the nonlinear relationship between voltage and LED luminance (i.e., harmon-
ics) are unlikely the reason here, as these are only expected to deform the shape
of the luminance modulation function but are not expected to increase the
number of minima within a stimulus period beyond one, like in the case of the
square-wave modulation. The lower visual CSRs are also unlikely due to fatigue
because the visual task was the first in the series of tests and regular breaks were
taken across the whole measurement session. Learning effects were avoided by a
preceding session dedicated to train the subjects in all modalities. The literature
has indeed shown evidence for similarities in temporal perception between the
auditory and somatosensory systems and for their better temporal resolution
than the visual system (Occelli et al., 2011; Philippi et al., 2008; Welch & Warren,
1980). As mentioned in the introduction, also the upper limits for roughness/
flutter perception are higher for both the auditory and somatosensory systems
than that for flicker perception in the visual system. As to the lower end of pulse-
repetition frequencies, also studies of numerosity performance have found
greater similarity between auditory and vibrotactile stimulation, both being
more accurate than performance with visual stimuli (Lechelt, 1975; Philippi et
al., 2008). Also, reaction times to single pulses (respectively a beep and a flash)
have been found to be faster for the auditory than for the visual system (Shelton
& Kumar, 2010). Further, temporal resolution of synchrony–asynchrony percep-
tion is better for audiotactile stimulation than either audiovisual or visuotactile
stimulation (Fujisaki & Nishida, 2009). It has been suggested that this occurs
because performance is constrained by the system with the worse temporal res-
olution, i.e., vision (Fujisaki & Nishida, 2009; Occelli et al., 2011). Further sup-
port for close relations in processing between the auditory and somatosensory
systems comes from the electrophysiological study by Schürmann et al. (2006).
They found that vibrotactile stimulation (fingertip tactile pulses) activates the
Downloaded from Brill.com10/07/2021 11:39:20AM
via free access16 C. Jurado et al. / Timing & Time Perception (2021)
auditory cortex. This is in line with the corresponding similarity in CSR found
here and with informal observations by the authors during the vibrotactile tests:
the meta-conscious perception of the vibrotactile stimuli was deemed similar
to that of sound perception, even though airborne sound cues from the speaker
were masked/absent.
As to our average auditory CSR of 12.0 Hz, it is roughly in line with the upper
limit of fluctuation strength, reported by Fastl and Zwicker (2007, chapter 10). The
latter psychoacoustic quality has a bandpass shape centred around 4 Hz, and was
first broadly associated to modulations below about 20 Hz (Fastl, 1983). However,
more recent reports have placed its upper limit (above which roughness starts to
be perceived) at 12 Hz for SAM sounds (Daniel, 2008), and our results confirm
this value.
Auditory sensitivity to amplitude modulations is often characterized by the
temporal-modulation transfer function (TMF), which has a bandpass filter char-
acteristic with an upper corner frequency at about ~10–16 Hz (Dau et al., 1997;
Chi et al., 1999). Dau et al. (1997) reported that above ~10 Hz, modulation depth
needs to increase at 3 dB/octave to reach perceptual modulation threshold. Also,
spectro-temporal modulations of speech present most power below about 12 Hz
(Elliott & Theunissen, 2009; Varnet et al., 2017), that if removed, significantly dete-
riorate comprehension (Elliott & Theunissen, 2009). It might be that these cutoff
frequencies (well in line with our mean auditory CSR) reflect minimum neural
processing times for the representation of loudness. According to Thwaites et al.
(2015; see their Fig. 4), the encoding of the instantaneous loudness (as defined by
Glasberg & Moore, 2002) in the auditory cortex takes place within ~80–100 ms of
stimulus onset.
Regarding our average vibrotactile CSR of 10.8 Hz, it is fairly in line with results
by Park and Choi (2011), who instead of pure tones or square waves, used an
amplitude-modulated 150-Hz carrier stimulus and identified relevant character-
istics elicited at different modulation frequencies. They found a maximum in ‘pul-
sating sensation’ between 5 and 10 Hz, above which a flutter sensation took place.
Notably, the periodicity of our vibrotactile CSR (~93 ms) is roughly in line with
recovery times (of ~75–100 ms relative to stimulus onset; derived from EEG mea-
surements) that have been measured in the somatosensory cortex using median-
nerve (hand) electrical stimulation by short pulses (Avanzini et al., 2018; see their
Fig. 4B).
Also the periodicity of 147 ms, corresponding to our mean visual CSR (6.8 Hz),
is well in line with the ~150-ms processing times for natural image recognition,
observed in the electrophysiological study of Thorpe et al. (1996). It is also in close
agreement with minimum neural processing times of ~150 ms for motion and
colour perception, observed electrophysiologically by Amano et al. (2006). Visual
evoked potentials in response to periodic stimuli presented at rates above 8–10
Hz (100–125 ms period) are known to overlap (Norcia et al., 2015). These time
Downloaded from Brill.com10/07/2021 11:39:20AM
via free accessTiming & Time Perception (2021) DOI: 10.1163/22134468-bja10043 17
scales might be at least partly explained by cone recovery times of at least 120 ms
that have been measured using in-vivo human electroretinograms (e.g., see Fig. 2
in van Hateren & Lamb, 2006). One might expect that sequential periodic pulses
of any modality will be perceived as segregated if the neural response of each pre-
ceding pulse has sufficiently decayed.
Regarding the significant within- and across-domain (CSR) correlations
observed in the present study, these are in line with recent findings (e.g., in
vision: Samaha and Postle, 2017; across domains: Beck et al., 2019; Rouault et
al., 2018). When the target criterion was changed, as was the case in the auditory
LLP task and the visual CFF task, no significant correlations with the respec-
tive CSRs were found, even though they shared the same sensory modality. As
pointed out in the abovementioned studies, such task-specific and crossmo-
dal correlations might stem from individual metacognitive factors. Associated
‘response biases’ are more prone to affect our one-interval AFC paradigm com-
pared to less subjective, two-interval AFC methods, commonly used in, e.g.,
flicker detection. However, a two-interval comparison was not found to be read-
ily applicable for estimating the subjective impression of perceptual segrega-
tion in all three modalities. Still, the broad agreement between our mean CFF
(measured with a one-interval method) with literature CFF data (as reviewed
by Lakshminarayanan, 2012; and data obtained with a similar AFC method
but with two intervals by Eisen-Enosh et al., 2017), suggests that our average
results were not systematically impacted by individual response bias. Although
response biases likely contributed to the spread of individual data and correla-
tions in Fig. 6, they did not preclude the observation of significant group-CSR
differences across domains (i.e., the lower CSR for vision), reflecting underlying
modality differences in perception.
5. Summary and Conclusion
Sequential auditory or vibrotactile stimuli separated by at least ~80‒90 ms
(~11‒12-Hz repetition rates) will be perceived as segregated from one another,
a significantly lower time interval than the ~150 ms (~6.5 Hz) necessary to per-
ceptually segregate sequential visual stimuli. These CSR periodicities are likely a
consequence of cortical recovery times in these sensory systems.
Returning to our initial question, the significantly lower CSR than LLP observed
for pure tones suggests that the cessation of pitch — not the ability to perceptu-
ally segregate pressure fluctuations — is the sound quality that has led to exclude
infrasound (< 20 Hz) from the conventional hearing range.
Acknowledgements
We would like to thank all test volunteers for their time and effort.
Downloaded from Brill.com10/07/2021 11:39:20AM
via free access18 C. Jurado et al. / Timing & Time Perception (2021)
Notes
1 Although numerosity performance may be considered a more objective
method than the one used here, to the knowledge of the authors, it has not
been demonstrated that perceptual segregation of stimulus pulses is directly
related to the ability to count them. As we aimed to evaluate the former, we
chose a more subjective approach, deemed more directly associated with a
perceptual quality of the stimulus.
2 While here the voltage waveform delivered to the transducer was a square-
wave, the displacement of the subwoofer membrane did probably not
exactly follow a square-wave shape. Nevertheless, this stimulus type had
subjectively a more ‘pulse-like’ quality.
3 For the two additional subjects used in this study, the LLP was also measured.
References
Amano, K., Goda, N., Nishida, S., Ejima, Y., Takeda, T., & Ohtani, Y. (2006). Estimation of the timing
of human visual perception from magnetoencephalography. J. Neurosci., 26, 3981–3991. https://
doi.org/10.1523/JNEUROSCI.4343-05.2006.
Avanzini, P., Pelliccia, V., Lo Russo, G., Orban, G. A., & Rizzolatti, G. (2018). Multiple time courses of
somatosensory responses in human cortex. NeuroImage, 169, 212–226. https://doi.org/10.1016/j.
neuroimage.2017.12.037.
Beck, B., Peña-Vivas, V., Fleming, S., & Haggard, P. (2019). Metacognition across sensory modali-
ties: Vision, warmth, and nociceptive pain. Cognition, 186, 32–41. https://doi.org/10.1016/j.
cognition.2019.01.018.
British Society of Audiology (2018). Recommended Procedure: Pure-tone air-conduction and bone
conduction threshold audiometry with and without masking. Seafield, UK: British Society of
Audiology.
Chi, T., Gao, Y., Guyton, M. C., Ru, P., & Shamma, S. (1999). Spectro-temporal modulation trans-
fer functions and speech intelligibility. J. Acoust. Soc. Am., 106, 2719–2732. https://doi.
org/10.1121/1.428100.
Daniel, P. (2008). Psychoacoustical roughness. In D. Havelock, S. Kuwano, & M. Vorländer (Eds),
Handbook of signal processing in acoustics (pp. 263–274). New York, NY, USA: Springer. https://
doi.org/10.1007/978-0-387-30441-0_19.
Dau, T., Kollmeier, B., & Kohlrausch, A. (1997). Modeling auditory processing of amplitude mod-
ulation. II. Spectral and temporal integration. J. Acoust. Soc. Am., 102, 2906–2919. https://doi.
org/10.1121/1.420345.
Eisen-Enosh, A., Farah, N., Burgansky-Eliash, Z., Polat, U., & Mandel, Y. (2017). Evaluation of critical
Flicker-Fusion Frequency measurement methods for the investigation of visual temporal resolu-
tion. Sci. Rep., 7, 2–10. https://doi.org/10.1038/s41598-017-15034-z.
Elliott, T. M., & Theunissen, F. E. (2009). The modulation transfer function for speech intelligibility.
PLoS Comput. Biol., 5, e1000302. https://doi.org/10.1371/journal.pcbi.1000302.
Fastl, H. (1983). Fluctuation Strength of Modulated Tones and Broadband Noise. In R. Klinke &
R. Hartmann (Eds), HEARING — Physiological Bases and Psychophysics (pp. 282–288). Berlin,
Germany: Springer-Verlag.https://doi.org/10.1007/978-3-642-69257-4_41.
Downloaded from Brill.com10/07/2021 11:39:20AM
via free accessTiming & Time Perception (2021) DOI: 10.1163/22134468-bja10043 19
Fastl, H., & Zwicker, E. (2007). Psychoacoustics – Facts and Models (3rd ed.). Berlin, Germany:
Springer-Verlag.
Fujisaki, W., & Nishida, S. (2009). Audio-tactile superiority over visuo-tactile and audio-visual com-
binations in the temporal resolution of synchrony perception. Exp. Brain Res., 198, 245–259.
https://doi.org/10.1007/s00221-009-1870-x.
Fujisaki, W., & Nishida, S. (2010). A common perceptual temporal limit of binding synchronous
inputs across different sensory attributes and modalities. Proc. R. Soc. B Biol. Sci., 277, 2281–
2290. https://doi.org/10.1098/rspb.2010.0243.
Glasberg, B. R., & Moore, B. C. J. (2002). A model of loudness applicable to time-varying sounds.
J. Audio Eng. Soc., 50, 331–342.
Guttman, N., & Pruzansky, S. (1962). Lower limits of pitch and musical pitch. J. Speech Hear. Res., 5,
207–214. https://doi.org/10.1044/jshr.0503.207.
Hochberg, Y., & Tamhane, A. C. (1987). Multiple comparison procedures. Hoboken, NJ, USA: John
Wiley & Sons.
Hwang, I., & Choi, S. (2010). Perceptual space and adjective rating of sinusoidal vibrations per-
ceived via mobile device. In 2010 IEEE Haptics Symposium, HAPTICS 2010, Waltham, MA, USA,
pp. 1–8. https://doi.org/10.1109/HAPTIC.2010.5444692.
ISO 226 (2003). Acoustics ‒ normal equal-loudness-level contours. Geneva, Switzerland: International
Organization for Standardization.
Jeffreys, H. (1961). Theory of probability (3rd ed.). New York, NY, USA: Oxford University Press.
Jurado, C., Gallegos, P., Gordillo, D., & Moore, B. C. J. (2017). The detailed shapes of equal-loud-
ness-level contours at low frequencies. J. Acoust. Soc. Am., 142(6), 3821. https://doi.org/
10.1121/1.5018428.
Jurado, C., Larrea, M., Patel, H., & Marquardt, T. (2020). Dependency of threshold and loudness on
sound duration at low and infrasonic frequencies. J. Acoust. Soc. Am., 148, 1030. https://doi.org/
10.1121/10.0001760.
Jurado, C., Larrea, M., & Moore, B. C. J. (in press). The lower limit of pitch perception for sinusoids
and low-frequency complex sounds. Arch. Acoust.
Kühler, R., Fedtke, T., & Hensel, J. (2015). Infrasonic and low-frequency insert earphone hearing
threshold. J. Acoust. Soc. Am., 137, EL347–EL353. https://doi.org/10.1121/1.4916795.
Lakshminarayanan, V. (2012). Flicker sensitivity. In J. Chen, W. Cranton & Mark Fihn (Eds),
Handbook of visual display technology (pp. 101–108). Berlin, Germany: Springer-Verlag. https://
doi.org/10.1007/978-3-540-79567-4_7.
Lechelt, E. C. (1975). Temporal numerosity discrimination: intermodal comparisons revisited.
Br. J. Psychol., 66, 101–108. https://doi.org/10.1111/j.2044–8295.1975.tb01444.x.
Møller, H., & Pedersen, C. S. (2004). Hearing at low and infrasonic frequencies. Noise Health, 6,
37–57.
Moore, B. C. J. (2014). Development and current status of the “Cambridge” loudness models. Trends
Hear., 18, 1–29. https://doi.org/10.1177/2331216514550620.
Norcia, A. M., Appelbaum, L. G., Ales, J. M., Cottereau, B. R., & Rossion, B. (2015). The steady-state
visual evoked potential in vision research: A review. J. Vis., 15, 4. https://doi.org/10.1167/15.6.4.
Occelli, V., Spence, C., & Zampini, M. (2011). Audiotactile interactions in temporal perception.
Psychon. Bull. Rev., 18, 429–454. https://doi.org/10.3758/s13423-011-0070-4.
Park, G., & Choi, S. (2011). Perceptual space of amplitude-modulated vibrotactile stimuli. 2011 IEEE
World Haptics Conference, WHC 2011, Istanbul, Turkey, pp. 59–64. https://doi.org/10.1109/
WHC.2011.5945462.
Downloaded from Brill.com10/07/2021 11:39:20AM
via free access20 C. Jurado et al. / Timing & Time Perception (2021)
Philippi, T. G., van Erp, J. B. F., & Werkhoven, P. J. (2008). Multisensory temporal numerosity judg-
ment. Brain Res., 1242, 116–125. https://doi.org/10.1016/j.brainres.2008.05.056.
Rouault, M., McWilliams, A., Allen, M. G., & Fleming, S. M. (2018). Human metacognition across
domains: insights from individual differences and neuroimaging. Personality Neurosci., 1, E17.
https://doi.org/10.1017/pen.2018.16.
Samaha, J., & Postle, B. R. (2017). Correlated individual differences suggest a common mechanism
underlying metacognition in visual perception and visual short-term memory. Proc. R. Soc. B Biol.
Sci., 284, 20172035. https://doi.org/10.1098/rspb.2017.2035.
Schürmann, M., Caetano, G., Hlushchuk, Y., Jousmäki, V., & Hari, R. (2006). Touch activates human
auditory cortex. NeuroImage, 30, 1325–1331. https://doi.org/10.1016/j.neuroimage.2005.11.020.
Shelton, J., & Kumar, G. P. (2010). Comparison between Auditory and Visual Simple Reaction Times.
Neurosci. Med., 1, 30–32. https://doi.org/10.4236/nm.2010.11004.
Tan, H. Z. (1996). Information transmission with a multi-finger tactual display, PhD thesis. Princeton,
MA, USA: Massachusetts Institute of Technology.
Tan, H. Z., Durlach, N. I., Reed, C. M., & Rabinowitz, W. M. (1999). Information transmission with
a multifinger tactual display. Percept. Psychophys., 61, 993–1008. https://doi.org/10.3758/
BF03207608.
Thorpe, S., Fize, D., & Marlot, C. (1996). Speed of processing in the human visual system. Nature,
381, 520–522. https://doi.org/10.1038/381520a0.
Tukey, J. W. (1977). Exploratory data analysis (1st ed.). Boston, MA, USA: Addison-Wesley.
Thwaites, A., Nimmo-Smith, I., Fonteneau, E., Patterson, R. D., Buttery, P., & Marslen-Wilson,
W. D. (2015). Tracking cortical entrainment in neural activity: auditory processes in human tem-
poral cortex. Front. Comput. Neurosci., 9, 5. https://doi.org/10.3389/fncom.2015.00005.
van Hateren, J. H., & Lamb, T. D. (2006). The photocurrent response of human cones in fast and
monophasic. BMC Neurosci., 7, 34. https://doi.org/10.1186/1471-2202-7-34.
Varnet, L., Ortiz-Barajas, M. C., Erra, R. G., Gervain, J., & Lorenzi, C. (2017). A cross-linguistic
study of speech modulation spectra. J. Acoust. Soc. Am., 142, 1976–1989. https://doi.org/
10.1121/1.5006179.
Warren, R. M., & Bashford, J. A. (1981). Perception of acoustic iterance: Pitch and infrapitch. Percept.
Psychophys., 29, 395–402. https://doi.org/10.3758/BF03207350.
Welch, R. B., & Warren, D. H. (1980). Immediate perceptual response to intersensory discrepancy.
Psychol. Bull., 88, 638–667. https://doi.org/10.1037/0033-2909.88.3.638.
Downloaded from Brill.com10/07/2021 11:39:20AM
via free accessYou can also read


