Correlations between landslide scars parameters using remote sensing methods in the estrada de ferro Vitória-Minas, southeastern Brazil - Lsie
←
→
Page content transcription
If your browser does not render page correctly, please read the page content below
Revista Brasileira de Geomorfologia
 v. 22, nº 1 (2021)
 http://lsie.unb.br/ugb/
 ISSN 2236-5664 http://dx.doi.org/10.20502/rbg.v22i2.1937

Artigo de Pesquisa

 Correlations between landslide scars parameters using
 remote sensing methods in the estrada de ferro
 Vitória-Minas, southeastern Brazil
 Correlações entre parâmetros de cicatrizes de deslizamento utilizando
 sensoriamento remoto na estrada de ferro Vitória-Minas, sudeste do Brasil
Denise de Fátima Santos da Silva 1, Rosyelle Cristina Corteletti 2, Roberto Almeida Cunha Filgueiras 3 e Allan
Erlikhman Medeiros Santos 4
 1 Universidade Federal de Minas Gerais, Centro de Pesquisa Professor Manoel Teixeira da Costa, Belo Horizonte, Brasil.
 denisefss@yahoo.com.br.
 ORCID: https://orcid.org/0000-0002-9695-2449
 2 Universidade Federal de Ouro Preto, Núcleo de Geotecnia da Escola de Minas, Ouro Preto, Brasil.
 rosyelleccorteletti@gmail.com.
 ORCID: https://orcid.org/0000-0001-6006-2877
 3 GERPRO – Gerenciamento de Projetos S/C Ltda, Belo Horizonte, Brasil.
 roberto@filgueiras.com.br.
 ORCID: https://orcid.org/0000-0003-4391-9415
 4 Centro Federal de Educação Tecnológica de Minas Gerais, Departamento de Minas e Construção Civil, Araxá, Brasil.
 allanerlikhman@cefetmg.br.
 ORCID: https://orcid.org/0000-0003-1241-8423

 Recebido: 13/05/2020; Aceito: 18/12/2020; Publicado: 10/04/2021

 Resumo: O sensoriamento remoto tem sido largamente aplicado em estudos que envolvem registros e monitoramento de
 movimentos de massa, além disso, essas ferramentas são muito empregadas na geração de mapas de áreas de risco geológico.
 Neste artigo utilizou-se duas metodologias de sensoriamento remoto para identificação, caracterização e catalogação das
 cicatrizes geradas por deslizamento ao longo da Estrada de Ferro Vitória-Minas (EFVM). A primeira metodologia permitiu
 estimar a área e o volume das cicatrizes de deslizamento da EFVM por meio das imagens disponíveis no Google Earth Pro. A
 segunda metodologia utilizou-se de um drone para captação dos parâmetros em campo das cicatrizes de deslizamento. A
 partir dos parâmetros obtidos pode-se comparar as estimativas de áreas e volumes de deslizamentos pelo imageamento com
 drone com os dados obtidos a partir das imagens do Google Earth Pro e testar a aplicabilidade de ambos os métodos. Os
 resultados obtidos apontam estimativas de áreas de cicatrizes com correlação de 0,92 para as duas metodologias. Já as
 estimativas de volume apresentaram correlação 0,8; com subestimativa dos resultados obtidos por meio do Google Earth Pro.

 Palavras-chave: Cicatriz de deslizamentos; Google Earth Pro; Drone.

 Abstract: The remote sensing has been widely used in studies involving records and monitoring landslides, also, this tool is
 widely used in mapping areas of geological risk. In this paper, two remote sensing methodologies were used to identify,
 characterize and catalog scars generated along the Estrada de Ferro Vitória-Minas (EFVM). The first methodology allowed to
 estimate the area and volume of landslides scars of EFVM through the images available in Google Earth Pro. The second
 methodology used a drone to capture the parameters in the field of landslides scars. From the obtained parameters it was
 possible to compare the estimates of areas and volumes of landslides by drone image with the data obtained by images of
 Google Earth Pro and to test the applicability of both methods. The results obtained showed estimates scars areas with

Revista Brasileira de Geomorfologia. 2021, v. 22, n. 2; DOI: 10.20502/rbg.v22i2.1937 http://www.lsie.unb.br/rbg/
Revista Brasileira de Geomorfologia, v. 22, n. 2, 2021 298

 correlation of 0.92 for the two methodologies. The volume estimates presented a correlation of 0.8; with underestimation of
 the results obtained by Google Earth Pro.

 Keywords: Landslide scars ; Google Earth Pro ; Drone.

1. Introduction
 Natural disasters associated with landslides on natural slopes occur frequently throughout the world and
have different causes and may be either singular or combined. Landslides reflect landscape instability that evolves
over meteorological and geological timescales, and they also pose threats to people, property, and the
environment (IVERSON et al., 2015). Thus, the need to predict these events is justified. However, the prediction
methods are still a great challenge in geotechnical engineering, due to the many variables involved in this
phenomenon.
 In linear works such as highways or railways, for example, studies on the prediction of the area and the
volume of sliding mass are extremely complex and assume particularly relevant characteristics. These
characteristics are due to the nature of the project, where there is a wide trajectory crossing different geological
sites, with different geological, geotechnical, topographic and vegetation characteristics (CORTELETTI, 2017;
SILVA et al., 2018).
 In the case of railroad embankments, landslides, when reaching the domain of the railway platform, can
affect the railroad in several ways, such as the traffic stoppage and the interdiction of the route by compromising
the flow of loads and/ or passengers (CORTELETTI, 2017). The severity of these disorders largely depends on
landslide speed and travel distance, which are collectively described as landslide "mobility" (IVERSON et al.,
2015). Landslide size controls the destructive power of landslides and is related to the frequency of occurrence,
with larger landslides being less frequent than smaller ones (VALAGUSSA et al., 2019). For this reason, knowing
the number, area and volume of landslides makes it possible to establish the hierarchy of susceptible slopes and
thus to assess the risk of landslides (GUZZETTI et al., 1999; CARDINALI et al., 2002; MALAMUD et al., 2004;
REICHENBACH et al., 2005; GUZZETTI et al., 2009).
 Landslides analyzes are performed from inventories. These inventories allow correlations between the record
of past landslides in a given area and the conditioning factors, such as lithological and topographic structures
(GUTHRIE, 2002; AVANZI; GIANNECCHINI; PUCCINELLI, 2004), the type of use (LEE; CHWAE;
KYUNGDUCK, 2002; PEROTTO-BALDIVIEZO et al., 2004) and the specific trigger mechanism (GUNS; VEERLE,
2014). The area of a landslide can be determined from maps in digital format, as can be seen (GUZZETTI et al.,
2005, IMAIZUMI; SIDLE, 2007; GALLI et al., 2008), where area and density of landslides may be calculated for
different periods.
 Determining the volume of a landslide is a more difficult task that requires information on the surface and
sub-surface geometry of the slope failure (GUZZETTI et al., 2009). Some authors estimate the volume of a slip
simply by assuming that the surface of a slip is half of an ellipsoid (CRUDEN; VARNES, 1996).
 By using empirical relationships, it is possible to link the volume of individual landslides to the geometric
measurements of the failures, such as the area of landslide (SIMONETT, 1967; RICE et al., 1969; INNES, 1983;
HOVIUS; STARK; ALLEN, 1997; GUTHRIE; EVANS, 2004; Korup, 2005b; TEN BRINK; GEIST; ANDREWS, 2006;
IMAIZUMI; SIDLE, 2007; GUZZETTI et al., 2008; IMAIZUMI; SIDLE; KAMEI, 2008; GUZZETTI et al., 2009;
SILVA et al., 2018). Through the relationships it is possible to evaluate and delimit areas of risk, to assist in the
immediate applications of decision making in relation to the planning and prioritization of works, besides
allowing the coexistence with these types of phenomenon (POLANCO, 2010, SILVA et al., 2018).
 In recent years, drones equipped with cameras to perform digital aerial photogrammetry, have gained
market share, mainly because of the ease of data acquisition and the amount of information an aerial image can
provide. Currently, drones have integrated field positioning technologies to generate high accuracy and precision
products for pre-projects in the various fields of engineering, agriculture and landslides studies (TURNER et al.,,
2015; ROSSI et al., 2016; PETERNEL et al.,, 2017; PEPPA et al.,, 2017; BALEK; BLAHUT, 2017; GUPTA; SHUKLA,
2018; ROSSI et al., 2018; GARCIA-DELGADO; MACHUCA; MEDINA, 2019).
 In this paper, a quadcopter drone equipped with a 12-megapixel camera was used to acquire
photogrammetric data on the VALE S.A. railway line, which is located in the southeastern region of Brazil, in the
Revista Brasileira de Geomorfologia, v. 22, n. 2, 2021 299

Estrada de Ferro Vitória-Minas (EFVM) line. Eighteen landslides were cataloged for which area and volume
measurements were estimated. The objective of this study was to test the applicability and validate the results of
the estimates made in eighteen scars through Google Earth Pro and compare them with the estimates made in
drone imaging, determining the relation between the area and volume variables, in addition to the creation of
high resolution 3D surface models for better characterization of EFVM scars.

1.1 Use of remote sensing for study and mapping of landslides
 Remote sensing is applied in studies involving logging and monitoring of landslides and is also widely used
in generating maps for areas of geological risk, as can be seen in Guzzetti et al. (2012), Fan et al. (2018) e Karki et al.
(2018). However, Vanacôr (2006) draws attention to the fact that the interpretation of landslides from remote
sensing requires knowledge of the distinct structures associated with slope movement and image characteristics.
Thus, an adequate interpretation depends on the spatial resolution of the image, which, if very low, makes it
difficult to identify or recognize the features.
 According to Vanacôr (2006) the interpretation of features in an image is influenced by what exists between
the features and their surroundings. Thus, the identification of slides depends on the contrast of the spectral or
spatial differences between the mass movement and its surroundings. In addition, the identification of such
movements is directly affected by the period since the failure, due to erosive processes, besides the vegetation
recomposition.
 The use of remote sensing for the study and mapping of mass movements is performed from the direct
detection (scars originated by the processes). Scars are characterized by the removal of the vegetation cover and
exposure of superficial layers of the soil, in addition to the material transported and deposited in the form of a
range of debris. Indicators can be observed through changes in vegetation cover (different densities and
vegetation types due to previous landslides), soil use (removal of vegetation by anthropic action in areas prone to
landslides or road cutting) and hillside (VANACÔR, 2006).
 According to Mendonça (2012) the use of orbital images obtained on dates close to the event is an important
product for the elaboration of scars inventories. More accurate mapping of scars is critical for the methods of
susceptibility and slope hazard investigation/analysis, as they allow calibration and validation of such methods.

1.1.1. Google Earth Pro as a tool to building landslide scars inventory
 In actual practice, high-resolution satellite imagery is extremely widespread. Google Earth has
revolutionized the way we look at landscapes, as well as familiarizing the user with satellite imagery. Recently,
high spatial resolution images were integrated in this large mosaic, allowing for more detailed observations. In the
absence of financial resources to acquire aerial photographs or satellite images, it is possible to work with existing
ones in Google Earth (PANIZZA; FONSECA, 2011). In addition, Google Earth has been used in archaeological
studies as can be seen in Kennedy and Bishop (2011); Parcak (2009); Sadr and Rodier (2012) and in landslides
studies (SILVA et al., 2018).
 The Google Earth database consists of a set of images from sensors of various resolutions arranged to form a
continuous image of the entire planet. In addition, high resolution images of Google Earth are preferably from
prominent regions, such as areas of high population density, tourist regions and attractive regions of the world.
These images come from various distributors and are changed periodically. Therefore, an image viewed today in
Google Earth can be replaced with a newer image without any notification (LOPES, 2009).

1.1.2. Use of drones to characterize landslides
 With the popularization of drones, photogrammetric products have gained space in the market, for reasons
such as the ease of data acquisition and the amount of information that an aerial image can offer. In practice,
drones have integrated ground-positioning technologies to generate high-precision products for pre-projects in
areas such as engineering, agriculture and services. According to Chang-Chun et al. (2011), drones have the
following advantages: real-time applicability, flexible search planning, high resolution, low cost and power to
collect information in hazardous environments without risk.
 Currently there is a great facility for the acquisition or assembly of a drone, for aerial photogrammetry
purposes, from various ready-made models, parts and components available in the market. Despite the high
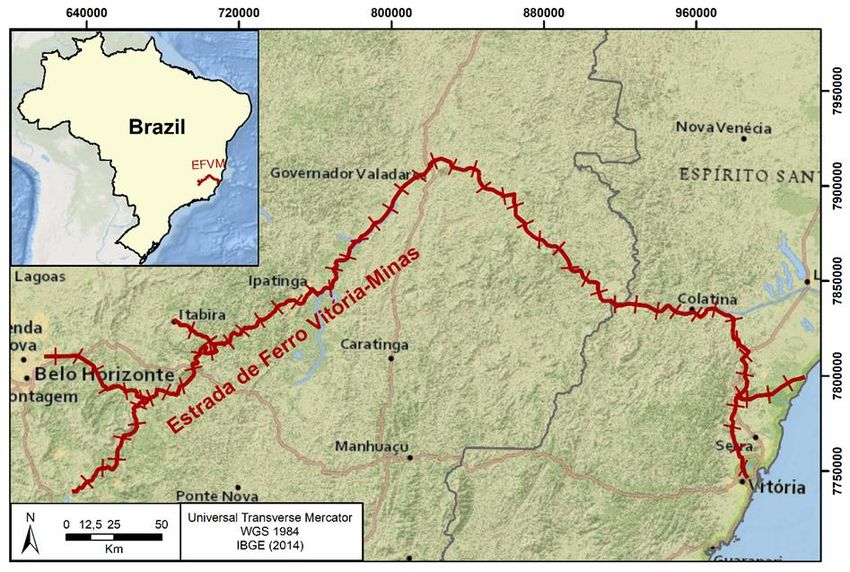
Revista Brasileira de Geomorfologia, v. 22, n. 2, 2021 300

technology, a complete system has a significantly lower cost when compared to a conventional aerial
photogrammetric system (SILVA et al., 2014). Due to this accessibility to the public, its application in the mapping
of small areas with few hectares has grown very much today (SILVA et al., 2014). Among the applications are the
mining, civil, urban and environmental engineering works, as well as surface modeling and monitoring
(EISENBEISS; SAUERBIER, 2011, TRAVELLETTI et al., 2012, JAMES; ROBSON, 2012; COLOMINA; MOLINA,
2014; ROSSI et al., 2018).

2. Material and Methods

2.1. Study area: Estrada de Ferro Vitória-Minas (EFVM)
 This research was developed to correlate estimated morphometrics data: area, shape and volume landslide
scars in Google Earth Pro with estimated data through drone imaging. For this, we took as reference the trunk line
of Estrada de Ferro Vitória Minas (EFVM). EFVM is one of the largest railroads in the world and has some of the
best productivity rates.
 EFVM is located in the southeastern region of Brazil, between Minas Gerais and Espirito Santos states, and it
crosses 25 cities in both states. The railroad has 929 km of line extension (607 km of double line) and the trunk line
has 540 km. EFVM handled 119.2 million tons of ore, as well as other cargo transported to other companies, such
as coal and agricultural products. According to Vale (2017), EFVM transported almost one million people in 2014.
 Silva et al., (2018) shows EFVM trunk line crosses several geological domains. The predominant lithologies
are “granites”, “gneisses”, “gneisses with mafic intrusives”, “metasedimentary rocks with presence of granitic
intrusions”, “shales and gneisses” and “unconsolidated sediments”. Figure 1 shows the main road layout.

 Figure 1. EFVM location.

2.2. Data estimate using Google Earth Pro
 This study used the landslide scars inventory about EFVM was created by traversing 482 e 536 of the railroad
through orbital images using the Google Earth Pro software. To identify the landslide scars, the altitude of the
images point of view ranged from 2.55 kilometers to 368 meters, according to the level of detail needed to
discriminate the scars. The final landslide scars inventory includes the stretch, location in UTM coordinates, the
date of the image, and other characteristics such as area, shape and volume of the landslides.
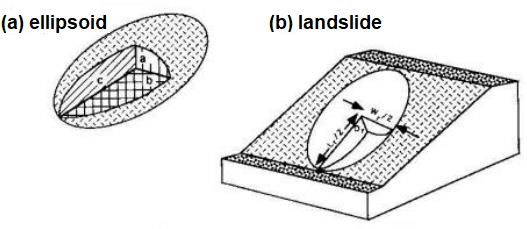
Revista Brasileira de Geomorfologia, v. 22, n. 2, 2021 301

 In order to estimate the area of each delimited scar, the images for the 2016 year were extracted from Google
Earth Pro. Then, the images were georeferenced in the ArcGis 10.3 software and the landslide scars areas were
estimated. From ArcGis 10.3 were estimated areas 12 landslide scars in the EFVM.
 The volume mobilized in the EFVM landslide scars in the present study was estimated using half of an
ellipsoid as proposed by several authors, such as Cruden and Varnes (1996); Corrêa et al. (2009), Lee and Chi
(2011) (Figure 2). The volume occurred in each lanslide was estimated according Eq. (1), considering the shape of
half an ellipsoid, with semi-axes of the ellipse being: Vis, volume of material mobilized; Dd, scar depth; Wd, scar
width e Ld, scar length. The increase in volume after displacement as a percentage of volume before displacement
(swell factor) was not considered in the analyzes.

 (1)

 Figure 2. Estimated slide volume considering the shape of half an ellipsoid (Cruden and Varnes, 1996).

 To obtain the semi-axes (length and width) of the ellipse, the Ruler tool of the Google Earth Pro software was
used. The apparent depth of the failure (c1) was estimated from the elevation parameters that are reported by the
program, using the Show Elevation Profile tool. Figure 3 schematically presents the methodology used to obtain
the corrected failure depth ( ).

 Figure 3. Methodology for obtaining the corrected failure depth.
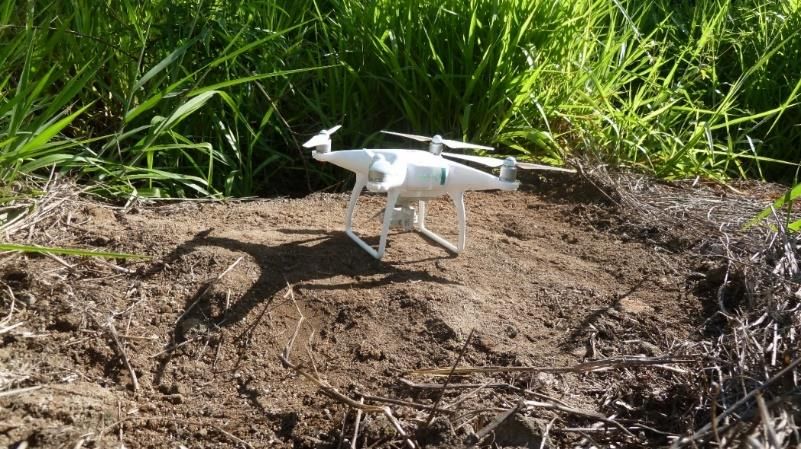
Revista Brasileira de Geomorfologia, v. 22, n. 2, 2021 302

 The methodology used to obtain the corrected failure depth is explained below, using Eq.(2 to 6). In Figure
3, due to the similar triangles:

 (2)

 That is:
 (3)

 From the value of :
 (4)

 From the trigonometric relation:
 (5)

 So, this:
 (6)

Where is the corrected depth of the landslide scar. It is worth mentioning that this corrected depth that is
calculated is an estimate, as it is not real, since it does not consider the shape of the ground surface before the
failure.

2.3 Data estimate using drone
 For the purpose to validate the estimated data using Google Earth Pro, some of the landslide scars identified
were verified in the field. Fieldwork was carried out between the 482 and 536 km stretches, and drone imaging
estimated the area and volume of the lansdslide scars in the EFVM. For the acquisition of the images a quadcopter
type drone (Figure 4) compact model Phanton IV with a resolution camera of 12 Mp (4000X3000 pixels) was used.
The flight parameters used for imaging are shown in Table 1.

 Figure 4. Drone used at work for data acquisition in the field.
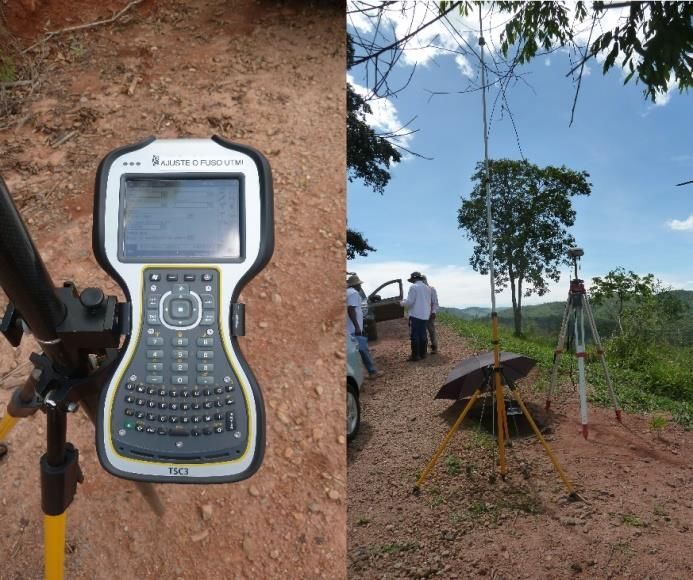
Revista Brasileira de Geomorfologia, v. 22, n. 2, 2021 303

 Table 1. Determination of flight parameters for imaging of landslides scars.

 Flights detail for scars registration of EFVM - Phanton IV

 Camera CCD Size (mm) Lens Focal Distance Photo (pixel)

 Descriptio Resolutio
 Type width height width height
 n n 3,610

 4 Phanton IV 12 6,317 4,738 4.000 3.000

 Length (m) Width (m) Extension (m) GSD Area (ha) Photos 3D Densified
 Site Height (m)
 L n W n Estimated Real Error (cm/pixel) Covered Grid Real Model Points

Area 01 110 329 5 194 8 3960,88 3826 0,034 7,62 25,99 6,38 254 254 13.246.266

Area 02 110 179 4 152 5 1945,66 1978 0,017 5,33 12,57 2,72 136 136 8.249.299

Area 04 110 443 5 208 10 5273,80 5410 0,026 4,51 23,83 9,21 326 279 16.876.787

Area 05 110 329 5 179 8 3826,08 3757 0,018 4,59 17,27 5,89 248 248 13.267.656

Area 06 110 277 7 194 5 3585,36 3546 0,011 7,98 26,01 5,37 226 226 11.435.569

Area 07 100 230 5 167 6 2720,47 2913 0,071 3,72 11,43 3,84 184 184 12.653.960

Area 08 100 273 4 119 7 2520,62 2594 0,029 4,07 11,42 3,25 172 172 10.710.315

Area 09 100 246 5 187 7 3157,01 3198 0,013 4,68 14,82 4,60 211 211 13.139.239

Area 10 100 276 4 132 7 2639,88 2545 0,036 4,25 12,01 3,64 178 173 10.356.095

Area 12 100 187 5 184 5 2379,69 2330 0,021 4,21 11,18 3,44 162 162 9.791.445

Area 13 100 231 5 144 6 2563,42 2510 0,021 4,61 14,90 3,33 175 175 10.319.889

Area 14 100 228 5 151 6 2592,94 2621 0,011 5,12 13,75 3,44 177 177 10.261.861

 The flight was planned to cover a total of 64,586 ha of area at an altitude ranging from 100 to 110 m. The area
presents characteristics considered difficult to process automatically, with uniform vegetation areas. After the
flight, the images were processed in the software using 36 control points. In all imaged areas were generated
orthomosaic, point cloud and digital surface models.
 The flight plan was mapped in the Google Earth Pro software. In the field the process consisted of moving to
a nearby clearing that served as a takeoff point to avoid contact with the propellers. A reference target was
installed, the drone was positioned where the controlled takeoff took place that took the drone to an estimated
height, and thus started the execution of the flight. The next step was to move it laterally at 90º over the area of
interest. At the end of the imaging process, the drone was driven to landing.

2.4. Real-Time Kinematic (RTK)
 In this work, the imaging was created simultaneously to the mapping using Real-Time Kinematic (RTK). For
this, two receivers were used, continuously collecting data and a receiver used as a “base” that was installed in a
reference station that had known coordinates. For real time position determination, the mobile receiver collects
data at points of interest, also called control points. Figure 5 shows the equipment used to perform RTK
geopositioning.
 In the flights for acquisition of the data of this work, the equipment remained connected during the flights to
allow the Ground Control Points (GCPs) of other areas to be deployed while performing the "previous" flights,
those with demarcated points. In addition, precise point positioning (PPP) that is used for dynamically captured
point correction (RTK) should have an approximate capture time of 4 hours.
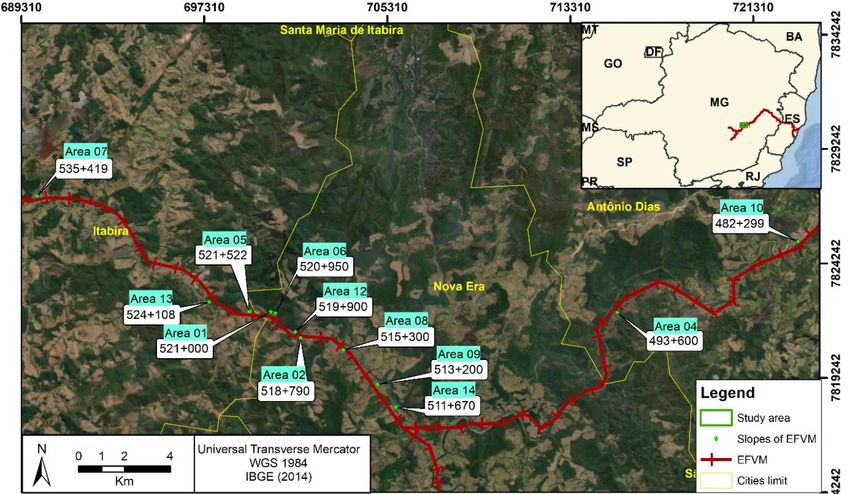
Revista Brasileira de Geomorfologia, v. 22, n. 2, 2021 304

 Figure 5. Equipment used to perform RTK geopositioning.

2.5. Data processing
 Terrain surface was estimated through drone aerophotogrammetry imaging and RTK geopositioning. Thus,
the topography analyzed were used to more accurately estimate the scars studied in the EFVM, minimizing the
degree of uncertainties imposed by the limitations of Google Earth images. In addition to improving the accuracy
of estimates, obtaining parameters in the field allows obtaining a correction factor of the estimated variables
through remote sensing.
 Among the scars studied in the research, some were selected for field work. These scars were determined
based on the accessibility of the exercises to perform the fieldwork. 12 stretches were selected, km 482 + 299, km
493 + 600, km 511 + 670, km 513 + 200, km 515 + 300, km 518 + 790, km 519 + 900, km 520 + 950, km 521 + 000, km 521
+ 522, km 524+ 108, km 535 + 419. The names of the sections correspond to the kilometer of the point added to the
meters, that is, km 482 + 299 means that the point is at kilometer 482,299. Some sections are added with the letters
D or E, this means the margin in relation to the railway where the scar is located. The streches analyzed with their
respective names can be seen in Figure 6.

 Figure 6. Location of the analyzed areas (in blue) with their respective stretches (in white) in EFVM.
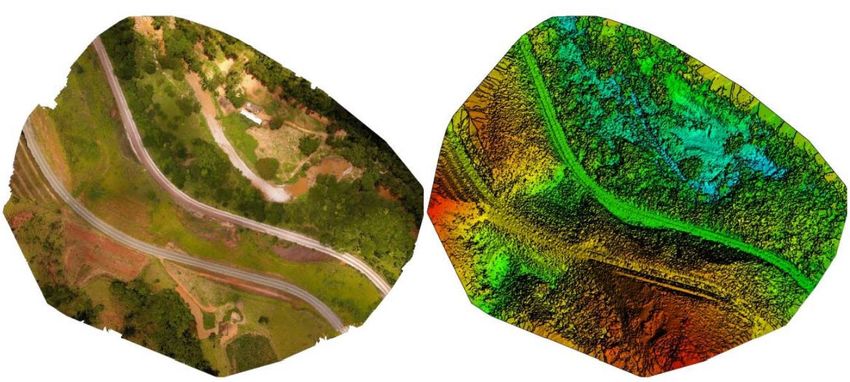
Revista Brasileira de Geomorfologia, v. 22, n. 2, 2021 305

 To improve the accuracy of the generated orthomosaic in relation to the reference system UTM SIRGAS 2000,
it was necessary to acquire control points in the field. For control points were marked using a “cross-shaped”
arrangement of material PVC type for reference. Table 2 shows the reference base coordinates and the duration of
the tracking for RTK.
 Table 2. Duration of RTK screenings.

 EFVM - Tracking time
 Time UTM SIRGAS 2000 (m) Orthometric
 Data Location
 Start Finish Duration N E altitude (m)
 17/01/17 Itabira 16:56:35 21:16:20 4:19:45 7.821.825,262 700.078,323 764,27
 18/01/17 Itabira 10:42:55 15:30:25 4:47:30 7.821.825,271 700.078,335 764,26
 19/01/17 Antônio Dias 11:16:40 14:26:45 3:10:05 7.821.780,269 715.227,230 473,67

 First the images were processed in Pix4D software. Orthomosaic, point cloud and digital surface models
were generated (Figure 7). The drone images needed to cover the study area and make the orthomosaics were
2889, with visible spectrum bands with 4000 x 3000 pixels (12 megapixels) for each image and spatial resolution
ranging from 3.72 to 7.98 centimeters. To register the orthomosaic and to calculate the areas of the landslide scars,
the software ArcGis 10.3 was used.

 Figure 7. Orthomosaic and digital surface model (DSM) do trecho km 511+670 (Area 14) da EFVM.

 The cartographic base, in DXF format on the 1:2000 cartographic scale, and relief data from the study area,
obtained from aerophotogrammetric flight, were processed in the Global Mapper 17.0 software. Relief data is
contour lines spaced from 0.2 to 0.5 meters and is in shapefile format used in the ArcGis. AutoCAD Civil 3D 2015
software was used to estimate field volumes. The volume estimate was performed so that the face of the slope
before the event was a rectilinear curvature surface. Thus, the volume mobilized in the landslides was estimated
by extracting the pre-event rectilinear topography from the topography of the current image. After the field, this
data was processed and compared to the data estimated in Google Earth Pro.
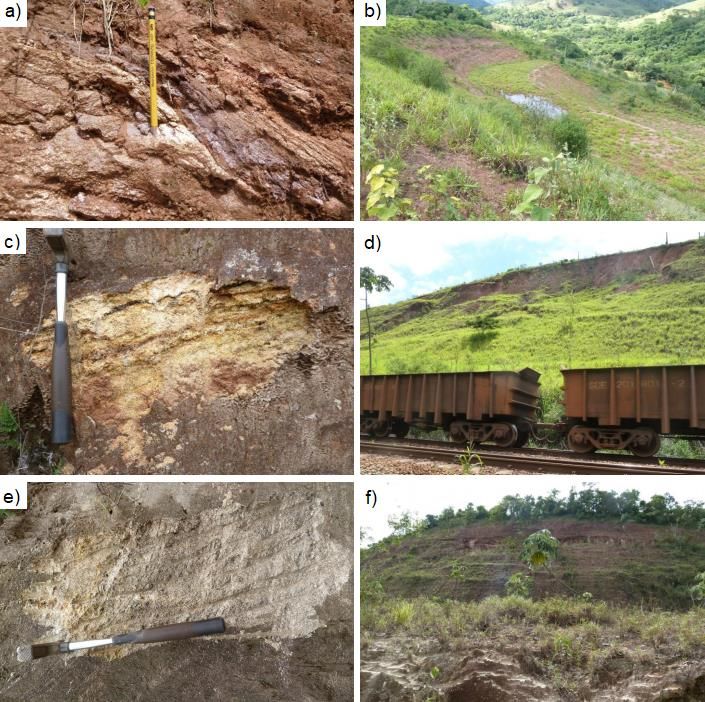
Revista Brasileira de Geomorfologia, v. 22, n. 2, 2021 306

3. Results and discussions

3.1. Landslide Scars characterization of EFVM
 The scars analyzed in the EFVM field occur on soil or soil / rock slopes and according to CPRM (2000) are
inserted in the Borrachudos Suite, Mantiqueira Complex and Guanhães Complex . Most landslide scars have no
vegetation cover and many erosion grooves.
 Some scars are located on residual soil slopes, as scar located at Km 519 + 900 (Area 12) as show Figure 8a.
This scar presents the gneiss residual soil, with relic features of the original rock, as a banding characterized by the
presence of the quartz and feldspar in the light portions and biotite and amphibole in the dark portions.

 Figure 8. a) Residual soil that composing the embankment of the Km 519 + 900 (Area 12) strech inserted in the
 Borrachudos Suite. b) Accumulation of water on one of the benches in the slope area next to Km 511 + 670 (Area 14).
 c) Residual gneiss soil on the slope of Km 493 + 600 (Area 04). d) View of the Km 493 + 600 embankment and
 rotational landslide scar. e) Weathered granitoids from Km 482 + 299 (Area 10). f) View of the Km 482 + 299 slope.
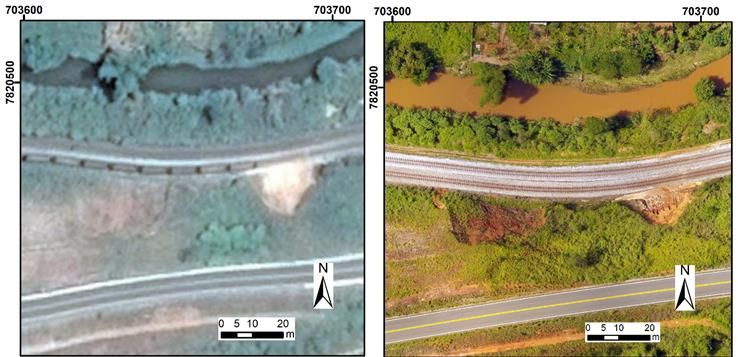
Revista Brasileira de Geomorfologia, v. 22, n. 2, 2021 307

 As well as the scars from the Km 519 + 900 (Area 12) section, the scars from the Km 518 + 790 (Area 02) and
Km 511 + 670 (Area 14) sections are inserted in the Guanhães Complex and have erosion grooves. In addition, no
natural drainage lines or stabilization structures were observed. It was observed erosion points, undulations on
the surface of the land and curved trees on the slopes. The scars showed cracks with an extension larger than 1
meter and an opening larger than 5 centimeters. In the near of Km 511 + 670 (Area 14) there was new slopes was
build. In one of the benches on this new slope, there is a considerable amount of water accumulation, considering
that on the inspection days there was no incidence of rain (Figure 8b).
 At Km 515 + 300 (Area 08) is located a scar that presents a residual soil of gneiss (silty sandy) in transition
with a red silty soil, which can be considered the gradual contact between the units of the Guanhães Complex and
the Borrachudos Suite. The slope has erosion with grooves and it was observed needs for stabilization structures
construction.
 The slope located at Km 520 + 950 (Area 06) consists of soil / rock. The lower part of the massif consists of a
granitoid of quartzitic composition from the Borrachudos Suite (CPRM, 2000). In the upper portion the massif is
totally weathered. Erosion grooves was observed in the massif. It was observed needs to apply drainage systems,
with the emergence of water located at the foot of the slope. Regarding stabilization structures, existing structures
were observed, but these proved to be insufficient to mitigate the danger. Movement evidence was observed, such
as the misalignment of trees.
 The scar located at Km 493 + 600 (Area 14) is a slope with a rotational landslide scar, which presents
variations in soil and weathered gneisses (Figure 8c). The slope showed erosion in the form of grooves and gullies.
The cracks in the scars had an extension greater than 1 meter with an opening greater than 5 centimeters. The
occurrence of water on the slope was not observed, however the drainage devices found were insufficient, since
most of the drainage channels were obstructed. Figure 8d shows the view of the Km 493 + 600 embankment and
the rotational landslide scar.
 The slope located at Km 482 + 299 (Area 10) is a granite with some portions showing a slight gneissic banding,
many quartz veins were observed along the massif (Figure 8e). The soil is sandy. The massif is inserted in the
Mantiqueira Complex (CPRM, 2000). The slope presents need for stabilization structures and drainage devices,
both of which do not exist in the area (Figure 8f).

3.2. Scar areas estimation using drone and RTK imaging and comparison with estimated areas in Google Earth Pro
 Scar areas were measured from images generated by drone imaging and RTK survey, all processed in ArcGis
10.3. For the exposure of the assumptions adopted in the estimations of the studied areas, and better visualization
of the processed images, it was taken as an example of analysis the Area 08 (Km 515 + 300) presented in Figure 9.
 From the control points, orthomosaics and digital surface models were built. Figure 9 presents a comparison
of the spatial resolution of the Area 08 (Km 515 + 300) image obtained in Google Earth Pro for 2016 year and the
orthomosaic processed in Pix4D. The better visual quality of the orthomosaic obtained by drone imaging (pixel
corresponding to 4.07 centimeters) is clearly observed than the image obtained by Google Earth Pro.

 Figure 9. Visual comparison between the spatial resolutions of the Google Earth Pro image and the orthomosaic
 generated by Pix4D (4.07 cm) from Area 08 (Km 515 + 300).
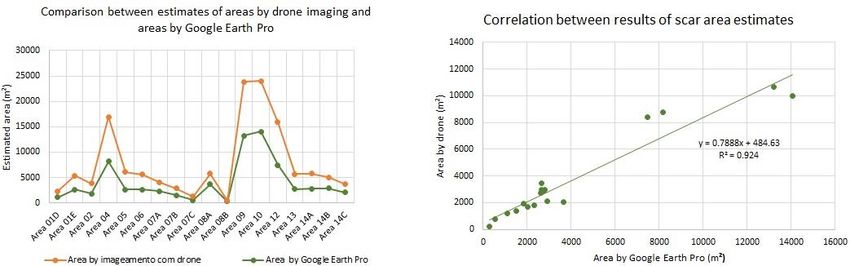
Revista Brasileira de Geomorfologia, v. 22, n. 2, 2021 308

 From the images, it was possible to estimate the scar areas Table 3 presents the results of the estimated areas
in both methodologies and their names, as well as the calculation of the values deviation in percentage.
 Table 3. Estimated values of scar areas and values deviation obtained between methods.

 Area from Google Area from drone
 Strech Scar Variation (%)
 Earth Pro (m²) (m²)
 521+000D Area 01D 1104,83 1198,67 8,49
 521+000E Area 01E 2629,1 2709,89 3,07
 518+790 Area 02 1859,05 1947,06 4,73
 493+600 Area 04 8174,28 8788,24 7,51
 521+522 Area 05 2642,39 3435,51 30,02
 520+950 Area 06 2667,65 2965,94 11,18
 535+419A Area 07A 2314,06 1783,24 22,94
 535+419B Area 07B 1490,26 1405,83 5,67
 535+419C Area 07C 541,86 764,25 41,04
 515+300A Area 08A 3668,03 2072,65 43,49
 515+300B Area 08B 274,28 199,25 27,36
 513+200 Area 09 13221,65 10644,06 19,5
 482+299 Area 10 14047,6 9967,96 29,04
 519+900 Area 12 7458,96 8392,73 12,52
 524+108 Area 13 2751,04 2936,16 6,73
 511+670A Area 14A 2801,2 2972,95 6,13
 511+670B Area 14B 2900,32 2134,83 26,39
 511+670C Area 14C 2042,83 1661,26 18,68

 In order to facilitate the visualization of the results obtained between methods, Figure 10 presents the results
of Table 3 in the form of 2 graphs, one of comparison and the other of correlation between the methodologies.
From the comparison chart, it is possible to observe that the biggest differences between the two estimates are in
the areas 04, 09, 10 and 12, which also present the highest values for the scar areas. This phenomenon can be
justified by the quality and/or resolution of the images obtained through Google Earth Pro, which limit the
interpretation of scar limits.

 Figure 10. Comparison and correlation between the two methodologies used to estimate scar areas.

 In addition, the estimates in both methods show a high degree of correlation, with R² of 0.924, ie 92.4% of the
area via Google Earth Pro is explained by the area via drone imaging. This result allows to interpret that Equation
7 can be used to correct the estimate of the area made from the images of Google Earth Pro, allowing to use it as a
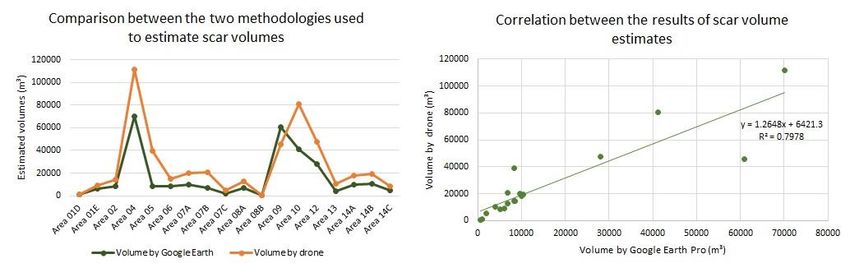
Revista Brasileira de Geomorfologia, v. 22, n. 2, 2021 309

tool. This is only possible due to the non-randomness of the differences between the areas obtained by drone
imaging and Google Earth Pro, ie the error (difference of results) was constant between the two estimates.
 The trend line obtained by the correlation between the results obtained for the two estimation methods is
presented in Figure 10 and Eq. (7), where is the area by drone imaging and the area by Google Earth.
 (7)

3.3. Scar volume estimation using drone imaging and RTK and comparison with estimated volumes in Google Earth Pro
 In order to estimate the volume generated by the landslides and a greater effectiveness in the accuracy of the
results, the characteristics of the scars were determined with the aid of the drone. The next step consisted of
processing the data in the Pix4D software. From the point cloud generated in Pix4D it was possible to make the
contours of the raised sections using the Global Mapper v17.0 software, to then estimate the scar volumes in the
AutoCAD Civil 3D software.
 For evaluation purposes, three situations were simulated for volume estimation: minimum volume,
represents the situation where the slope ridge coincides with the landslide scar plane; average volume, represents
the average situation between the slopes of the maximum volume and the slopes of the minimum volume and
maximum volume, characterized by the situation in which the slope has a 90 ° angle.
 Thus, in this study, the average volume value was adopted, as this estimate avoids obtaining underestimated
or overestimated values. In addition, the average volume was estimated based on the neighboring slopes in the
adjacent regions, then approaching the natural topography that existed before. Figure 11a shows the schematic
drawing of the pre-event topography construction process and Figure 11b shows the process of estimating the
volume mobilized in AutoCAD Civil 3D.

 Figure 11. a) Schematic drawing of the pre-event topography construction process. b) Process of estimating the
 volume mobilized in AutoCAD Civil 3D.

 Comparison of scar volume values estimated from Google Earth Pro images and drone imaging is presented
in Table 4. Thus, it was possible to correlate the volumes obtained by the two techniques, presented in Figures 12
and discussed below.
 Table 4. Comparison between scar volume values obtained by the estimates.

 Stretch Scar Volume from Google Volume from Variation (%)
 Earth Pro (m³) drone (m³)
 521+000D Area 01D 925,58 1075,45 16,19
 521+000E Area 01E 6057,01 9077,61 49,87
 518+790 Area 02 8565,88 14318,97 67,16
 493+600 Area 04 70192,69 111367,9 58,66
 521+522 Area 05 8301,33 39253,27 372,86
Revista Brasileira de Geomorfologia, v. 22, n. 2, 2021 310

 520+950 Area 06 8380,68 14656,41 74,88
 535+419A Area 07A 9693,11 20231,6 108,72
 535+419B Area 07B 6866,63 20908,74 204,5
 535+419C Area 07C 1929,28 5107,38 164,73
 515+300A Area 08A 6914,08 12646,43 82,91
 515+300B Area 08B 574,46 759,92 32,28
 513+200 Area 09 60920,99 45604,12 25,14
 482+299 Area 10 41189,72 80760,65 96,07
 519+900 Area 12 28119,61 47816,28 70,05
 524+108 Area 13 4033,24 10348,99 156,59
 511+670A Area 14A 9973,59 18214,63 82,63
 511+670B Area 14B 10326,51 19141,94 85,37
 511+670C Area 14C 5134,19 8686,81 69,2

 Figure 12. Comparison and correlation between the two methodologies used to estimate scar volumes.

 From the analysis of the correlation graph between the two methodologies (Figure 12) it was possible to
observe that the results obtained had a correlation of about 80%. Which allows us to interpret that the volume
estimate by Google Earth Pro does not present such a satisfactory correlation as for the results obtained in the area
calculation, about 92%, when compared to the results obtained with the drone survey.
 The estimates that contributed to the decrease in the correlation value were for the points with the highest
volume values. This result allows us to conclude that with regard to volume estimation by Google Earth Pro, the
higher the volume value the worse the volume estimate will be. In order to observe the differences in the
estimates, a comparison was made between the values of the scar volumes obtained by the estimates. The result
showed that the volume estimates via drone imaging presented higher values than the volume estimates via
Google Earth, except for the Area 09.
 Regarding the deviations found between the two estimates (drone x Google Earth Pro) it was observed that
the largest deviations occurred in sections that presented higher scar volume values, highlighting the areas 04, 05,
10 and 12, which was expected, due to the size of the scars that causes greater errors in the volume estimates.

4. Conclusions
 Two remote sensing techniques were used to collect the geometric parameters, area and volume of the slopes
of EFVM, Google Earth Pro and image by drone. Estimates of scars areas using Google Earth Pro and drone
imaging showed a high correlation degree, with a R² of 0.924. This result allows us to conclude the methodology
for estimating areas through Google Earth Pro presents satisfactory results.
 However, for the estimates of landslide volume in the scars studied, the methodology used by Google Earth
Pro presented values that were underestimated when compared to results obtained by drone imaging. This can be
justified by the pixel size of some Google Earth Pro images that can correspond to up to 900 m² (30x30m),
Revista Brasileira de Geomorfologia, v. 22, n. 2, 2021 311

consequently, the volume estimates by the two methods presented a correlation of 0.798; which represents a
satisfactory degree of correlation.
 This study showed through the relationships obtained that area estimates using Google Earth are more
accurate than volume estimates. The high precision and technology in the drone's tools combined with
positioning with RTK allow better estimates, but Google Earth is still, currently, a tool more accessible to
specialists. Volume estimates through Google Earth can be used, however, carefully, as it was found that the
method does not have a good adhesion to the real topographic surface.
 Currently, photogrammetric products have gotten space in the market, especially for the easy data
acquisition and the large amount of information an aerial image can provide. The use of drones has proved to be
an effective and direct geotechnical approach tool for the monitoring and surveying of landslides and, even if it is
restricted because of, the different geological sites for large-scale works, such as EFVM, it can contribute to
geological risk management. Despite the considerations made, the construction of models for the landslides
estimation is not a trivial assignment, because of the number and nature of the qualitative and quantitative
variables that are related to this phenomenon.
Contribuições dos Autores: Concepção, Denise de Fátima Santos da Silva e Rosyelle Cristina Corteletti; metodologia, Denise
de Fátima Santos da Silva e Rosyelle Cristina Corteletti; software, Denise de Fátima Santos da Silva, Roberto Almeida Cunha
Filgueiras e Allan Erlikhman Medeiros Santos; validação, Denise de Fátima Santos da Silva e Allan Erlikhman Medeiros Santos
; análise formal, Denise de Fátima Santos da Silva, Rosyelle Cristina Corteletti e Allan Erlikhman Medeiros Santos; pesquisa,
Denise de Fátima Santos da Silva, Rosyelle Cristina Corteletti, Roberto Almeida Cunha Filgueiras e Allan Erlikhman Medeiros
Santos; recursos, Rosyelle Cristina Corteletti e Roberto Almeida Cunha Filgueiras; preparação de dados, Denise de Fátima
Santos da Silva; escrita do artigo, Denise de Fátima Santos da Silva e Allan Erlikhman Medeiros Santos; revisão, Rosyelle
Cristina Corteletti; supervisão, Rosyelle Cristina Corteletti; aquisição de financiamento, Rosyelle Cristina Corteletti e Roberto
Almeida Cunha Filgueiras. Todos os autores leram e concordaram com a versão publicada do manuscrito.

Financiamento: Esta pesquisa foi financiada pela Universidade Federal de Ouro Preto e pela GERPRO.

Agradecimentos: Os autores agradecem o apoio técnico da GERPRO na realização dos trabalhos de campo durante a pesquisa.

Conflito de Interesse: Os autores declaram não haver conflito de interesse. Os financiadores não tiveram interferência no
desenvolvimento do estudo; na coleta, análise ou interpretação dos dados; na redação do manuscrito, ou na decisão de
publicar os resultados.

Referências
1. AVANZI, G. D.; GIANNECCHINI, R.; PUCCINELLI, A. The Influence of the geological and
 geomorphological settings on shallow landslides. An example in a temperature climate environment: the
 june 19, 1996 event in northwestern Tuscany (Italy). Engineering Geology, v. 73, p. 215-228, 2004. DOI:
 10.1016/j.enggeo.2004.01.005
2. BALEK, J.; BLAHUT, J. A critical evaluation of the use of an inexpensive camera mounted on a recreational
 unmanned aerial vehicle as a tool for landslide research. Landslides, v. 14, p. 1217–1224, 2017. DOI:
 10.1007/s10346-016-0782-7
3. CARDINALI, M.; REICHENBACH, P.; GUZZETTI, F.; ARDIZZONE, F.; ANTONINI, G.; GALLI, M.;
 CACCIANO, M.; CASTELLANI, M.; SALVATI, P. A geomorphological approach to estimate landslide
 hazard and risk in urban and rural areas in Umbria, central Italy. Natural Hazards and Earth System
 Sciences, v. 2 (1–2), p. 57–72, 2002.
4. CHANG-CHUN, L.; GUANG-SHENG, Z.; TIAN-JIE, L.; A-DU, G. Quick image-processing method of UAV
 without control points data in earthquake disaster area. Trans Nonferrous Met Soc China, v. 21, p. 523–528,
 2011. DOI: 10.1016/S1003-6326(12)61635-5
5. COLOMINA, I.; MOLINA, P. Unmanned aerial systems for photogrammetry and remote sensing: a review.
 ISPRS J Photogramm Remote Sens, v. 92, p. 79–97, 2014. DOI: 10.1016/j.isprsjprs.2014.02.013
6. CORRÊA, G. P.; KOBIYAMA, M.; GIGLIO, J. N.; MICHEL, G. P.; TASCA, F. A.; GOERL, R. F. Análise
 geométrica para estimativa de volume em fluxo de detritos. V Seminário Internacional de Defesa Civil
 (DEFENCIL), 5., 2009, São Paulo. Anais... São Paulo: Defesa Civil. 2009. p. 1-10.
7. CORTELETTI, R. C. Metodologia para análise de riscos geológico-geotécnicos em ferrovias: Estrada de
 Ferro Carajás (EFC), 1ª Ed. Ouro Preto: UFOP, 2017, 222p.
Revista Brasileira de Geomorfologia, v. 22, n. 2, 2021 312

8. CPRM. 2000. Programa Levantamentos Geológicos do Brasil.SE.23-Z-D-IV – Folha Itabira. Carta Geológica,
 escala 1:100.000.
9. CRUDEN, D. M.; VARNES, D. J. Landslide types and process. In: TURNER, A.K.; SCHUSTER, R.J. (Eds.),
 Landslides: Investigation and Mitigation. Special Report 247. Washington: National Academy Press, 1996.
 p. 36–75.
10. EISENBEISS, H.; SAUERBIEr, M. Investigation of uav systems and flight modes for photogrammetric
 applications. Photogramm Rec, v. 26(136), p. 400–421, 2011. DOI: 10.1111/j.1477-9730.2011.00657.x
11. FAN, F.; XU, Q. SCARINGI, G.; ZHENG, G, HUANG, R.; DAI, L.; JU, Y. The “long” runout rock avalanche in
 Pusa, China, on August 28, 2017: a preliminary report. Landslides, v. 16, n. 139, p. 139-154, 2018. DOI:
 10.1007/s10346-018-1084-z
12. GARCÍA-DELGADO, H.; MACHUCA, S.; MEDINA, E. Dynamic and geomorphic characterizations of the
 Mocoa debris flow (March 31, 2017, Putumayo Department, southern Colombia). Landslides, 16: 597, 2019.
 DOI: 10.1007/s10346-018-01121-3
13. GALLI, M.; ARDIZZONE, F.; CARDINALI, M.; GUZZETTI, F.; REICHENBACH, P. Comparison of landslide
 inventory maps. Geomorphology, v. 94, p. 268–289, 2008. DOI: 10.1016/j.geomorph.2006.09.023
14. GUNS, M.; VEERLE, V. Shifts in landslide frequency-area distribution after forest conversion in the tropical
 Andes. Anthropocene, v. 6, p. 75-85, 2014. DOI: 10.1016/j.ancene.2014.08.001
15. GUPTA, S. K.; SHUKLA, D. P. Application of drone for landslide mapping, dimension estimation and its 3D
 reconstruction. Journal of the Indian Society of Remote Sensing, v. 46, p. 903-914, 2018. DOI:
 10.1007/s12524-017-0727-1
16. GUTHRIE, R. H. The effects of logging on frequency and distribution of landslides in three watersheds on
 Vancouver Island, British Columbia. Geomorphology, v. 43(3–4), p. 273–292, 2002. DOI:
 10.1016/S0169-555X(01)00138-6
17. GUTHRIE, R.H.; EVANS, S.G. Analysis of landslide frequencies and characteristics in a natural system,
 coastal British Columbia. Earth Surface Processes and Landforms, v. 29, p. 1321–1339, 2004. DOI:
 10.1002/esp.1095
18. GUZZETTI, F.; CARRARA, A.; CARDINALI, M.; REICHENBACH, P. Landslide hazard evaluation: a review
 of current techniques and their application in a multi-scale study. Geomorphology, v. 31, p. 181–216, 1999.
 DOI: 10.1016/S0169-555X(99)00078-1
19. GUZZETTI, F.; REICHENBACH, P.; CARDINALI, M.; GALLI, M.; ARDIZZONE, F. Probabilistic landslide
 hazard assessment at the basin scale. Geomorphology, v. 72, p. 272–299, 2005. DOI:
 10.1016/j.geomorph.2005.06.002
20. GUZZETTI, F.; ARDIZZONE, F.; CARDINALI, M.; GALLI, M.; REICHENBACH, P.; ROSSI, M. Distribution
 of landslides in the Upper Tiber River basin, central Italy. Geomorphology, v. 96, p. 105–122, 2008. DOI:
 10.1016/j.geomorph.2007.07.015
21. GUZZETTI, F.; ARDIZZONE, F.; CARDINALI, M.; ROSSI, M.; VALIGI, D. Landslide volumes and landslide
 mobilization rates in Umbria, central Italy. Earth and Planetary Science Letters, v. 279(3–4), p. 222–229, 2009.
 DOI: 10.1016/j.epsl.2009.01.005
22. GUZZETTI, F.; MONDINI, A.C.; CARDINALI, M.; FEDERICA, F.; SANTANGE, M.; CHANG, K.T.
 Landslide inventory maps: New tools for an old problem. Earth-Science Reviews. v. 112, p. 42–66, 2012. DOI:
 10.1016/j.earscirev.2012.02.001
23. HOVIUS, N.; STARK, C. P.; ALLEN, P. A. Sediment flux from a mountain belt derived by landslide mapping.
 Geology, v. 25, p. 231–234, 1997. DOI: 10.1130/0091-7613(1997)0252.3.CO;2
24. IMAIZUMI, F.; SIDLE, R.C. Linkage of sediment supply and transport processes in Miyagawa Dam
 catchment, Japan. Journal Geophysical Research, v. 112 (F03012), 2007. DOI: 10.1029/2006JF000495
25. IMAIZUMI, F.; SIDLE, R.C.; KAMEI, R. Effects of forest harvesting on the occurrence of landslides and debris
 flows in steep terrain of central Japan. Earth Surface Processes and Landforms, v. 33, p. 827–840, 2008. DOI:
 10.1002/esp.1574
26. INNES, J. N. Lichenometric dating of debris-flow deposits in the Scottish Highlands. Earth Surface Processes
 and Landforms, v. 8, p. 579–588, 1983. DOI: 10.1002/esp.3290080609
27. IVERSON, R. M.; GEORGE, D. L.; ALLSTADT, K.; REID, M. E.; COLLINS, B. D.; VALLANCE, J. W.; S. P.
 SCHILLING, J. W. GODT, C. M. CANNON, C. S. MAGIRL, R. L. BAUM, J. A. COE, W. H. SCHULZ,
Revista Brasileira de Geomorfologia, v. 22, n. 2, 2021 313

 BOWER, J. B. Landslide mobility and hazards: Implications of the 2014 Oso disaster. Earth and Planetary
 Science Letters, v. 412, p. 197–208, 2015. DOI: 10.1016/j.epsl.2014.12.020
28. JAMES, M. R.; ROBSON, S. Straightforward reconstruction of 3D surfaces and topography with a camera:
 accuracy and geoscience application, J Geophys Res, v. 117, p.03-17, 2012. DOI: 10.1029/2011jf002289
29. KARKI, K.; SULTAN, M.; AL-SEFRY, S. A.; ALHARBI, H. M.; EMIL, M. K.; ELKADIRI, R.; ALFADAIL, E. A.
 A Remote Sensing–based Intensity-Duration Curve, Faifa Mountains, Saudi Arabia. Nat. Hazards Earth Syst.
 Sci. Discuss. 2018. DOI: 10.5194/nhess-2018-282
30. KENNEDY, D.; BISHOP, M.C. Google Earth and the archaeology of Saudi Arabia. A case study from the
 Jeddah area. Journal of Archaeological Science, v. 38 (6), p.1284-1293, 2011. DOI: 10.1016/j.jas.2011.01.003
31. KORUP, O. Distribution of landslides in southwest New Zealand. Landslides, v. 2, p. 43–51, 2005. DOI:
 10.1007/s10346-004-0042-0
32. LEE, S.; CHWAE, U.; KYUNGDUCK M. Landslides susceptibility mapping by correlation between
 topography and geological structure: the Janghung area, Korea. Geomorphology, v. 46, p.149-162, 2002. DOI:
 10.1016/S0169-555X(02)00057-0
33. LEE, Y. F. E CHI, Y.Y. Rainfall-induced landslide risk at Lushan, Taiwan. Engineering Geology, v. 123, p.
 113–121, 2011. DOI: 10.1016/j.enggeo.2011.03.006
34. LOPES, E. E. Proposta Metodológica para Validação de Imagens de Alta Resolução do Google Earth para a
 Produção de Mapas. Dissertação (Mestrado em Engenharia Civil) – Programa de Pós-Graduação em
 Engenharia Civil – Universidade Federal de Santa Catarina, Florianópolis. 2009, 127p.
35. MALAMUD, B. D.; TURCOTTE, D. L.; GUZZETTI, F.; REICHENBACH, P. Landslide inventories and their
 statistical properties. Earth Surface Processes and Landforms, v. 29, p. 687–711, 2004. DOI: 10.1002/esp.1064
36. MENDONÇA, F. B.; DINIZ, N. C.; BAPTISTA G. M. M. Mapa de risco de movimentos gravitacionais de
 massa, obtidos por meio de inventário de cicatrizes de deslizamentos no trecho 4 do trem de alta velocidade
 brasileiro. Rev. Bras. De Geologia de Engenharia e Ambiental, São Paulo, p. 73 – 94, 2012.
37. PARCAK, S. H. Satellite Remote Sensing for Archaeology. 1ª Ed. Londres: Routledge Press, 2009, 320p.
38. PANIZZA, A. C.; FONSECA, F. P. Técnicas de Interpretação Visual de Imagens. GEOUSP- Espaço e Tempo,
 São Paulo, v. 30, p. 30 – 43, 2011.
39. PEPPA, M. V.; MILLS, J. P.; MOORE, P.; MILLER, P. E.; CHAMBERS, J. E. Brief communication: landslide
 motion from cross correlation of UAV-derived morphological attributes. Nat Hazards Earth Syst Sci, v. 17, p.
 2143–2150, 2017. DOI: 10.5194/nhess-17-2143-2017
40. PEROTTO-BALDADIVIEZO, H. L.; THUROW, T. L.; SMITH C. T.; FISHER, R. F.; WU, X. B. Gis Based Spatial
 analysis and modelling for landslides hazard assessment in steeplands, southern Honduras. Agriculture,
 Ecosystems and Enviromental, v. 103(1), p. 165-176, 2004. DOI: 10.1016/j.agee.2003.10.011
41. PETERNEL, T.; KUMELJ, S.; OSTIR, K.; KOMAC, M. Monitoring the Potoška planina landslide (NW
 Slovenia) using UAV photogrammetry and tachymetric measurements. Landslides, v. 14, p. 395–406, 2017.
 DOI: 10.1007/s10346-016-0759-6
42. POLANCO, L. S. E. Correlações Empíricas para Fluxo de Detritos (Master Thesis). UFRJ, Rio de Janeiro,
 Brazil, 2010, 110 p.
43. REICHENBACH, P.; GALLI, M.; CARDINALI, M.; GUZZETTI, F.; ARDIZZONE, F. (2005). Geomorphologic
 mapping to assess landslide risk: concepts, methods and applications in the Umbria Region of central Italy.
 In: GLADE, T.; ANDERSON, M.G.; Crozier, M.J. (Eds.), Landslide Risk Assessment, 1ª Ed. John Wiley,
 Chichester, p. 429–468. DOI: 10.1002/9780470012659.ch15
44. RICE, R. M.; CORBETT, E. S.; BAILEY, R. G. Soil slips related to vegetation, topography, and soil in Southern
 California. Water Resources Research, v. 5 (3), p. 647–659, 1969.
45. ROSSI, G.; NOCENTINI, M.; LOMABRDI, L.; VANNOCCI, P.; TANTERI, L.; DOTTA, G.; BICOCCHI, G.;
 SCADUTO, G.; SALVATICI, T.; TOFANI, V.; MORETTI, S.; CASAGLI, N. Integration of multicopter drone
 measurements and ground-based data for landslide monitoring. In: AVERSA, S.; CASCINI, L.; PICARELLI,
 L.; SCAVIA, C. (Eds.). Landslides and Engineered Slopes. Experience, Theory and Practice. 1ª Ed. Napoli:
 CRC Press, 2016. p. 1745-1750. DOI: 10.1201/9781315375007-206
46. ROSSI, G.; TANTERI, L.; TOFANI, V.; VANNOCCI, P.; MORETTI, S.; CASAGLI, N. Multitemporal UAV
 surveys for landslide mapping and characterization. Landslides, v. 15(5), p. 1045–1052, 2018. DOI:
 10.1007/s10346-018-0978-0
Revista Brasileira de Geomorfologia, v. 22, n. 2, 2021 314

47. SADR, K.; RODIER, X. Google Earth, GIS and stone-walled structures in southern Gauteng, South Africa.
 Journal of Archaeological Science, v. 39 (4), p. 1034-1042, 2012. DOI: 10.1016/j.jas.2011.11.024
48. SILVA, D. C.; TOONSTRA, G. W. A.; SOUZA, H. L. S.; PEREIRA, T. A. J. Qualidade de Ortomosaicos de
 Imagens de Vant processados Com os Softwares APS, PIX4D e PHOTOSCAN. In: V Simpósio Brasileiro de
 Ciências Geodésicas e Tecnologias da Geoinformação, 5., 2014, Recife. Anais... Recife: UFPE. 2014. p. 747-756.
49. SILVA, D. F. S.; SANTOS, A. E. M.; FERREIRA, B. T.; PEREIRA, T.M.; CORTELETTI, R. C. Cluster analysis
 for slope geotechnical prioritization of intervention for the Estrada de Ferro Vitória-Minas. REM -
 International Engineering Journal, v. 71(2), p. 167-173, 2018. DOI: 10.1590/0370-44672017710173
50. SIMONETT, D. S. (1967). Landslide distribution and earthquakes in the Bewani and Torricelli Mountains,
 New Guinea. In: JENNINGS, J.N.; MABBUTT, J.A. (Eds.), Landform Studies from Australia and New
 Guinea. 1ª Ed. Cambridge University Press, Cambridge, p. 64–84.
51. TEN BRINK, U. S.; GEIST, E. L.; ANDREWS, B. D. Size distribution of submarine landslides and its
 implication to tsunami hazard in Puerto Rico. Geophysical Research Letters, v. 33, p. 1-4, 2006. DOI:
 10.1029/2006GL026125
52. TRAVELLETTI, J.; DELACOURT, C.; ALLEMAND, P.; MALET, J. P.; SCHMITTBUHL, J.; TOUSSAINT, R.;
 BASTARD, M. Correlation of multi-temporal ground-based optical images for landslide monitoring:
 application, potential and limitations. ISPRS J Photogramm Remote Sensors v. 70, p. 39–55, 2012. DOI:
 10.1016/j.isprsjprs.2012.03.007
53. TURNER, D.; LUCIEER, A.; JONG, S. M. Time series analysis of landslide dynamics using an unmanned
 aerial vehicle (UAV). Remote Sensors, v. 7, p. 1736–1757, 2015. DOI; 10.3390/rs70201736
54. VALAGUSSA, A.; MARC, O.; FRATTINI, P.; CROSTA, G. B. Seismic and geological controls on
 earthquake-induced landslide size. Earth and Planetary Science Letters, v. 506, p. 268–281, 2019. DOI:
 10.1016/j.epsl.2018.11.005
55. VALE (2017). Sobre a Vale. Notícias. Disponível em:
 . Accessed in: jan. 2017.
56. VANACÔR, R. N. Sensoriamento Remoto e Geoprocessamento aplicados ao mapeamento das áreas
 susceptíveis a movimentos de massa na região nordeste do Estado do Rio Grande do Sul. Dissertação
 (Mestrado em Sensoriamento Remoto) – Programa de Pós-Graduação em Sensoriamento Remoto,
 Universidade Federal do Rio Grande do Sul, Porto Alegre. 2006. 132p.

 Esta obra está licenciada com uma Licença Creative Commons Atribuição 4.0
 Internacional (http://creativecommons.org/licenses/by/4.0/) – CC BY. Esta licença
 permite que outros distribuam, remixem, adaptem e criem a partir do seu trabalho,
 mesmo para fins comerciais, desde que lhe atribuam o devido crédito pela criação
 original.
You can also read