2018 YEAR END RENTAL APARTMENT REPORT - www.cbre.ca/lance.coulson - CBRE National Apartment Group
←
→
Page content transcription
If your browser does not render page correctly, please read the page content below
PLAZA 500
 NATIONAL APARTMENT GROUP                               NEW CBRE LISTING

 BRITISH COLUMBIA

2018
YEAR END RENTAL
APARTMENT REPORT

                              MAKING CENTS OF THE MARKET VOL 3
                            Cbre national apartment group | BC
                              www.cbre.ca/lance.coulson
PREFACE                                                                                                                      TABLE OF
CBRE is pleased to release the 2018 Year End Metro Vancouver Multi-Family Market Report, the
most current and comprehensive Multi-Family data available for the Metro Vancouver & Victoria
market. Produced by Lance Coulson and Greg Ambrose of the National Apartment Group,
this report has been assembled to empower the decision making of all multi-family owners,
                                                                                                                             CONTENTS
Potential Purchasers and Professionals interested in the Vancouver and Victoria markets.

This report has been prepared with current data sourced from a comprehensive survey of
                                                                                                                             01   CBRE NATIONAL APARTMENT GROUP
                                                                                                                                  Meet the team
various data sources. As the global leader in commercial real estate, CBRE understands the
critical nature of transparency in a marketplace.

Data contributions and validations to this publication were made by:
                                                                                                                             02   Executive summary
                                                                                                                                  & economic overview

  CBRE RESEARCH                                                        LAND TITLE & SURVEY AUTHORITY OF BC                   03   THE VANCOUVER
                                                                                                                                  RENTAL MARKET
  CBRE NATIONAL APARTMENT GROUP                                        BC ASSESSMENT

  ALTUS GROUP / REALNET                                                CMHC                                                  04   2018 APARTMENT SALES
                                                                                                                                  DOWNTOWN VANCOUVER
                                                                                                                                  Vancouver east
Whatever your multi-family data needs may be, please feel free to reach out to us. We have
the most comprehensive data on the market and can provide information on a macro or micro                                         KITSILANO & KERRISDALE
level based on city, neighborhood, location, age, size, proximity to transit, and demographics.                                   MARPOLE & S. GRANVILLE
CBRE is a global leader in Commercial Real Estate and Lance Coulson Personal Real Estate                                          BURNABY
Corporation is a leader in Metro Vancouver and Victoria Apartment Sales 2012-2016, with a total                                   TRI-CITIES
sales value in excess of $1 Billion!* With a network of Multi-family Apartment Professionals
across the country and 450 corporate offices globally, our experience, network and exposure is
                                                                                                                                  New Westminster
second to none allowing us to provide our clients with the greatest market exposure available.                                    SURREY & WHITE ROCK
                                                                                                                                  FRASER VALLEY
We welcome your inquiries and encourage you to contact us with any questions.
                                                                                                                                  NORTH SHORE
                                                                                                                                  Greater VICTORIA

  LANCE COULSON                                     GREG AMBROSE
  PERSONAL REAL ESTATE CORPORATION
  Executive Vice President                          Senior Sales Associate
  CBRE Limited                                      CBRE Limited
  604 662 5141                                      604 662 5178
  lance.coulson@cbre.com                            greg.ambrose@cbre.com
*SOURCE: REALNET and CBRE (January 1, 2012 – December 31, 2016 combined). Includes transactions with co-operating Brokers.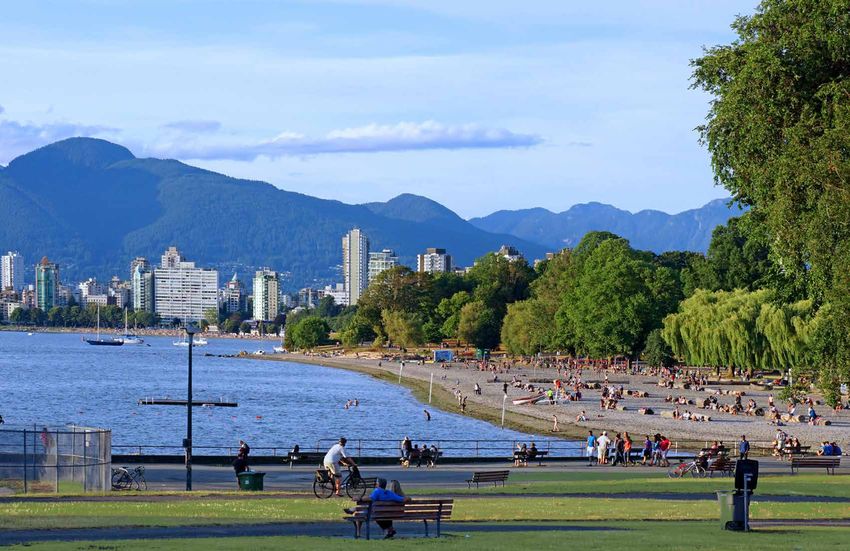
CBRE LIMITED CANADA’S NATIONALLY 01 LOCALLY
CBRE NATIONAL APARTMENT GROUP - BC
NATIONAL CBRE’s National Apartment Group Canada is comprised TRACK RECORD SINCE 2015
APARTMENT
of 16 sales professionals providing the highest level of
commitment and expertise in the marketing and sale of 78 Multi-Family Buildings Sold*
multi-family assets across the country. Through our ten
2,953 Multi-Family Units Sold*
GROUP
Canadian offices, we have assembled a collection of
highly skilled sales professionals resulting in CBRE NAG
being one of the largest and most successful integrated
With Sales Value in Excess of $774 Million**
Multi-Family sales team in Canada.
CBRE National Apartment Group - BC is part of the CBRE Limited Canadian National Apartment Team with senior qualified members located
in each of the major markets across Canada. Members on this Team speak on a regular basis and share information. The Canadian National
Apartment group platform allows us to reach farther to source out credible buyers, including foreign capital sources, for our Vendors and
provide valuable insight that cannot be matched by our competitors.
Over the past 5 years, the CBRE National Apartment Group - British Columbia, led by Lance Coulson has held a commanding presence in the
Metro Vancouver Rental Apartment Market, consistently leading in total transactions and setting new benchmarks for pricing that was thought
by the marketplace to be unattainable.
We are a team with significant local knowledge and expertise that is globally connected, a combination that is indispensable and creates the
most competitive marketing program. It is this experience and market knowledge that gives us credibility with potential purchasers when
discussing past sales, capitalization rate trends, market rental rates and development assumptions, allowing our Team to consistently achieve
maximum value for our Vendors. ”We know more because we do more!”
EDMONTON, AB
*SOURCE: REALNET and CBRE (January 1, 2015 – December 31, 2018 combined ). Includes transactions with co-operating Brokers.
BRADLEY GINGERICH ** Sales are from Greater Vancouver and Greater Victoria
Senior Vice President
HALIFAX, NS
CHRIS CARTER Meet the CBRE National Apartment Group British Columbia Team
Associate Vice President
OTTAWA, ON
WINNIPEG, MB
NICO ZENTIL
TREVOR CLAY PERSONAL REAL ESTATE CORPORATION
VANCOUVER, BC Sales Associate Associate Vice President
LANCE COULSON WATERLOO REGION, ON
PERSONAL REAL ESTATE CORPORATION
Executive Vice President MARTIN COTE MONTREAL, QC
PERSONAL REAL ESTATE CORPORATION
CALGARY, AB Sales Associate BENOIT POULIN
Senior Vice President
GRANT POTTER LONDON, ON
Associate Vice President
KEVIN MACDOUGALL TORONTO, ON
PERSONAL REAL ESTATE CORPORATION
Associate Vice President DAVID MONTRESSOR
PERSONAL REAL ESTATE CORPORATION
Sales Associate
CBRE’s National Apartment Group was formed with one purpose in mind:
To offer a Canada-wide professional approach to managing the orderly disposition of multi-residential assets.
Our exclusive full-service approach has generated over $13 Billion in sales since 2000, with individuals and institutional clients
across the country. Covering all major Canadian markets, the National Apartment Group is the largest and most successfully integrated
team in Canada. Every mandate, regardless of size, receives the same exclusive approach to realize maximum value for our
clients. Our unmatched understanding of the multi-residential market generates superior results for multi-residential owners.
Our transactional success assures our clients that we can deliver. Back Row: Justin Pang - Financial Analyst, Angel Wong - Administrative Assistant, Christina Martino - Marketing Coordinator
Front Row: Greg Ambrose - Senior Sales Associate, Lance Coulson (PREC) - Executive Vice President
2018 RENTAL APARTMENT REPORT 02 2018 RENTAL APARTMENT REPORT 02
EXECUTIVE METRO VANCOUVER GREATER VANCOUVER ECONOMIC OVERVIEW
SUMMARY market statistics Following the 12-year high of 4.5% real GDP growth last year, the
economy is forecast to moderate and expand by 2.6% in 2018 and 2.4%
Consumer spending is forecast to moderate slightly due to slower job
gains, higher interest rates, high household debt and a cooler housing
The bullish nature of the multi-family investment market that prevailed in 2019. While still outpacing the province’s projected growth of 2.4% and market. However, growth in the wholesale and retail trade industries this
over the past few years was reflected in the first half of 2018, when
a further $732.5 million in sales were registered, but sales tapered off
slightly during the second half of the year. This isn’t surprising given the
2018 2.1% in 2018 and 2019, Vancouver’s economic moderation is expected
to be led by a cooling housing market impacting the construction and
Finance, Insurance, and Real Estate (FIRE) industries.
year are still expected to remain robust at 5.2% and 3.0%, respectively.
Following its 23-year high growth of 8.6% last year, the transportation
and warehousing industry is projected to moderate to a healthy 3.4%
up-tick in interest rates combined with the market uncertainty created
by the NDP and their Rental Housing Task Force. Pricing remains TRANSACTIONS The labour market is forecast to remain tight over the next few years and 2.5% in 2018 and 2019.
stable as constrained supply continues to be the overriding theme and employment gains of 1.1% and 1.6% are expected for 2018 and
in the Greater Vancouver Area (GVA) multi-family market and looking
ahead will continue to dictate market performance as relatively few
new rental developments are brought to market. Demand continues
110
NUMBER OF TRANSACTIONS
$1.31B
DOLLAR VOLUME OF TRANSACTIONS
2019. In addition, an aging population is anticipated to drive down the
unemployment rate to 4.4% in 2018 and average 4.5% thereafter to 2022.
The manufacturing sector has been a strong contributor to GDP over
the past few years and is expected to continue with growth of 5.2%
forecast in 2018. Supporting growth in the industry will be Seaspan’s
The housing market is a key part of the FIRE industry in Vancouver. continued shipbuilding contracts as well as STEMCELL’s construction of
to outstrip supply and market conditions are forecast to remain (APPROX)
High home prices, rising interest rates and government cooling a $45 million state-of-the-art manufacturing facility in Burnaby.
tight. The real vacancy rate remains below 1% across many metro
measures have slowed the city’s housing market and subsequently its
Vancouver municipalities as renters find greater difficulty shifting into A cooling housing market is expected to constrain housing starts in
FIRE industry. New additional cooling measures such as the increase
homeownership given the tighter credit conditions, and the government
has done little to effectively incentivize an increase in the supply of new
rental properties.
VACANCY 1.0% $1,385 in the foreign-buyers tax to 20%, the increase in property tax rates for
homes over $3 million and an increase in the tax on vacant properties
Vancouver to 24,900 units and 21,300 units in 2018 and 2019, leading to
an overall decline in housing starts for the province.
RENT
VANCOUVER CMA VANCOUVER CMA to 2.0% will further hinder Vancouver’s housing market. As a result, FIRE Notable non-residential construction projects include a new $130
2018 saw a year scattered with political headlines and taxes. In VACANCY RATE AVG MONTHLY RENT industry growth is forecast at 2.1% in 2018 before rising to 3.1% in 2019. million container storage and logistics facility in Tsawwassen, the $500
February, the NDP Government delivered its first budget which million Burrard Place mixed-used development and the $1.4 billion
The professional, scientific and technical services industry in Vancouver
included numerous taxes aimed at real estate. October brought Pattullo Bridge replacement.*
is forecast to remain strong and expand by 4.7% in 2018 before
about the municipal elections, bringing new mayors and councils into
power, many of which ran on affordable housing platforms and may
CAP RATE BOND RATE moderating to 2.5% in 2019.
have attracted the attention of the newest voting demographic, the
Millennials, who now outnumber Baby Boomers at the polls. The year
ended with the Bank of Canada’s benchmark interest rate at 1.75%, the
2.25% - 3.25%
CAP RATE RANGE FOR
2.41% *SOURCE: The Conference Board of Canada’s Autumn 2018 Metropolitan Outlook Report
highest it has been in a decade with further rate increases projected % LOW-RISE BUILDINGS
CANADIAN MORTGAGE BOND
(5 YEAR) YEAR END RATE
for 2019.
There were a number of changes introduced by the NDP in 2018, including
ECONOMIC INDICATORS - VANCOUVER 2015 2016 2017 2018F 2019F 2020F 2021F 2022F
extending the required notice period to end tenancy to complete major
construction or renovations, and reducing the maximum allowable rent 2.00% - 3.00% 2.59% REAL GDP GROWTH AT MARKET PRICES ($2007 MILLIONS)
ANNUAL GROWTH (%)
$126,052
4.1%
$131,081
4.0%
$137,030
3.1%
$140,531
2.6%
$143,898
2.4%
$147,073
2.2%
$150,364
2.2%
$153,599
2.2%
increase for 2019 from 4.5% to 2.5% in an attempt to assist renters in a CAP RATE RANGE CANADIAN MORTGAGE BOND
tight rental market. As Vancouver’s population continues to grow due % FOR HI-RISE BUILDINGS (10 YEAR) YEAR END RATE
TOTAL EMPLOYMENT (000s) 1,299 1,359 1,401 1,416 1,439 1,457 1,484 1,508
to a healthy economy and positive migration patterns, many hope the ANNUAL GROWTH (%) 1.7% 4.7% 3.1% 1.1% 1.6% 1.3% 1.9% 1.6%
government will realize the real problem is one of supply and demand
and the only real solution is increasing supply. Very little new market SOURCE: REALNET, CMHC, CBRE Research and CMB.
UNEMPLOYMENT RATE (%) 5.9% 5.4% 4.6% 4.4% 4.5% 4.6% 4.5% 4.5%
rental product was built between 1972 and today due to tax policy
changes introduced in the early 1970’s, changes which disincentivized PERSONAL INCOME PER CAPITA ($) $45,391 $46,888 $48,928 $50,868 $52,774 $54,282 $56,040 $57,665
investment in new rental development, which is built by private
investment. If the government seriously intends to address the supply POPULATION (000s) 2,510 2,542 2,571 2,602 2,636 2,672 2,709 2,749
problem and stimulate the development of new rental properties, it ANNUAL GROWTH (%) 1.1% 1.3% 1.1% 1.2% 1.3% 1.4% 1.4% 1.5%
could be suggested that they need to look at tax policy changes to make
it more attractive to incentivize private investment to start building new RETAIL SALES ($ MILLIONS) $34,548 $37,572 $40,266 $41,155 $42,735 $44,256 $45,939 $47,563
rental product again. ANNUAL GROWTH (%) 11.1% 8.8% 7.2% 2.2% 3.8% 3.6% 2.8% 3.5%
For 2019, lack of supply will continue to drive rents higher, CPI ANNUAL GROWTH (%) 1.2% 2.2% 2.2% 2.9% 2.0% 1.9% 2.0% 2.1%
investment demand will remain brisk, product availability will
remain somewhat limited, and market fundamentals will remain
strong; all of which will be in keeping with the bullish phase of
the cycle.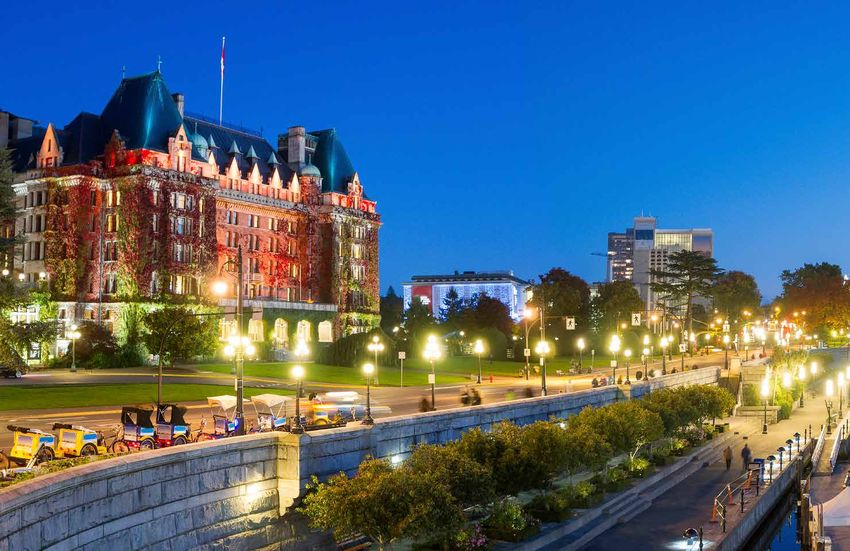
2018 RENTAL APARTMENT REPORT 03 2018 RENTAL APARTMENT REPORT 03
WHAT TO LOOK FOR IN 2019 MARKET INFLUENCERS 2018 MARKET INFLUENCERS: a closer look
• Rising Interest Rates: In 2018 The Bank of Canada increased the Municipal Elections
overnight to 1.75% and further rate increases are projected for 2019. 2018 was a notable year in the sphere of influence over the Metro Vancouver rental market as municipal elections brought new councils and
• Further Government Intervention: The provincial government mayors to power, many of which ran on platforms focused on affordability and increased rental housing. Vancouver Mayor Kennedy Stewart
municipal elections brought new councils
formed the Rental Housing Task Force (RHTF) that has made a professed that housing affordability was his number one priority with promises to expedite construction of 25,000 affordable homes which may
and mayors to power relieve some of the pressure on Vancouver’s tight rental market.
number of recommendations to improve security and fairness to
renters and landlords. Interest Rates
• Further Changes to the Residential Tenancy Act: In the addition Bank of Canada raised benchmark In October 2018, the Bank of Canada (BoC) raised the benchmark interest rate by 25 basis points to 1.75%, which is the highest rate in a decade,
to changes effectively eliminating fixed term tenancies, increasing interest rates to 1.75% dating back to December 2008. Since July 2017, the key rate has been increased four times during the 15-month span and the BoC may implement
the notice period to end tenancy in order to complete renovations further hikes in 2019. The rising interest rates negatively impact the buying power of would be home-owners, causing them to rent for longer
and reducing the maximum allowable rent increase, further periods which will continue to put downward pressure on vacancy rates. Historically speaking however, the current interest rates are still
changes can be expected. MAXIMUM ALLOWABLE RENT INCREASE CAP favourably low for apartment investors.
• Municipalities introducing rental only zones: Under legislation REDUCED FROM 4.5% TO 2.5% Maximum Allowable Rent Increase Cap
passed in May 2018, municipalities can zone undeveloped land In September 2018, the BC Government reduced the maximum allowable rent increase for 2019 from 4.5% down to 2.5%. As a point of reference,
for rental housing, mandate a certain percentage of units on any the average annual maximum rent increase rate for the 10-Year period of 2009 to 2018 was 3.26%. Though this may provide tenants temporary
piece of undeveloped property to be rental, or force existing rental Increased notice to vacate tenants for
financial relief, there may be long term negative effects to the supply of new rental product as the reduced annual rent growth negatively impacts
properties to remain rental only after redevelopment. renovations the financial viability of new rental developments.
• Moderated Economy: Following the 12-year high of 4.5% real GDP Increased Notice to Vacate for Renovations
growth in the economy is forecast to moderate and expand by 2.4%
Escalating Operating Expenses and The Provincial Government revised the required Notice to End Tenancy to complete major construction, major renovations or repairs from Two
in 2019 led by a cooling housing market impacting the construction $
reduced rental rate growth Months to Four months. Further, tenants that were given notice because of renovations or repairs will be given first right-of-refusal. Clarity is
and finance, Insurance and real estate (FIRE) industries. needed for setting a timeline for a tenant’s decision to exercise a right of first refusal and defining the new rent.
• The 2019 Federal Election on October 21, 2019. Escalating Operating Expenses
Increasing operating expenses are not unfamiliar to landlords. Though, the recent implementation of further rent control policies such as ending
the enforceability of fixed term tenancies and reducing the allowable rent increase amount hinder landlords’ ability to keep rents at market levels.
2018 HIGHLIGHTS *Source: Vancouver Economic Commission, CBRE Research, BC Government Press Release, CMHC
Vancouver CMA Rental Market Report 2018
The recent announcement of a combined 6.3% increase in property tax and utilities in the city of Vancouver have landlords now contending with
the possibility of negative income growth and disincentivize landlords from completing required building maintenance.
2018 was a year scattered with political headlines, with a mix of ups, More Politics: The BC Municipal Elections were held on October 20th, with
downs and uncertainty in the Metro Vancouver real estate market.
More Taxes: In February 2018, the NDP Government delivered its first
a large majority of the political platforms across various Metro Vancouver
municipalities focused on housing and affordability. Major Metro Vancouver Concrete high-rise apartment sales headlines 2018
budget, where they announced a number of changes and initiatives. municipalities such as Vancouver, Surrey, and Burnaby all saw changes in
leadership. In another robust year for multi-family investment sales in Vancouver,
Below are policy changes & implementations that specifically pertain concrete high-rise apartments sales comprised a large majority of the sales
to real estate in BC: More Weed: In October 2018, recreational cannabis was legalized, making in terms of total dollar value transacted. From our CBRE research, there were
• Speculation Tax: Applicable to foreign and domestic homeowners Canada the 2nd country to do so after Uruguay and creating new demand 9 concrete towers which comprised of 831 units that traded in 2018 for nearly
that do not pay income tax in BC. The 2018 Tax Rate was 0.5% of for industrial and retail space and new challenges for landlords. half a billion dollars. Interestingly, 8 of the 9 towers were in the West End
assessed value with the tax rate increasing to 2.0% in 2019 neighborhood within the City of Vancouver with the remaining tower located
Although 2018 was a year of disruptors, the fundamentals for in North Vancouver. Most notably, 4 of the 9 towers were part of a portfolio
• Foreign Buyers Tax: Increased from 15% to 20% and extended to apartment buildings remain strong. According to the 2018 CMHC sale (3 in the West End and 1 in North Vancouver) that was purchased by
other areas outside of Metro Vancouver Rental Market Report, the Vancouver CMA saw an increase of 6.2% Starlight Investments for nearly $250MM.
• Property Transfer Tax (PTT): The incremental tax rate for in average rents with a further 7% increase predicted for 2019 and
vacancy rates hovering around 1.0%, making it one of the tightest As vacancy rates in Vancouver remain compressed, high-quality concrete
residential homes with a fair market value of more than $3MM
rental markets in Canada with relatively little new rental supply being rental apartment assets are highly sought-after as these assets provide
increased from 3% to 5%
built. As Vancouver continues to attract influential companies such investors the ability to achieve scale and efficiency as well as the opportunity
More Uncertainty: Along with these measures, which were aimed at as Facebook and Amazon, and grows its population through positive to capture the significant rental upside available. In 2018, this was evidenced
cooling the surging residential market, the BC Government appointed migration patterns, multi-family assets can be expected to remain by concrete tower sales making up more than a third of the total sales value
a Rental Housing Task Force (RHTF), designed to improve security and one of the most in demand asset classes for commercial real estate in Metro Vancouver and we believe the demand for concrete assets will
fairness for renters and landlords. The RHTF completed a full review of the in Canada, particularly in an environment like Vancouver. continue to be prevalent as we head into 2019. The adjacent photo is of
Residential Tenancy Act, the first full review in over 16 years. Following Plaza 500, a new CBRE listing. Plaza 500 is a 118-suite Rental Apartment
their process, the Task Force produced a list of 23 recommendations, building with a 4-storey commercial podium, located on the corner of
creating further uncertainty for landlords. Cambie Street & West 12th Avenue in Vancouver.
Plaza 500 | New CBRE Listing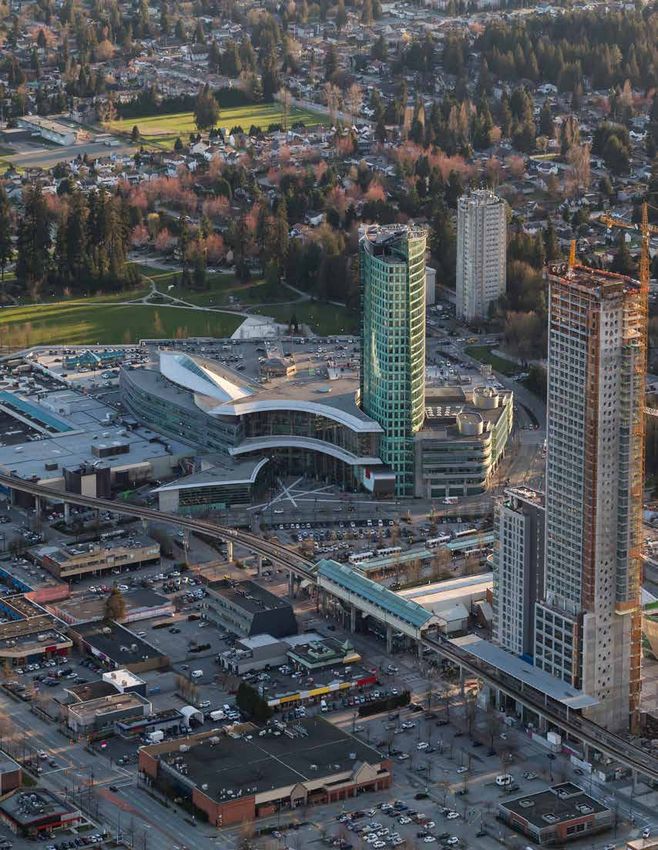
2018 RENTAL APARTMENT REPORT                                                                                                                   03     2018 RENTAL APARTMENT REPORT                                                                                                           03

Rental Housing Task Force Recommendations                                                                                                             Renovated buildings: to buy or not to buy
In the Spring of 2018, Premier John Horgan appointed a Rental Housing Task Force (RHTF), chaired by MLA Spencer Chandra Herbart,                                                                                                               304 Third Avenue, New Westminster, BC
designed to advise on how to improve security and fairness for renters and landlords throughout the Province. The RHTF consulted with                 Given that a majority of the rental stock in Metro Vancouver is comprised
the public, landlords, tenants and stakeholders to identify how to balance BC’s tenancy laws and create fair processes while addressing               of approximately 60-year-old buildings, it should be no surprise that these
the challenges of affordability.                                                                                                                      properties are near the end of their useful life. As a result, some investors
In the Summer of 2018, the RHTF expedited recommendations on the annual allowable rent increase, and the provincial government                        have taken on the daunting task of completing a full retrofit of some of
amended the maximum allowable rent increase formula which had previously been calculated on inflation plus 2% which would have                        these buildings and breathing new life into them.
resulted in a 4.5% allowable rent increase in 2019. The Government reduced this from 4.5% down to 2.5%.                                               So, how do investors analyze these opportunities? Well, like most
In December, the RHTF made the following 23 recommendations for review by the Provincial Government. Recommendation #10                               investments, it comes down to the numbers, but it is also important to
maintains that the rent continues to be tied to the renter and not the unit, which is positive, as this was of concern to the industry.               understand the extent of the renovations, if the updates were just cosmetic
The Provincial Government is expected to respond in 2019…stay tuned!                                                                                  and confirming if the major capital expenditure items such as plumbing,
                                                                                                                                                      electrical, roof and windows were addressed during the renovation.
                                                                                                                                                      These buildings are obviously going to sell at higher price per door
                                                                                                                                                      values compared to similar unrenovated buildings, so the more important
 FULL LIST OF RENTAL housing TASK FORCE RECOMMENDATIONS                                                                                               metric is matching the return on investment with the investors’ yield
                                                                                                                                                      requirements. In analyzing these opportunities for clients, in addition to
 1.    Stop renovictions.                                                   13. Improve fairness and consistency of the residential tenancy           the initial Cap Rate on the acquisition, we also look at the return on equity
 2.    Work with local governments to develop tenant compensation               branch dispute resolution hearings process by recording all           and the return on equity with principal repayment.
       and relocation guidelines in the case of demolition of purpose-          hearings.
                                                                                                                                                      Once an investor is comfortable with the extent of the work completed
       built rental to reduce dislocation, and homelessness of affected     14. Improve procedural fairness by expanding review considerations        and the return on investment, he or she will typically enjoy acquiring a
       tenants.                                                                 to include more grounds for review.                                   turn-key building with terrific curb appeal, no deferred maintenance or
 3.    Set a clear timeline for a tenant’s decision on the use of a right   15. Require landlords who are filing for eviction for cause, or for       major capital requirements, and tenants in place paying market rents.
       of first refusal.                                                        renovation, to provide all evidence with any eviction notice to the
 4.    Implement a B.C.-wide rent bank system for low-income people.            affected tenants                                                                                                                                      Fully renovated rental building sold by CBRE in June 2018.
 5.    Strengthen enforcement of the law, including implementing            16. If repairs are needed to maintain a rental home and the landlord
       a clear process for making, investigating and reporting                  is refusing to make them in a timely way, have the residential
       administrative penalty complaints.                                       tenancy branch proactively reduce the rent of affected tenants
 6.    Strengthen penalties for breaking the law, including refusal of
       service for outstanding administrative penalties.                    17.
                                                                                until the repairs are completed.
                                                                                  Allow email as a form of notice of service between landlord and
                                                                                  tenants.
                                                                                                                                                       nEW POLITICAL CLIMATE
 7.    Investigate ways to provide affordable access to bailiff services
       in smaller and more remote communities.                              18. Speed up the return of damage deposits to tenants by allowing                                                                                 The municipal elections in October 2018 brought new councils and
                                                                                tenants to make a direct request to the residential tenancy branch                                                                            mayors to power who all have housing as their central priority.
 8.    Investigate other options to increase the repayment rate for             for the damage deposit where no damage has been found and
       damages, non-payment of rent and other storage costs if ordered                                                                                                                                                        In the City of Vancouver, newly elected Mayor, Kennedy Stewart, ran
                                                                                reported by the landlord.                                                                                                                     on a platform which includes adding 25,000 new affordable rental
       by the residential tenancy branch.
                                                                            19. Work with the insurance industry to see if rent guarantee                                                                                     homes over the next 10 years, reducing permit and processing times,
 9.    Increase the availability of currently empty strata housing by           insurance, and other improvements to insurance coverage, might                                                                                and improving data on property ownership.
       eliminating a strata corporation’s ability to ban owners from            be provided for landlords in B.C.
       renting their own strata units.                                                                                                                                                                                        In Burnaby, newly elected mayor Mike Hurley has recently created
                                                                            20. Undertake a review to simplify the regulations relating to a                                                                                  a “Task Force on Community Housing” to make recommendations
 10. Maintain rent tied to the renter, not the unit.                            landlord’s obligation to store abandoned personal property.                                                                                   on how to address the lack of supply and affordability of housing.
 11.   Work with local governments to develop, implement and enforce        21. Ensure it is clear for all landlords and renters where to go to get                                                                           The task force includes members from city council, tenant advocacy
       short-term rental rules to better protect long-term rental stock.        help for all forms of residential tenancy                                                                                                     groups, builders, and local unions.
 12. Make the residential tenancy branch more responsive, accessible        22. Address the specific needs of non-profit housing and supportive                                                                               Newly re-elected Victoria Mayor, Lisa Helps aims to build at least
     and proactive with more opportunities to learn from and educate            housing providers in the residential tenancy act.                                                                                             2,000 new affordable housing units in the region and looks to utilize
     landlords and renters on their rights and responsibilities.                                                                                                                                                              co-op housing, community land trusts and developing on city lands
                                                                            23. Ensure manufactured home park rules are clear and                                                                                             as an approach to tackle housing issues.
                                                                                understandable. Clarify what occurs when park rules conflict with
                                                                                lease or contract rules.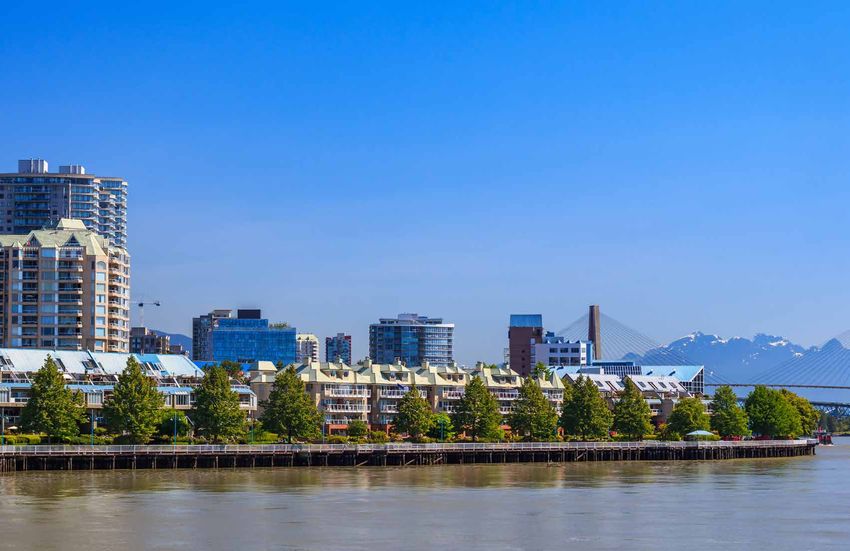
CITY OF VANCOUVER
This year, the City of Vancouver published “Housing Vancouver Strategy”, a 10-year housing
strategy for the City of Vancouver to foster a diverse, vibrant community.

The strategy is based on 3 core principles:
                                                                                                                                                                                                                   04
1.   Create the Right Supply and address speculative demand;
2. Protect existing affordable housing for the future;
                                                                                                                                                                    Downtown vancouver
3. Ensure support for vulnerable residents.

Broadway Subway Officially Approved
Earlier this year, funding was approved for the Millennium Line Broadway Extension, a direct
extension of the existing Millennium Line including 6 new stations ending at Arbutus Street.

                                                                                                                                                               2016                          2017                          2018
In anticipation, the City of Vancouver has begun preparing to start work on a new two-year
process to create a Broadway area plan which will integrate new housing, jobs, and amenities
with future transit and around the Broadway Subway.

                                                                                                                          NUMBER OF SALES                          16                            8                            10

                                                                                                                      AVG PRICE PER SUITE                          $709,785                      $504,874                     $561,424

                                                                                                        AVG MONTHLY RENTAL RATES                                   $1,461                        $1,499                       $1,609

                                                                                                                     AVG VACANCY RATES                             0.8%                          1.2%                         1.1%
                                                                                               While we have included images and details on apartment sales, land sales and strata wind-up sales, the statistics include only the apartments sales.
VANCOUVER DOWNTOWN - 2018                                                                                              04   VANCOUVER DOWNTOWN - 2018                                                                                           04

SOLD                                             SOLD                                             SOLD                      SOLD                        SOLD                                   SOLD
1065 BURNABY ST                                  1433 BURNABY ST                                  1450 BURNABY ST           1755 HARO ST                1005 JERVIS ST                         1550 HARWOOD ST
                                                                                                                            $74,459,574                 $65,115,338                            $6,160,000
$13,300,000                                      $15,050,000                                      $18,350,000
                                                                                                                            $539,562 PER SUITE          $482,336 PER SUITE                     $1,540,000 PER SUITE
$886,667 PER SUITE                               $501,667 PER SUITE                               $436,905 PER SUITE
                                                                                                                            138 UNITS                   135 UNITS                              4 UNITS
15 UNITS                                         30 UNITS                                         42 UNITS
SOLD AS LAND/DEVELOPMENT SITE

                                                                                                                                                        1640                            1650

SOLD                                             SOLD                                             SOLD                      SOLD                        SOLD                                   SOLD
1537 BURNABY ST                                  1057 BARCLAY ST                                  1958 BARCLAY ST           1170 HARWOOD ST             1640 & 1650 ALBERNI ST                 1830 ALBERNI ST
                                                                                                                            $35,982,000                 $130,000,000                           $52,000,000
$8,750,000                                       $19,000,000                                      $19,650,000
                                                                                                                            $580,355 PER SUITE          $1,969,697 PER SUITE                   $981,132 PER SUITE
$364,583 PER SUITE                               $655,172 PER SUITE                               $467,857 PER SUITE
                                                                                                                            62 UNITS                    66 UNITS                               53 UNITS
24 UNITS                                         29 UNITS                                         42 UNITS                                              SOLD AS LAND/DEVELOPMENT SITE          SOLD AS LAND/DEVELOPMENT SITE (STRATA WIND-UP)
                                                 SOLD AS LAND/DEVELOPMENT SITE (STRATA WIND-UP)

SOLD                                             SOLD                                             SOLD                      SOLD
1063–75 BARCLAY ST                               1045 HARO ST                                     1501 HARO ST              1022 NELSON ST
$113,206,508                                     $164,750,000                                     $81,850,843               TBA
$2,830,163 PER SUITE                             $1,023,292 PER SUITE                             $568,409 PER SUITE        TBA PER SUITE
40 UNITS                                         161 UNITS                                        144 UNITS                 199 UNITS
SOLD AS LAND/DEVELOPMENT SITE (STRATA WIND-UP)   SOLD AS LAND/DEVELOPMENT SITE (STRATA WIND-UP)
PURPOSE-BUILT RENTALS ON THE RISE
Grandview - Woodland
Earlier this year, Vancouver City Council approved a 10-storey residential building near the northwest corner

                                                                                                                                                                                                                                                             04
of the intersection of East Broadway and Commercial Drive, just west of Metro Vancouver’s busiest transit hub.
The project will include 93 residential units, including 47 secured market rental units and 46 market strata
units. The building was considered under the City’s 2016-approved Grandview-Woodland Community Plan.

                                                                                                                                                                                                                                Vancouver EASt

                            Artistic rendering of the redevelopment at 1619-1651 East Broadway, Vancouver. (IBI Group Architects)

Hastings – Sunrise
A rezoning application has been submitted to the City of Vancouver for consideration under the Rental 100
                                                                                                                                                                                              2016                            2017                           2018
Secured Market Rental Housing Policy on the site at 2601 – 2619 East Hastings Street, the northeast corner
of the intersection of East Hastings Street and Penticton Street. The proposed 6-storey development would
include 47 secured market residential rental units above 6,300 sq. ft. of retail and restaurant space and retain                                        NUMBER OF SALES                           28                              27                             20
the Spanish-style heritage façade currently located at the rear of the site on Penticton Street next to the laneway.
                                                                                                                                                    AVG PRICE PER SUITE                           $306,012                        $394,530                       $385,145

                                                                                                                                          AVG MONTHLY RENTAL RATES                                $1,050 - $1,223                 $1,171 - $1,259                $1,238 - $1,350

                                                                                                                                                   AVG VACANCY RATES                              0.8%                            0.4% - 0.7%                    0.2% - 0.5%
                                                                                                                                    While we have included images and details on apartment sales, land sales and strata wind-up sales, the statistics include only the apartments sales.

               Artistic rendering of the proposed redevelopment at 2601-2619 East Hastings, Vancouver. (Studio One Architecture)
EAST VANCOUVER - 2018                                                                                    04

                                                                                                              SOLD                                          SOLD                                          SOLD
                                                                                                              3618 & 3622 E HASTINGS ST                     1908 E 5TH AVE                                825 E 8TH AVE
                                                                                                              $5,725,000                                    $3,285,000                                    $14,350,000
                                                                                                              $636,111 PER SUITE                            $469,286 PER SUITE                            $350,000 PER SUITE
SOLD                               SOLD                               SOLD                                    9 UNITS                                       7 UNITS                                       41 UNITS
                                                                                                              IMAGE SOURCE: GOOGLE STREET VIEW                                                            IMAGE SOURCE: GOOGLE STREET VIEW
2285 TRIUMPH ST                    2065 TRIUMPH ST                    2115 TRIUMPH ST
$6,000,000                         $5,500,000                         TBA
$375,000 PER SUITE                 $366,667 PER SUITE                 TBA PER SUITE
16 UNITS                           15 UNITS                           18 UNITS
                                   IMAGE SOURCE: GOOGLE STREET VIEW

                                                                                                              SOLD                                          SOLD                                          SOLD
                                                                                                              254 E 12TH AVE                                243 E 13TH AVE                                275 E 13TH AVE
                                                                                                              $12,200,000                                   $6,180,000                                    $9,450,000
                                                                                                              $348,571 PER SUITE                            $561,818 PER SUITE                            $410,870 PER SUITE
SOLD                               SOLD                               SOLD                                    35 UNITS                                      11 UNITS                                      23 UNITS

2185 OXFORD ST                     2333 OXFORD ST                     225 NORTH GARDEN DR
$2,672,000                         $16,260,870                        $5,739,130
$334,000 PER SUITE                 $318,841 PER SUITE                 $318,841 PER SUITE
8 UNITS                            51 UNITS                           18 UNITS
IMAGE SOURCE: GOOGLE STREET VIEW

                                                                                                              SOLD                                          SOLD                                          SOLD
                                                                                                              95 E 14TH AVE                                 2919-2949 PRINCE EDWARD ST                    3038 COMMERCIAL DR
                                                                                                              $9,000,000                                    $3,900,000                                    TBA
                                                                                                              $346,154 PER SUITE                            $487,500 PER SUITE                            TBA PER SUITE
                                                                                                              26 UNITS                                      8 UNITS                                       10 UNITS
                                                                                                                                                                                                          RESIDENTIAL LAND | IMAGE SOURCE: GOOGLE STREET VIEW
                                                                                                              IMAGE SOURCE: GOOGLE STREET VIEW

SOLD                               SOLD                               SOLD
2067 PANDORA ST                    736 E BROADWAY                     866 & 868 E BROADWAY
$3,200,000                         $2,800,000                         $3,050,000
$400,000 PER SUITE                 $466,667 PER SUITE                 $381,250 PER SUITE
8 UNITS                            6 UNITS                            8 UNITS
                                                                                                              SOLD                                          SOLD                                          SOLD
IMAGE SOURCE: GOOGLE STREET VIEW                                      IMAGE SOURCE: GOOGLE STREET VIEW        4655-4673 MAIN ST                             2215 E HASTINGS ST                            2778 & 2788 E HASTINGS ST
                                                                                                              $5,900,000                                    $19,650,000                                   $16,500,000
                                                                                                              $536,364 PER SUITE                            $517,105 PER SUITE                            $458,333 PER SUITE
                                                                                                              11 UNITS | IMAGE SOURCE: GOOGLE STREET VIEW   38 UNITS | IMAGE SOURCE: GOOGLE STREET VIEW   36 UNITS | IMAGE SOURCE: GOOGLE STREET VIEW
04
kITSILANO & KERRISDALE
KITSILANO 2016 2017 2018 KERRISDALE 2016 2017 2018
NUMBER OF SALES 16 10 8 NUMBER OF SALES 7 8 0
AVG PRICE PER SUITE $423,313 $546,430 $529,637 AVG PRICE PER SUITE $551,300 $561,457 N/A
AVG MONTHLY RENTAL RATES $1,391 $1,446 $1,527 AVG MONTHLY RENTAL RATES $1,453 $1,657 $1,693
AVG VACANCY RATES 1.2% 0.7% 0.8% AVG VACANCY RATES 2.0% 1.5% 1.5%
While we have included images and details on apartment sales, land sales and strata wind-up sales, the statistics include only the apartments sales.VANCOUVER WEST - 2018 04 VANCOUVER WEST - 2018 04
SOLD
KERRISDALE 6310 E BLVD
$13,300,000
$1,108,333 PER SUITE
KITSILANO
12 UNITS
SOLD AS LAND/DEVELOPMENT SITE
IMAGE SOURCE: REALNET
SOLD SOLD
2358 YORK AVE 2425 YORK AVE
$7,800,000 $12,100,000
$709,091 PER SUITE $504,167 PER SUITE
11 UNITS 24 UNITS
Kitsilano Beach
SOLD SOLD SOLD
1406 LABURNUM ST 1875 YEW ST 2225 W 1ST AVE
$6,825,000 $10,500,000 $6,500,000
$682,500 PER SUITE $420,000 PER SUITE $541,667 PER SUITE
10 UNITS 25 UNITS 12 UNITS
IMAGE SOURCE: GOOGLE STREET VIEW
SOLD SOLD SOLD
2050 W 2ND AVE 2035 W 5TH AVE 2293 W 6TH AVE
$10,500,000 $4,600,000 $6,850,000
$500,000 PER SUITE $511,111 PER SUITE $570,833 PER SUITE
21 UNITS 9 UNITS 12 UNITS
IMAGE SOURCE: GOOGLE STREET VIEW04
SOUTH GRANVILLE & MARPOLE
S. GRANVILLE 2016 2017 2018 MARPOLE 2016 2017 2018
NUMBER OF SALES 17 10 3 NUMBER OF SALES 12 5 6
AVG PRICE PER SUITE $410,060 $571,673 $470,906 AVG PRICE PER SUITE $352,694 $362,500 $392,626
AVG MONTHLY RENTAL RATES $1,355 $1,419 $1,497 AVG MONTHLY RENTAL RATES $985 $1,009 $1,080
AVG VACANCY RATES 0.7% 0.7% 0.5% AVG VACANCY RATES 0.6% 0.8% 0.5%
While we have included images and details on apartment sales, land sales and strata wind-up sales, the statistics include only the apartments sales.SOUTH GRANVILLE & MARPOLE- 2018 04 SOUTH GRANVILLE & MARPOLE - 2018 04
SOLD SOLD
1379 W 71ST AVE 8580 OAK ST
SOUTH
$3,550,000 $8,800,000
$443,750 PER SUITE $517,647 PER SUITE
8 UNITS 17 UNITS
GRANVILLE
IMAGE SOURCE: GOOGLE STREET VIEW IMAGE SOURCE: GOOGLE STREET VIEW
SOLD SOLD
230 W 10TH AVE 1110 W 10TH AVE
$9,546,200 $10,420,000
$502,432 PER SUITE $453,043 PER SUITE
23 UNITS
SOUTH GRANVILLE
19 UNITS
As a sign of potential future densification to come, the City of Vancouver recently approved the process to begin
the review of the Broadway Plan in anticipation of the upcoming SkyTrain Millennium Line extension, which
is slated for completion in 2025. In the meantime however, there have already been rental projects that have
received increased density and relaxation in permitted heights in the South Granville area that serve as prime
MARPOLE examples of the City’s testament to increasing rental residential units & housing alternatives, particularly in
transit-oriented corridors. Most notably, the Rental 100 project located at 2538 Birch Street (Birch Street & West
Broadway) received re-zoning approval in January 2018 that will permit the development of a 17-Storey rental
SOLD SOLD tower at a density of 7.07x FSR, providing for a total of 158 residential units. As of December 2018, the developer
1025 W 13TH AVE 8616 FREMLIN ST is currently in the pre-application stage of a subsequent proposed re-zoning that would see the increase of the
$4,050,000 $2,840,000 density & height to 10.7x FSR and 28-Storeys, respectively. Instead of Rental 100, the developer is aiming to re-zone
$450,000 PER SUITE $355,000 PER SUITE
9 UNITS this under the Moderate Income Rental Housing Pilot Program (MIRHPP), which is another incentivized program
8 UNITS
IMAGE SOURCE: GOOGLE STREET VIEW for rental projects put forward by the City of Vancouver.
Combining the future Millennium Line extension, Broadway Plan review and the consistently tightening
rental market in Vancouver, South Granville is one of the more highly sought-after areas in Metro Vancouver
for apartment investors. Further, as both institution and private investors look for scale and long-term quality
assets, concrete rental apartments have become extremely attractive, as evidenced by the volume and size of
the concrete apartment sales in 2018. As a result, CBRE National Apartment Group – BC and National Investment
Team Vancouver is extremely pleased to present to the market the offering at 500 W 12th Avenue (Plaza 500), a
fully retrofitted concrete mixed-use trophy asset with future re-development potential on Cambie Street & W
12th Avenue. The property is situated only minutes from the Broadway Corridor, providing for an abundance of
SOLD SOLD SOLD amenities and the Broadway-City Hall SkyTrain Station, the future interchange station for the Canada Line and the
8623 SELKIRK ST 8860 MONTCALM ST 8632 CARTIER ST Millennium Line. As home ownership becomes more challenging and migration to Greater Vancouver continues
$11,880,000 $7,800,000 $4,000,000 to increase, rental assets within close proximity to rapid transit in the Vancouver core such as Plaza 500 makes
$383,226 PER SUITE $325,000 PER SUITE $363,636 PER SUITE for a stable yet attractive investment opportunity.
31 UNITS 24 UNITS 11 UNITS
IMAGE SOURCE: GOOGLE STREET VIEW IMAGE SOURCE: GOOGLE STREET VIEW04
burnaby
2016 2017 2018
NUMBER OF SALES 10 2 3
AVG PRICE PER SUITE $280,553 $272,549 $313,597
AVG MONTHLY RENTAL RATES $1,105 $1,178 $1,238
AVG VACANCY RATES 0.8% 0.6% 2.0%
While we have included images and details on apartment sales, land sales and strata wind-up sales, the statistics include only the apartments sales.BURNABY - 2018 04 BURNABY - 2018 04
SOLD SOLD SOLD SOLD SOLD SOLD
7110 LINDEN AVE 7265 ARCOLA ST 7227 ARCOLA ST 6630 TELFORD AVE 6622 WILLINGDON AVE 6688 WILLINGDON AVE
$8,400,000 $16,000,000 $11,350,000 $28,500,000 $14,500,000 $28,000,000
$280,000 PER SUITE $333,333 PER SUITE $315,278 PER SUITE $712,500 PER SUITE $537,037 PER SUITE $622,222 PER SUITE
30 UNITS 48 UNITS 36 UNITS 40 UNITS 27 UNITS 45 UNITS
SOLD AS LAND/DEVELOPMENT SITE SOLD AS LAND/DEVELOPMENT SITE SOLD AS LAND/DEVELOPMENT SITE
SOLD SOLD
6730 BURLINGTON AVE 6739 ROYAL OAK AVE
$11,100,000 $8,200,000
$616,667 PER SUITE $546,667 PER SUITE
18 UNITS 15 UNITS
SOLD AS LAND/DEVELOPMENT SITE SOLD AS LAND/DEVELOPMENT SITE
SOLD SOLD SOLD
7070 INLET DR 6645 DOW AVE 6730 DOW AVE
$32,500,000 $58,600,000 $5,900,000
$277,778 PER SUITE $1,465,000 PER SUITE $590,000 PER SUITE
117 UNITS 40 UNITS 10 UNITS
SOLD AS LAND/DEVELOPMENT SITE SOLD AS LAND/DEVELOPMENT SITE SOLD AS LAND/DEVELOPMENT SITE
BURNABY/METROTOWN
Canada Mortgage and Housing Corporation (CMHC) states that the City of Burnaby had a net loss of 889 rental
units between 2010 and 2018 – with Metrotown seeing the bulk of the deprivation. On November 5, Burnaby’s
new mayor, Mike Hurley, was sworn into office, pledging to change development in Metrotown by placing a
moratorium on redevelopment approvals and to create a Task Force on Community Housing with the mandate
of providing “recommendations to Burnaby City Council on innovative policies, directions and specific initiatives,
to increase the supply, diversity and affordability of housing in Burnaby.” The moratorium will remain in effect
SOLD SOLD SOLD until the Mayor’s task force presents a comprehensive plan in the form of a final report, expected in June 2019.
6675 & 6691 DOW AVE 4330 MAYWOOD ST 4495 IMPERIAL ST Council also passed a motion on December 3 to begin planning rental-only zoning implementations, officially
$43,275,000 $13,500,000 $4,300,000 making Burnaby the first municipality in BC to adapt rental zoning.
$1,138,816 PER SUITE $500,000 PER SUITE $537,500 PER SUITE
38 UNITS (COMBINED) 27 UNITS 8 UNITS
SOLD AS LAND/DEVELOPMENT SITE SOLD AS LAND/DEVELOPMENT SITE SOLD AS LAND/DEVELOPMENT SITE04
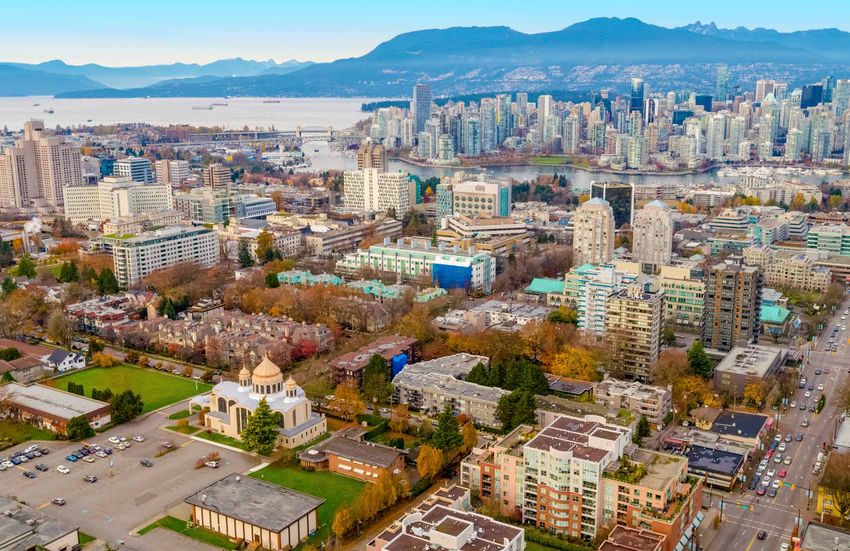
TRI-CITIES
PORT MOODY 2016 2017 2018 COQUITLAM 2016 2017 2018
NUMBER OF SALES 1 1 1 NUMBER OF SALES 2 6 2
AVG PRICE PER SUITE $295,000 $496,094 $487,500 AVG PRICE PER SUITE $199,815 $203,361 $228,125
AVG MONTHLY RENTAL RATES $984 $1,081 $1,178 AVG MONTHLY RENTAL RATES $984 $1,081 $ 1,178
AVG VACANCY RATES 1.7% 1.4% 1.2% AVG VACANCY RATES 1.7% 1.4% 1.2%
While we have included images and details on apartment sales, land sales and strata wind-up sales, the statistics include only the apartments sales.
Image Source: Greg Salter CC-BY-SA-3.0 (http://creativecommons.org/licenses/by-sa/3.0/)TRI-CITIES - 2018 04
COQUITLAM
THE TRI-CITIES
The 2018 municipal elections across the Tri-Cities made headlines as it elected two of the youngest mayors in Metro
Vancouver. Port Moody’s newest Mayor, 28-year-old Rob Vagramov is the youngest mayor in Metro Vancouver and one
SOLD SOLD SOLD of the youngest in Canada. Vagramov caught voters’ attention with his stance on slowing the pace of development
675 NORTH RD 605 COMO LAKE AVE 545 SYDNEY AVE in Port Moody, which was headed for rapid densification under the previous mayor’s guidance. Port Coquitlam also
$34,400,000 $26,839,000 $15,575,000 voted for change with a landslide victory for 33-year old Brad West, who received 86% of the popular vote, beat out
$452,632 PER SUITE $609,977 PER SUITE $432,639 PER SUITE three candidates to replace longtime mayor Greg Moore and is considered the second youngest Mayor in Metro
76 UNITS 44 UNITS 36 UNITS Vancouver. Throughout his campaign, West was outspoken about unchecked foreign capital hurting the cost of
SOLD AS LAND/DEVELOPMENT SITE SOLD AS LAND.DEVELOPMENT SITE (STRATA WIND-UP) SOLD AS LAND/DEVELOPMENT SITE (STRATA WIND-UP)
living in the area and the impact on the younger generation’s ability to purchase homes. For Coquitlam, Mayor Richard
Stewart has been re-elected, but has stated that this may be his last term.
SOLD SOLD SOLD
520 COTTONWOOD AVE 533 COTTONWOOD AVE 1035 HOWIE AVE
$22,500,000 $40,500,000 $10,100,000
$625,000 PER SUITE $413,265 PER SUITE $240,476 PER SUITE
36 UNITS 98 UNITS 42 UNITS
SOLD AS LAND.DEVELOPMENT SITE (STRATA WIND-UP) SOLD AS LAND/DEVELOPMENT SITE
PORT MOODY
Source: City News 1130, Metro Vancouver’s youngest mayors elected in the Tri-Cities
SOLD SOLD SOLD
668 WHITING WAY 1411 HACHEY AVE 1030 CECILE DR
$11,600,000 $4,500,000 $97,500,000
$682,353 PER SUITE $204,545 PER SUITE $487,500 PER SUITE
17 UNITS 22 UNITS 200 UNITS
SOLD AS LAND/DEVELOPMENT SITE IMAGE SOURCE: GOOGLE STREET VIEW IMAGE SOURCE: GOOGLE STREET VIEW
IMAGE SOURCE: Eviatar Bach [CC BY-SA 3.0 (https://creativecommons.org/licenses/by-sa/3.0)], from Wikimedia Commons04
NEW WESTMINSTER
2016 2017 2018
NUMBER OF SALES 21 14 19
AVG PRICE PER SUITE $170,592 $272,195 $257,573
AVG MONTHLY RENTAL RATES $993 $1,079 $1,206
AVG VACANCY RATES 0.4% 1.1% 1.6%
While we have included images and details on apartment sales, land sales and strata wind-up sales, the statistics include only the apartments sales.NEW WESTMINSTER - 2018 04
SOLD SOLD SOLD
520 NINTH ST 530 NINTH ST 420 ELEVENTH ST
$7,750,000 $3,600,000 $13,400,000
$234,848 PER SUITE $257,143 PER SUITE $219,672 PER SUITE
33 UNITS 14 UNITS 61 UNITS
SOLD SOLD SOLD
304 THIRD AVE 732 FIFTH AVE 1222 FIFTH AVE
$5,900,000 $5,750,000 $6,950,000
$347,059 PER SUITE $230,000 PER SUITE $330,952 PER SUITE
17 UNITS 25 UNITS 21 UNITS
SOLD SOLD SOLD
621 TWELFTH ST 1024 ST. ANDREWS AVE 610 BLACKFORD ST
$6,200,000 $6,420,000 $6,670,000
$344,444 PER SUITE $279,130 PER SUITE $230,000 PER SUITE
18 UNITS 23 UNITS 29 UNITS
IMAGE SOURCE: GOOGLE STREET VIEW
SOLD SOLD SOLD
1315 SEVENTH AVE 1210 SEVENTH AVE 329 SEVENTH ST
$9,250,000 $5,650,000 $4,830,000
$402,174 PER SUITE $353,125 PER SUITE $230,000 PER SUITE
23 UNITS 16 UNITS 21 UNITS
IMAGE SOURCE: GOOGLE STREET VIEW
SOLD SOLD SOLD
311 ASH ST 76 COBURG ST 325 WARD ST
$6,480,000 $3,500,000 $13,950,000
$240,000 PER SUITE $291,667 PER SUITE $244,737 PER SUITE
27 UNITS 12 UNITS 57 UNITS
IMAGE SOURCE: GOOGLE STREET VIEW
SOLD SOLD SOLD
404 SEVENTH ST 508 EIGHTH ST 520 EIGHTH ST SOLD
$9,250,000 $9,750,000 $12,650,000 410 EIGHT ST
$220,238 PER SUITE $232,143 PER SUITE $225,893 PER SUITE $3,200,000
42 UNITS 42 UNITS 56 UNITS $290,909 PER SUITE
11 UNITS | IMAGE SOURCE: GOOGLE STREET VIEW04
SURREY & WHITE ROCK
SURREY 2016 2017 2018 WHITE ROCK 2016 2017 2018
NUMBER OF SALES 2 4 3 NUMBER OF SALES 3 3 3
AVG PRICE PER SUITE $155,156 $177,257 $203,529 AVG PRICE PER SUITE $220,663 $295,966 $280,618
AVG MONTHLY RENTAL RATES $940 $1,005 $1,079 AVG MONTHLY RENTAL RATES $943 $1,026 $1,088
AVG VACANCY RATES 0.4% $0.6% 0.4% AVG VACANCY RATES 0.1% $0.6% 1.1%
While we have included images and details on apartment sales, land sales and strata wind-up sales, the statistics include only the apartments sales.SURREY & WHITE ROCK - 2018 04
SURREY
SURREY
Surrey is the fastest-growing city in BC, rendering the population gap between Surrey and Vancouver
non-existent by 2040, according to a report by the Surrey City Development Corp. (SCDC). This year, the
Light Rail Transit (LRT) vs. SkyTrain debate was one of the paramount issues in the Surrey election to
support current and future needs for the booming population. Surrey City Mayor Doug McCallum and
Langley City Mayor Val van den Broek expressed their preference for SkyTrain in their respective regions.
SOLD SOLD SOLD Following a recommendation submitted by Surrey City Council to oppose the previously approved Surrey
5875 177B ST 13265 104 AVE 17719 58A AVE Newton-Guildford (SNG) LRT project, TransLink’s Mayors’ Council voted to suspend all planning for the
$7,400,000 $13,650,000 $6,630,000
$185,000 PER SUITE $239,474 PER SUITE $170,000 PER SUITE project on November 15 in favour of a SkyTrain extension. The SNG LRT intended to connect the Surrey
40 UNITS 57 UNITS 39 UNITS Central SkyTrain station and transit hub with a light rail line along King George Boulevard and 104 Avenue.
IMAGE SOURCE: GOOGLE STREET VIEW IMAGE SOURCE: GOOGLE STREET VIEW IMAGE SOURCE: GOOGLE STREET VIEW
On December 13, the planning of the 16km Fraser Highway extension from King George SkyTrain station
WHITE ROCK
to Langley Centre was approved to begin, with an expected completion by 2025 – one year later than the
2024 opening of the cancelled SNG LRT. As a result of the expedited timeline of the SkyTrain extensions, the
proposed Fraser Highway B-Line was cancelled to redirect the funds towards improvement of the existing
96 B-Line servicing the Newton-Guildford corridors.
SOLD SOLD SOLD
15989 MARINE DR 1509 MARTIN ST 1485 FIR ST
$2,499,999 $11,700,000 $7,127,000
$277,778 PER SUITE $278,571 PER SUITE $285,080 PER SUITE
9 UNITS 42 UNITS 25 UNITS
SOLD AS LAND/STRATA WIND-UP IMAGE SOURCE: GOOGLE STREET VIEW IMAGE SOURCE: GOOGLE STREET VIEW
IMAGE SOURCE: GOOGLE STREET VIEW
Proposed route and station locations for the Fraser Highway SkyTrain extension. (TransLink)
White Rock, BC04
FRASER VALLEY SALES
2016 2017 2018
NUMBER OF SALES 13 17 12
AVG PRICE PER SUITE $101,495 $177,257 $234,840
AVG MONTHLY RENTAL RATES $757 $1,005 $ 924 - $1,214
AVG VACANCY RATES $1.5% $0.6% 1.0% - 1.6%
While we have included images and details on apartment sales, land sales and strata wind-up sales, the statistics include only the apartments sales.
Image Source: Juraj Tatár [CC BY-SA 3.0 (https://creativecommons.org/licenses/by-sa/3.0)]FRASER VALLEY - 2018 04 FRASER VALLEY - 2018 04
LANGLEY MAPLE RIDGE MISSION
SOLD SOLD SOLD SOLD SOLD SOLD
20669 EASTLEIGH CRES 5363 201 ST 22535 ROYAL CRES 2779 MAPLE ST 33250 2ND AVE 33359 2ND AVE
$2,745,000 $33,000,000 $1,650,000 $3,200,000 $3,100,000 $1,440,000
$392,143 PER SUITE $366,667 PER SUITE $150,000 PER SUITE $152,381 PER SUITE $134,783 PER SUITE $120,000 PER SUITE
7 UNITS 90 UNITS 11 UNITS 21 UNITS 23 UNITS 12 UNITS
IMAGE SOURCE: REALNET IMAGE SOURCE: GOOGLE STREET VIEW IMAGE SOURCE: REALNET IMAGE SOURCE: REALNET IMAGE SOURCE: GOOGLE STREET VIEW
CHILLIWACK
ABBOTSFORD RENTAL MARKET
SOLD SOLD SOLD
9240 CORBOULD ST 46101 PRINCESS AVE 5905 VEDDER RD
$3,380,000 $862,500 $1,220,000
$140,833 PER SUITE $123,214 PER SUITE $203,333 PER SUITE
24 UNITS 7 UNITS 6 UNITS
IMAGE SOURCE: REALNET IMAGE SOURCE: GOOGLE STREET VIEW IMAGE SOURCE: REALNET
ABBOTSFORD
SOLD SOLD SOLD
46915 YALE RD 32043 TIMS AVE 33554 SWITZER AVE
$1,350,000 $1,860,000 $2,788,888
SOURCE: CMHC RENTAL MARKET REPORT - ABBOTSFORD CMA
$112,500 PER SUITE $232,500 PER SUITE $139,444 PER SUITE
12 UNITS 8 UNITS 20 UNITS
IMAGE SOURCE: REALNET IMAGE SOURCE: GOOGLE STREET VIEW IMAGE SOURCE: REALNET04
NORTH SHORE
2016 2017 2018
NUMBER OF SALES 10 6 5
AVG PRICE PER SUITE $314,239 $406,728 $568,499
AVG MONTHLY RENTAL RATES $1,243 - $1,363 $1,333 - $1,502 $1,424 - $1,584
AVG VACANCY RATES 0.1% - 0.3% $0.9% - 1.3% 0.8% - 1.7%
While we have included images and details on apartment sales, land sales and strata wind-up sales, the statistics include only the apartments sales.NORTH SHORE SALES - 2018 04
NORTH
VANCOUVER
The City of North Vancouver revised and finalized their Official Community Plan (OCP) in 2014 to better
align the development of the City and its communities with the City’s overall long-term vision. The
OCP and the village plan called for increased density clustered in town centers and villages with
one of the City’s Planning Department and Council’s highest priorities being to increase the number
of rental residential options for its residents. The previous councils from 2011 to 2014 and 2014 to
SOLD SOLD SOLD 2018 approved 2,489 and 1,967 of net new units of housing, respectively. The Canada Mortgage and
3701-3817 PRINCESS AVE 115 E 1ST ST 269 W 4TH ST Housing Corp (CMHC) released its 2018 rental survey, reporting a 1.7% vacancy rate in the District of
$41,855,000 $7,300,000 $19,400,000 North Vancouver, up 0.9 per cent in . West Vancouver also had a slight increase in available units at
$734,298 PER SUITE $365,000 PER SUITE $412,766 PER SUITE 0.6% vacancy. Vacancy rates worsened in the City of North Vancouver at 0.8% compared to 1.3%.
57 UNITS 20 UNITS 47 UNITS
IMAGE SOURCE: GOOGLE STREET VIEW IMAGE SOURCE: GOOGLE STREET VIEW IMAGE SOURCE: GOOGLE STREET VIEW
The Integrated North Shore Transportation Planning Project aimed at tackling the North Shore’s
transportation problems performed a study that found traffic to be more closely linked to employment
than population. The last census period reported 2,900 more people working on the North Shore but
the population of working age people (aged 20 to 64) only grew by 900. The OCP and the village
plan called for increased density clustered in town centers and villages because density allows for
services such as transit, which results in affordable housing options being built around transit for
people who ride transit the most. The improved location of affordable housing also provides access
to a wider job market, while taking more cars off the streets.
255 E 12TH
SOLD SOLD SOLD
170 W 5TH ST 215 & 225 E 12TH ST 150 E KEITH RD
$7,850,000 $11,200,000 $26,493,283
$436,111 PER SUITE $430,769 PER SUITE $679,315 PER SUITE
18 UNITS 26 UNITS (COMBINED) 39 UNITS
IMAGE SOURCE: REALNET SOLD AS LAND/DEVELOPMENT SITE IMAGE SOURCE: REALNET
IMAGE SOURCE: REALNET
Vancouver as seen from Londsale Quay
SOLD
121 W 21ST ST
$10,350,000
$356,897 PER SUITE
29 UNITS
SOLD AS LAND/DEVELOPMENT SITE
IMAGE SOURCE: GOOGLE STREET VIEW04
GREATER VICTORIA
2016 2017 2018
NUMBER OF SALES 29 27 15
AVG PRICE PER SUITE $163,341 $179,973 $237,775
AVG MONTHLY RENTAL RATES $944 $1,072 $1,170
AVG VACANCY RATES 0.5% 0.7% 1.2%
While we have included images and details on apartment sales, land sales and strata wind-up sales, the statistics include only the apartments sales.VICTORIA SALES - 2018 04 VICTORIA SALES - 2018 04
3220 3234
SOLD SOLD SOLD SOLD SOLD SOLD
3220 & 3234 QUADRA ST 628 DALLAS RD 2180 HAULTAIN ST 1044 HILLSIDE AVE 1537 GLADSTONE AVE 1148 OSCAR ST
$34,500,000 $8,250,000 $2,300,000 $936,000 $968,000 $1,775,000
$244,681 PER SUITE $266,129 PER SUITE $209,091 PER SUITE $117,000 PER SUITE $242,000 PER SUITE $177,500 PER SUITE
141 UNITS (COMBINED) 31 UNITS 11 UNITS 8 UNITS 4 UNITS 10 UNITS
IMAGE SOURCE: GOOGLE STREET VIEW IMAGE SOURCE: GOOGLE STREET VIEW IMAGE SOURCE: GOOGLE STREET VIEW IMAGE SOURCE: GOOGLE STREET VIEW IMAGE SOURCE: GOOGLE STREET VIEW IMAGE SOURCE: GOOGLE STREET VIEW
SOLD SOLD SOLD SOLD SOLD SOLD
2006 FERNWOOD RD 467 LAMPSON ST 9927 SEVENTH ST 10387 MCDONALD RD 645 BATTERY ST 611 ADMIRALS RD
$2,000,000 $7,225,000 $2,300,000 $880,000 $1,250,000 $4,150,000
$333,333 PER SUITE $185,256 PER SUITE $383,333 PER SUITE $220,000 PER SUITE $312,500 PER SUITE $166,000 PER SUITE
6 UNITS 39 UNITS 6 UNITS 4 UNITS 4 UNITS 25 UNITS
IMAGE SOURCE: GOOGLE STREET VIEW IMAGE SOURCE: GOOGLE STREET VIEW IMAGE SOURCE: GOOGLE STREET VIEW IMAGE SOURCE: GOOGLE STREET VIEW IMAGE SOURCE: GOOGLE STREET VIEW IMAGE SOURCE: GOOGLE STREET VIEW
Victoria Harbour
SOLD SOLD SOLD
531 LINDEN AVE 1131 COLLINSON ST 217 COOK ST
$1,800,000 $2,175,000 $2,250,000
$360,000 PER SUITE $362,500 PER SUITE $375,000 PER SUITE
5 UNITS 6 UNITS 6 UNITS
IMAGE SOURCE: GOOGLE STREET VIEW IMAGE SOURCE: GOOGLE STREET VIEW IMAGE SOURCE: GOOGLE STREET VIEWNATIONAL APARTMENT GROUP
BRITISH COLUMBIA LET’S TALK!
HAVE QUESTIONS ABOUT OUR REPORT OR ABOUT THE MARKET?
HAVE IDEAS OF THINGS YOU WANT TO SEE IN OUR NEXT REPORT?
WANT A FREE, NO OBLIGATION VALUATION OF YOUR PROPERTY?
WE WANT TO HEAR FROM YOU! lance.coulson@cbre.com
CALL US - 604 662 5141
LANCE COULSON GREG AMBROSE
PERSONAL REAL ESTATE CORPORATION Senior Sales Associate
Executive Vice President
National Apartment Group - BC National Apartment Group - BC
604 662 5141 604 662 5178
lance.coulson@cbre.com greg.ambrose@cbre.com
CBRE Limited | 1021 West Hastings Street Suite #2500, Vancouver, BC V6E 0C3 www.cbre.ca/lance.coulson
This disclaimer shall apply to CBRE Limited, Real Estate Brokerage, and to all other divisions of the Corporation; to include all employees and independent contractors (“CBRE”). The information set out herein, including, without limitation, any
projections, images, opinions, assumptions and estimates obtained from third parties (the “Information”) has not been verified by CBRE, and CBRE does not represent, warrant or guarantee the accuracy, correctness and completeness of the
Information. CBRE does not accept or assume any responsibility or liability, direct or consequential, for the Information or the recipient’s reliance upon the Information. The recipient of the Information should take such steps as the recipient may
deem necessary to verify the Information prior to placing any reliance upon the Information. The Information may change and any property described in the Information may be withdrawn from the market at any time without notice or obligation
to the recipient from CBRE. CBRE and the CBRE logo are the service marks of CBRE Limited and/or its affiliated or related companies in other countries. All other marks displayed on this document are the property of their respective owners.
All Rights Reserved. Mapping Sources: Canadian Mapping Services canadamapping@cbre.com; DMTI Spatial, Environics Analytics, Microsoft Bing, Google Earth.You can also read