Recovered Resources Market Bulletin - November 2020 - Sustainability Victoria
←
→
Page content transcription
If your browser does not render page correctly, please read the page content below
Recovered Resources Market
Bulletin
November 2020
Victorian Market Intelligence Project (edition #16)
This report was prepared for Sustainability Victoria (SV)
by Envisage Works, IndustryEdge and Sustainable
Resource Use (SRU).

While reasonable efforts have been made to ensure that
the contents of this publication
are factually correct, Sustainability Victoria gives no
warranty regarding its accuracy, completeness, currency
or suitability for any particular purpose and to the extent
permitted by law, does not accept any liability for loss or
damages incurred as a result of reliance
placed upon the content of this publication.

This publication is provided on the basis
that all persons accessing it undertake
responsibility for assessing the relevance and accuracy of
its content.

This report is licensed under a Creative
Commons Attribution 4.0 Australia licence.
In essence, you are free to copy, distribute and adapt the
work, as long as you attribute the
work and abide by the other licence terms.
Go to http://creativecommons.org/licenses/by/4.0/
to view a copy of this licence.

Accessibility
This document is available online in PDF format at
https://www.sustainability.vic.gov.au/Business/Investment-
facilitation/Recovered-resources-market-bulletin

Release date
November 2020

2
CONTENTS
CONTENTS 3
Summary 4
Market overview 4
Kerbside recycling markets: November developments 5
Market implications and investment opportunities 6
1. Introduction 8
1.1 About this bulletin 8
Who is this bulletin for? 8
Structure of the bulletin 9
History and context 9
1.2 Overview of kerbside recycling flows 9
1.3 Market risks, opportunities and activities 11
1.4 Export market review 13
1.5 Overview of status of countries with post-consumer import restrictions 14
2. Resource markets 16
2.1 Kerbside recovered paper & paperboard 16
2.2 Kerbside recovered glass packaging 20
2.3 Kerbside recovered plastic packaging 23
2.4 Kerbside recovered metal packaging 27
3. Special topics 31
3.1 Global freight dynamics and costs having a big impact 31
3.2 The limits of recycling 32
4. Supporting material 34
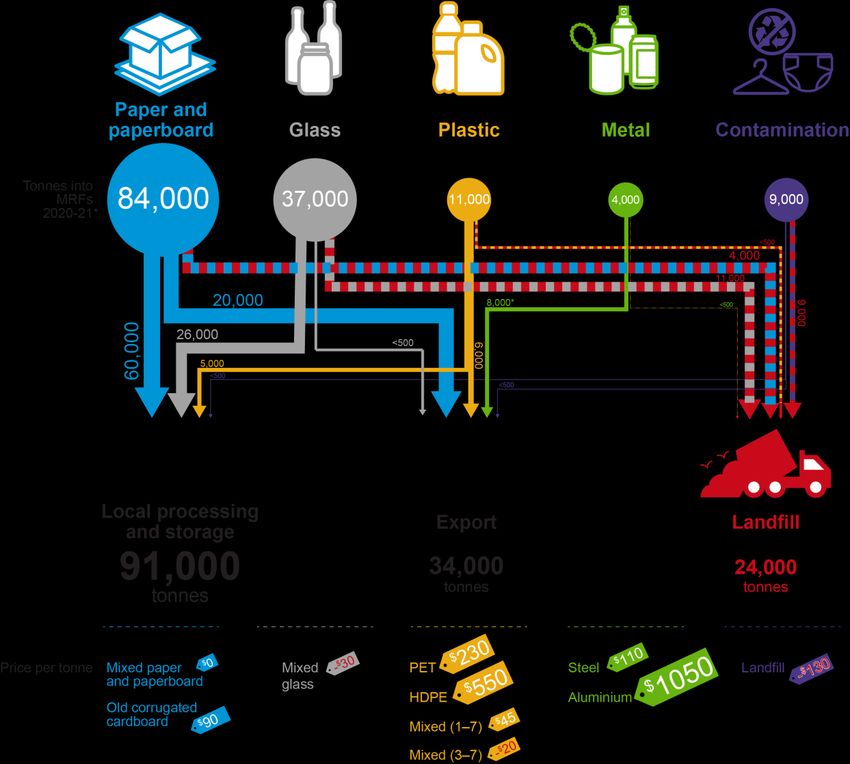
3Summary This is the 16th of a series of monthly bulletins that Sustainability Victoria (SV) is distributing to the community, industry and government to provide an overview of the kerbside recycling markets in Victoria. The bulletins provide an up-to-date picture of the health of resource recovery markets, ongoing challenges and opportunities in the sector, and details of the actions taken to improve the resilience and recovery performance of kerbside recycling. This bulletin includes export data to the end of September 2020, and pricing updates to the end of October 2020. Following a successful 12-month pilot program and evaluation, SV is producing additional monthly bulletins while considering a future bimonthly or quarterly release. This bulletin is the fifth of these 'interim' bulletins. The bulletin format may also be updated, but the core time- series kerbside market datasets will continue. Market overview Provided in Figure 1 below is an overview of the flows of kerbside collected recyclables over the 3-month period of July 2020 to September 2020. Prices are for end-October 2020. Figure 1 – Flows of kerbside collection materials in Victoria collected during July 2020–September 2020* * Note that flows are for the 3-month period of July 2020 to September 2020 only. Metal exports are higher than collections due to removals from stockpiles.
Of the 145,000 tonnes of kerbside materials collected 121,000 tonnes or 83% were sent to
downstream processing (including export), and 24,000 tonnes or 17% was sent to landfill.
Over the 2019 year the average rate of landfill was unusually high at 26%, due to the temporary
closure of the former SKM MRFs (now operated by Cleanaway) across August–November
2019, and resulting large amounts of disposal to landfill. However, over the July–September
2020 period this rate has dropped back to longer term average of around 17–18%. This
includes both gross contamination (~7%), and losses of recyclables (~11%) which are primarily
glass fines.
At the beginning of 2020 there was an estimated 100,000–200,000 tonnes of kerbside
recyclables in metro storage (including glass), mostly accumulated through 2018 and early
2019. However, virtually all of this stored material is now reported to have been removed, with
most sent to landfill. In addition, the Visy glass stockpile in Laverton is also reported to be
significantly decreased due to removal and processing into aggregate by Alex Fraser.
Stockpiling at the metropolitan MRF operator sites is not believed to be at problematic or even
significant levels as of October 2020.
Victoria has a heavy reliance on the export of recyclable materials. In September 2020
Victoria’s exports were:
   •   30% of national post-consumer paper & paperboard (28,000 tonnes of 91,000 tonnes).
       Compared to the 23% in August and 22% in July 2020.
   •   47% per cent of national post-consumer plastic (3,900 tonnes of 8,400 tonnes).
       Compared to the 48% in August and 49% in July 2020.

The exports outlined above include material sourced through commercial and industrial
collections (not just municipal kerbside collected materials), and some interstate material (e.g.
from Tasmania). However, the data illustrates the strong dependency of Victorian post-
consumer markets on export markets, and the continuing need for additional local
remanufacturing capacity and demand in Victoria, particularly given the unprocessed scrap
export bans which are to be phased in over the next few years.

Kerbside recycling markets: November developments

Market-wide developments
Development 1 – China to completely ban the import of all solid wastes in 2021. Industry
news reports out of China suggest that the Chinese Government will ban all imports of solid
waste from 2021 and will no longer accept or approve import applications for solid waste. Major
shipping fleet operators are already restricting scrap transport orders into China.
Development 2 – MRFs and reprocessors are generally operating as usual. There were
no significant reported disruptions to major Materials Recovery Facility (MRF) operators or
downstream reprocessors as of early November.
Development 3 – Release of Container Deposit Discussion paper. On 2 November a
Victorian Container Deposit Scheme Discussion paper was released by the Department of
Environment, Land, Water and Planning with submissions sought by 30 November. The
discussion paper proposes a ten-cent levy to apply to some glass, plastic, metal and liquid
paperboard containers. Under the proposed scheme, glass packaging for wine, spirits and
food would not be included.
Paper & paperboard
Development 4 – Exports continue to decline, ahead of the China import ban. Exports of
recovered paper from Victoria have declined by around 10,000 tonnes per month, compared
with a year earlier. The outlook is for further declines into 2021.
Development 5 – New local reprocessing options are under consideration. It is arguably
overdue, however, there are several potential reprocessing options, with new local or overseas

                                                                                                5
end-markets for the fibre products, under consideration in Victoria and nationally by major
investors. None are well-advanced, but investigations are increasing as the situation facing the
sector becomes starker.
Glass packaging
Development 6 – As reported last month Visy has now completed the purchase of the
Australian and New Zealand glass packaging manufacturing business from Owens
Illinois in one of the largest manufacturing acquisitions by an Australian owned
business in Australian business history. As part of this acquisition, the Spotswood glass
bottle plant in Melbourne is now operating under the Visy banner. Recent media statements
by Visy Glass indicates a target to produce bottles from 70% recycled content (up from 30%
presently).
Plastic packaging
Development 7 – Prices for recovered PET bottles continue to slide. PET packaging
scrap prices continue to drift lower, and are now at the lowest prices seen for possibly a
decade.
Development 8 – Prices for recovered HDPE bottles have seen good recovery in
October. Unlike PET, HPDE packaging scrap prices appear to have rebounded in October,
and are now back at pre-pandemic prices from 12 months ago.
Metal packaging
Development 9 – Prices for recovered tin-plate steel cans and aluminium beverage
cans are fairly steady. No noteworthy changes in scrap prices for scrap metal packaging.
Market implications and investment opportunities
Here we develop a future looking synthesis of the key implications of recent developments,
and also provide a quick summary of some of the key investment opportunities that are
potentially available. These include minor updates from those reported in bulletin #15.
Market implications
• Recycled commodity prices are generally trending down: To the end of October
there is general downwards pressure on the commodity values of the main kerbside
materials. With one or two exceptions, scrap prices are generally at very low levels.
• Situation unlikely to return to pre-pandemic conditions: Looking further ahead,
when movement restrictions are reduced, the pressure on kerbside recycling may be
anticipated to reduce but is unlikely to go back to pre-pandemic levels.
• Increasing the flow of glass back into packaging. With the significant drawdown on
glass stockpiles, the priority turns to the expansion of beneficiation capacity to facilitate
an increased flow of recycled glass back into bottle production.
• Sufficient increases in reprocessing capacity and end-markets for kerbside
mixed-paper are not on the horizon. Even with hugely increased reprocessing
capacity the end-markets for recovered fibre from kerbside mixed paper processing do
not currently exist in Australia.
• Sufficient increases in reprocessing capacity and end-markets for kerbside
mixed-plastics are not on the horizon. Even with hugely increased reprocessing
capacity the end-markets for recovered plastics from kerbside mixed plastics
processing do not currently exist in Australia.
6Investment opportunities
Market-wide
• Ongoing education program to reduce kerbside contamination.
• MRF modifications for improved separation and contaminant control.
• Community recycling drop off points with a focus on cardboard, EPS, and soft plastics.
• Safe undercover bale storage with sprinklers.
Fibre
• Large scale pulping capacity for recovered paper, either separately or integrated with
virgin fibre manufacturing.
• Reprocessing of coated paper and board, especially polymer coated, into non-paper
products.
• Procurement of locally manufactured recycled products to encourage reprocessing
investment.
• Commercial site cardboard compaction equipment.
Glass
• Beneficiation capacity increase. Either new plant or expansion of existing capacity to
accommodate Cleanaway MRF generation and the new kerbside glass bin and CDS
collected glass over the next couple of years.
• Glass kerbside bin purchase. Potential state/local government shared cost of rollout
linked to uniform bins with maximum recycled content, purple lids and hot stamped
education message.
Plastics
• Reprocessing equipment for HDPE and PP from consumer sources. Preferably into
food grade quality resin.
• Wash equipment for new and existing plastics recycling plants.
• Separation equipment for PET/PE/PP at MRF or reprocessing sites.
71. Introduction
1.1 About this bulletin
This is the 16th of a series of monthly bulletins that Sustainability Victoria (SV) is distributing to
the community, industry and government to provide an overview of the kerbside recycling
markets in Victoria.
This bulletin includes updates related to ABS export data to the end of September 2020, and
pricing updates to the end of October 2020.
The bulletins provide an up-to-date picture of the health of the markets, the ongoing challenges
and opportunities, and action taken to improve the resilience and recovery performance of
kerbside recycling.
The bulletins are a synthesis of monthly updates of ABS export data and published market
reports, and more in-depth quarterly updates informed by extensive consultation with industry,
government and community stakeholders.
Each bulletin includes a monthly update that includes:
• market overview and current developments
• export data and receiving country updates
• commodity price tracking
• kerbside quantity flow approximations
• market developments and activity updates.
A deeper look at two special topics is provided. The special topics explored in Section 3 for
this month are:
• Global freight dynamics and costs having a big impact.
• The limits of recycling.
SV is currently evaluating the ongoing frequency and format for the bulletin, potentially
shifting to a modified format and quarterly basis going forward. We will keep all subscribers
updated on the plan for the future of the Recovered Resources Market Bulletins.
Please contact SV if you have any comments or questions on this bulletin, or suggestions for
future issues:
• Cate Turner – Manager Recycling Industry Support (cate.turner@sustainability.vic.gov.au)
• Catherine Ng – Program Lead-Strategic Data Intelligence (catherine.ng@sustainability.vic.gov.au).
Who is this bulletin for?
This bulletin is for anyone with an interest in kerbside recycling in Victoria. It presents a holistic
overview of material flows and related markets, through generation, sorting, reprocessing, re-
manufacturing and end-product markets.
Bulletin #1 presents details of the stakeholders involved in kerbside recycling, and the roles
that they can play in shifting kerbside recycling and markets to a more resilient and sustainable
future.
The glossary for all the terms used in the bulletin is available here.
8Structure of the bulletin
This bulletin has seven sections:
• Market summary – An overview of kerbside material flows, $ values, and the key
issues, opportunities and activities.
• Introductory section (this section) – A more detailed and integrated overview of
kerbside material markets across all material types (paper & paperboard, glass
packaging, plastic packaging and metal packaging).
• Material specific sections – Four sections on each material groups (paper &
paperboard, glass packaging, plastic packaging and metal packaging). Each section
provides: an overview of the material markets; the latest available information on
prices, demand and supply; commentary on the key product end-markets for recovered
materials; export and/or interstate market activity; and a summary of market risks,
opportunities and developments.
• Special topic areas – A deeper look at one or two special topic areas each month.
History and context
Across the past decade there have been downturns in the recycled materials market caused
by the:
• Global Financial Crisis (GFC) in 2009.
• New Chinese regulations in 2011 aimed at reducing the imports of highly contaminated
post-consumer materials.
• Aggressive enforcement in 2013 by the Chinese of the 2011 regulations, through a
campaign known as 'Operation Green Fence'.
• Aggressive enforcement from the beginning of 2018 by the Chinese of the 2011
regulations, through a campaign known as 'National Sword'. Around half the world's
kerbside packaging was received by China until the end of 2017 and the enforcement of
these regulations has reduced these imports massively.
A key aspect of the latest Chinese restrictions is a maximum contamination threshold of
0.5 per cent for imported bales of post-consumer mixed paper & paperboard and mixed
plastics. This threshold is very low and MRFs internationally, including Victorian MRFs,
are not capable of meeting the 0.5 per cent contamination threshold.
• Global coronavirus pandemic starting in early 2020, and still ongoing, hampering
international freight movements and country level manufacturing activity.
See bulletin #1 for a more detailed outline of the history and context of the issues explored in
these bulletins. All previous bulletins are available here.
1.2 Overview of kerbside recycling flows
Victorian kerbside recyclables collection and sorting systems have been steady over the past
three years at around 550–600,000 tonnes per year. After operating losses of 100,000 tonnes
of contaminant material and unrecovered recyclables, an estimated 450–500,000 tonnes are
available for reprocessing in a typical year. Paper grades and glass account for 85 per cent or
more of this processed material by weight.
Not all of the 500,000 tonnes of sorted recyclables are necessarily then processed further into
materials ready for the manufacture of new products, and across the 3-year period of 2016–
17 to 2018–19 period significant quantities of sorted and unsorted recyclables were placed into
storage due to poor markets or operational problems.
9For reasons explored in detail in previous bulletins the disposal of stored recyclables has
occurred at very high levels across 2019–20. However, this disposal was largely completed by
May 2020.
Figure 1.2.1 and Table 1.2.1 provides estimates of annual MRF outputs. Note that 2020–21
data is part-year data for the 3 months across July 2020–September 2020 only. Also note that
the reduction in storage during 2019–20 of 274,000 tonnes of stored material, which was
mostly sent to landfill and contributes to the landfill (orange) quantity. Quantities of stored
recyclables are now at the lowest levels since 2017 at least.
Figure 1.2.1 – Victorian MRF outputs by material category (tonnes)
Note: 2020–21 data is partial financial year across the 3 months July 2020–September 2020.
Table 1.2.1 – Victorian MRF outputs by material category, including stockpiled material estimates
Material category 2015–16 2016–17 2017–18 2018–19 2019–20 2020–21
(tonnes) (tonnes) (tonnes) (tonnes) (tonnes)
Paper & paperboard 330 000 280 000 250 000 290 000 290 000 80 000
Glass 100 000 110 000 30 000 30 000 150 000 30 000
Plastic 50 000 40 000 40 000 40 000 40 000 10 000
Metal 20 000 10 000 20 000 10 000 16 000 10 000
Storagea 0 50 000 110 000 90 000 - 274 000 0
Landfillb 100 000 100 000 140 000 120 000 390 000 30 000
Totals 600 000 590 000 590 000 580 000 612 000 160 000
Source: SV (2017; 2018; 2019) and industry consultation.
a) Note the storage growth across 2015–16 to 2018–19, which reversed sharply in 2019–20.
b) Includes an estimated 30–40,000 tonnes of fire-related losses in July 2017, 20,000 tonnes of licence compliance
related disposal in March 2019, and 220,000 tonnes of operational and safety related disposal in 2019–20.
10Figure 1.2.2 presents indicative monthly data on the destinations of Victorian MRF outputs.
Exports of kerbside materials fell in 2017 and then more sharply in 2018. Movement across
2019 and 2020 has been up and down, but with no distinct longer term trend.
Figure 1.2.2 – Destination of Victorian MRF outputs from kerbside sources (tonnes/month)
Note 1: Data in the table above have been estimated based on publicly available sources, with totals verified through
consultation.
Note 2: Historical total monthly MRF outputs have been approximated to enable comparison with monthly ABS
customs export data. ‘Local reprocessing’, ‘Landfill’ and ‘Storage change’ estimates are indicative only.
Note 3: The ‘Storage change’ plot is an estimation of the change in material stored or stockpiled in that month.
Note 4: Storage includes estimates of both sorted and baled materials, and unsorted (but baled) materials. It
excludes longer-term stored materials from before January 2015, which is most significantly legacy glass storage.
Note 5: Landfill estimates include MRF licence compliance related disposal to landfill, and fire related losses to
atmosphere. Landfill data presented are an approximation based on annual waste to landfill rates.
Source: ABS (2020) and Envisage Works.
1.3 Market risks, opportunities and activities
Victoria has a heavy reliance on exporting kerbside materials. In September 2020 Victoria
made up an estimated 32% of Australian exports of post-consumer materials that might have
a kerbside source, compared with 26% in August and 27% in July. In September 2019 Victoria
made up an estimated 37% of Australian exports.
Recovered paper markets have dropped significantly since November 2019, and exports are
now at the lowest level since January 2015 at least. However, there has been some modest
recovery in September. Prices for all grades of recovered paper and paperboard have
deteriorated over the last 12 months, with OCC prices in particular falling heavily in November
and December 2019, to low but stable levels across January–October.
Sorted PET and HDPE packaging, steel cans, and aluminium cans have all seen significant
price drops since the beginning of the pandemic and PET prices are now at some of the lowest
prices for the last three years at least. There has been some recovery for aluminium over the
last three months, and some good recovery in HPDE prices over the last two months.
11Figure 1.3.1 – Victorian recovered kerbside materials commodity values ($/tonne) Source: Industry consultation and published sources. Prices are approximated at the out-going MRF gate and to end-September 2020. Prices are indicative only. Table 1.3.1 provides pricing on selected virgin material commodities that are (generally) competing with recycled material. It is important to note that the kerbside material commodity values presented in Figure 1.3.1 are estimated prices at the out-going MRF gate, and prior to any secondary processing (and the associated processing costs). It is important to note that the very low or negative prices presented above are indicative only, as little or no spot market trading is occurring. 12
Table 1.3.1 – Virgin material commodity values end-October 2020 ($AUD/tonne)

 Material category                            Value            Comments
 Fibre – Bleached softwood kraft (BSK) pulp   $800–$900        BSK and BHK pulps are not directly competing with
                                                               recycled fibre in the Australian market. Values provided to
 Fibre – Bleached hardwood kraft (BHK) pulp   $750–$850        give some context on virgin pulp prices.
 Glass – Virgin material inputs               $550–$650        Estimate based on typical flint glass composition.
 Plastic – PET (1) virgin resin               $1,350–$1,450    -
 Plastic – HDPE (2) virgin resin              $1,350–$1,450    -
 Plastic – PVC (3) virgin resin               $1,000–$1,200    Unplasticised PVC.
 Plastic – LDPE (4) virgin resin              $1,350–$1,450    -
 Plastic – PP (5) virgin resin                $1,500–$1,600    -
 Plastic – PS (6) virgin resin                $1,800–$1,900    -
 Steel                                                         London Metal Exchange (LME) post-consumer
                                              $400–$450
                                                               steel scrap price
 Aluminium                                    $1,900–$2,000    LME aluminium alloy

    1.4       Export market review
A summary of Victorian exports since January 2015 is provided in this section. In September
2020, Indonesia, China, India, Malaysia, and Korea were the main export destinations for
Victorian recovered kerbside materials. See Figure 1.4.1 for Victorian exports of kerbside
materials, by country of destination, across the period of January 2015 to September 2020.
Exports across the first 9 months of 2020 were an estimated 104,000 tonnes, compared to
118,000 tonnes in the corresponding period in 2019.

Figure 1.4.1 – Victorian recovered kerbside materials, to export country (tonnes/month)

Source: ABS (2020) and Envisage Works

                                                                                                                  13
Table 1.4.1 provides annual Victorian exports of kerbside materials, by country of
destination, across the period of 2015–16 to 2020–21. Since 2016 Victorian has dramatically
reduced exposure to China as a destination. Table 1.4.2 provides the monthly change in
Victorian kerbside exports, by destination country, for August and September 2020.
Table 1.4.1 – Annual Victorian recovered kerbside materials, to export country (tonnes/yr)
2015–16 2016–17 2017–18 2018–19 2019–20 2020–21b
Countrya
(tonnes) (tonnes) (tonnes) (tonnes) (tonnes) (tonnes)
China 234 000 198 000 74 000 50 000 28 000 3 000
Indonesia 47 000 25 000 42 000 46 000 38 000 9 000
India 14 000 13 000 14 000 16 000 21 000 4 000
Malaysia 4 000 7 000 32 000 23 000 33 000 3 000
Korea 0 1 000 4 000 6 000 5 000 1 000
Pakistan 2 000 2 000 2 000 1 000 2 000 1 000
All other 22 000 20 000 25 000 29 000 20 000 6 000
Total 323 000 266 000 193 000 171 000 147 000 27 000
Source: ABS (2020) and Envisage Works
a) Countries ranked by average of last three months of exports.
b) Partial year across July 2020 to September 2020.
Table 1.4.2 – Most recent monthly exports in Victorian recovered kerbside materials, to export country
August 2020 September 2020 % change
Countrya
(tonnes) (tonnes) (%)
China 800 1 900 138%
Indonesia 3 400 2 800 -18%
India 1 300 1 400 8%
Malaysia 1 100 1 200 9%
Korea 500 600 20%
Pakistan 300 300 0%
All other 2 400 1 800 -25%
Total 9 800 10 000 2%
Source: ABS (2020) and Envisage Works
a) Countries ranked by average of last three months of exports.
1.5 Overview of status of countries with post-consumer import
restrictions
Provided here is an overview of the status (as of October 2020) of countries that receive major
kerbside related post-consumer exports from Australia. There have been no significant
changes from last few months, with the major exception of China.
• Bangladesh – No identified changes in import conditions. There have been no specific import
restrictions identified for paper and paperboard, and the identified requirement for post-consumer
plastics imports is that they do not contain any toxic or radioactive substances.
14• China (restrictions on post-consumer plastic, paper, metals, and other types of post-
consumer materials) – No change to the import restrictions which began in March 2018 and
became more extensive at the end of 2018. The contamination threshold is currently 0.5 per cent.
However, import licences for scrap are now issued on a restricted and shorter term national needs
basis.
At the end of December 2019, the Chinese foreshadowed a new standard on recycled plastic
imports to take effect in April 2020. The new standard requires that all recycled pellets in the same
shipment must have consistent physical properties. This change will further restrict imports of
recyclate into China from all suppliers globally, whether in flake or pellet form. The introduction of
this new standard may have been delayed due to the pandemic.
On the 29 April China's National People's Congress Standing Committee approved legislation to
move China towards "gradually realising zero import of solid waste". Furthermore, the Chinese
Ministry of Ecology and Environment has confirmed that China will ban the import of "solid waste"
from 2021. Consequently, three of the five largest global shipping lines (MSC, Hapag Lloyd and
Maersk Line subsidiary Hamburg Süd) have announced they will cease receiving recovered
materials for shipment to China, starting in September.
• India (restrictions on post-consumer plastics) – India announced bans in March 2019
prohibiting post-consumer ‘solid plastic’ from being imported into the country, including in special
economic zones. Exports of kerbside plastics from Victoria to India are fairly low, so this does not
have major implications for exports. However, India is less likely to start importing significant
quantities of post-consumer plastics.
India was not issuing import permits for tin-plate steel can scrap (along with many other materials)
during the Indian lockdown. It is understood, but not confirmed, that this was relaxed over August
2020.
It was reported in January 2020 that India is planning on tightening its quality standards and
imported mixed paper will be allowed a maximum of 1% contamination. Increased inspections are
also reported.
• Indonesia (new inspection regime) – It was reported in early bulletins that as of 1 April 2019 all
(100 per cent) post-consumer paper imports into Indonesia will be inspected at ports (up from
around 10 per cent previously). However, in practice, it appears so far that inspection rates are
somewhat elevated, rather than covering all imports. The contamination threshold (impurity limit)
is 0.5 per cent, which is the same as China. Indonesia has sent some kerbside materials back to
Australia in 2019 (August and September), but nothing in 2020 as yet.
• Malaysia (restrictions on post-consumer plastics) – Restrictions implemented from July 2018,
with a significant impact on post-consumer plastics imports. Many import permits were revoked
following these restrictions coming into force. In May 2019, reports circulated in the media regarding
further import restrictions for waste plastics. Malaysia has sent relatively small quantities of
kerbside materials back to Australia in 2019, but nothing in 2020 as yet.
• Taiwan (restrictions on post-consumer paper and plastics) – Restrictions implemented from
October 2018, with only OCC and other higher quality grades accepted. There are also restrictions
on post-consumer plastics. Little material from Victoria has been shipped to Taiwan.
• Thailand (restrictions on post-consumer plastics) – Restrictions implemented from August
2018, to escalate over the next two years, with tighter controls on e-waste imports also
foreshadowed. Low quality plastic waste imports may be banned from 2021.
• Vietnam (restrictions on post-consumer plastic, paper, metals and other types of post-
consumer scrap products) – Restrictions implemented from around August 2018, with further
tightening of post-consumer imports from late February 2019. Low quality plastic waste imports
may be banned from 2025.
152. Resource markets
2.1 Kerbside recovered paper & paperboard
Market developments this month
Development 1 – Exports continue to decline, ahead of the China import ban. Exports of
recovered paper from Victoria have declined by around 10,000 tonnes per month, compared
with a year earlier. The outlook is for further declines into 2021.
Development 2 – New local reprocessing options are under consideration. It is arguably
overdue, however, there are several potential reprocessing options, with new local or overseas
end-markets for the fibre products, under consideration in Victoria and nationally by major
investors. None are well-advanced, but investigations are increasing as the situation facing the
sector becomes starker.
Material overview and market summary
Kerbside recovered paper & paperboard, as sorted by Victorian MRFs, is almost entirely
produced as mixed paper & paperboard bales that consist of; OCC (50%), boxboard
/cartonboard (12%), liquid paperboard (In the near term, more recovered fibre will be destined for landfill. That will likely extend long
into 2021, if not longer. The challenge before the sector is that increasingly contaminated
kerbside material will be competing with OCC for non-China markets. The competition is
global, with Australian supply having to compete with displaced volumes from other countries,
even in nearby markets like Indonesia. Just as kerbside material has found competition with
OCC difficult domestically, it is now facing an uphill battle in export markets.
Average prices of recovered paper grades continue to be under pressure, which continue until
there are positive developments in end-markets domestically or internationally.
Figure 2.1.1 – Destination of Victorian MRF outputs (tonnes/month) – Kerbside paper & paperboard
Note 1: Historical total monthly MRF outputs have been approximated in Figure 2.1.1 to enable comparison with
monthly ABS customs export data. The overall trends are the key aspect of the figure.
Note 2: The combined ‘Local reprocessing or storage’ estimate is indicative only, and these fates will be presented
separately if this level of data becomes available. Landfill excludes disposal from storage and is an approximation
based on annual waste to landfill rates.
Source: ABS (2020) and Envisage Works
Prices, demand and supply
Largely constrained by local contracts for corrugated boxes, reported local sales prices have
been stable most recently, but at levels that provide little encouragement to the recovery supply
chain.
Key end-markets and related specifications
There remain no new end-markets for kerbside recovered paper. It is anticipated there may be
some new or marginally expanded opportunities in coming months, but these are likely to arise
incrementally, rather than as new facilities or products.
Export and interstate market review
Victorian recovered paper export volumes continue to fall. Low virgin fibre prices likely to
suppress demand for the next few months at least. The expectations that 2020 would be bad
for exports are almost certain to be realised. Exports of kerbside material have fallen back to
levels consistent with, or even lower, the poor results from 2019.
17Figure 2.1.2 – Victorian recovered kerbside paper & paperboard, to export country (tonnes/month)
Source: ABS (2020) and Envisage Works
Table 2.1.1 – Annual Victorian recovered kerbside paper & paperboard, to export country (tonnes/yr)
2015–16 2016–17 2017–18 2018–19 2019–20 2020–21b
Countrya
(tonnes) (tonnes) (tonnes) (tonnes) (tonnes) (tonnes)
China 204 000 171 000 67 000 48 000 24 000 2 000
Thailand 2 000 4 000 14 000 11 000 24 000 5 000
Indonesia 45 000 22 000 34 000 32 000 34 000 8 000
Vietnam 2 000 3 000 7 000 12 000 7 000 2 000
Malaysia 1 000 2 000 10 000 6 000 16 000 0
India 8 000 10 000 10 000 14 000 18 000 2 000
All other 3 000 5 000 7 000 7 000 6 000 2 000
Total 265 000 217 000 149 000 130 000 129 000 21 000
Source: ABS (2020) and Envisage Works
a) Countries ranked by average of last three months of exports.
b) Partial year across July 2020 to September 2020.
18Table 2.1.2 – Most recent monthly change in Victorian recovered kerbside paper & paperboard, to export
country (tonnes/month)
August 2020 September 2020 % change
Country
(tonnes) (tonnes) (%)
China 400 1 500 275%
Thailand 1 700 1 300 -24%
Indonesia 2 900 2 300 -21%
Vietnam 700 600 -14%
Malaysia 100 200 100%
India 600 400 -33%
All other 800 400 -50%
Total 7 200 6 700 -7%
Source: ABS (2020) and Envisage Works
Market risks, opportunities and activities
Against a challenging international backdrop, the local market for recovered paper continues
to see increased supply or availability of lower quality material.
If deterioration in the quality of recovered fibre continues, without improvement, landfill of
recovered paper is likely to increase over the coming months and into 2021.
192.2 Kerbside recovered glass packaging Market developments this month Development 1 – As reported last month Visy has now completed the purchase of the Australian and New Zealand glass packaging manufacturing business from Owens Illinois in one of the largest manufacturing acquisitions by an Australian owned business in Australian business history. As part of this acquisition, the Spotswood glass bottle plant in Melbourne is now operating under the Visy banner. Recent media statements by Visy Glass indicates a target to produce bottles from 70% recycled content (up from 30% presently). Development 2 – Release of Container Deposit Discussion paper. On 2 November a Victorian Container Deposit Scheme Discussion paper was released by the Department of Environment, Land, Water and Planning with submissions sought by 30 November. The discussion paper proposes a ten-cent levy to apply to some glass containers, primarily beer packaging. Under the proposed scheme, glass packaging for wine, spirits and food would not be included. Material overview and market summary Polytrade has increased the quantity of glass going through their Dandenong beneficiation plant. It is now operating at over 40,000 tonnes/yr, and subject to the quality of the input, Polytrade report that the facility could go higher with the input of cleaner glass from source segregated collections. Polytrade report that they are increasing their intake by emptying their warehouses of stored material and sourcing some glass from southern NSW. The Visy beneficiation plant is thought to be processing similar volumes. Removal of the large stockpile of glass at the closed GRS plant in Coolaroo has now been completed. The EPA stepped into managing site safety under its environmental protection powers from late October 2019 and has now removed more than 120,000 tonnes of material from the site. Stockpiles of glass have also been significantly reduced at sites controlled by Visy Recycling and Polytrade. Stockpiled glass at other sites, including Alex Fraser, are also decreasing and are not considered problematic. There are a range of sites in Melbourne providing glass material into road construction products. The recycled glass sand is blended with crushed brick, and then mixed with quantities of crushed concrete, cement and water, into road base products that meet VicRoads specifications. These products are being used on major Victorian government projects such as freeway upgrades and level crossing removals. The demand for packaging glass-based sand replacement product is high in Victoria as it competes well on price and quality with quarried sand. As reported widely, the Victorian Government announced the statewide introduction of a glass recycling bin from 2021. State government support for local government introduction has been announced. In addition, there has also been an announcement that a container deposit scheme will be developed and introduced, and this is also likely to result in significant quantities of uncontaminated glass suitable for use in new glass packaging. The experience of other states and territories suggests that glass packaging returned through container deposit schemes is significantly cleaner and has a higher demand and value compared with glass from MRFs. This material still generally requires beneficiation for contaminant control, sizing and colour sorting, and at this stage is not all being returned to glass packaging. 20
Glass separate collections have commenced at Hobsons Bay, Macedon Ranges Council,
  Moyne and Warrnambool council areas so far in 2020. The City of Yarra has announced it will
  follow this with a glass only bin from November 2020, after running a trial with 1,300
  households. Surf Coast will roll out purple bins to households in December, ahead of a glass
  service launch in 2021
  A summary of the latest information on new glass bin service configurations is provided in the
  following table. This table will be updated as more services commence across the state.

Table 2.1.2 – Glass bin (separate) service configurations

         Council            Frequency            Bin size (L)                       Glass destination
 Hobsons Bay                 Monthly                 120           Currently Alex Fraser Group and construction.
                                                                   Seeking beneficiation capacity.
 Macedon                     Monthly                 140           Currently Alex Fraser Group and construction.

 Moyne                       Monthly                 120           Fulton Hogan Warrnambool for local roads.

 Warrnambool                Fortnightly              120           Fulton Hogan Warrnambool for local roads.

 Yarra                      Fortnightly              TBC           Alex Fraser Group, but with the intention to switch to
                                                                   packaging use when possible. Full service to start in
                                                                   November.
  Source: SV.

  Figure 2.2.1 provides data on movements in export and local destinations of kerbside collected
  glass since the beginning of 2015. Exports of kerbside glass are generally low and sporadic.
  There have been no exports of glass from Victoria since June 2020.

  Figure 2.2.1 – Destination of Victorian MRF outputs (tonnes/month) – Kerbside glass

  Note 1: Historical total monthly MRF outputs have been approximated in Figure 2.2.1 to enable comparison with
  monthly ABS customs export data. The overall trends are the key aspect of the figure.
  Note 2: The combined ‘Local reprocessing or storage’ estimate is indicative only, and these fates will be presented
  separately if this level of data becomes available. Landfill excludes disposal from storage and is an approximation
  based on annual waste to landfill rates.

                                                                                                                   21
Source: ABS (2020) and Envisage Works Prices, demand and supply Gate fee rates for MRFs sending material for beneficiation can vary, based on quality and quantities. Gate fees of $0 /tonne at the outgoing gate of the MRF (EXW MRF) to -$30 /tonne are reported if the glass is going to beneficiation. Prices are even lower if the glass is going into other applications (such as road construction). There was a small amount of separated glass going directly from pubs and clubs to beneficiation, but this has largely ceased during the recent COVID-19 lockdown. The cost of beneficiation for food grade packaging is estimated at around $150–$200 /tonne but is dependent on the source and processing requirement of the incoming glass. Following beneficiation Visy Glass then receives the glass cullet from beneficiation plants in most major cities nationally, including Melbourne at its Spotswood facility. The price paid at these facilities has remained largely unchanged in recent years. The reduced beneficiation capacity has restricted the amount of glass suitable for production. There is an increased focus on addressing this shortfall in beneficiation capacity. Cullet use in packaging manufacture has therefore dropped and now makes up just under 30 per cent of the input to Visy Glass manufacture in Victoria. Some glass cullet has been transferred to plants in NSW and SA to fulfill colour requirements in these states. Delivered MRF sorted mixed glass destined for road base or asphalt production incurs a gate fee that is greater than the fee into beneficiation, but less than a landfill gate fee. On average it is expected to be around -$50–80 /tonne (so a significant cost to the MRF operators). Key end-markets and related specifications Beyond taking used glass packaging back into packaging production, for which there may only be a future national demand of 0.5 million tonnes nationally (leaving 0.7 million tonnes requiring alternative uses), there are a range of other secondary markets that can be used, but these do not offer a high market price. These include the major market of glass into asphalt, road base material and sand for construction, and smaller markets for abrasives and filter media. Export and interstate market review Glass cullet is generally not exported due to its low value and significant weight relative to shipping costs. There has been little reported export of glass for recycling from Victoria in 2020 (less than one thousand tonnes). Some export of CDS glass is occurring interstate. The quality is considered high enough that it does not require beneficiation prior to export. Market risks, opportunities and activities There are two major risks to glass recycling, the first of which relates to the fact that there is significantly more glass in supply than there is beneficiation capacity. Significant new beneficiation capacity is required, particularly given the new high-quality and large-volume collections that can be anticipated once kerbside glass collections and the container deposit scheme are established. The second major risk relates to national glass demand back into packaging, which cannot absorb all the packaging glass supply even if beneficiated, and so significant non-packaging end-markets for recovered glass will continue to be required, or exports markets for the beneficiated and (high-quality) unbeneficiated glass will be required. Other end-markets for the glass, such as the construction sector, are needed even though this results in the glass being down-cycled into construction materials. 22
2.3      Kerbside recovered plastic packaging

Market developments this month
Development 1 – Prices for recovered PET bottles continue to slide. PET packaging
scrap prices continue to drift lower, and are now at the lowest prices seen for possibly a
decade.
Development 2 – Prices for recovered HDPE bottles have seen good recovery in
October. Unlike PET, HPDE packaging scrap prices appear to have rebounded in October,
and are now back at pre-pandemic prices from 12 months ago.
Development 3 – Release of Container Deposit Discussion paper. On 2 November a
Victorian Container Deposit Scheme Discussion paper was released by the Department of
Environment, Land, Water and Planning with submissions sought by 30 November. The
discussion paper proposes a ten-cent levy to apply to some plastic containers.
Material overview and market summary
Plastics collected through kerbside collections are generally sent to MRFs and sorted from
commingled recycling into either a single mixed plastics grade (1–7 plastic-polymer mix), or
more commonly three grades, which are PET, HDPE and the residual mixed plastics grade (a
3–7 plastic-polymer mix, but with some residual quantities of PET and HDPE still present).
Figure 2.3.1 provides data on the change in exports of kerbside recovered plastic packaging
since the beginning of 2015. The trend in exports across the first half of 2020 has been mixed,
but remains at near historically low levels.

Figure 2.3.1 – Destination of Victorian MRF outputs (tonnes/month) – Kerbside plastic packaging

Note 1: Historical total monthly MRF outputs have been approximated in the figure above to enable comparison
with monthly ABS customs export data. The overall trends are the key aspect of the figure.
Note 2: The combined ‘Local reprocessing or storage’ estimate is indicative only, and these fates will be presented
separately if this level of data becomes available. Landfill excludes disposal from storage and is an approximation
based on annual waste to landfill rates.
Source: ABS (2020) and Envisage Works

                                                                                                                 23
Baled PET and HDPE packaging is processed and remanufactured locally, and also exported to a range of countries. The main overseas destinations in the first nine months of 2020 have been Malaysia (57%) and China (21%). Prices, demand and supply There continues to be reasonably strong local and export markets for clean PET bales that are collected and sorted to specification. However, due to competitive pressure from cheap virgin PET resin, internationally reported traded spot prices fell from $400 /tonne (EXW MRF) in June 2019 to around $230 /tonne in October 2020, the lowest price for perhaps a decade. The price of recycled resin is linked to the price for virgin resin. PET resin prices have been experiencing increasing downward pressure over the first quarter of 2020. However, this was been offset by the deteriorating exchange rate to March 2020. With the 15% increase in the exchange rate from March to October (AUD0.62 to AUD0.71) it is now back to the same level as was 2 years ago. This has lowered virgin PET resin prices, decreasing the competitiveness of recycled PET with virgin PET. The situation has also worsened for HDPE over 2020, but with some signs of recovery in October. Prices for washed and flaked material softened since December from around the $600–$650 /tonne level to $400–$450 /tonne by the end of September 2020, but appear to have gone over the $500 /tonne level in October. HDPE virgin resin prices fell significantly across the second half of 2019, and further have occurred over 2020, due to the combination of reduced demand due to the pandemic and new polyethylene capacity coming online globally. The market for mixed plastic packaging bales continues to be very poor at $0 /tonne or less, assuming it can be sold. Key end-markets and related specifications Exported plastics packaging has specifications relating mostly to contamination levels. The positive sorting of PET and HDPE that is undertaken at MRFs allows the baled material to generally meet these specifications without major difficulty or manual sorting input. Previously plastics packaging has been overwhelmingly exported to China, until the latest round of restrictions. Since September 2019 Malaysia has been the largest destination for Victoria kerbside plastics. For the 12 months prior to this Indonesia had been a major destination. Across the first eight months of 2020 China was still the second largest destination of post- consumer plastics exported from Victoria, after Malaysia. China has been slowly receiving increasing quantities, off a very low base, since the middle of last year. Export and interstate market review Post-consumer plastic imports into Malaysia appear to be have been fairly steady across the 2020, perhaps growing a little across August and September. Imports into China appear to be growing slowly as well. From January 2020 to September 2020 it is estimated that China received 3,200 tonnes of scrap plastics from Victorian kerbside recycling bins, compared with 15,400 tonnes sent to all export destinations. If the new Chinese laws that ban importation of recovered materials from the beginning of 2021 cover scrap plastics, which is expected to be the case, then the scrap plastics currently sent to China will require new markets for sale. Exports of kerbside recovered mixed plastic packaging have dropped dramatically over the past few years (see Table 2.3.2), and are continuing a mostly downwards trend into the first five months of 2020. The June to September period has seen a recovery in exports to the level seen at the start of the year. 24
The falls since the 2016–17 year were driven entirely by lost sales to China, with exports to
Indonesia and Malaysia taking up some of this material. The saturation and restriction of
imports into Indonesia has left Victoria highly exposed to Malaysian import conditions, albeit
at a lower level than the historical level of exposure to China.

Figure 2.3.2 – Victorian recovered kerbside plastic packaging, export country (t/month)

Source: ABS (2020) and Envisage Works

 Table 2.1.1 – Annual Victorian recovered kerbside plastics, to export country (tonnes/yr)

                      2015–16          2016–17         2017–18          2018–19      2019–20         2020–21b
     Countrya
                       (tonnes)        (tonnes)         (tonnes)        (tonnes)     (tonnes)        (tonnes)
  Malaysia                  1 900            1 400          10 600           6 600        11 600          2 900
  China                    29 600          27 100            7 700           1 600           3 500        1 200
  Indonesia                 2 100            2 000           6 900         13 700            2 700          600
  Taiwan                      700             700                 800        2 500           1 800          300
  Vietnam                   3 600            3 100           2 900           1 000            500           300
  All other                 3 800            3 600           4 700           2 400           2 000          200
  Total                    41 700          37 900           33 600         27 800         22 100          5 500
Source: ABS (2020) and Envisage Works
a) Countries ranked by average of last three months of exports.
b) Partial year across July 2020 to September 2020.

                                                                                                           25
Table 2.3.3 – Most recent monthly change in Victorian recovered plastics, to export country (tonnes/month)
August 2020 September 2020 % change
Country
(tonnes) (tonnes) (%)
Malaysia 1 000 1 000 0%
China 400 400 0%
Indonesia 200 200 0%
Taiwan 100 100 0%
Vietnam 100 100 0%
All other 100 100 0%
Total 1 900 1 900 0%
Source: ABS (2020) and Envisage Works
Market risks, opportunities and activities
There continues to be significant and growing local demand for high-quality PET and HDPE
packaging recyclate for remanufacturing into many applications, if reprocessed to a high level.
In addition, strong export markets exist for high-quality sorted and washed flake and pellets.
However, a significant shortfall exists in suitable reprocessing capacity locally. What local
reprocessing capacity is available preferentially targets higher value feedstock such as PET
and HPDE packaging recovered from CDS related sources, rather than lower value PET and
HPDE from kerbside sources.
Markets for mixed polymer and low value post-consumer plastic packaging continue to be
under-developed or non-existent.
There is significant new capacity that has either started operating in the last year, or is reported
to be coming online in the next 1–3 years. A summary of this future capacity, that has a
kerbside packaging focus, is inTable 2.3.3. Note that the estimated capacity figures in this table
are highly provisional. We will continue to update this list as information on new reprocessing
facility commitments become public.
Table 2.3.3 – Major new or upgraded Australian plastics reprocessing facilities (kerbside packaging focussed)
Facility name Location Est. capacity Highest reprocessing level Other comments
(tonnes/yr)
Advanced Circular Somerton VIC 20 000–70 000 Sorting and Non-food grade flake
Polymers (ACP) shredding/granulation production
Australian Narrabri NSW 1 000–2 000 Sorting, shredding/ Non-food grade rPET
Recycled Plastics granulation and pelletising production
Coca-Cola Amatil / Unknown Unknown Sorting, shredding/ Food grade rPET and
Veolia granulation and pelletising rHDPE production
PACT Group / Albury NSW 28 000 Sorting, shredding/ Food grade rPET and
Cleanaway granulation and pelletising rHDPE production
PACT Group Wacol QLD 7 000 New product manufacture LDPE film processing
Martogg LCM Dandenong VIC 23 000 Sorting, shredding/ Food grade rPET
granulation and pelletising production
Recycled Plastics Kilburn SA 10 000–20 000 Sorting, shredding/ Non-food grade flake and
Australia granulation and pelletising pellet production
Total - 84 000–145 000 - -
Note: Updated to October 2020
262.4 Kerbside recovered metal packaging
Market developments this month
Development 1 – Prices for recovered tin-plate steel cans and aluminium beverage
cans are fairly steady. No noteworthy changes in scrap prices for scrap metal packaging.
Development 2 – Release of Container Deposit Discussion paper. On 2 November a
Victorian Container Deposit Scheme Discussion paper was released by the Department of
Environment, Land, Water and Planning with submissions sought by 30 November. The
discussion paper proposes a ten-cent levy to apply to some aluminium containers.
Material overview and market summary
Steel and aluminium cans, mostly recovered through kerbside recycling collections from
households, account for only a small fraction of overall metals recovery from Victoria.
MRFs are well equipped to separate these materials from household collections into
marketable grades of recyclate, which although small in volume (around 3–4 per cent of the
average household recycling bin) represent a valuable source of revenue for MRFs.
Recovered steel packaging is considered a low-value form of steel post-consumer, but is still
saleable into overseas markets, sometimes by blending it into mixed grade steel products (e.g.
'black iron'). It is not purchased by local smelter operators in any volume.
Figure 2.4.1 provides data on the change in exports of kerbside recovered metal packaging
since the beginning of 2017. The jump in metal packaging exports across the period of July–
September is due to a large increase in (previously stockpiled locally) exports to India, possibly
following relaxation of Indian import restrictions on tin-plate steel can bales.
Figure 2.4.1 – Destination of Victorian MRF outputs (tonnes/month) – Metal packaging
Note 1: Historical total monthly MRF outputs have been approximated in the figure above to enable comparison
with monthly ABS customs export data. The overall trends are the key aspect of the figure.
27Note 2: The combined ‘Local reprocessing or storage estimate is indicative only, and these fates will be presented separately if this level of data becomes available. Landfill excludes disposal from storage and is an approximation based on annual waste to landfill rates. Source: ABS (2020) and Envisage Works The baled steel and aluminium packaging is sent to a fairly wide range of countries, with the main destinations being India, Indonesia, South Korea, Thailand and Taiwan across the July– September quarter of 2020. Almost all recovered metal packaging is sold into export markets, with no Victorian tin-plated steel or aluminium packaging identified as being reprocessed in Australia. Prices, demand and supply There is now little steel or aluminium packaging post-consumer reprocessed in Australia. However, international markets for these commodities remain strong. There are two aluminium smelter operators in Australia that are reportedly investigating upgrading facilities to take used aluminium beverage cans. These are located in Tasmania and Queensland. This may provide some increased surety of (local) reprocessing capacity, and a buffer from international trading conditions, should they deteriorate. There is no reported significant distressed storage of steel or aluminium packaging, which the jump in exports over the last few months supports. Previously there have been no limits on quantity of steel or aluminium packaging into international markets. However, in the first half of this year we had a taste of how that could change with the tin-plate steel import restrictions into India. Tin-plate steel packaging is not reprocessed in Australia, is low value, and there are reports of high levels of contamination. There is increasing risk of future import restrictions by receiving countries, particularly if mixed grade post-consumer steel imports (e.g. 'black iron' scrap grades) are restricted for any reason, as tin-plate steel is often 'shandied' (blended) into other scrap steel grades to enable its sale. It is worth noting that black iron is designated as an essential material by the Indian Government, and import restrictions are not likely. The price of steel packaging is strongly linked to global steel pricing. The current price received for baled steel packaging is probably around $100–$110 /tonne (EXW MRF). The price of shipped aluminium packaging is linked to virgin aluminium pricing. The current price received for baled aluminium beverage cans is approximately $1,000–$1,100 (EXW MRF). Key end-markets and related specifications Exported steel packaging has specifications relating to contamination levels and bale density. The sorting that is undertaken at MRFs allows the baled material to meet these specifications without major difficulty or manual sorting input. A similar situation exists for aluminium packaging. Generally steel and aluminium packaging is recycled back into the respective post-consumer metal pools and go into durable applications such as vehicles, building materials and many other products. Export and interstate market review The exported steel and aluminium packaging are sold into large markets with most metal coming from non-packaging sources. The material flows from all countries and is destined for wherever the demand requires material for production. Unlike some other materials, there is no way of knowing the origin of the steel or aluminium in new product. Demand and pricing can increase or decrease based on worldwide supply and demand conditions. If a large market such as India suffered a longer-term contraction in economic activity due to coronavirus (COVID-19) this could result in ongoing price reductions. The worldwide virgin 28
You can also read