INVESTMENT PERSPECTIVES 2021 - JANUARY 2021 - Forum Finance Group
←
→
Page content transcription
If your browser does not render page correctly, please read the page content below

INVESTMENT PERSPECTIVES 2021

JANUARY 2021
INVESTMENT PERSPECTIVES 2021

TABLE OF CONTENTS

EXECUTIVE SUMMARY                                                      1

2020: REVIEW OF OUR INVESTMENT THEMES                                  2

2020: ECONOMIC & POLITICAL DEVELOPMENTS                              3-6

2020: THE FINANCIAL MARKETS         						                          7-12
       Equities             							                                  7-8
       Commodities 								                                            9
       Debt instruments, Currencies 						                         10-11
       Hedge funds								                                         11-12

2021 : ECONOMIC OUTLOOK							                                     13-15

2021: FINANCIAL MARKETS’ OUTLOOK					                             16-18

2021: ASSET ALLOCATION							                                     19-23
        Debt instruments							                                      19
        Equities         							                                  19-20
        Commodities							                                           20
        Gold									                                                20
        Alternatives							                                          20
        FFG portfolio construction					                              21
        Hedge funds/structured products                              22
        Asset allocation grid                                        23
INVESTMENT PERSPECTIVES 2021
EXECUTIVE SUMMARY
2020 was one of the most dramatic years for financial A successful rollout of COVID-19 vaccines is key for a
markets strong economic rebound in 2021
The past year has been a rollercoaster ride for investors The outlook for 2021 is for a strong rebound of GDP
as the fastest equity market correction in history was growth, + 5.2% according to the IMF, following a
followed by a swift and relentless rally. Equity markets year when global GDP is estimated to have dropped
have proven to be very resilient and very forward- by around 5%, the worst peacetime recession.
looking as they quickly priced in a strong rebound of Unprecedented fiscal actions and the rollout of vaccines
earnings for 2021. This has been reflected by a significant are expected to significantly boost economic activity,
re-rating of valuations which leave little room for any even if some sectors are unlikely to be able to return to
disappointments related to the publication of profits in pre-COVID-19 levels of activity. Governments will also
the year ahead. need to provide the framework for a successful and
strong immunization programme by regaining public
The Federal Reserve intervened decisively to address trust, which has been dented by the management of the
the severe dislocations observed in the bond markets, crisis.
a key element to re-establish confidence. In addition to
purchasing Treasuries and investment-grade corporate Current market conditions are supportive for risky
bonds, the Fed also committed to buy high-yield bonds assets despite rich valuations
for the first time ever. Once markets had stabilised,
another strong trend was for the US dollar to depreciate We believe that the positive trends currently prevailing
against most currencies. The market broadly expects in financial markets should extend into 2021. Despite
this behaviour to be extended into 2021. high valuations, we expect equities to benefit from a
strong rebound of earnings in the coming quarters and
Policy makers did their job in 2020 the portfolios are positioned accordingly. High yield
credit and emerging market debt are our favourite
Central bankers and governments reacted promptly bond segments whereas our dollar exposure remains
and decisively to support the economy and to limit underweight. We are wary of a broad market consensus
the damage caused by the pandemic on businesses on the various asset classes as history has shown that
and households. Record-breaking aid packages and the markets’ base case scenario is often derailed by
unprecedented support for financial markets were unforeseen events.
announced. The Federal Reserve slashed its benchmark
interest rate to zero and committed to an unlimited
expansion of its bond purchasing programs. The ECB
also ramped up its asset purchase program and has
recently announced an additional increase of €500
billion to a total of €1.85 trillion until March 2022.
The overall size of fiscal action globally has also been
unprecedented, at about $12 trillion, close to 12% of
global GDP, according to the International Monetary
Fund. With economic activity being restricted by
governments, their main objective was to prevent
massive unemployment and to help businesses to
survive the pandemic-induced shutdowns.
1INVESTMENT PERSPECTIVES 2021
2020: REVIEW OF OUR INVESTMENT THEMES
Active management added a lot of value to portfolios Our decision to ride out the market correction allowed
us to more than recover losses
Taking account of the totally unpredictable event which
took place in 2020, it makes little sense to spend too In early March we partially protected the equity portfolio
much time revisiting our 2020 forecasts! As a reminder, by purchasing S&P 500 Index puts. This decision
we had positioned the portfolios dynamically at the significantly reduced the volatility of portfolios and
beginning of 2020 as we had increased the exposure to allowed us to maintain their structure and exposure. In
equities and to emerging market corporate debt. What the light of the ensuing recovery of the markets, this
strikes us the most when analysing the performance tactical management of risk proved to be key to be
of our investments throughout the past year is the able to more than recover the mark-to-market losses
significant outperformance generated by active observed in March. The outright holding of puts was
managers across many strategies. Japanese equities, later replaced by a put spread which continued to
US and European small caps and European value provide some downside protection, but at a reduced
were some of the areas where our active managers cost, thanks to the selling of puts at a lower strike level.
outperformed their reference benchmarks the most. This These hedging transactions must be deemed as being
resulted from their stock-picking ability in a year when tactical trades and, under normal market conditions,
dispersion between sectors and individual companies we do not expect to be investing into these types of
was particularly wide. Active managers also fared well in instruments.
the credit space. Some had already reduced their levels
of risk at the beginning of the year due to concerns The portfolios benefited from a diversified equity
over valuations; they had also taken advantage of allocation
cheap volatility to add hedges which proved to be most
valuable during the correction of the markets. Another factor that served us well in 2020 was our
broad diversification across regions, styles and market
Hedge funds were also positive contributors towards the capitalisation sizes. While growth stocks outperformed
performance of portfolios, and they helped to cushion for large parts of the past year, value stocks produced a
some of the drawdown experienced by portfolios in spectacular contribution in November. The prospect of a
March. Our underweight US dollar exposure for non-USD return to normal thanks to vaccines effectively triggered
denominated portfolios proved helpful as it limited the a rebound of market laggards. The exposure to Japanese
negative contribution of the greenback’s depreciation in equities also contributed well during the months of
2020. September and October when other developed markets
dipped. Finally, small and mid-caps produced significant
contributions throughout the year, both in Europe and in
the US. Heading into 2021, our equity allocation remains
well diversified.
2INVESTMENT PERSPECTIVES 2021
2020: ECONOMIC AND POLITICAL DEVELOPMENTS
An unprecedented shock for the global economy
What took place over the course of 2020 can best be and of whole economic sectors have wreaked havoc
described as an unpredictable and unprecedented event on the global economy. The positive aspect is that this
for most of the world’s population. Other pandemics economic contraction was triggered by an exogeneous
have been much more deadly, and infectious diseases factor at a time when there did not appear to be major
have been around for ever. The economic damage structural imbalances within the global economy. This
caused by the COVID-19 pandemic is on a totally should mean that the ensuing economic recovery will
different scale, however, to what has been observed be much quicker than those which followed previous
during other recent disease outbreaks. Lockdowns, recessions, especially now that several successful
curfews, quarantines as well as the closing of borders vaccines have been announced.
Economic activity came to a standstill
140’000
Number of commercial flights tracked by Flightradar24, 2020 vs 2019
120’000
100’000
80’000
60’000
40’000
20’000
2020 7-day moving average
2019 7-day moving average
0
January March May July September November
Source: Flightradar24
We could have selected many different high-frequency charts 75% in April compared to 2019; the ensuing recovery has only
to illustrate the severe economic impact of the wide-ranging brought the number of commercial flights back to just over
government restrictions across the world to contain the 60% of the previous year’s level. The much-feared ongoing
pandemic. International and domestic air transportation has second wave has forced many governments, in Europe in
been one of the most affected sectors as borders were closed particular, to reintroduce watered-down versions of lockdowns,
and quarantine rules were imposed on travellers. The chart with the effect of pushing part of the economy back into
shows that the number of commercial flights dropped by over contraction during the last quarter of 2020.
3INVESTMENT PERSPECTIVES 2021
A severe economic contraction due to the COVID-19
pandemic
A year ago, economists were forecasting a modest pick- GDP estimated to have dropped by around 5%, the
up of global GDP growth for 2020. The outcome has worst recession observed since the second world war.
obviously turned out to be very different, with global
World GDP growth 1871-2021
Percent GDP growth
8
2
-4
-10
1871 1901 1931 1961 1991 2021
Source: The World Bank
The chart shows that the economic contraction amplitude have only taken place during both world wars
experienced in 2020 figures amongst the worst recessions and during the great depression of the 1930s. The IMF
observed in over 150 years. Contractions of a similar currently forecasts GDP growth of 5.2% for 2021.
A massive coordinated effort by monetary and fiscal
policymakers
In contrast to what took place during the great financial total of € 1’850 billion until March 2022 and improve the
crisis, central bankers and governments reacted terms of financing for credit institutions.
promptly and decisively to support the economy and
to limit the impact of the pandemic on businesses The overall size of fiscal action globally has also been
and households. Record-breaking aid packages and unprecedented, at about $12 trillion, close to 12% of
unprecedented support for financial markets were global GDP, and additional programs are still being rolled
announced. The Federal Reserve slashed its benchmark out or being discussed. With economic activity being
interest rate to zero from 1.5% in two emergency restricted by governments, their main objective was to
moves and committed to an unlimited expansion of extend critical lifelines to households and to firms in
its bond purchasing programs. After a stuttering start order to prevent massive unemployment and to help
in its answer to the crisis, the ECB also ramped up its businesses to survive. On average, the fiscal response to
asset purchase program to € 1’100 billion. At its recent the COVID-19 crisis has been of around 10% of GDP, in
December meeting, the bank has announced that it advanced economies, compared to a level of around 3%
would increase its PEPP program by €500 billion to a for emerging market and middle-income economies and
1.6% for low-income developing countries.
4INVESTMENT PERSPECTIVES 2021
Major six central banks’ balance sheet (12-month flow, USD tr. 2021 estimate)
NET INJECTION (+)
FED [$3.0Tr] PBOC [$0.4Tr]
ECB [$2.9Tr] BOJ [$1.4Tr]
BOE [$0.4Tr] SNB [$0.2Tr]
MAJOR 6 [$8.4Tr]
USD Tr
NET DRAIN (-)
2008 2010 2012 2014 2016 2018 2020 2022
Source: Pictet Asset Management
The chart above shows the level of intervention, on Unsurprisingly, the Federal Reserve and the European
a 12-month rolling basis, by the six major central Central Bank have been the largest buyers of financial
banks since 2008. In 2020, the total size of these assets, not only in the form of sovereign debt but also of
six balance sheets has exploded by $8.4 trillion, a corporate bonds.
staggering amount when compared to previous years.
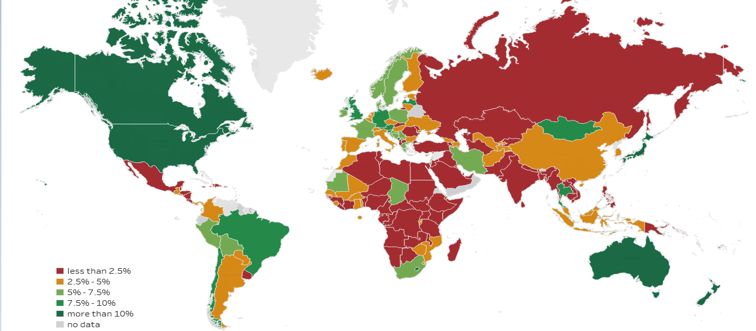
Additional spending and forgone revenue in response to the COVID-19 pandemic (% of GDP)
The budgetary fiscal support to households and firms has First, they were hit earlier and harder by the health crisis.
varied widely by country. The IMF chart above shows that Second, their central banks were able to provide more
advanced economies and large emerging markets account monetary support and, third, their treasuries were able to
for the bulk of the global fiscal response, for three reasons. finance larger deficits at lower interest rates.
5INVESTMENT PERSPECTIVES 2021
General government debt (% of GDP)
140 WWI WWII Global Great
financial Lockdown
Crisis
120
Advanced economies
100
80
60
40
20
Emerging market economies
0
1880
1883
1886
1889
1892
1895
1898
1901
1904
1907
1910
1913
1916
1919
1922
1925
1928
1931
1934
1937
1940
1943
1946
1949
1952
1955
1958
1961
1964
1967
1970
1973
1976
1979
1982
1985
1988
1991
1994
1997
2000
2003
2006
2009
2012
2015
2018
2021
Source: IMF
The issue of fast-rising levels of government debt is not average general government debt of advanced economies
going away anytime soon, especially after this year’s fiscal to 126% of GDP in 2020, a significant increase from 105%
response to the COVID-19 crisis. The broad range of fiscal in 2019.
measures and the economic contraction will push the
The victory of Joe Biden augurs a reset of US
leadership
On the political front, the main event in 2020 was the majority in the Senate, he is widely expected to return
widely anticipated November US election. Despite the the United States to its more traditional role on the
plethora of legal challenges by the Trump administration world stage. Biden will be looking to repair strained
to overturn the results in the US presidential election, the relationships and to re-join global alliances. This change
victory of Joe Biden leaves little room for doubt. While of foreign policy should contribute to less volatile
his ability to introduce significant reforms could be trade relationships, lower geopolitical tensions and an
hampered, were the Republicans to hold on to their emphasis on fighting against climate change.
CONCLUSIONS
The main conclusion we can draw from last year’s accounts and reducing the levels of government debt
economic and political developments is that the global will be challenges for the future, especially as a too rapid
economy has been hit by a “black swan” event which has withdrawal of fiscal support could derail the anticipated
caused considerable damage. Fortunately, policy makers recovery. Central banks’ policies will remain key. They
reacted decisively and, so far at least, have prevented will continue to be geared towards capping the levels
even more severe consequences for households and of long-term interest rates and, thus, to ensure that the
businesses. The longer-term impact of the COVID-19 cost of servicing what have become much higher levels
crisis remains difficult to assess, especially for certain of debt does not spiral out of control for many countries.
sectors of the economy. The issues of rebalancing fiscal
6INVESTMENT PERSPECTIVES 2021
2020: THE FINANCIAL MARKETS
The past year has been most dramatic for financial government bond markets in March. Other bond market
markets. Following a positive start, financial markets segments took longer to settle down and for the primary
collapsed towards the end of February. All asset classes markets to re-open, while most equity markets had hit a
were swept away by a massive wave of liquidations and trough by March 23rd. The ensuing recovery of financial
even the safest assets, including Treasuries and gold, markets has been just as spectacular as their first-
failed to resist. The swift and decisive actions of the quarter correction and many indices have ended 2020
Federal Reserve were key in bringing stability back into with positive returns.
2020 performance
End 2019 End 2020 2020 performance
EQUITIES
S&P 500 3'230.8 3'756.1 + 16.3%
Euro Stoxx 50 3'745.2 3'552.6 - 5.1%
MSCI EM 1'114.7 1'291.3 + 15.8%
YIELDS
UST 10-year 1.92% 0.92% - 100bps
Bund 10-year - 0.19% - 0.57% - 38bps
BBB EU 0.97% 0.44% - 53bps
CURRENCIES
EUR/USD 1.121 1.222 + 9.0%
USD/CHF 0.967 0.885 - 8.5%
GBP/USD 1.326 1.367 + 3.1%
USD/JPY 108.6 103.3 - 4.9%
EUR/CHF 1.086 1.081 - 0.5%
COMMODITIES
CRB Index 185.8 167.8 - 9.7%
Oil, WTI $ 61.1 $ 48.5 - 20.6%
Gold $ 1'517 $ 1'898 + 25.1%
EQUITIES
In 2020 the impact of all the restrictions imposed by valued at nearly 23 times their next twelve months
governments worldwide badly hit the profitability of estimated earnings. The rally of equities has also been
many companies. The combined effect of these lower supported by lower bond yields, excess liquidity and by
earnings and a strong rebound of equity prices since expectations of a strong recovery of earnings in the year
March has propelled index valuations much higher. The ahead. The environment during most of 2020 proved to
forward price-to-earnings ratio of global equities has be much more supportive for growth stocks even if the
effectively risen from around 18x at the end of 2019 to announcement of successful vaccines gave a huge boost
close to 20x a year later, with US equities now being to value stocks in November.
7INVESTMENT PERSPECTIVES 2021
MSCI World Local
2.100
MSCI World Local
2.000
1.900
1.800
1.700
1.600
1.500
1.400
1.300
1.200
Dec-19 Mar-20 Jun-20 Sep-20 Dec-20
Source: Bloomberg LP
Global equity markets got off to a solid start in 2020 following a bear market; this rally was driven by the
thanks to a decent GDP growth outlook and to hopes over unprecedented and quick response by central banks and
an improving environment for world trade. This trend was governments which announced measures largely superior
soon shattered due to the spreading of the coronavirus as in size to those deployed during the great financial crisis.
investors realized that it would not remain confined to Asia. US equity markets have outperformed due to the outsized
The plunge of equity markets was brutal with the MSCI contribution of a small number of mega-caps in the
World Local index collapsing by 33% in just over a month. Technology and Communications sectors. The Chinese
This market correction was amplified by the unwinding of a stock market was another winner as the country’s drastic
high level of leverage. Equity markets then rebounded at a measures proved effective to control the pandemic and to
pace never observed previously during equity recoveries enable to re-open the economy.
Nasdaq Composite – MSCI Emerging Markets – Euro Stoxx 50
50%
40% Nasdaq Composite
MSCI EM
Euro Stoxx 50
30%
20%
10%
0%
-10%
-20%
-30%
-40%
Dec-19 Mar-20 Jun-20 Sep-20 Dec-20
Source: Bloomberg LP
As shown in the chart above, the Nasdaq Composite contrast, European indices have lagged, in part due to a
index was the star performer in 2020 thanks to lower exposure to these themes and because of a larger
strong contributions from “stay-at-home” stocks; exposure to badly hit cyclical sectors. Emerging markets
pre-coronavirus trends, such as online commerce have held up well, in reason mainly of the resilience of
and a digitalisation of the economy, have accelerated certain Asian markets such as those of China, South
significantly since the spreading of the disease. In Korea and Taiwan.
8INVESTMENT PERSPECTIVES 2021
COMMODITIES
CRB Index & WTI oil
10%
-10%
-30%
-50%
CRB Index
-70%
WTI
-90%
-110%
-130%
-150%
-170%
Dec-19 Mar-20 Jun-20 Sep-20 Dec-20
Source: Bloomberg LP
The Refinitiv/Core Commodity Index ended 2020 with a The past year has been particularly painful for oil-
negative performance, largely due to the impact of lower producing countries. With large parts of the economy
prices within the energy sector (39% of the index). The being at a standstill, demand for oil products collapsed;
behaviour of the index mirrored that of equity indices WTI prices traded 80% lower in April than in January. May
as commodity prices collapsed in March and started to 2020 future contracts even traded at negative prices,
rebound from the end of that month onwards. Precious as low as minus $38, with traders being unable to take
metals performed well as did industrial metals and lumber physical delivery due to a lack of storage capacity. Prices
in anticipation of a cyclical recovery; dollar weakness has have since rebounded and recently benefited from the
also been a contributor to the recent strength of the asset announcement of vaccines, but they remain well below
class. early-2020 prices.
Gold
$2,100
Gold ounce
$2,000
$1,900
$1.800
$1.700
$1.600
$1.500
$1.400
Dec-19 Mar-20 Jun-20 Sep-20 Dec-20
Source: Bloomberg LP
Following a 19% gain in 2019, gold has had another investors reacted to the expansion of central banks’
strong year even if it has not been plain sailing for the balance sheets, lower yields and a weaker dollar. Profit-
precious metal. During the March market selloff, the taking and a lower demand for haven assets have since
price of an ounce of gold dropped by more than $200 taken some shine off the precious metal which has
to $1’470. The ensuing rebound was very powerful, and ended the year at $1’898 per ounce.
gold reached a peak of $ 2’064 in early August as
9INVESTMENT PERSPECTIVES 2021
DEBT INSTRUMENTS
Government bond yields trended lower from the onset dysfunctional, and bond yields spiked. The massive
of 2020 as sovereign debt markets appeared to be in intervention of the Federal Reserve contributed to restore
a much more cautious mood than equity markets. This some calm and yields then stabilized at levels of around
decline accelerated dramatically from the middle of 0.60% for 10-year Treasuries and - 0.50% for Bunds with
February until March 9th; 10-year Treasury and Bund the same maturity. For credit and emerging markets, the
yields plunged from 1.65% and - 0.36% to all-time lows of stress lasted longer but the re-opening of the primary
0.32% and - 0.87%, respectively, as investors scrambled market was swiftly followed by a record amount of new
for defensive assets. Amid the ensuing period of market issuance as companies shored up their balance sheets.
chaos, even government bond markets were totally
10-year U.S. and German government bond yields and spread
2,5%
10-year UST
2,0% 10-year UST/Bund spread
10-year Bund
1,5%
1,0%
0,5%
0,0%
-0,5%
-1,0%
Dec-19 Mar-20 Jun-20 Sep-20 Dec-20
Source: Bloomberg LP
The chart shows the highly correlated behaviour of between Treasuries and Bunds tightened significantly
Treasuries and Bunds until the later part of the year. With until April. Following a stable five-month period, a
the Federal Reserve slashing interest rates to zero from divergence has been observed with the gradual rise of
1.5% in two emergency meetings, the 10-year spread Treasury yields and Bund yields remaining capped.
Emerging Market Debt and U.S. High Yield spreads
11%
US HY debt spread over UST
10% EM debt spread over UST
9%
8%
7%
6%
5%
4%
3%
2%
Dec-19 Mar-20 Jun-20 Sep-20 Dec-20
Source: Bloomberg LP
High yield credit and emerging market debt spreads expected to continue benefiting from central bank
widened significantly in March, but they have since action and from a search for income. The yields of US
gradually declined. Spreads remain slightly superior to high yield credit are now at record lows, in absolute
pre-coronavirus levels but both asset classes are terms.
10INVESTMENT PERSPECTIVES 2021
Debt instruments’ market performance in 2020 (USD)
World Government Bond Index + 5.7%
US Credit AAA + 9.0%
US Credit BBB/BB + 11.4%
Global Emerging Market Sovereign + 5.4%
US High Yield + 6.3%
CURRENCIES
As for other asset classes, 2020 was a volatile year for year with a 3.1% gain at a parity of 1.37. The currencies of oil-
the currency markets. The main trend observed was the producing countries were badly hit by an early-year collapse
depreciation of the US dollar, once the worst of the market of oil prices whereas the Turkish Lira and the Argentine
stress had ended. The Federal Reserve provided dollar Peso confirmed their status as perennially weak currencies.
liquidity swaps with many foreign central banks to satisfy a Within emerging markets, the strong performance of Asian
rush for US dollars in March. From then onwards, the dollar currencies contrasted with the weakness of Latin American
consistently trended lower. The best performers, within ones; the Chinese renminbi, the Taiwanese dollar and
the major crosses, were the Swedish, Swiss and Danish the South Korean won all benefited from their countries’
currencies as well as the euro. Sterling was very volatile as it successful containment of the coronavirus and from strong
dropped from 1.33 dollars per pound to 1.15 before ending the exports’ orders.
10,0%
Dollar Index
8,0% EUR/USD
EUR/CHF
6,0%
4,0%
2,0%
0,0%
-2,0%
-4,0%
-6,0%
-8,0%
Dec-19 Mar-20 Jun-20 Sep-20 Dec-20
Source: Bloomberg LP
The chart shows that the dollar index has evolved within the euro has appreciated by 13% against the US dollar.
a wide range throughout 2020 and depreciated by As to be expected, the Swiss franc appreciated against
6.7%. Since the European Commission, the European the euro during the first quarter market turmoil. Since
Parliament and EU leaders agreed on a €750 billion then, the EUR/CHF parity has recovered the bulk of its
recovery plan in May to lead the region out of the crisis, losses to end the year with a marginal loss.
HEDGE FUNDS
As equity markets, hedge funds had a tough first quarter in 2020 will be targeting macro and fixed income strategies (including
even if they generally experienced much lower drawdowns in long/short credit) compared to a year ago, with virtually no
March. Hedge fund performance, at a global index level, entered additional interest for funds of hedge funds.
positive territory during the third quarter and was led by long
biased equities, discretionary macro and activist strategies. According to Hedge Fund Research, investors allocated new
Market opportunities have been abundant for hedge funds. capital to the hedge fund industry in the third quarter of
Dovish central bank policy provided a backstop to credit markets 2020, the first quarterly net inflow since the first quarter of
and boosted inflation expectations, leading to gains for gold and 2018. Led by macro and relative value strategies, net inflows
commodities. Merger and arbitrage activity were also supported were of $13 billion, increasing the total industry capital to
by ample liquidity while volatility has remained above longer-term $3.31 trillion. Inflows were led by the industry’s largest firms,
average. According to Preqin data, a larger portion of investors with $11 billion in net asset inflows.
11INVESTMENT PERSPECTIVES 2021
HFRX Global Hedge Fund Index
1.400
HFRX Global Hedge Fund Index
1.350
1.300
1.250
1.200
1.150
Dec-19 Mar-20 Jun-20 Sep-20 Dec-20
Source: Bloomberg LP
Hedge Fund strategies’ performances in 2020 (*end November)
HFRX Global Hedge Fund Index + 6.6%
HFRX RV FI Convertible Arbitrage Index + 15.6%
HFRX Multi-Emerging Markets Index + 6.9%*
HFRX RV FI Corporate Index + 2.9%*
HFRX Equity Hedge Index + 4.2%
HFRX Macro Multi-Strategy Index + 4.3%*
HFRX Event Driven Index + 8.7%
HFRX Equity Hedge Short Bias Index - 33.8%*
HFRX Macro Systematic Diversified CTA Index + 1.7%
12INVESTMENT PERSPECTIVES 2021
2021: ECONOMIC OUTLOOK
A strong recovery is expected to take place in 2021
The global economy is expected to rebound strongly in of a more stable political landscape, both in Europe and in
2021 following the pandemic-induced shutdown of 2020. the US, the economic outlook for the year ahead appears
The impact of monetary and fiscal policy support and the encouraging. The issue of Brexit has finally been resolved, and
deployment of vaccines will be the main drivers for this a last-minute agreement between the European Union and
economic recovery. Expansionary fiscal policies will need to the United Kingdom should only strengthen the case for the
remain in place throughout the next years with the ongoing European economy in 2021.
help of central banks. In Europe, the Recovery fund will
effectively support struggling countries and industries, and, The World Bank and the IMF estimate that global GDP will
in the US, Congress has just approved a second pandemic climb by over 5% in 2021. From a regional perspective, the
relief package worth $900 billion. Budget deficits will remain consensus anticipates GDP growth of 3.9% in the US, 8.2% in
high for the foreseeable future with debt to GDP levels staying China and 4.6% in the Eurozone. These forecasts will obviously
well above 100% in all developed countries. Debt burdens depend on the success of the vaccination programmes which
will be bearable, however, as interest rates should be kept began towards the very end of 2020. The ability to make
under control by central banks, meaning that the cost of some of the vaccines widely available will present a logistical
servicing debt will not be a problem as long as investor trust is challenge, whereas various studies have shown that low
maintained; monetary policy will also finance part of the debt vaccine confidence could also mean it might be difficult to
through purchases of government bonds. With the help achieve herd immunity quickly.
Leading indicators: Purchasing Manager Indexes
60
50
40
30
U.S. ISM Manufacturing PMI
U.S. ISM non-manufacturing PMI
20 China Caixin manufacturing PMI
EU Markit Composite PMI
EU Markit Services PMI
10
Dec-19 Mar-20 Jun-20 Sep-20 Dec-20
Source: Bloomberg LP
The chart above shows the unprecedented plunge of PMI the collapse of the Services PMI Index to a level never
Indexes during the second quarter. It also illustrates the observed previously; new restrictions have pushed the
solid recovery of Chinese manufacturing activity as well index below 50 again in the 4th quarter, indicating that
as the resilience of the US non-manufacturing Index. The services’ activity is back into contraction territory.
Eurozone was the worst hit region which is reflected by
Significant pent-up demand due to households’ excess savings
The economy cannot recover properly until COVID-19 surge in consumer spending, with the services’ sectors
restrictions are lifted and a large portion of the population being the main beneficiaries. People will obviously not
has been vaccinated. Once that happens, it is reasonable be able to catch-up on all last year’s missed spending on
to expect people to largely return to their previous way of services, but they will likely want to make up for lost time
life. This should in turn logically trigger an unprecedented from the spring onwards.
13INVESTMENT PERSPECTIVES 2021
Household Saving Rate in the United States
35 33,7
30
24,7
25 19
20 18,6
15,1 14,6
15 13,6
12,9
10 8,3
7,5 7,2 7,6
5
Jan 2020 Apr 2020 Jul 2020 Oct 2020
Source: tradingeconomics.com I U.S. Bureau of Economic Analysis
The chart shows the impact of the closure of many trillion. Household savings have also increased massively
services sectors and the one-time stimulus payments in Europe, as a result of income support via furlough
on US household saving rates last spring. According to schemes, and due to households being prevented from
Pantheon Macroeconomics, US households have added consuming many services. These unspent savings could
$1.7 trillion in savings deposits since last February and, by boost Eurozone GDP by as much as 3% in 2021, according
next spring, the accumulation of deposits should reach $2 to Pantheon Macroeconomics.
Asia emerges as a relative winner from the crisis
The Asia-Pacific region was the first to be impacted by the economies and Asia appears to be on a more solid footing
COVID-19 pandemic and many of its economies logically at present, both from an economic standpoint and on the
emerged from it first. Asia has done well in comparison to virus front. The election of Joe Biden is likely to reduce
other regions, probably due to its experience from previous the risks related to the US’ tariff and trade policies, an
pandemics. An early public health response, when infection important factor not only for Asia but for global activity as
rates were still low, was key to flattening the virus curve well. New stimulus measures from Washington would be
and authorities also managed the post-lockdown policies good for export-oriented economies such as China, Japan,
generally better. Fiscal support was also critical to reduce Korea or Taiwan. The IMF expects Asian economic activity
economic costs and to support the recovery. The strong to grow by 6.9 percent in 2021 following an estimated
rebound of China contributed to boost other Asian contraction of - 2.2% the past year.
COVID-19 has been a watershed moment for fiscal policy in the Eurozone
For the Eurozone, 2020 will be remembered as the year out as budgetary support to member states. It will also
that EU fiscal policy shifted towards a mutualisation ensure that their economies undertake climate and digital
of Eurozone debt, even if maybe only temporarily. transitions. Some commentators on recent EU history
Europe’s political leaders agreed early that the costs to hailed this as a Hamiltonian moment, a reference to
support the economy through the pandemic would not Alexander Hamilton, the visionary who spearheaded the
represent a violation of the budget rules. This decision federalisation of states’ debt in the US. In any case, these
was then followed by the approval of the Recovery Fund, actions have removed some of the political and economic
a combination of grants and loans, which will give the risks in the Eurozone and triggered a significant tightening
European Commission the unprecedented power to of peripheral spreads.
borrow hundreds of billions on the markets and hand it
14INVESTMENT PERSPECTIVES 2021
Conclusions
Consensus expectations are for a strong economic The removal of several political risks, including the
rebound in 2021, from a low base. This recovery US elections and Brexit, as well as a higher degree of
should be driven by a significant pick-up of consumer unity within the Eurozone should be supportive for
spending, due to pent-up demand, and by the the global economy. Even if tensions between the
ongoing support of fiscal policies. There remain many US and China are unlikely to disappear suddenly, the
unanswered questions relative to the pandemic and relations between the US and Europe should improve
the risks that unforeseen developments could derail considerably. Joe Biden is likely to revert to a more
the timing of the recovery should not be dismissed too rules-based multilateral approach which should give
quickly. greater predictability of policy than experienced
previously under Donald Trump.
The contribution of Asia to global GDP growth
continues to rise and the economic strength of China
will continue to boost surrounding economies. A better
public health response has allowed Asian countries to
recover pre-crisis activity levels faster and to limit the
impact of COVID-19 on their economies. The region
is also widely expected to benefit from less fractious
international relations following the election of Joe
Biden as US president.
15INVESTMENT PERSPECTIVES 2021
2021: FINANCIAL MARKETS’ OUTLOOK
Elevated market sentiment Markets remain reliant on the policies of the major
central banks
We are upbeat about the prospects for positive portfolio
returns in 2021 but are wary of the prevailing elevated As already was the case in 2019, the monetary policies of
market sentiment. Our base scenario anticipates a strong the main central banks were the main drivers of the rally
rebound of earnings as the global economy gradually of financial assets from March 2020 onwards, even if fiscal
recovers and consumer spending picks up, albeit from policies also played a major role this time around. This
low 2020 levels. The consensus among investors is dependence of markets on the actions of central bankers is
extremely bullish however, with fund managers’ surveys not going away any time soon and the latest decision from
showing that the levels of cash are now lower than the ECB to increase the size of its asset purchases only
before their pre-COVID 19 levels. Investors are overweight confirms this. Markets anticipate that central banks will act
equities at a time when valuations are very demanding, to prevent the longer end of yield curves from moving much
meaning there is little room for disappointments. higher and this is obviously reflected in the valuations across
all asset classes. Monetary policy has become increasingly
supportive of fiscal policies and this will be no different
in the years ahead. Any withdrawal of measures is highly
unlikely at this stage, but the risk of a policy mistake could
well be underestimated by the markets.
DEBT INSTRUMENTS’ OUTLOOK
Sovereign bonds look as unattractive as ever balance should provide support for high yield bonds.
Spreads have tightened significantly since March, but
We see little value in long-term interest rates in view they could well tighten beyond pre-COVID 19 levels and
of their extended valuations and the risks of upside contribute to returns which will largely be driven by
pressure if the economy were to recover as expected. carry.
Central banks will obviously continue to conduct very
loose monetary policies and try to limit rising debt Investors are likely to favour emerging market debt
servicing costs for the many countries whose levels of
debt to GDP has increased significantly during the last We believe that emerging market debt is one of the
year. Some exposure to the most highly rated sovereign most attractive fixed income segments. Positive yields,
debt is unavoidable, for portfolio construction purposes, FX appreciation potential and export activity, with China
but the risk/reward of the asset class is unappealing. in particular, should continue to generate demand for EM
debt.
Corporate credit should benefit from several factors
We have a positive outlook on corporate credit,
especially on high yield. The ongoing search for yield,
the support from the accommodative policies of the
main central banks and a favourable demand/supply
16INVESTMENT PERSPECTIVES 2021
EQUITY OUTLOOK
A recovery of earnings should drive equities higher Nevertheless, valuations have not been the main driver
of markets for some time and they are not a good
The main support for higher equity prices in 2021 should indicator for timing the market. That is why we still
be provided by a significant rebound of earnings. feel comfortable with our moderate overweight equity
For global equities, earnings are expected to grow allocation, especially as the recovery of earnings is likely
by around 25% (profit growth of 22% for the US and to be accompanied by a derating of valuations, bringing
34% for Europe). Taking account of dividends and them nearer to their long-term averages.
expectations for a decline of valuations, the return of
equities is expected to be in the low double-digits. Little room for disappointments
Massive fiscal and monetary stimulus programmes will
continue to provide the background for share prices. One of the key risks for equities are the overriding
Emerging market equities should benefit from foreign market consensus and the confidence over the
flows and from the economic recovery, especially those unwavering monetary and fiscal support. In 2020,
of commodity-exporting countries. Japanese equities earnings proved to be much less impacted by the
are likely to continue to be supported by the country’s COVID-19 crisis than analysts had feared. There is a
strong trade ties with China whereas small caps risk that expectations for 2021 earnings could be over
traditionally perform well in a cyclical recovery. optimistic. Any unwinding of the market’s current equity
overweight could lead to an unexpected selloff. Recent
Valuations are likely to come down developments have showed that there is still a long way
to go before the pandemic can be fully considered to be
From a historical perspective, equity valuations are very under control. Let’s hope that 2021 will not be affected
high. Markets have already discounted a rebound of by another “black swan” event in view of the bullish
earnings in the year ahead in anticipation of a gradual consensus among investors.
return to some normality for the global economy.
ALTERNATIVES
Hedge funds have an important role to play Structured products
Even if all our hedge fund funds did not match our In view of the challenge of finding investments that
expectations during the past year, it has been reassuring offer real diversification benefits for the portfolios,
to have benefited from the diversification provided by we will continue investing into a range of structured
some strategies. Global Macro and CTA will continue to products. We will stick to our opportunistic approach
be part of the portfolios and we have boosted our hedge as we continuously monitor market conditions in order
fund allocation recently by the addition of a Long/Short to optimize the entry point for the different types of
credit fund. structures.
17INVESTMENT PERSPECTIVES 2021
GOLD OUTLOOK
Gold to play a strategic role A more favourable environment for gold
Following a strong rally from March until early August, Notwithstanding the short-term prospects for gold
the price of gold has given up some of its gains as prices, this should not detract from the fact that gold
investors’ demand for defensive assets has decreased. remains a haven asset and a hedge against the more
Even if this consolidation phase could be extended extreme risks. The downwards pressure on real interest
further, we continue to view gold as a strategic asset. rates and potential additional dollar depreciation are just
In a context of negative real interest rates and of an two factors that should benefit gold, especially in view
ongoing expansion of central banks’ balance sheets, of the limitations of the safest fixed income assets.
gold should be well supported by its role as a real asset
whose supply is finite.
CURRENCY OUTLOOK
The US dollar likely to lose more ground fund. The risks related to the finances of individual
countries have decreased which have been reflected
We expect the weakness of the US dollar observed by tighter peripheral bond spreads. The euro could also
since last spring to continue in the year ahead, even be supported by foreign inflows into European equities
if at a slower pace. The US has a considerable current which have more exposure to cyclical sectors than the
account deficit, on top of a high fiscal deficit, and it US equity market for example.
requires massive foreign inflows to finance this. With
the expected recovery of the global economy, more Good potential for EM FX
and more capital is likely to flow to countries where the
economy is doing well, leading to a further decline in The currencies of emerging markets offer upside
the dollar exchange rate. There are some risks to this potential in view of an anticipation of a global reflation
scenario, however. The main one is the bullish consensus scenario and massive dollar liquidity. EM assets are
on dollar depreciation, already reflected by extreme attractive in relative terms and foreign inflows should
market positioning. Another is the risk that US long-term boost the exchange rates of their currencies. The
interest rates could rise more and sooner than elsewhere, currencies of commodity-producing countries should
adding potential support to the dollar. also be supported by ongoing demand for commodities.
The euro could appreciate further against the dollar
In our base case scenario, the euro should continue to
appreciate against the US dollar. From a purely valuation
perspective, the euro remains very undervalued in terms
of purchasing power parity. Also, the Eurozone appears
to be in a better shape, from a political standpoint,
following the approval of the €750 billion recovery
18INVESTMENT PERSPECTIVES 2021
2021: ASSET ALLOCATION
CASH (3%)
Our allocation to cash is underweight
The allocation to cash has been reduced recently from genuine interest for these asset classes and a willingness
being neutral. We have deployed some of the cash in a to add diversification to the portfolios through less
fund investing into real assets and into a US high yield correlated strategies. UK and Chinese equities have also
Long/Short fund. These transactions reflect both a been boosted recently.
DEBT INSTRUMENTS (34%)
Our allocation to fixed-income assets is neutral A positive environment for credit and emerging market
debt
Since the end of summer, our global fixed-income
allocation has been trimmed and is back to being Even if their yields are at historically low levels, high-
neutral. This reflects a lower potential for some of the yield corporate bonds should continue to benefit from
underlying positions in view of historically low yields, demand for bonds with positive yields and from the
tight spreads and duration risk. Our exposure to debt very accommodative policies of the major central banks.
instruments can be characterised as dynamic. It includes Spreads have tightened significantly since the March
high-yield credit in developed and emerging markets, market turmoil, but we believe that there is room for
convertible bonds as well as European secured senior additional tightening, in our base case scenario. Emerging
loans. Our exposure to investment grade bonds remains market corporate debt is another bond market segment
very underweight and includes corporate and sovereign that we favour, and we have boosted our exposure to a
debt as well as unconstrained bond funds which were high-octane emerging market corporate debt fund. We
reduced in October. The overall duration risk of the were very happy to observe the behaviour of two of our
fixed-income allocation is low. credit funds in 2020, with lower drawdowns in March and
quicker recoveries than peers as they had the capacity to
quickly reposition their portfolios.
EQUITIES (53%)
The allocation to equities is moderately overweight
The portfolios have a moderate overweight allocation regions, investment styles and market cap sizes. It was
to equities as we seek to take advantage of the positive gratifying to observe the significant alpha generated by
momentum currently prevailing in the equity markets. many active managers which took advantage of the high
Even more than a year ago, the valuations of equities are degree of dispersion within the markets the past year.
extended but this is justified in part by the anticipation Throughout 2020, we added to our exposure towards
of a strong rebound of earnings in 2021. We have Asian equities and remain confident in the outlook for
maintained a diversified portfolio allocation across the equities of the region.
19INVESTMENT PERSPECTIVES 2021
We like small caps, emerging markets and European
equities
In the current market conditions, we would expect small the economic recovery and from strong fiscal support. The
caps and value stocks to perform well. These types of equities of emerging markets are another asset class that
equities tend to outperform during cyclical rebounds, and it we expect to contribute well to portfolio performance in the
should be no different this time around. European equities year ahead. Foreign flows should accelerate, especially if the
should benefit from this anticipated market cycle in view of dollar were to continue depreciating, and a pick-up of export
their exposure to more cyclical sectors; the same applies to activity should be another driver for EM markets. In 2020, we
small caps, which also tend to be more domestic-orientated increased our exposure towards thematic equity investments,
so both European and US small caps should benefit from and we will pursue this approach going forward.
COMMODITIES (0%)
Our allocation to commodities is neutral
We do not hold any direct investments into commodities.
GOLD (3%)
Our allocation to gold is neutral
We took advantage of the plunge of gold prices in March to rates, massive central bank intervention, dollar weakness and
add a 3% position to the portfolios. We expect gold to continue the need for defensive assets in portfolios at a time when
to be well supported by an environment of negative real interest bonds offer less potential to protect against equity drawdowns.
ALTERNATIVES (7%)
The allocation to hedge funds is neutral track-record since 2018 and protected the fund very well
during the March turmoil.
Our allocation to hedge funds is neutral. During the
past year, we redeemed the Risk Premia strategy in Structured products benefit from periods of higher
reason of its poor performance and dwindling assets; volatility
since the position was sold, it has failed to recover. The
performance of the other hedge funds has been much We remain opportunistic in our allocation to attractive
more satisfying. The Global Macro strategy proved to be structured products. Our focus has been to capture
very resilient and was in positive territory all through the above-average levels of volatility and to target products
year. The trend-following strategy was helpful during the offering income with a limited level of risk. We also look
market selloff thanks to its long position on rates. We for solutions which offer some protection for the equity
have added recently a Long/Short credit fund focused on exposures.
US high yield. The manager has produced a compelling
20INVESTMENT PERSPECTIVES 2021
FFG PORTFOLIO CONSTRUCTION
The construction of an investment portfolio and the Each individual investment has a specific role to play and
selection of its individual components are the result of the selection of any product is based on both its inherent
a well-defined investment process. This process begins features as well as its complementary properties within
with the determination of the client’s risk profile, base the portfolio. It is necessary to fully understand each
currency and the chosen investment strategy. This investment product in order to be able to predict to a
framework will then lead to the tactical positioning of the large extent its behaviour depending on different market
portfolio within strategic asset allocation ranges for each scenarios and to better evaluate its purpose in relation to
asset class. the other assets.
The choice of the base currency is of particular Therefore, the performance of any specific investment
importance as it will affect the way the investment should not be measured against its peer group without
strategy is carried out; firstly, through the determination taking into consideration the remainder of the portfolio.
of the most appropriate level of hedging of currency Typically, the portfolios’ risk budget will be spread
exposures (if any) and, then, by the selection of the best- across directional assets such as equities, commodities
suited underlying investments. and high-yielding debt. The portion of the portfolios
dedicated to the preservation of capital will be invested
The determination of the allocation to the different asset into assets less correlated to market trends, such as
classes is the main driver of the portfolio’s performance funds of hedge funds, highly rated bonds and certain
and serves as the keystone around which the other structured products.
investment decisions are taken. The role of your
investment manager at the Forum Finance Group is to
build portfolios based upon all the relevant information
and through the selection of investment products from a
pre-determined approved investment universe.
21INVESTMENT PERSPECTIVES 2021
HEDGE FUNDS
The Forum Finance Group invests into Funds of Hedge Whereas Funds of Hedge Funds will continue to be
Funds and, for the clients that have approved this asset classified as a separate asset class, most single manager
class in their mandates, into Single Hedge Funds. hedge funds will be classified within the traditional asset
classes, when applicable. Therefore, as an example, the
Funds of Hedge Funds offer diversification and low allocation to equities will not only include the direct
volatility, while Single Hedge Funds focus on specialist equity positions and the investments into equity funds
strategies with an emphasis on risk management. We but may also include strategies such as Long/Short
consider Single Hedge Funds to be genuine alternatives equities or Event Driven equities..
to the traditional asset classes, providing access to
outstanding fund managers and improving the risk-
return profile of portfolios.
STRUCTURED PRODUCTS
From our point of view, structured products provide an Structured products are classified within the most
alternative way of investing into traditional asset classes relevant asset classes at any defined moment. This
such as equities, debt instruments and commodities. The allows us to better analyse the overall levels of risk
different structures of these products vary considerably of each asset class than if structured products were
and the selection of a specific structure is not only a classified separately. Structured products are, by
function of the prevailing market conditions and the nature, hybrid instruments and the evolution of their
outlook for the underlying asset, but also a function of different components will determine whether it becomes
the capacity of the product to mitigate risk within the necessary to reclassify any structured product into a
portfolio. different asset class.
22INVESTMENT PERSPECTIVES 2021
ASSET ALLOCATION GRID 2021
For our balanced accounts, we apply the following grid:
ALLOCATION JANUARY 2021
SHORT-TERM DEPOSITS 0 – 20% 3%
DEBT INSTRUMENTS* 15 – 55% 34%
Investment grade bonds 5 – 45% 8%
EM & high-yield bonds 0 – 20% 13%
Specialist bonds 0 – 15% 13%
EQUITIES* 20 – 60% 53%
Developed markets 15 – 50% 43%
Emerging markets 5 – 30% 10%
COMMODITIES 0 – 15% 3%
Physical gold 0 – 5% 3%
Other commodities 0 – 10% 0%
ALTERNATIVE INVESTMENTS 0 – 25% 7%
Hedge funds 0 – 15% 7%
Other 0 – 10% 0%
100%
* Includes Long-biased hedge funds and structured products
DISCLAIMER
The Forum Finance Group S.A. (FFG) is authorised by FINMA as asset manager and registered with the SEC as investment
adviser. Although every care has been taken by The Forum Finance Group S.A. (FFG) to ensure the accuracy of the
information published, no warranty can be given in respect of the accuracy, reliability, up-to-datedness or completeness
of this information. FFG disclaims, without limitation, all liability for any loss or damage of any kind, including any direct,
indirect or consequential damages, which might be incurred through the use of this document. The entire content of
this document is subject to copyright with all rights reserved. You may not reproduce (in whole or in part), transmit (by
electronic means or otherwise), modify, or use for any public or commercial purpose this document without the prior
written permission of FFG. Please go to www.ffgg.com for our full disclaimer.
23The Forum Finance Group SA
6 rue de la Croix d’Or — CP 3649 — CH-1211 Genève 3 — T +41 22 311 84 00 — F +41 22 311 84 65
FFGG.COM
PRPRINT.comYou can also read