Evaluating Multimodal Representations on Visual Semantic Textual Similarity - Ecai 2020
←
→
Page content transcription
If your browser does not render page correctly, please read the page content below
24th European Conference on Artificial Intelligence - ECAI 2020
Santiago de Compostela, Spain
Evaluating Multimodal Representations
on Visual Semantic Textual Similarity
Oier Lopez de Lacalle1 and Ander Salaberria1 and Aitor Soroa1 and Gorka Azkune1 and Eneko Agirre1
Abstract.
The combination of visual and textual representations has pro-
duced excellent results in tasks such as image captioning and visual
question answering, but the inference capabilities of multimodal rep-
resentations are largely untested. In the case of textual representa-
tions, inference tasks such as Textual Entailment and Semantic Tex-
tual Similarity have been often used to benchmark the quality of tex-
tual representations. The long term goal of our research is to devise
multimodal representation techniques that improve current inference
capabilities. We thus present a novel task, Visual Semantic Textual
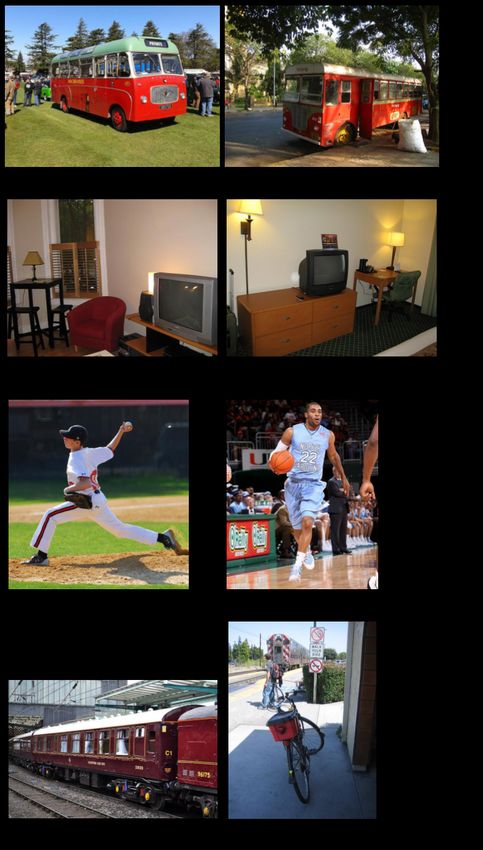
Similarity (vSTS), where such inference ability can be tested directly. Figure 1. A sample with two items, showing the influence of images when
Given two items comprised each by an image and its accompanying judging the similarity between two captions. While the similarity for the cap-
caption, vSTS systems need to assess the degree to which the cap- tions alone was annotated as low (1.8), when having access to the images, the
tions in context are semantically equivalent to each other. Our exper- annotators assigned a much higher similarity (4). The similarity score ranges
iments using simple multimodal representations show that the addi- between 0 and 5.
tion of image representations produces better inference, compared to
text-only representations. The improvement is observed both when
semantically equivalent sentences and bottom scores for completely
directly computing the similarity between the representations of the
unrelated sentences. STS provides a unified framework for extrin-
two items, and when learning a siamese network based on vSTS
sic evaluation of multiple semantic aspects such as compositionality
training data. Our work shows, for the first time, the successful con-
and phrase similarity. Contrary to related tasks, such as textual en-
tribution of visual information to textual inference, with ample room
tailment and paraphrase detection, STS incorporates the notion of
for benchmarking more complex multimodal representation options.
graded semantic similarity between the pair of textual sentences and
is symmetric.
1 Introduction In this paper we extend STS to the visual modality, and present
Visual Semantic Textual Similarity (vSTS), a task and dataset which
Language understanding is a task proving difficult to automatize, be-
allows to study whether better sentence representations can be built
cause, among other factors, much of the information that is needed
when having access to the corresponding images, in contrast with
for the correct interpretation of an utterance is not explicit in text [5].
having access to the text alone. Similar to STS, annotators were asked
This contrasts with how natural is language understanding for hu-
to score the similarity between two items, but in this case each item
mans, who can cope easily with information absent in text, using
comprises an image and a textual caption. Systems need to predict
common sense and background knowledge like, for instance, typi-
the human score. Figure 1 shows an instance in the dataset, with
cal spatial relations between objects. From another perspective, it is
similarity scores in the captions. The example illustrates the need to
well-known that the visual modality provides complementary infor-
re-score the similarity values, as the text-only similarity is not appli-
mation to that in the text. In fact, recent advances in deep learning
cable to the multimodal version of the dataset: the annotators return
research have led the field of computer vision and natural language
a low similarity when using only text, while, when having access
processing to significant progress in tasks that involve visual and tex-
to the corresponding image, they return a high similarity. Although
tual understanding. Tasks that include visual and textual content in-
a dataset for multimodal inference exists (visual textual entailment
clude Image Captioning [11], Visual Question Answering [1], and
[39]) that dataset reused the text-only inference labels.
Visual Machine Translation [13], among others.
The vSTS dataset aims to become a standard benchmark to test
On the other hand, progress in language understanding has been
the contribution of visual information when evaluating the similarity
driven by datasets which measure the quality of sentence representa-
of sentences and the quality of multimodal representations, allow-
tions, specially those where inference tasks are performed on top of
ing to test the complementarity of visual and textual information for
sentence representations, including textual entailment [8, 4] and se-
improved language understanding. Although multimodal tasks such
mantic textual similarity (STS). In STS [6], for instance, pairs of sen-
as image captioning, visual question answering and visual machine
tences have been annotated with similarity scores, with top scores for
translation already show that the combination of both modalities can
1 University of the Basque Country, Spain, emails: {oier.lopezdelacalle, an- be effectively used, those tasks do not separately benchmark the in-
der.salaberria, a.soroa, gorka.azcune, e.agirre}@ehu.eus ference capabilities of multimodal visual and textual representations.
24th European Conference on Artificial Intelligence - ECAI 2020
                                                         Santiago de Compostela, Spain

   We evaluate a variety of well-known textual, visual and mul-             tasks such as Image Captioning [3, 16], Text-Image Retrieval [2, 28]
timodal representations in supervised and unsupervised scenarios,           and Visual Question Answering [1].
and systematically explore if visual content is useful for sentence            Image Captioning is a task that aims to generate a description
similarity. For text, we studied pre-trained word embeddings such           of a given image. The task is related to ours in that it is required an
as GloVe [27], pre-trained language models like GPT-2 and BERT              understanding of the scene depicted in the image, so the system can
[12, 30], sentence representations fine-tuned on an entailment task         generate an accurate description of it. Unlike vSTS, image captioning
like USE [7], and textual representations pre-trained on a multi-           is a generation task in which evaluation is challenging and unclear, as
modal caption retrieval task like VSE++ [14]. For image represen-           the defined automatic metrics are somewhat problematic [36]. On the
tation we use a model pre-trained on Imagenet (ResNet [17]). In or-         other hand, Text-Image Retrieval task requires to find similarities
der to combine visual and textual representations we used concate-          and differences of the items in two modalities, so we can distinguish
nation and learn simple projections. Our experiments show that the          relevant and irrelevant texts and images regarding the query. Apart
text-only models are outperformed by their multimodal counterparts          from not checking inference explicitly, the other main difference with
when adding visual representations, with up to 24% error reduction.         regards to vSTS is that, in retrieval, items are ranked from most to
   Our contributions are the following: (1) We present a dataset            least similar, whereas the vSTS task consists on scoring an accurate
which allows to evaluate visual/textual representations on an infer-        real valued similarity. A comprehensive overview is out of the scope,
ence task. The dataset is publicly available under a free license2 . (2)    and thus we focus on the most related vision and language tasks. We
Our results show, for the first time, that the addition of image rep-       refer the reader to [26] for a survey on vision and language research.
resentations allows better inference. (3) The best text-only represen-         Many of these tasks can be considered as extensions of previously
tation is the one fine-tuned on a multimodal task, VSE++, which is          existing NLP taks. For instance, Image Captioning can be seen as
noteworthy, as it is better than a textual representation fine-tuned in a   an extension of conditional language modeling [10] or natural lan-
text-only inference task like USE. (4) The improvement when using           guage generation [32], whereas Visual Question Answering is a nat-
image representations is observed both when computing the similar-          ural counterpart of the traditional Question Answering in NLP.
ity directly from multimodal representations, and also when training           Regarding multimodal and unimodal representation learning,
siamese networks. At the same time the improvement holds for all            convolutional neural networks (CNN) have become the standard ar-
textual representations, even those fine-tuned on a similarity task.        chitecture for generating representations for images [23]. Most of
                                                                            these models learn transferable general image features in tasks such
                                                                            as image classification, and detection, semantic segmentation, and
2     Related Work                                                          action recognition. Most used transferable global image representa-
The task of Visual Semantic Textual Similarity stems from previous          tions are learned with deep CNN architectures such as AlexNet [22],
work on textual inference tasks. In textual entailment, given a textual     VGG [33], Inception-v3 [34], and ResNet [17] using large datasets
premise and a textual hypothesis, systems need to decide whether the        such as ImageNet [11], MSCOCO [24] and Visual Genome [21]. Re-
first entails the second, they are in contradiction, or none of the pre-    cently, Graph Convolution Networks (GCN) showed to be promising
vious [8]. Popular datasets include the Stanford Natural Language           way to distill multiple input types multimodal representations [41].
Inference dataset [4]. As an alternative to entailment, STS datasets           Language representation is mostly done with pretrained word
comprise pairs of sentences which have been annotated with similar-         embeddings like Glove [27] and sequence learning techniques such
ity scores. STS systems are usually evaluated on the STS benchmark          as Recurrent Neural Networks (RNN) [18]. Recently, self-attention
dataset [6]3 . In this paper we present an extension of STS, so we          approaches like Transformers [37] provided transferable models
present the task in more detail in the next section.                        (BERT, GPT-2, among others [12, 30]) that significantly improve
   Textual entailment has been recently extended with visual infor-         many state-of-the-art tasks in NLP. Alternatively, sentence repre-
mation. A dataset for visual textual entailment was presented in            sentations have been fine-tuned on an entailment task [7]. We will
[39]. Even if the task is different from the text-only counterpart,         present those used in our work in more detail below.
they reused the text-only inference ground-truth labels without re-
annotating them. In fact, they annotate a small sample to show that
the labels change. In addition, their dataset tested pairs of text snip-
                                                                            3    The Visual STS Dataset
pets referring to a single image, and it was only useful for testing        STS assesses the degree to which two sentences are semantically
grounding techniques, but not to measure the complementarity of vi-         equivalent to each other. The annotators measure the similarity
sual and textual representations. The reported results did not show         among sentences, with higher scores for more similar sentences. The
that grounding improves results, while our study shows that the in-         annotations of similarity were guided by the scale in Table 1, rang-
ference capabilities of multimodal visual and textual representations       ing from 0 for no meaning overlap to 5 for meaning equivalence.
improve over text-only representations. In related work, [40] propose       Intermediate values reflect interpretable levels of partial overlap in
visual entailment, where the premise is an image and the hypothesis         meaning.
is textual. The chosen setting does not allow to test the contribution
of multimodal representationn with respect to unimodal ones.                    Similarity definitions:
   The complementarity of visual and text representations for im-
                                                                                5: Completely equivalent: They mean the same thing.
proved language understanding was first proven on word representa-              4: Mostly equivalent: Some unimportant details differ.
tions, where word embeddings were combined with visual or percep-               3: Roughly equivalent: Some important information differs/missing.
tual input to produce multimodal representations [15]. The task of Vi-          2: Not equivalent but share some details.
sual Semantic Textual Similarity is also related to other multimodal            1: Not equivalent but on the same topic.
                                                                                0: Completely dissimilar.
2   https://oierldl.github.io/vsts/
3   See for instance recent models evaluated on STS benchmark http://       Table 1. Similarity scores with the definition of each ordinal value. Defini-
    ixa2.si.ehu.es/stswiki/index.php/STSbenchmark                           tions are the same as used in STS datasets [6]
24th European Conference on Artificial Intelligence - ECAI 2020
                                                        Santiago de Compostela, Spain

   In this work, we extend the STS task with images, providing vi-         a higher similarity rate. We used the cosine distance of the top-layer
sual information that models use, and assess how much visual con-          of a pretrained ResNet-50 [17] to compute the similarity of images.
tent can contribute in a language understanding task. The input of         We collected an equal number of pairs for the random and visual
the task now consists of two items, each comprising an image and           similarity strategy, gathering, in total, 155, 068 pairs. As each image
its corresponding caption. In the same way as in STS, systems need         has 5 captions, we had to select one caption for each image, and we
to score the similarity of the sentences with the help of the images.      decided to select the two captions with highest word overlap. This
Figure 1 shows an example of an instance in the dataset.                   way, we get more balanced samples in terms of caption similarity4 .
   In previous work reported in a non-archival workshop paper [9],            The initial sampling created thousands of pairs that were skewed
we presented a preliminary dataset which used the text-only ground-        towards very low similarity values. Given that manual annotation is
truth similarity scores. The 819 pairs were extracted from a subset        a costly process, and with the goal of having a balanced dataset,
of the STS benchmark, more specifically, the so called STS-images          we used an automatic similarity system to score all the pairs. This
subset, which contains pairs of captions with access to images from        text-only similarity system is an ensemble of feature-based machine
PASCAL VOC-2008 [31] and Flickr-8K [19]. Our manual analy-                 learning systems that uses a large variety of distance and machine-
sis, including examples like Figure 1, showed that in many cases the       translation based features. The model was evaluated on a subset of
text-only ground truth was not valid, so we decided to re-annotated        STS benchmark dataset [6] and compared favorably to other base-
the dataset but showing the images in addition to the captions (the        line models. As this model is very different from current deep learn-
methodology is identical to the AMT annotation method mentioned            ing techniques, it should not bias the dataset sampling in a way which
below). The correlation of the new annotations with regard to the          influences current similarity systems.
old ones was high (0.9ρ) showing that the change in scores was not
drastic, but that annotations did differ. The annotators tended to re-
turn higher similarity scores, as the mean similarity score across the
dataset increased from 1.7 to 2.1. The inter-tagger correlation was
comparable to the text-only task, showing that the new annotation
task was well-defined.
   From another perspective, the fact that we could only extract 819
pairs from existing STS datasets showed the need to sample new
pairs from other image-caption datasets. In order to be effective in
measuring the quality of multimodal representations, we defined the
following desiderata for the new dataset: (1) Following STS datasets,
the similarity values need to be balanced, showing a uniform distribu-
tion; (2) Paired images have to be different to avoid making the task
trivial, as hand analysis of image-caption datasets showed that two        Figure 2. Histograms of the similarity distribution in the 2639 sample, ac-
captions of the same image tended to be paraphrases of each other;         cording to the automatic text-only system (left and middle plots), and the dis-
(3) The images should not be present in more than one instance, to         tribution of the similarity of each sampling strategy (rnd stands for random
avoid biases in the visual side; (4) It has to contain a wide variety of   image sampling and sim stands for image similarity driven sampling).
images so we can draw stronger conclusions. The preliminary dataset
fulfilled 2 and 3, but the dataset was skewed towards low similarity          The automatic scores were used to sample the final set of pairs
values and the variety was limited.                                        as follows. We defined five similarity ranges ((0, 1], . . . , (4, 5]) and
                                                                           randomly selected the same amount of pairs from the initial paired
3.1    Data Collection                                                     sample. We set a sampling of maximum 3000 instances (i.e 600 in-
                                                                           stances per range). Given the fact that the high similarity range had
The data collection of sentence-image pairs comprised several steps,       less than 600 instances, we collected a total of 2639 potential text-
including the selection of pairs to be annotated, the annotation           image candidate pairs for manual annotation. Figure 2 shows the
methodology, and a final filtering stage.                                  proposed methodology can sample approximately a uniform distri-
                                                                           bution with the exception of the higher similarity values (left and
  1. Sampling data for manual annotation. We make use of                   middle plots). In addition, we show that the lower predicted similari-
two well-known image-caption datasets. On one hand, Flickr30K              ties are mainly coming from random sampling, whereas, as expected,
dataset [29] that has about 30K images with 5 manually generated           the higher ones come from similar images.
captions per image. On the other hand, we use the Microsoft COCO
dataset [24], which contains more than 120K images and 5 captions
                                                                            2. Manual annotations. In order to annotate the sample of 2639
per image. Using both sources we hope to cover a wide variety of
                                                                           pairs, we used Amazon Mechanical Turk (AMT). Crowdworkers
images.
                                                                           followed the same instructions of previous STS annotation cam-
   In order to select pairs of instances, we did two sampling rounds.
                                                                           paigns [6], very similar to those in Table 1. Annotators needed to
The goal of the first run is to gather a large number of varied image
                                                                           focus on textual similarity with the aid of aligned images. We got
pairs with their captions which contain interesting pairs. We started
                                                                           up to 5 scores per item, and we discarded annotators that showed
by sampling images. We then combined two ways of sampling pairs
                                                                           low correlation with the rest of the annotators (ρ < 0.75). In to-
of images. In the first, we generated pairs by sampling the images
                                                                           tal 56 annotators took part. On average each crowdworker annotated
randomly. This way, we ensure higher variety of paired scenes, but
                                                                           220 pairs, where the amounts ranged from 19 to 940 annotations.
presumably two captions paired at random will tend to have very
low similarity. In the second, we paired images taking into account        4   We tried random sampling over captions too, but we ended up with a more
their visual similarity, ensuring the selection of related scenes with         unbalanced selection.
24th European Conference on Artificial Intelligence - ECAI 2020
Santiago de Compostela, Spain
Regardless the annotation amounts, most of the annotators showed
high correlations with the rest of the participants. We computed the
annotation correlation by aggregating the individual Pearson correla-
tion with averaged similarity of the other annotators. The annotation
shows high correlation among the crowdworkers (ρ = 0.89 ±0.01)
comparable to that of text-only STS datasets.
#Pairs Mean Median STD #Zeros
Item similarity 2639 1.96 1.80 1.65 549
Item disagreement 2639 0.60 0.55 0.45 724
Table 2. Overall item similarity and disagreement of the AMT annotations.
Table 2 shows the average item similarity and item disagreement Figure 3. Similarity distribution of the visual STS dataset. Plots show three
in the annotation. We defined item disagreement as the standard de- views of the data. Histogram of the similarity distribution of ground-truth val-
viation of the annotated similarity value. The low average similarity ues (left plot), sorted pairs according to their similarity (middle) and boxplot
can be explained by the high number of zero-similarity pairs. Item of the similarity values (right).
disagreement is moderately low (about 0.6 points out of 5) which is
in accordance with the high correlation between the annotators. ResNet [17] is a deep network of 152 layers in which the resid-
ual representation functions are learned instead of learning the signal
3. Selection of difficult examples. In preliminary experiments, representation directly. The model is trained over 1.2 million images
the evaluation of two baseline models, word overlap and the ensem- of ImageNet, the ILSRVC subset of 1000 image categories. We use
ble system mentioned before, showed that the sampling strategy in- the top layer of a pretrained ResNet-152 model to represent the im-
troduced a large number of trivial examples. For example, the word ages associated to text. Each image is represented with a vector of
overlap system attained 0.83 ρ. This high correlation could be the 2048 dimensions.
result of using word-overlap in the first sampling round. In order to GloVe. The Global Vector model [27] is a log-linear model trained
create a more challenging dataset where to measure the effectiveness to encode semantic relationships between words as vector offsets in
of multimodal representations, we defined the easiness metric to fil- the learned vector space, combining global matrix factorization and
ter out some of the easy examples from the annotated dataset. local context window methods. Since GloVe is a word-level vector
We defined easiness as an amount of discrepancy provided by an model, we build sentence representations with the mean of the vec-
example regarding the whole dataset. Taking the inner product of the tors of the words composing the sentence. The pre-trained model
Pearson correlation formula as basis, we measure the easiness of an from GloVe considered in this paper is the 6B-300d, with a vocabu-
annotated example i as follows: lary of 400k words, 300 dimension vectors and trained on a dataset
of 6 billion tokens.
oi − o gsi − gs BERT. The Bidirectional Encoder Representations from Trans-
ei = (1)
so sgs former [12] implements a novel methodology based on the so-called
where oi is the word-overlap similarity of the i-th pair, o is the masked language model, which randomly masks some of the tokens
mean overlap similarity in the dataset, and so is the standard devia- from the input, and predicts the original vocabulary id of the masked
tion. Similarly, variable gsi is the gold-standard value of the i-th pair, word based only on its context. The BERT model used in our experi-
and gs and sgs are the mean and standard deviation of gold values in ments is the BERT-Large Uncased (24-layer, 1024-hidden, 16-heads,
the dataset, respectively. We removed 30% of the easiest examples 340M parameters). In order to obtain the sentence-level representa-
and create a more challenging dataset of 1858 pairs, reducing ρ to tion we extract the token embeddings of the last layer and compute
0.57 for the word-overlap model, and to 0.66 ρ (from 0.85) for the the mean vector, yielding a vector of 1024 dimensions.
ML based approach. GPT-2. The Generative Pre-Training-2 model[30] is a language
model based on the transformer architecture, which is trained on the
task of predicting the next word, given all the previous words occur-
3.2 Dataset Description ring in some text. In the same manner to BERT and GloVe, we extract
The full dataset comprises both the sample mentioned above and the the token embeddings of the last layer and compute the mean vector
819 pairs from our preliminary work, totalling 2677 pairs. Figure 3 to obtain the sentence-level representation of 768 dimensions. The
shows the final item similarity distribution. Although the distribution GPT-2 model used in our experiments was trained on a very large
is skewed towards lower similarity values, we consider that all the corpus of about 40 GB of text data with 1.5 billion parameters.
similarity ranges are sufficiently well covered. USE. The Universal Sentence Encoder [7] is a model for encoding
Average similarity of the dataset is 1.9 with a standard deviation sentences into embedding vectors, specifically designed for transfer
of 1.36 points. The dataset contains 335 zero-valued pairs out of the learning in NLP. Based on a deep averaging network encoder, the
2677 instances, which somehow explains the lower average similar- model is trained for varying text lengths, such as sentences, phrases
ity. or short textbfs, and in a variety of semantic tasks including STS.
The encoder returns the vector of the sentence with 512 dimensions.
VSE++. The Visual-Semantic Embedding [14] is a model trained
4 Evaluation of Representation Models
for image-caption retrieval. The model learns a joint space of aligned
The goal of the evaluation is to explore whether representation mod- images and captions. The model is an improvement of the original
els can have access to images, instead of text alone, have better in- introduced by [20], and combines a ResNet-152 over images with a
ference abilities. We consider the following models. bidirectional Recurrent Neural Network (GRU) over the sentences.24th European Conference on Artificial Intelligence - ECAI 2020
Santiago de Compostela, Spain
Texts and images are projected onto the joint space, obtaining repre- Multimodal representation. We combined textual and image rep-
sentations of 1024 dimension both for images and texts. We used pro- resentations in two simple ways. The first method is concatenation of
jections of images and texts in our experiments. The VSE++ model the text and image representation (CONCAT). Before concatenation
used in our experiments was pre-trained on the Microsoft COCO we applied the L2 normalization to each of the modalities. The sec-
dataset [24] and the Flickr30K dataset [29]. Table 3 summarizes the ond method it to learn a common space for the two modalities before
sentence and image representations used in the evaluation. concatenation (PROJECT).
Model Modality dimensions
h1 = σ(W (1) m1 , +b(1) ), (6)
RESNET Image 2048
VSE ++( IMG ) Image 1024 h2 = σ(W (2) m2 , +b(2) ), (7)
GLOVE Text 300 hm = [h1 , h2 ] (8)
BERT Text 1024
GPT-2 Text 768
USE Text 512
The projection of each modality learns a space of d-dimensions,
VSE ++( TEXT ) Text 1024 so that h1 , h2 ∈ Rd . Once the multimodal representation is produced
(hm ) for the left and right pairs, vectors are directly plugged into the
CONCAT multimodal -
PROJECT multimodal - regression layers. Projections are learned end-to-end with the regres-
sion layers and the MSE as loss function.
Table 3. Summary of the text and image representation models used.
Hyperparameters and training details. We use the validation set
to learn parameters of the supervised models, and to carry an explo-
4.1 Experiments ration of the hyperparameters. We train each model a maximum of
300 epochs and apply early-stopping strategy with a patience of 25
Experimental Setting. We split the vSTS dataset into training, epochs. For early stopping we monitor MSE loss value on validation.
validation and test partitions sampling at random and preserving the For the rest, we run a grid search for selecting the rest of the hyper-
overall score distributions. In total, we use 1338 pairs for training, parameter values. We explore learning rate values (0.0001, 0.001,
669 for validation, and the rest of the 670 pairs were used for the 0.01, 0.05), L2 regularization weights (0.0, 0.0001, 0.001, 0.01), and
final testing. Similar to the STS task, we use the Pearson correlation different hidden layer (hs ) dimensions (50,100, 200, 300). In addi-
coefficient (ρ) as the evaluation metric of the task. tion, we activate and deactivate batch normalization in each layer for
each of the hyperparameter selection.
STS models. Our goal is to keep similarity models as simple as
possible in order to directly evaluate textual and visual representa- 4.2 Results
tions and avoid as much as possible the influence of the parameters
that intertwine when learning a particular task. We defined two sce- The unsupervised scenario. Table 4 reports the results using the
narios: the supervised and the unsupervised scenarios. item representations directly. We report results over train and dev
In the supervised scenario we train a Siamese Regression model partitions for completeness, but note that none of them was used to
in a similar way presented in [35]. Given a sentence/image pair, we tune the models. As it can be seen, multimodal representations con-
wish to predict a real-valued similarity in some range [1, K], being sistently outperform their text-only counterparts. This confirms that,
K = 5 in our experiments. We first produce sentence/image repre- overall, visual information is helpful in the semantic textual similar-
sentations hL and hR for each sentence in the pair using any of the ity task and that image and sentence representation are complemen-
unimodal models described above, or using a multimodal represen- tary. For example, the BERT model improves more than 13 points
tations as explained below. Given these representations, we predict when visual information provided by the RESNET is concatenated.
the similarity score o using a regression model that takes both the GLOVE shows a similar or even larger improvement, with similar
distance and angle between the pair (hL , hR ): trends for USE and VSE ++( TEXT )5 .
Although VSE ++( IMG ) shows better performance than RESNET
when applying them alone, further experimentation showed lower
hx = hL hR , (2) complementarity when combining with textual representation (e.g.
h+ = |hL − hR |, (3) 0.807ρ in test combining textual and visual modalities of VSE ++).
(h) (h) This is something expected as VSE ++( IMG ) is pre-trained along with
hs = σ(W [hx , h+ ] + b ), (4)
the textual part of the VSE ++ model on the same task. We do not
(o) (o)
o = W hs + b (5) show the combinations with VSE ++( IMG ) due to the lack of space.
Interestingly, results show that images alone are valid to predict
Note that the distance and angle concatenation ([hx , h+ ]) yields caption similarity (0.627ρ in test). Actually, in this experimental set-
a 2 ∗ d-dimensional vector. The resulting vector is used as input for ting RESNET is on par with BERT, which is the best purely unsuper-
the non-linear hidden layer (hs ) of the model. Contrary to [35], we vised text-only model. Surprisingly, GPT-2 representations are not
empirically found that the estimation of a continuous value worked useful for text similarity tasks. This might be because language mod-
better than learning a softmax distribution over [1, K] integer values. els tend to forget past context as they focus on predicting the next
The loss function of our model is the Mean Square Error (MSE), token [38]. Due to the low results of GPT-2 we decided not to com-
which is the most commonly used regression loss function. bine it with RESNET.
In the unsupervised scenario similarity is computed as the cosine
5 VSE ++
of the produced hL and hR sentence/image representations. + RESNET in the table.24th European Conference on Artificial Intelligence - ECAI 2020
Santiago de Compostela, Spain
Model Modality train ρ dev ρ test ρ Model Modality train ρ dev ρ test ρ
GLOVE text 0.576 0.580 0.587 GLOVE text 0.819 0.744 0.702
BERT text 0.641 0.593 0.612 BERT text 0.888 0.775 0.781
GPT-2 text 0.198 0.241 0.210 GPT-2 text 0.265 0.285 0.246
USE text 0.732 0.747 0.720 USE text 0.861 0.824 0.810
VSE ++( TEXT ) text 0.822 0.812 0.803 VSE ++( TEXT ) text 0.883 0.831 0.825
RESNET image 0.638 0.635 0.627 RESNET image 0.788 0.721 0.706
VSE ++( IMG ) image 0.677 0.666 0.662 VSE ++( IMG ) image 0.775 0.703 0.701
GLOVE + RESNET mmodal 0.736 0.732 0.730 CONCAT: GLOVE + RESNET mmodal 0.899 0.830 0.794
BERT + RESNET mmodal 0.768 0.747 0.745 CONCAT: BERT + RESNET mmodal 0.889 0.805 0.797
USE + RESNET mmodal 0.799 0.806 0.787 CONCAT: USE + RESNET mmodal 0.892 0.859 0.841
VSE ++ + RESNET mmodal 0.846 0.837 0.826 CONCAT: VSE ++ + RESNET mmodal 0.915 0.864 0.852
PROJECT: GLOVE + RESNET mmodal 0.997 0.821 0.826
Table 4. The unsupervised scenario: train, validation and test results of the
PROJECT: BERT + RESNET mmodal 0.996 0.825 0.827
unsupervised models. PROJECT: USE + RESNET mmodal 0.998 0.850 0.837
PROJECT: VSE ++ + RESNET mmodal 0.998 0.853 0.847
The supervised scenario. Table 5 show a similar pattern to that in
the the unsupervised setting. Overall, models that use a conjunction Table 5. Supervised scenario: Train, validation and test results of the unsu-
of multimodal features significantly outperform unimodal models, pervised models
and this confirms, in a more competitive scenario, that adding visual
information helps learning easier the STS task. The gain of multi- more information in the representation, the better. In the case of USE
modal models is considerable compared to the text-only models. The and VSE ++ the improvement is significant but not as large as the
most significant gain is obtained when GLOVE features are combined purely unsupervised models. The best text-only representation is the
with RESNET. The model improves more than 15.0 points. In this one fine-tuned on a multimodal task, VSE++, which is noteworthy,
case, the improvement over BERT is lower, but still considerable with as it is better than a textual representation fine-tuned in a text-only
more than 4.0 points. inference task like USE.
In the same vein as in the unsupervised scenario, features obtained Improvement is consistent for the supervised models. Contrary to
with a RESNET can be as competitive as some text based models (e.g. the unsupervised setting, these models are designed to learn about
BERT). GPT-2, as in the unsupervised scenario, does not produce the task, so there is usually less room for the improvement. Still,
useful representations for semantic similarity tasks. Surprisingly, the GLOVE + RESNET shows an error reduction of 12.9 in the test set.
regression model with GPT-2 features is not able to learn anything in Finally, USE and VSE ++ show smaller improvements when we add
the training set. As we did in the previous scenario, we do not keep visual information into the model.
combining GPT-2 with visual features.
Multimodal version of VSE ++ and USE6 are the best model among
Scenario Repr text mmodal Diff E.R
the supervised approaches. Textual version of USE and VSE ++ alone
obtain very competitive results and outperforms some of the mul- Unsup GLOVE 0.587 0.730 0.143 24.4
Unsup BERT 0.612 0.745 0.133 21.7
timodal models (the concatenate version of GLOVE and BERT with Unsup USE 0.720 0.787 0.067 9.3
RESNET ). Results might indicate that text-only with sufficient train- Unsup VSE ++ 0.803 0.826 0.023 2.9
ing data can be on par with multimodal models, but, still, when there
Sup GLOVE 0.702 0.793 0.091 12.9
is data scarcity, multimodal models can perform better as they have Sup BERT 0.781 0.827 0.046 5.8
more information over the same data point. Sup USE 0.810 0.841 0.031 3.8
Comparison between projected and concatenated models show Sup VSE ++ 0.825 0.852 0.027 3.3
that projected models attain slightly better results in two cases,
Table 6. Contribution of images over text representations on test.
but the best overall results are obtained when concatenating
VSE ++( TEXT ) with RESNET . Although concatenation proofs to be a
hard baseline, we expect that more sophisticated combination meth- Figure 4 displays some examples where visual information posi-
ods like grounding [25] will obtain larger gains in the future. tively contributes predicting accurately similarity values. Examples
show the case where related descriptions are lexicalized in a different
5 Discussion way so a text-only model (GLOVE) predicts low similarity between
captions (top two examples). Instead, the multimodal representation
5.1 Contribution of the Visual Content GLOVE + RESNET does have access to the image and can predict more
Table 6 summarizes the contribution of the images on text repre- accurately the similarity value of the two captions. The examples in
sentations in test partition. The contribution is consistent through the bottom show the opposite case, where similar set of words are
all text-based representations. We measure the absolute difference used to describe very different situations. The text based model over-
(Diff) and the error reduction (E.R) of each textual representation estimates the similarity of captions, while the multimodal model cor-
with the multimodal counterpart. For the comparison we chose the rects the output by looking at the differences of the images.
best text model for each representation. As expected we obtain the On the contrary, Figure 5 shows that images can also be mislead-
largest improvement (22 − 26% E.R) when text-based unsupervised ing, and that the task is not as trivial as combining global representa-
models are combined with image representations. Note that unsuper- tions of the image. In this case, related but different captions are sup-
vised models are not learning anything about the specific task, so the ported by very similar images, and as a consequence, the multimodal
model overestimates their similarity, while the text-only model fo-
6 VSE ++ + RESNET and USE + RESNET models. cuses on the most discriminating piece of information in the text.24th European Conference on Artificial Intelligence - ECAI 2020
Santiago de Compostela, Spain
Figure 5. Example of misleading images. The high similarity of images
makes the prediction of the multimodal model inaccurate, while the text only
model focuses on the most discriminating piece of information. Note that gs
refers to the gold standard similarity value, and text and mm refer to text-only
and multimodal models, respectively.
Figure 6. Variability of the supervised models regarding hyperparameter
selection on development. The multimodal models use concatenation. Best
viewed in colour.
We have presented a novel task, Visual Semantic Textual Similarity
(vSTS), where the inference capabilities of visual, textual, and mul-
timodal representations can be tested directly. The dataset has been
manually annotated by crowdsourcers with high inter-annotator cor-
relation (ρ = 0.89). We tested several well-known textual and visual
representations, which we combined using concatenation and projec-
tion. Our results show, for the first time, that the addition of image
representations allows better inference. The best text-only represen-
tation is the one fine-tuned on a multimodal task, VSE++, which is
noteworthy, as it is better than a textual representation fine- tuned in
Figure 4. Examples of the contribution of the visual information in the task. a text-only inference task like USE. The improvement when using
gs for gold standard similarity value, text and mm for text-only and multi- image representations is observed both when computing the similar-
modal models, respectively. On top examples where related descriptions are ity directly from multimodal representations, and also when training
lexicalized differently and images help. On the bottom cases where similar siamese networks.
words are used to describe different situations. In the future, we would like to ground the text representations to
image regions [25], which could avoid misleading predictions due to
5.2 The effect of hyperparameters the global representation of the image. Finally, we would like to ex-
Neural models are sensitive to hyperparameters, and we might think tend the dataset with more examples, as we acknowledge that training
that results on the supervised scenario are due to hyperparameter set is limited to train larger models.
optimization. Figure 6 displays the variability of ρ in development
across all hyperparameters. Due to space constraints we show text-
only and multimodal concatenated models. Models are ordered by
mean performance. As we can see, combined models show better
ACKNOWLEDGEMENTS
mean performance, and all models except Glove exhibit tight vari-
ability. This research was partially funded by the Basque Government ex-
cellence research group (IT1343-19), the NVIDIA GPU grant pro-
6 Conclusions and Future Work gram, the Spanish MINECO (DeepReading RTI2018-096846-B-C21
(MCIU/AEI/FEDER, UE)) and project BigKnowledge (Ayudas Fun-
The long term goal of our research is to devise multimodal rep- dación BBVA a equipos de investigación cientı́fica 2018). Ander en-
resentation techniques that improve current inference capabilities. joys a PhD grant from the Basque Government.24th European Conference on Artificial Intelligence - ECAI 2020
Santiago de Compostela, Spain
REFERENCES [22] Alex Krizhevsky, Ilya Sutskever, and Geoffrey E. Hinton, ‘Imagenet
classification with deep convolutional neural networks’, in Proceedings
of the 25th International Conference on Neural Information Processing
[1] Stanislaw Antol, Aishwarya Agrawal, Jiasen Lu, Margaret Mitchell, Systems - Volume 1, NIPS’12, pp. 1097–1105, USA, (2012).
Dhruv Batra, C Lawrence Zitnick, and Devi Parikh, ‘VQA: Visual ques- [23] Yann LeCun, Yoshua Bengio, et al., ‘Convolutional networks for im-
tion answering’, in Proceedings of the IEEE international conference ages, speech, and time series’, The handbook of brain theory and neural
on computer vision, pp. 2425–2433, (2015). networks, 3361(10), 1995, (1995).
[2] Kobus Barnard and David Forsyth, ‘Learning the semantics of words [24] Tsung-Yi Lin, Michael Maire, Serge J. Belongie, Lubomir D. Bourdev,
and pictures’, in Proceedings Eighth IEEE International Conference on Ross B. Girshick, James Hays, Pietro Perona, Deva Ramanan, Piotr
Computer Vision. ICCV 2001, volume 2, pp. 408–415. IEEE, (2001). Dollár, and C. Lawrence Zitnick, ‘Microsoft COCO: common objects
[3] Raffaella Bernardi, Ruket Cakici, Desmond Elliott, Aykut Erdem, Erkut in context’, CoRR, abs/1405.0312, (2014).
Erdem, Nazli Ikizler-Cinbis, Frank Keller, Adrian Muscat, and Bar- [25] J. Mao, J. Huang, A. Toshev, O. Camburu, A. Yuille, and K. Murphy,
bara Plank, ‘Automatic description generation from images: A survey ‘Generation and comprehension of unambiguous object descriptions’,
of models, datasets, and evaluation measures’, Journal of Artificial In- in 2016 IEEE Conference on Computer Vision and Pattern Recognition
telligence Research, 55, 409–442, (2016). (CVPR), pp. 11–20, (June 2016).
[4] Samuel R Bowman, Gabor Angeli, Christopher Potts, and Christo- [26] Aditya Mogadala, Marimuthu Kalimuthu, and Dietrich Klakow,
pher D Manning, ‘A large annotated corpus for learning natural lan- ‘Trends in integration of vision and language research: A survey of
guage inference’, arXiv preprint arXiv:1508.05326, (2015). tasks, datasets, and methods’, ArXiv, abs/1907.09358, (2019).
[5] Elia Bruni, Nam Khanh Tran, and Marco Baroni, ‘Multimodal distribu- [27] Jeffrey Pennington, Richard Socher, and Christopher D Manning,
tional semantics’, J. Artif. Int. Res., 49(1), 1–47, (January 2014). ‘GloVe: Global vectors for word representation’, in Conference on Em-
[6] Daniel Cer, Mona Diab, Eneko Agirre, Iñigo Lopez-Gazpio, and Lucia pirical Methods in Natural Language Processing, pp. 1532–1543. Stan-
Specia, ‘SemEval-2017 task 1: Semantic textual similarity multilingual ford University, Palo Alto, United States, (January 2014).
and crosslingual focused evaluation’, in Proceedings of the Interna- [28] Bryan A Plummer, Liwei Wang, Chris M Cervantes, Juan C Caicedo,
tional Workshop on Semantic Evaluation (SemEval), pp. 1–14, (2017). Julia Hockenmaier, and Svetlana Lazebnik, ‘Flickr30k entities: Col-
[7] Daniel Cer, Yinfei Yang, Sheng-yi Kong, Nan Hua, Nicole Limti- lecting region-to-phrase correspondences for richer image-to-sentence
aco, Rhomni St John, Noah Constant, Mario Guajardo-Cespedes, Steve models’, in Proceedings of the IEEE international conference on com-
Yuan, Chris Tar, et al., ‘Universal sentence encoder for english’, in Pro- puter vision, pp. 2641–2649, (2015).
ceedings of the 2018 Conference on Empirical Methods in Natural Lan- [29] Bryan A. Plummer, Liwei Wang, Chris M. Cervantes, Juan C. Caicedo,
guage Processing: System Demonstrations, pp. 169–174, (2018). Julia Hockenmaier, and Svetlana Lazebnik, ‘Flickr30k entities: Col-
[8] Ido Dagan, Oren Glickman, and Bernardo Magnini, ‘The pascal recog- lecting region-to-phrase correspondences for richer image-to-sentence
nising textual entailment challenge’, in Machine Learning Challenges models’, Int. J. Comput. Vision, 123(1), 74–93, (May 2017).
Workshop, pp. 177–190. Springer, (2005). [30] Alec Radford, Jeff Wu, Rewon Child, David Luan, Dario Amodei, and
[9] Oier Lopez de Lacalle, Aitor Soroa, and Eneko Agirre, ‘Evaluating Ilya Sutskever, ‘Language models are unsupervised multitask learners’,
Multimodal Representations on Sentence Similarity: vSTS, Visual Se- (2019).
mantic Textual Similarity Dataset’, Workshop on Closing the Loop Be- [31] Cyrus Rashtchian, Peter Young, Micah Hodosh, and Julia Hock-
tween Vision and Language at ICCV, (2017). enmaier, ‘Collecting image annotations using Amazon’s mechanical
[10] Wim De Mulder, Steven Bethard, and Marie-Francine Moens, ‘A sur- turk’, in Proceedings of the Workshop on Creating Speech and Lan-
vey on the application of recurrent neural networks to statistical lan- guage Data with Amazon’s Mechanical Turk, pp. 139–147, (2010).
guage modeling’, Computer Speech & Language, 30(1), 61–98, (2015). [32] Ehud Reiter and Robert Dale, Building natural language generation
[11] J. Deng, W. Dong, R. Socher, L.-J. Li, K. Li, and L. Fei-Fei, ‘ImageNet: systems, Cambridge university press, 2000.
A Large-Scale Hierarchical Image Database’, in CVPR09, (2009). [33] Karen Simonyan and Andrew Zisserman, ‘Very deep convolutional net-
[12] Jacob Devlin, Ming-Wei Chang, Kenton Lee, and Kristina Toutanova, works for large-scale image recognition’, in International Conference
‘BERT - Pre-training of Deep Bidirectional Transformers for Language on Learning Representations, (2015).
Understanding.’, CoRR, 1810, arXiv:1810.04805, (2018). [34] Christian Szegedy, Vincent Vanhoucke, Sergey Ioffe, Jon Shlens, and
[13] Desmond Elliott, Stella Frank, Khalil Sima’an, and Lucia Specia, ZB Wojna, ‘Rethinking the inception architecture for computer vision’,
‘Multi30k: Multilingual english-german image descriptions’, in 5th (06 2016).
Workshop on Vision and Language, (2016). [35] Kai Sheng Tai, Richard Socher, and Christopher D. Manning, ‘Im-
[14] Fartash Faghri, David J Fleet, Jamie Ryan Kiros, and Sanja Fidler, proved semantic representations from tree-structured long short-term
‘Vse++: Improving visual-semantic embeddings with hard negatives’, memory networks’, in Proceedings of the 53rd Annual Meeting of the
(2018). Association for Computational Linguistics, pp. 1556–1566, (2015).
[15] Andrea Frome, Greg Corrado, Jonathon Shlens, Samy Bengio, Jeffrey [36] Emiel van Miltenburg, Desmond Elliott, and Piek Vossen, ‘Measur-
Dean, Marc’Aurelio Ranzato, and Tomas Mikolov, ‘Devise: A deep ing the diversity of automatic image descriptions’, in Proceedings of
visual-semantic embedding model’, in Neural Information Processing the 27th International Conference on Computational Linguistics, pp.
Systems (NIPS), (2013). 1730–1741, Santa Fe, New Mexico, USA, (August 2018). Association
[16] Longteng Guo, Jing Liu, Peng Yao, Jiangwei Li, and Hanqing Lu, for Computational Linguistics.
‘Mscap: Multi-style image captioning with unpaired stylized text’, in [37] Ashish Vaswani, Noam Shazeer, Niki Parmar, Jakob Uszkoreit, Llion
Proceedings of the IEEE Conference on Computer Vision and Pattern Jones, Aidan N Gomez, Ł ukasz Kaiser, and Illia Polosukhin, ‘Attention
Recognition, pp. 4204–4213, (2019). is all you need’, in Advances in Neural Information Processing Systems
[17] Kaiming He, Xiangyu Zhang, Shaoqing Ren, and Jian Sun, ‘Deep resid- 30, eds., I. Guyon, U. V. Luxburg, S. Bengio, H. Wallach, R. Fergus,
ual learning for image recognition’, 2016 IEEE Conference on Com- S. Vishwanathan, and R. Garnett, 5998–6008, (2017).
puter Vision and Pattern Recognition (CVPR), 770–778, (2015). [38] Elena Voita, Rico Sennrich, and I. M. Titov, ‘The bottom-up evolution
[18] Sepp Hochreiter and Jürgen Schmidhuber, ‘Long short-term memory’, of representations in the transformer: A study with machine translation
Neural Comput., 9(8), 1735–1780, (November 1997). and language modeling objectives’, ArXiv, abs/1909.01380, (2019).
[19] Micah Hodosh, Peter Young, and Julia Hockenmaier, ‘Framing image [39] Hoa Trong Vu, Claudio Greco, Aliia Erofeeva, Somayeh Jafaritazehjan,
description as a ranking task: Data, models and evaluation metrics’, J. Guido Linders, Marc Tanti, Alberto Testoni, Raffaella Bernardi, and Al-
Artif. Int. Res., 47(1), 853–899, (May 2013). bert Gatt, ‘Grounded textual entailment’, in Proceedings of the 27th In-
[20] Andrej Karpathy and Fei-Fei Li, ‘Deep visual-semantic alignments for ternational Conference on Computational Linguistics, pp. 2354–2368,
generating image descriptions’, in IEEE Conference on Computer Vi- Santa Fe, New Mexico, USA, (August 2018).
sion and Pattern Recognition, CVPR 2015, Boston, MA, USA, June 7- [40] Ning Xie, Farley Lai, Derek Doran, and Asim Kadav, ‘Visual en-
12, 2015, pp. 3128–3137, (2015). tailment: A novel task for fine-grained image understanding’, arXiv
[21] Ranjay Krishna, Yuke Zhu, Oliver Groth, Justin Johnson, Kenji Hata, preprint arXiv:1901.06706, (2019).
Joshua Kravitz, Stephanie Chen, Yannis Kalantidis, Li-Jia Li, David A. [41] Si Zhang, Hanghang Tong, Jiejun Xu, and Ross Maciejewski, ‘Graph
Shamma, Michael S. Bernstein, and Li Fei-Fei, ‘Visual genome: Con- convolutional networks: a comprehensive review’, Computational So-
necting language and vision using crowdsourced dense image annota- cial Networks, 6(1), 11, (2019).
tions’, Int. J. Comput. Vision, 123(1), 32–73, (May 2017).You can also read