Hyperglycemia stimulating diet induces liver steatosis in sheep - Nature
←
→
Page content transcription
If your browser does not render page correctly, please read the page content below
www.nature.com/scientificreports
OPEN Hyperglycemia‑stimulating diet
induces liver steatosis in sheep
Mugagga Kalyesubula1,2, Ramgopal Mopuri1, Alexander Rosov1, Tamir Alon1,2, Nir Edery3,
Uzi Moallem1 & Hay Dvir1*
Hepatic steatosis is strongly associated with chronic liver disease and systemic metabolic disorder.
Adipose lipolysis is a recognized principal source of intrahepatic fat in various metabolic disorders,
including non-alcoholic fatty liver disease. We hypothesized that, in the premorbid state, hepatic
de novo lipogenesis (DNL) driven by excess carbohydrates abundance might play a more significant
role. We employed a novel nutritional model in sheep of two distinct carbohydrates abundances.
During 4 months of the dietary treatment, lambs were monitored for metabolic and terminal liver
parameters. Lambs grown on the high-calorie (HC) diet were consistently more hyperglycemic and
hyperinsulinemic than lambs grown on the lower-calorie (LC) diet (P < 0.0001). As a result, the HC
lambs developed systemic- (HOMA-IR of 7.3 vs. 3.1; P < 0.0001), and adipose- (ADIPO-IR of 342.7 vs.
74.4; P < 0.0001) insulin resistance, significant adiposity (P < 0.0001), and higher plasma triglycerides
(P < 0.05). Circulating leukocytes in the HC lambs had higher mRNA expression levels of the
proinflammatory markers CCL2 (P < 0.01) and TNF-alpha (P < 0.04), and IL1B trended higher (P < 0.1).
Remarkably, lambs on the HC diet developed substantial liver steatosis (mean fat content of 8.1 vs.
5.3% in the LC group; P < 0.0001) with a higher histological steatosis score (2.1 vs. 0.4; P < 0.0002).
Hepatic steatosis was most-strongly associated with blood glucose and insulin levels but negatively
correlated with circulating fatty acids—indicating a more significant contribution from hepatic DNL
than from adipose lipolysis. Sheep may prove an attractive large-animal model of fatty liver and
metabolic comorbidities resulting from excess carbohydrate-based energy early in life.
As the body hub for energy metabolism, the liver plays a crucial role in processing dietary energy, converting
it from one form to another, and distributing it to extrahepatic energy-expenditure or energy-storage tissues.
To support short-term energy demands, the liver also stores energy, mainly carbohydrates-based energy in the
form of glycogen. Although fat is generally stored in adipose tissue for long-term energy requirements, some low
steady-state level of hepatic fat is considered normal and can be utilized and recycled efficiently for short-term
energy needs1. Fatty liver (FL), however, represent an abnormal condition of ectopic retention of intrahepatic fat
(hepatic steatosis; > 5.5% w/w), which is strongly associated with chronic liver disease (steatohepatitis, cirrhosis),
with prominent metabolic disorders such as obesity, type-2 diabetes and metabolic syndrome, and with systemic
metabolic derangements such as dyslipidemia, hyperglycemia and insulin r esistance2–5.
FL develops when the rate of acquisition of fatty acids (FA) from the circulation and from hepatic de novo
lipogenesis (DNL) exceeds their rate of disposal by oxidation and export out of the liver. The resulting excess of
hepatic FA is utilized in triglycerides (TG) synthesis for storage as intrahepatic fat in hepatocytes lipid droplets6.
Yet, why intrahepatic fat starts to accumulate remains considerably unclear, and the governing molecular mecha-
nisms are a subject of extensive i nvestigations1.
Notably, adipose lipolysis releasing non-esterified fatty acids (NEFA) to the circulation in response to
starvation7–9, or as a result of adipose insulin resistance developed by o vernutrition10,11 or by excessive alcohol
12
consumption , is a common FL determinant believed to serve as a major substrate source for ectopic hepatic
TG. Indeed, although carbohydrates can fuel hepatic DNL and thereby increase the hepatic pool of TG, in the
settings of non-alcoholic fatty liver disease (NAFLD), adipose-derived NEFA accounted for most (~ 60%) of the
hepatic TG whereas DNL accounted for only ~ 25%13. The relative contributions to ectopic hepatic TG in healthy
or premorbid states were less explored, although they may better reflect the initiation phase of non-alcoholic
liver steatosis.
1
Institute of Animal Science, Volcani Center - ARO, Rishon LeZion, Israel. 2Department of Animal Science, The
Hebrew University of Jerusalem, Rehovot, Israel. 3Pathology Laboratory, Kimron Veterinary Institute, Veterinary
Services, Rishon LeZion, Israel. *email: haydvir@volcani.agri.gov.il
Scientific Reports | (2020) 10:12189 | https://doi.org/10.1038/s41598-020-68909-z 1
Vol.:(0123456789)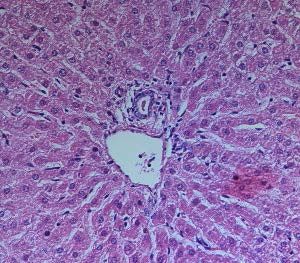
www.nature.com/scientificreports/
Composition Oat hay Concentrate Ground corn Soybean meal
Moisture (%) 11.0 14.9 16.3 13.6
Crude protein (%) 10.0 18.4 9.4 53.0
Crude fat (%) 3 3.5 4.1 1.6
NDF (%) 56.0 22.6 9.2 8.0
ADF (%) 31.6 9.9 2.6 5.9
ME, MCal/kg 2.19 3.2 3.9 2.8
HC average intake (kg) 0.19 ± 0.01 1.81 ± 0.06 – –
HC average intake (ME, MCal/kg) 0.41 ± 0.01 5.79 ± 0.18 – –
LC average intake (kg) 0.98 ± 0.07 – 0.18 ± 0.01 0.22 ± 0.01
LC average intake (ME, MCal/kg) 2.11 ± 0.16 – 0.70 ± 0.04 0.62 ± 0.04
Table 1. Composition of feeds expressed as dry matter. Crude protein intake was maintained at ~ 15% of the
dietary intake for both the LC and HC rations. Values represent mean ± SD as relevant. ADF acid detergent
fiber, NDF neutral detergent fiber, ME metabolizable energy.
Ruminants are also susceptible to the development of FL during late pregnancy and early lactation; however,
it occurs on a background of negative energy balance that triggers excessive adipose l ipolysis14. Although simi-
lar physiology develops in women with pregnancy starvation ketoacidosis15, this presentation of FL due to lack
of dietary energy is of limited utility to represent the nature of NAFLD initiation by excessive caloric intake.
Whether ruminants can develop hepatic steatosis due to positive energy balance based on excess carbohydrate
energy is currently unknown.
In previous studies with sheep16, we found that feeding growing lambs a carbohydrates-rich grain-concentrate
ration induces substantial hyperglycemia, with ~ 40% higher blood glucose levels than in lambs raised on a
hay-based ration. Based on this observation and on the fact that sheep, as humans, are willing to overeat, we
hypothesized that feeding them with that hyperglycemia-stimulating diet for an extended period will induce
hepatic steatosis. Here, we tested this hypothesis to investigate long-term metabolic and liver-related implica-
tions of such dietary hyperglycemia, as well as to assess the potential of using sheep as a large-animal model for
FL research with relevance to NAFLD.
Results
The HC diet induced hyperglycemia, hyperinsulinemia and insulin resistance. Although both
rations were carbohydrates-based diets with little fat content (under 3%) and served ad libitum, the HC diet
yielded a significantly higher average intake of metabolizable energy (~ 6.3 vs. 3.5 Mcal/day, respectively;
Table 1), thereby providing more glucose precursors for hepatic gluconeogenesis. Within a few days of treat-
ment, the lambs on the HC diet developed substantially higher blood-glucose concentration than those on the
LC diet (100 vs. 71 mg/dL, respectively ; P < 0.0001). The glycemic difference decreased mildly with time (Fig. 1a)
but remained relatively high and steady throughout the 4-month experimental period, with overall mean fed-
glucose concentrations of 86.2 vs. 68.6 mg/dL, respectively (P < 0.0001; Table 2). Noteworthy, postprandial blood
glucose concentrations of ~ 100 mg/dL are considered normal in humans, yet they are exceptionally high in sheep
having normal blood glucose concentrations of ~ 52 mg/dL17. Higher concentrations, typically above 60 mg/dL
in our husbandry with the Afec-Assaf breed, are required to support lambs growth (Supplementary Figure 2).
As expected, the hyperglycemic lambs raised on the HC diet had consistently higher concentrations of plasma
insulin than lambs grown on the LC diet, with an overall mean of 182.6 vs. 24.3 µIU/mL, respectively (P < 0.0001;
Fig. 1b; Table 2). Remarkably, within 4-months of the dietary treatment, the HC group had a significantly higher
fasting insulin levels (49.1 vs. 20.5 µIU/mL, P < 0.0002), despite similar fasting glucose levels (Fig. 1b, Table 3).
In other words, the HC group were systemically more resistant to insulin, as indicated quantitatively by their
fasting homeostatic model assessment of insulin resistance (HOMA-IR) values of 7.3 compared to 3.1 µIU ×
mg/[mL]2 in the LC group (Fig. 1c; P < 0.0008).
Intriguingly, despite the higher fasting insulin levels in the HC group (Fig. 1b), their fasting plasma NEFA
levels, known to be tightly regulated by insulin, were significantly higher than in the LC group (1,010 vs. 492
µEq/L, P < 0.0001, Fig. 2a), indicating adipose tissue insulin resistance. The respective adipose insulin resistance
(ADIPO-IR)18 index values were 342.6 vs. 74.4 mmol/L × pmol/L; P < 0.0001 (Fig. 2b).
The HC diet induced adiposity, dyslipidemia and enhanced expression of inflammatory
cytokines. As expected, lambs raised on the HC diet gained more weight than lambs on the LC diet (aver-
age of 392 vs. 165 g/day; P < 0.0001), respectively reaching mean final body weights of 73 vs. 45 kg (P < 0.0001)
(Table 4). The respective final BCS of 3.7 vs. 2.5 (P < 0.0001) indicate that the HC lambs developed significant
adiposity19, as was also reflected in their BMI and GI indexes20 (Table 4). Consistent with their enhanced adipos-
ity, after 4 months of treatment, the HC lambs exhibited increased plasma TG concentration (Fig. 3a), with twice
the mean final concentration in the LC lambs (31.8 vs. 15.6 mg/dL; P < 0.05).
Since overnutrition, hyperglycemia, insulin resistance and obesity are associated with systemic low-grade
chronic inflammation21–24, we investigated the expression levels of several common inflammatory cytokines
in circulating leukocytes. The hyperglycemic sheep fed the HC diet showed increased expression levels of the
Scientific Reports | (2020) 10:12189 | https://doi.org/10.1038/s41598-020-68909-z 2
Vol:.(1234567890)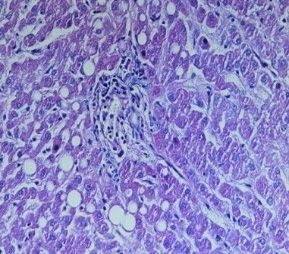
www.nature.com/scientificreports/
110
a High Calorie Low Calorie
100
Glucose [mg/dL]
90 Fas ng
80
70
LC diet
60 ini ated
50
0 10 20 30 40 50 60 70 80 90 100 110 120 130
Time [Days]
300
b
250
High Calorie Low Calorie 10
c T-test
HOMA IR [mIU x mg/[mL]2 ]
Insulin [uIU/mL]
8 P < 0.0001
200 Fas ng
150 6
100 4
50 2
0 0
25 56 73 108 115 119 HC LC
Time [Days]
Figure 1. Glucose and Insulin Response to the dietary treatments. (a) Glucose response. Repeated measures
ANOVA shows an effect of: treatment (P < 0.0001), time (P < 0.0001), treatment-time interaction (P < 0.0001)
and individual animal (P < 0.0011). SEM = 0.638. The fasting glucose, at day 115 from treatment, was not
included in the ANOVA. Both treatment groups were given a 10-day acclimatization period in the experimental
pen with diets with similar metabolizable energy of ~ 4.86 MCal. (b) Insulin response. The analysis shows an
effect of treatment (P < 0.0001), time (P < 0.0001), individual animal (P < 0.0101) but no treatment by time
interaction. SEM = 8.29. Fasting insulin concentrations were higher in the HC group (P < 0.0002), but excluded
from the overall ANOVA with repeated measures analysis. (c) Insulin resistance measured by HOMA-IR.
Student’s t-test P < 0.0001; SEM = 0.6. Due to unequal variances between the treatment groups, the statistical
analysis was performed on the log-transformed values for both (b) and (c).
Treatment P-value
Parameter High calorie Low calorie SEM Treatment Time Treatment × time
Initial glucose (mg/dL) 101.1 102.1 1.2 0.7
Glucose (mg/dL) 86.2 68.6 0.6 0.0001 0.0001 0.0001
Daily weight gain, kg 0.39 0.17 0.01 0.0001 0.0001 0.0001
Insulin, uIU/mL 182.6 24.3 8.3 0.0001 0.007 0.14
NEFA, µEq/L 156.8 281.1 16.9 0.0001 0.009 0.15
Table 2. Effect of the high calorie and low-calorie treatments on body weight, glucose and insulin. Except for
initial glucose, the values represent overall mean of the experimental period.
Parameter High calorie Low calorie SEM P-value (t-test)
Body weight, kg 72.9 45.0 2.9 0.0001
Weight loss, kg 0.8 2.4 0.3 0.006
Glucose, mg/dL 58.9 59.5 0.9 0.8
BHBA, mmol/L 0.313 0.275 0.011 0.09
NEFA, µEq/L 1,010.5 492.9 61.3 0.0001
Insulin, uIU/mL 49.1 20.5 3.9 0.0002
Table 3. Fasting measurements in the high- and low-calorie treatments.
Scientific Reports | (2020) 10:12189 | https://doi.org/10.1038/s41598-020-68909-z 3
Vol.:(0123456789)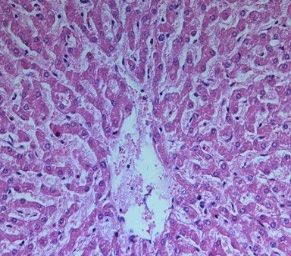
www.nature.com/scientificreports/

                                                    1200   a                                                                                  450
                                                                                                                                                    b
                                                                                                                                              400
                                                    1000                                                               *
                                                                        High calorie    Low Calorie                                           350
                                                                                                                                                             T-test P < 0.0001

                                                                                                                                    (mMxpM)
                                     NEFA [µEq/L]
                                                    800                                                                                       300
                                                                                                                                              250
                                                    600
                                                                                                                                              200
                                                               *

                                                                                                                                   Adipo-IR
                                                    400                                  *                                                    150
                                                    200                                                                                       100
                                                                                                                                              50
                                                      0
                                                                                                                                               0
                                                                   17                    108                  115 (Fasted)                              HC            LC
                                                                          Time [Days of treatment]

                                      Figure 2.  Non-esterified fatty acid (NEFA) and adipose insulin resistance in response to the high- and low-
                                      calorie treatments. (a) Plasma NEFA concentrations. Repeated measures ANOVA shows an effect of treatment
                                      (P < 0.0001) and time (P < 0.009). SEM = 16.9. Fasting levels were not included in the model and analysed
                                      independently by a student’s t-test and the significance level was Bonferroni-Holm corrected. *P < 0.05. (b)
                                      Adipose tissue insulin resistance as measured by ADIPO-IR. Student’s t-test detects an effect of treatment
                                      (P < 0.0001) SEM = 34. Due to unequal variances between treatments, the statistical analysis was performed on
                                      the log-transformed values.

                                                                        High calorie   Low calorie    SEM       P-value (t-test)
                                         Initial BW (kg)                28.3           26.4           0.9       0.28
                                         Final BW (kg)                  72.9           45.0           2.9       0.0001
                                         Liver weight (g)               1,365          625            77        0.0001
                                         Hepatic index                  1.86           1.39           0.001     0.0001
                                         BCS                            3.68           2.53           0.12      0.0001
                                         Body length (m)                1.04           0.86           0.02      0.0001
                                         Wither’s height (m)            0.77           0.72           0.003     0.003
                                         Heart girth (cm)               102.8          92.7           1.6       0.001
                                         BMI (W/BL2)                    66.8           60.2           1.1       0.002
                                         GI (W/BL1.5)                   68.2           56.0           1.5       0.0001

                                      Table 4.  Physical body parameters in the high- and low-calorie treatments. SEM: standard error of the mean;
                                      BW: body weight; Hepatic Index: (liver weight)*100/(body weight); BCS: body condition score; BMI: Body
                                      Mass Index; W: weight; BL: body length; GI: G Index.

                                      pro-inflammatory markers CCL2 (P < 0.01) and TNF-alpha (P < 0.04), and a tendency (P < 0.098) for higher
                                      expression of IL1B (Fig. 3b).

                                      The HC diet induced significant hepatic steatosis and hepatomegaly. Remarkably, the HC group
                                      developed substantial hepatic steatosis with an average liver fat content of 8.1 vs. 5.3% in the LC group (P < 0.0001;
                                      Fig. 4a). By histopathology, the HC group had significantly more extensive microvesicular and macrovesicular
                                      hepatocyte steatosis than the LC group (Fig. 4b); with a steatotic score of 2.1 vs. 0.4, respectively (P < 0.0002).
                                      Occasional lobular inflammation and mild ballooning were also observed among the HC lambs (Supplementary
                                      Figure 4), but no significant fibrosis. Intriguingly, lambs in the HC group developed not only larger livers (mean
                                      weight of 1.36 vs. 0.62 kg; P < 0.0001; Table 4), but also a higher hepatic index (liver weight normalized to body
                                      weight; Fig. 4c) with values of 1.9 vs. 1.4 (P < 0.0005), respectively, indicative of hepatomegaly.
                                          As may be expected due to their higher energy abundance, the HC group tended to have higher hepatic
                                      glycogen content than the LC group (mean of 0.57 vs. 0.35%; Fig. 4d), but the difference was not statistically
                                      different (P < 0.1308).

                                      Hyperglycemia was the strongest predictor of hepatic steatosis. A stepwise regression analy-
                                      sis with the liver-fat content as the response variable and the measured physical (body weight, liver weight,
                                      hepatic index) and metabolic parameters (average blood glucose, insulin, TG, NEFA, fasting TG, HOMA-IR
                                      and ADIPO-IR) as the explanatory variables ("Methods") yielded only two significant effects; average glucose
                                      (P < 0.0004) and HOMA-IR (P < 0.035).
                                          The Pearson correlation analysis of the hepatic steatosis (Table 5) was also the highest with average glucose
                                      (r = 0.77; P < 0.0001), and as expected, the steatosis clustered well with the dietary treatment (Supplementary
                                      Figure 3). The next strongly associated metabolic factors were HOMA-IR (r = 0.68; P < 0.0001), mean plasma
                                      insulin (r = 0.66; P < 0.0001) and triglycerides (r = 0.65; P < 0.0001), and ADIPO-IR (r = 0.65; P < 0.0001). Hepatic

          Scientific Reports |   (2020) 10:12189 |                              https://doi.org/10.1038/s41598-020-68909-z                                                       4

Vol:.(1234567890)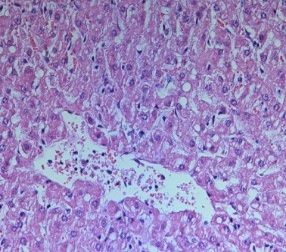
www.nature.com/scientificreports/
40
a
35 *
Triglycerides [mg/dL]
30 High Calorie Low Calorie
25
20
15
10
5
0
25 46 73 108 115 (Fasted) 119
Time [days]
3.0 Leukocyte Differen al Gene expression
b
2.5 High Calorie Low Calorie
*
#
Fold difference
2.0
*
1.5
1.0
0.5
0.0
CCl2 IFN-gamma TNF-alpha IL1-beta IL8
Figure 3. Triglycerides and inflammatory markers in response to the high- and low-calorie dietary treatments.
(a) Plasma triglycerides concentrations. Repeated measures ANOVA shows an effect of treatment (P < 0.0013),
time (P < 0.0001), treatment by time interaction (P < 0.01). SEM = 0.716. Due to unequal variances between
treatments, the statistical analysis was performed on the log-transformed values. Data for fasting levels were not
included in the ANOVA, and analyzed independently by a Student’s t-test at a *P < 0.05 significance level and
Bonferroni-Holm correction. (b) Differential gene expression analysis in circulating leukocytes. Student’s t-tests
*CCL2 P < 0.01, *TNF-alpha P < 0.04, #IL1B P < 0.098.
steatosis was poorly associated with fasting plasma-concentrations of glucose (r = 0.26; P < 0.163) and with fast-
ing TG (r = 0.24; P < 0.198). Surprisingly, although hepatic steatosis was associated with the final fasting plasma
NEFA (r = 0.62; P < 0.0002), it was negatively correlated with the overall fed plasma NEFA (r = − 0.44, P < 0.016).
Collectively, these analyses suggest that the observed hepatic steatosis reflects a cumulative effect of the pro-
longed treatment that is most strongly associated with the average fed-blood glucose, rather than a reflection
of the NEFA influx.
Discussion
Blood glucose levels reflect the carbohydrates abundance in sheep. The efficient microbial
digestion of soluble carbohydrates in the rumen leaves virtually no free dietary glucose for direct intestinal
absorption25. As such, blood glucose in ruminants originates mainly from endogenous gluconeogenesis based
on glucose precursors, primarily propionic acid, derived from the microbial fermentation of their feedstuffs25.
As the carbohydrates composition of feeds dictate the nature of the fermentation products and their rate of
formation26, they ultimately dictate the energetic status of the animal. Pelleted concentrate-based feeds are rich
in starch and soluble carbohydrates, which metabolize efficiently into propionate in the rumen and provide high
levels of metabolizable energy and substrate influx for hepatic gluconeogenesis. At the other extreme, straw
and hay-based feeds, which are rich in fibrous structural carbohydrates, ferment less efficiently and provide less
Scientific Reports | (2020) 10:12189 | https://doi.org/10.1038/s41598-020-68909-z 5
Vol.:(0123456789)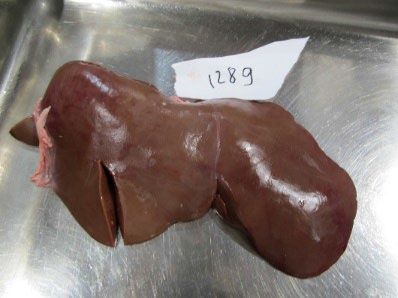
www.nature.com/scientificreports/
9 a T-test P < 0.0001
b 0.05 mm
8
7
% Liver Fat content
6 5.5% threshold
5
H&E LC - 5.0 % fat H&E LC - 1.7 % fat
4
3
2
1
0
High Calorie Low Calorie
PAS HC - 9.6 % Fat H&E HC - 9.7 % Fat
c Hepta c Index d 0.8
2
T-test P < 0.0001
0.7
1.5 0.6
% Glycogen
0.5
1 0.4
0.3
0.5 0.2
0.1
0 0
High Calorie Low Calorie
HC LC
Figure 4. Effect of the high- and low-calorie dietary treatments on the liver. (a) Hepatic-fat content, as derived
from weight of total fat vs. the wet-liver weight. The HC treatment induced substantial hepatic steatosis,
significantly higher than observed for the LC livers (Student t-test, P < 0.0001). (b) Representative liver tissue
sections from the HC and LC groups analyzed by histopathology with Haematoxylin and Eosin (H&E) or
Periodic Acid-Schiff (PAS) staining. The HC hepatocytes (bottom) showed macrovesicular and steatosis around
both the portal (left) and central (right) veins. The top LC liver slices showed no lipid droplets formation. The
images were taken at a ×200 magnification. (c) Hepatic index expressed (liver weight)*100/(body weight).
Student’s t-test detects an effect of treatment (P < 0.0001). (d) Percentage of liver glycogen. The values in the HC
group trended higher than in the LC group, though not significantly different (student’s t-test, P < 0.1308;
SEM = 0.0735).
Pearson
Parameter correlation (r) P-value
Fed glucose 0.7735 0.0001
Fasting glucose 0.2614 0.16
Fed insulin 0.6578 0.0001
Fasting insulin 0.6690 0.0001
HOMA IR 0.6775 0.0001
Liver weight 0.7476 0.0001
Liver index 0.6627 0.0001
Fed plasma TG 0.6497 0.0001
Fasting plasma TG 0.24 0.198
Fed plasma NEFA − 0.4368 0.016
Fasting plasma NEFA 0.6212 0.0002
ADIPO-IR 0.6535 0.0001
Table 5. Pearson correlations between liver-fat content and metabolic factors measured in sheep.
Scientific Reports | (2020) 10:12189 | https://doi.org/10.1038/s41598-020-68909-z 6
Vol:.(1234567890)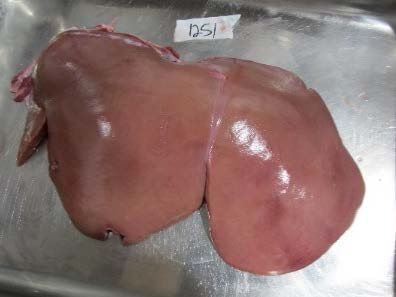
www.nature.com/scientificreports/
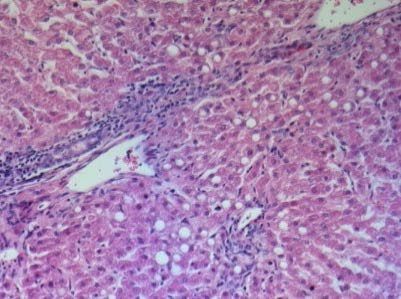
Low Calorie diet 0.05 mm 4.1% Fat
High Calorie diet 0.05 mm 8.2% Fat
Pregnancy Toxemia 0.05 mm 11.2% Fat
Figure 5. Representative pictures of livers and corresponding histopathological analysis. Liver sections were
stained by H&E and imaged at ×200 magnification. The arrows exemplify macrovesicular steatosis where
hepatocytes nuclei are pushed aside by large lipid droplets.
metabolizable energy and glucose precursors. Here, we employed two dietary compositions, substantially differ-
ent in their metabolizable energy, to obtain two groups of sheep considerably differing in their glycemic indexes,
as a means to investigate the relationships between high carbohydrate-based energy and hepatic steatosis.
Indeed, the HC concentrate-based ration led to an average consumption of 6.3 Mcal/day of metabolizable
energy; yielding an average blood glucose level of up to 100 mg/dL. In sharp contrast, the LC hay-based ration
led to an average consumption of 3.5 Mcal/day of metabolizable energy, and average blood glucose of up to
70 mg/dL. Therefore, the blood glucose concentrations in growing lambs fed ad libitum reflected the consumed
metabolizable energy, the animals’ carbohydrate-abundance, and their energetic status remarkably well.
Prolong exposure to excess carbohydrates energy drives systemic metabolic derangements,
primarily promoting insulin resistance. The continued ad libitum consumption of the HC diet sus-
tained a sufficient substrate influx for gluconeogenesis to induce steady hyperglycemia throughout the 4 months
of the experimental duration. Along with the hyperglycemia, the over-nourished lambs had also developed
hyperinsulinemia, excess body fat, dyslipidemia, insulin resistance and increased expression of proinflammatory
markers. Humans presenting with these metabolic abnormalities would probably be diagnosed with metabolic
syndrome27. Of notice, the HC lambs may not be classified as diabetic, at least not during the course of the
experimental period, since their final fasting glucose levels were relatively low and statistically non-different
from those of the LC lambs (Fig. 1a).
Excessive carbohydrates levels induce hepatic steatosis. The large quantity of liver tissue obtained
from the sheep enabled non-subjective fat-content determination at outstanding precision. Whereas lambs in
the LC diet developed lean livers (averaged at 5.3% fat), lambs on the HC diet developed steatotic livers ranging
from 6.2 to 10.8% (averaged at 8.1% fat). As a pathological reference, one of the fattiest livers documented at the
Volcani experimental flock of sheep had a fat content of 11.2%. That liver (Fig. 5) was obtained from a pregnant
ewe who died from pregnancy toxemia, the pathogenesis of which has long been attributed to fatty infiltration
of the liver due to negative energy balance28.
The current study, therefore, demonstrates that ruminants can develop hepatic steatosis, not only due to nega-
tive but also due to positive energy balance based on excess carbohydrate energy. Moreover, since both the LC
and the HC diets contained very little fat (under 3%), the results suggest that ectopic hepatic-fat accumulation
is independent of an exogenous source of fat. Interestingly, this is in contrast to what was found in swine that
Scientific Reports | (2020) 10:12189 | https://doi.org/10.1038/s41598-020-68909-z 7
Vol.:(0123456789)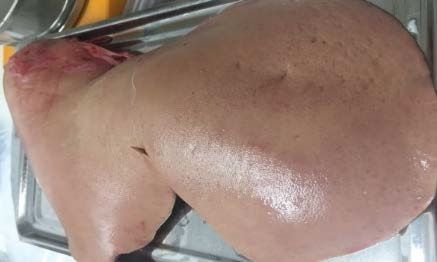
www.nature.com/scientificreports/
although develop metabolic syndrome like features on a high-fructose diet, but required substantial dietary fat
to develop hepatic s teatosis29.
Since feed intake is directly linked to lambs growth r ates30 (Supplementary Figure 2), the HC ration is com-
monly provided to growing lambs at intensive husbandries. Nevertheless, the clinical consequences of the result-
ing excessive carbohydrate energy have not been prudently investigated, clearly not concerning the liver. Whether
consumption of the HC diet for longer durations may induce advanced liver damage such as fibrosis and or
cirrhosis, or whether it potentiates the development of pregnancy fatty liver disease in female lambs grown on
it remains to be investigated.
Initiation of hepatic steatosis may be more dependent on de novo lipogenesis than on adipose
lipolysis and likely mediated by hyperinsulinemia. It is commonly believed, both in ruminants and
humans, that endogenous fat released from adipose lipolysis, yielding an increased flux of circulating NEFA into
the liver, is a major source for hepatic TG accumulation. However, the fed plasma NEFA levels were higher in
the LC vs. the HC lambs (Fig. 2a) and thus negatively correlated with hepatic steatosis (Tables 2 and 5). Instead,
hyperglycemia was the most steatogenic biochemical parameter, suggesting that hepatic DNL may have directly
contributed to the fat accumulated in the liver, and highlights carbohydrates excess as an independent risk factor.
The excess glucose levels can provide substrate flux to feed hepatic DNL (as a carbon source for both FA and
glycerol synthesis), but can also signal for upregulation of genes in the FA biosynthetic pathway, either directly
via the carbohydrate response element binding protein (chREBP)31, or indirectly via insulin-mediated activation
of sterol regulatory element binding protein 1C (SREBPc1)32. The higher correlation of hepatic steatosis with the
hyperglycemia than with the hyperinsulinemia may indicate that the carbohydrate abundance affected steatosis
both directly and indirectly via insulin signalling.
Noteworthy, by upregulation of the FA biosynthesis, glucose could potentially contribute to FA synthesis also
from the major carbon sources resulting from the microbial ruminal fermentation, i.e., acetate, propionate and
butyrate. Although normally acetate is mostly utilized by extrahepatic tissues33, propionate is almost exclusively
utilized for hepatic g luconeogenesis34 and butyrate is largely metabolized to ketone bodies by the rumen35,36, it
is plausible that, in the extreme hyperglycemic and hyprinsulinemic conditions induced by the HC diet, hepatic
DNL was partly based on carbon sources from these metabolites.
Indifferent glycogen levels may indicate hepatic insulin resistance. The anabolic actions of insu-
lin promote the synthesis of all the major classes of macromolecules, including proteins and the energy storage
classes of lipids and glycogen. Accordingly, the hepatic glycogen levels serve as a principal readout for the liver
activity of insulin37. Since glycogen synthesis requires both the activation of the enzyme glycogen synthase by
insulin and the availability of the substrate (glucose 6-phosphate), the combination of hyperinsulinemia and
hyperglycemia maximizes glycogen content38. Therefore, it can be expected that the HC lambs, which were both
hyperglycemic and hyperinsulinemic (Fig. 1), would present with significantly higher levels of hepatic glycogen.
The observation that only a moderate increase in glycogen content was observed in the HC vs. the LC lambs
(Fig. 4d), may thus suggest that their livers became less sensitive to insulin, which is indeed recognized to be
associated with decreased glycogen synthesis39.
Sheep as a large‑animal model for fatty liver and metabolic disorder. Although none recapitu-
lates the entire spectrum of the pathophysiology of metabolic steatosis triggered by overnutrition, animal mod-
els clearly provide powerful means to investigate disease pathogenesis, to discover disease-modulating targets,
as well as to evaluate potential therapeutics in order to increase the probability of success in clinical trials. Since
many preclinical results obtained in current rodent models of NAFLD were not translated to humans very suc-
cessfully, there is significant merit for the development of additional robust models, preferably with better trans-
lational potential as large animals of similar body size to human often c onvey40.
This work reveals the potential for using sheep as a highly-controlled large-animal model for FL research,
exemplifying the development of hepatic steatosis and key metabolic comorbidities due to excess carbohydrates-
based energy, in the absence of an exogenous source of fat. As humans, sheep present with the willingness
to overeat, therefore this model reflects the strong environmental component of metabolic and liver disease
triggered by overnutrition. Moreover, the development of hepatic steatosis in growing lambs exposed to high
carbohydrate-based energy, as shown here, represents the potential for fatty liver development at an early age,
which is of potential value to model diet-induced metabolic disorders in children.
The use of sheep as experimental models for obesity41 and diabetes42, was partly due to practical advantages
offered by large animals in physiological studies. Apart from having similar body and liver weights, these include
a long life span and a considerably larger quantity of biological material that respectively allow for studying long-
term effects and for frequent sampling of the same subject for a broad spectrum of biochemical and molecular
applications to investigate tissues- and systemic-related pathologies.
Future molecular-level characterizations and intervention studies to modulate hepatic steatosis will help
substantiate the applicability of this model system to the physiological and clinical settings in humans.
Conclusions. The complexity of the carbohydrates in the diet of ruminants determines the level of glucose
precursors and metabolizable energy that can be available to the animal. In growing lambs, it is well reflected in
their blood glucose levels. Thus, by feeding lambs with rations of varying consumed metabolizable energy, we
obtained two populations of significantly distinct glycemic indexes. The overnourished lambs were consistently
hyperglycemic and hyperinsulinemic, and in the course of 4 months, developed adiposity, dyslipidemia, insu-
lin resistance, and also substantial hepatic steatosis and hepatomegaly. Hyperglycemia, representing the high-
Scientific Reports | (2020) 10:12189 | https://doi.org/10.1038/s41598-020-68909-z 8
Vol:.(1234567890)www.nature.com/scientificreports/
carbohydrates abundance, was the strongest predictor of hepatic steatosis. Surprisingly, steatosis was negatively
correlated with circulating NEFA, suggesting that hepatic DNL may play a more significant role than adipose
lipolysis in the initiation of steatosis. The systemic metabolic and liver abnormalities induced by the HC diet in
sheep are similar to those observed in humans with metabolic syndrome and liver steatosis; therefore, this large-
animal model may be of value to NAFLD research and therapy development.
Methods
Animals and experimental design. All procedures involving animals in this study were approved by the
Volcani Center Animal Care Committee (permit # 764/18 IL). All methods were carried out in accordance with
the relevant guidelines and regulations of this committee. The animal experiments were conducted at the Vol-
cani experimental farm, Rishon LeZion, Israel. The experiment was initiated in December and ended in April,
corresponding to the end of winter and the beginning of spring in Israel. The animals were maintained in open-
shed pens of a concrete surface, adequately ventilated and illuminated and protected from direct sunlight and
rain. After weaning, at an average age of 45 days, lambs were group-fed ad libitum grain concentrate (Table 1)
supplemented with oat hay to approximately 8% of the ration until the initiation of the experiment. Thirty-one
weaned male lambs of the Afec-Assaf breed43 (2.2 ± 0.03 months old, 27 ± 0.85 kg in body weight) were randomly
assigned to two treatment groups housed in two adjacent pens. There were seven pairs of siblings, all assigned to
different treatments to minimize confounding effects. In practice, in the event siblings were randomly assigned
to the same group, one lamb of the pair was swapped with another lamb of similar body weight from the other
group. All animals were given a 10-day acclimatization period, during which they were group-fed a concentrate-
based diet at ~ 4.8MCal average consumed metabolizable energy. The treatments were either (i) high-calorie
(HC) ration (n = 15) based on ad libitum group-feeding concentrate pellets supplemented with 8% oat hay, or
(ii) lower-calorie (LC) ration (n = 16) based on ad libitum group-feeding oat hay supplemented with 14% corn
and 13% soy to ensure steady growth (Table 1). An equivalent amount of minerals premix was present in both
rations. Group left-over feeds were weighed weekly to determine the average intake. The HC lambs had a mean
daily intake of 6.3 ± 0.18 MCal metabolizable energy, whereas the LC lambs had a mean daily intake of 3.5 ± 0.21
MCal metabolizable energy, averaged over the last 80 days of the 4-months experimental duration (Supplemen-
tary Figure 1).
Blood glucose concentrations were determined weekly using the FreeStyle Optium glucometer (Abbot Dia-
betes Care Ltd., Oxfordshire, UK)44. Body weights were measured weekly. Plasma was isolated monthly. Briefly,
5 mL blood samples were collected via venipuncture of the jugular vein into heparinized vacutainers and imme-
diately placed on ice (Vacutainer; Becton Dickinson and Co., Franklin Lakes, NJ), then centrifuged at 2000×g for
15 min at 4 °C. The supernatant (plasma) was collected and immediately stored at − 20 °C until further analysis.
On day 114 of the experiment, all feeds were withdrawn from both treatments for 24 h with free access to
water to measure fasting parameters. Before fasting, the animal’s body condition score (BCS) on a scale of 1 to
5 whereby 1 represents very thin and 5 very f at45, body length, wither’s height and heart girth were determined.
Body weights were measured before and after fasting to determined the fasting weight loss. Fasting blood glucose
and BHBA concentrations were measured using the FreeStyle Optium glucometer. Fasting plasma was isolated
and stored at − 20 °C until further analysis.
After 121 days in study, the animals were slaughtered and their livers were harvested. About 150 g of the left
lobe of the liver was stored in a zip-lock bag at − 20 °C until further biochemical analysis.
Liver fat content analysis. By histopathology, NAFLD is defined as the presence of ≥ 5% steatotic
hepatocytes in the absence of secondary causes such as significant alcohol consumption or use of steatogenic
medications46. The less subjective biochemical threshold refers to having a total fat weight higher than 5.5% of
the wet liver weight, which corresponds to approximately 15% histological s teatosis47,48. We determined both but
based all of our analysis on the more sensitive hepatic fat content quantification by weight. Percent hepatic-fat
contents (w/w) were determined as previously d escribed49,50 with a slight modification. Duplicates of 1 g of fro-
zen liver samples were homogenized in 25 mL of 2:1 chloroform:methanol solution using a rotor homogenizer.
The homogenate was then sonicated (VCX 750, Sonics and Materials Inc., Newtown, CT, USA) for 5 min, 5 s on
5 s off, at an amplitude of 30. Sonicated samples were agitated for 24 h at room temperature and then centrifuged
at 3000×g for 10 min. The lipids-containing supernatant was collected and washed with 4 mL of 0.9% NaCl to
remove polar lipids, then centrifuged at 2500×g for 10 min. The resulting upper phase was discarded, and the
residual interface was further rinsed twice with 4 mL of 1:1 methanol:water solution. The lower chloroform
phase containing the fat (mainly TG and cholesterol esters) was then evaporated under vacuum in a rotary
evaporator. The fat was finally oven-dried at 45 °C for 2.5 h to remove residual moisture. The liver fat content was
determined as the percentage of the wet liver weight. The average values of the duplicates were used for further
statistical analysis.
Histological analysis. Slices (~ 1 cm × 2 cm × 0.2 cm ) of fresh liver samples immediately after slaughter
were fixed in formalin (4% formaldehyde, 13 gr/L sodium phosphate dibasic and 8 gr/L of sodium phosphate
monobasic) for at least 60 h before histological analysis. The formalin-soaked samples were dehydrated in a
series of ethanol and xylene solutions followed by paraffin embedding. Five µm liver sections sliced using the
Microm HM355S microtome (Thermo Fisher Scientific, USA), were fixed on glass slides, then rehydrated with
ethanol followed by hematoxylin/eosin (H&E) or periodic acid-Schiff (PAS) staining. Stained sections were
mounted in a xylene based mounting media (Tissue-Tek Glas mounting Media, Sakura, Netherlands). Histo-
logical images were captured using a digital camera mounted on a Nikon Eclipse 600 microscope (Nikon, Japan).
Steatosis was assessed and scored blindly to animal identification by an experienced histopathologist following
Scientific Reports | (2020) 10:12189 | https://doi.org/10.1038/s41598-020-68909-z 9
Vol.:(0123456789)www.nature.com/scientificreports/
the NAS scoring s ystem51 applied to steatosis only. Assessment was performed using H&E stained sections by
counting hepatocytes showing macrovesicular or microvesicular at ×400 magnification in 3 randomly selected
fields. Scoring of 0, 1, 2, or 3 was respectively assigned to samples having < 5%, 5–33%, > 33–66% or > 66% stea-
totic hepatocytes.
Liver glycogen analysis. Total liver glycogen was isolated as d escribed52, with some modifications. Dupli-
cates of 5 g of frozen liver samples were rotor-homogenized in 5 mL of 10% trichloroacetic acid (Sigma-Aldrich,
Milwaukee, WI, USA). The homogenate was centrifuged at 3000×g for 5 min at 4 °C (as for all subsequent
centrifugations), and the supernatant was collected. The above procedure was repeated with the first pellet, and
the resulting supernatant was added to the first one. An equal volume of 95% ethanol was added to the total
supernatant above, then vortexed and incubated overnight at room temperature for gravitational precipitation
of the glycogen, followed by centrifugation. The resulting glycogen pellet was further purified by adding 5 mL
of double-distilled H2O and 10 mL of 95% ethanol, followed by centrifugation. The pellet was next resuspended
in 3 mL of 95% ethanol and centrifuged. Finally, the pellet was resuspended in 3 mL of diethyl ether (Sigma-
Aldrich, Milwaukee, WI, USA), centrifuged again and the supernatant was discarded. The purified glycogen
pellet was oven-dried at 35 °C for 1 h to remove residual moisture. The glycogen weight was measured, and the
glycogen content was determined as the percentage of the wet liver weight. The average values of the duplicates
were used for further statistical analysis.
Plasma biochemical analysis. Plasma NEFA concentrations were determined enzymatically using the
NEFA kit (Wako Chemicals, GmbH, Neuss, Germany) according to the manufacture’s instruction. Plasma insu-
lin was analyzed by the radioimmunoassay insulin kit (Coat-A-Count insulin; Diagnostic Products, Los Angeles,
CA) according to the manufacturer’s instructions, where 1 IU = 0.0347 mg of human i nsulin53. This kit was previ-
ously validated for measurements of bovine, equine and canine54, as well as for ovine insulin55.
Leukocyte mRNA quantification. Blood was collected from all sheep on day 119 (one day before slaugh-
ter) into EDTA venipuncture tubes and kept on ice for immediate RNA extraction using the leukocyte RNA
purification kit (Norgen Biotek Corp., Ontario, Canada) according to the manufacturer’s instructions. DNAase
treatment was carried out using the RQ1 RNAase-Free DNase (Promega, Madison, WI, USA). Single-stranded
cDNA was synthesized using the Applied Biosystems 2,720 Thermal Cycler (Thermo Fisher Scientific, USA)
from 500 ng of total RNA using the Revert Aid RT-PCR Kit (Thermo Fisher Scientific, USA) with the provided
random hexamers and oligo(dT) primers, following the manufacturer’s instructions.
Real-time quantitative PCR (RT-qPCR) analysis was carried out on a Rotor gene Q instrument (Qiagen,
Hilden, Germany) using the 5 × HOT FIREPol EvaGreen qPCR Supermix (Solis BioDyne, Tartu, Estonia)
with GAPDH and YWHAZ as endogenous control (reference) genes. Gene-specific primers of the target genes
(Table S1) were designed to match exon-junctions using the NCBI primer blast server. The RT-qPCR reaction
was composed of 4 µL of cDNA, 0.3 µL of each gene-specific primer, 4 µL of 5 × HOT FIREPol EvaGreen qPCR
Supermix and completed to a final volume of 20 µL with ultra-pure water (Biological Industries, Kibbutz Beit
Haemek, Israel). The reaction program consisted of 12 min incubation at 95 °C and 40 cycles of 95 °C for 15 s,
60 °C for 20 s and 72 °C for 20 s. The geometric mean of the two endogenous reference genes was employed
to compute the relative gene expression using the ΔΔCT method56 with the mean of the LC treatment as the
normalizer.
Statistical analysis. All animals (N = 31) were treated as independent experimental units. Concentrations
of glucose, insulin, NEFA and triglycerides, weight, daily weight gain, in response to the treatments over time
were all analyzed as continuous dependent variables with repeated measures ANOVA using the linear mixed
models approach in JMP (Version 14.0.0, SAS Institute Inc., Cary, NC, 2018). The model included Treatment
(HC vs. LC) as a between-subjects fixed factor, Time (from treatment initiation) as a within-subject fixed fac-
tor, Treatment by Time interaction, and Individual Animal as a random factor nested within Treatment. The
distributions of the model residuals were visually confirmed for normality. The pretreatment values measured
for blood glucose and body weights were non-different between the groups (Tables 2, 4), and therefore were not
used as covariate factors in the analysis. Post-hoc pairwise comparisons at particular time points were made by
Student’s t-test and corrected for multiple hypotheses testing by the Bonferroni-Holm m ethod57. Differences
between treatments for variables in which Time was not considered, were also analyzed by Student’s t-tests.
Unless otherwise stated, data are summarized as means ± standard errors (SE). A significance level of α = 0.05
was employed. Two-tailed P-values are shown throughout. The stepwise regression analysis was carried out with
P < 0.1 as the threshold for the addition and P < 0.05 for the subtraction of an effect from the model.
Data availability
All the data supporting the findings of this study are available within the article and its Supplementary
Information.
Received: 22 January 2020; Accepted: 2 July 2020
References
1. Alves-Bezerra, M. & Cohen, D. E. Triglyceride metabolism in the liver. Compr. Physiol. 8, 1–8 (2017).
Scientific Reports | (2020) 10:12189 | https://doi.org/10.1038/s41598-020-68909-z 10
Vol:.(1234567890)www.nature.com/scientificreports/
2. Kawano, Y. & Cohen, D. E. Mechanisms of hepatic triglyceride accumulation in non-alcoholic fatty liver disease. J. Gastroenterol.
48, 434–441 (2013).
3. Cohen, J. C., Horton, J. D. & Hobbs, H. H. Human fatty liver disease: Old questions and new insights. Science 332, 1519–1523
(2011).
4. Fabbrini, E. et al. Intrahepatic fat, not visceral fat, is linked with metabolic complications of obesity. Proc. Natl. Acad. Sci. 106,
15430–15435 (2009).
5. Tilg, H., Moschen, A. R. & Roden, M. NAFLD and diabetes mellitus. Nat. Rev. Gastroenterol. Hepatol. 14, 32–42 (2017).
6. Mashek, D. G., Khan, S. A., Sathyanarayan, A., Ploeger, J. M. & Franklin, M. P. Hepatic lipid droplet biology: Getting to the root
of fatty liver. Hepatology 62, 964–967 (2015).
7. Gan, S. K. & Watts, G. F. Is adipose tissue lipolysis always an adaptive response to starvation?: implications for non-alcoholic fatty
liver disease. Clin. Sci. 114, 543–545 (2008).
8. White, H. The role of TCA cycle anaplerosis in ketosis and fatty liver in periparturient dairy cows. Animals 5, 793–802 (2015).
9. Herdt, T. H. Ruminant adaptation to negative energy balance. Vet. Clin. N. Am. Food Anim. Pract. 16, 215–230 (2000).
10. Lomonaco, R. et al. Effect of adipose tissue insulin resistance on metabolic parameters and liver histology in obese patients with
nonalcoholic fatty liver disease. Hepatology https://doi.org/10.1002/hep.25539 (2012).
11. Holt, H. B. et al. Non-esterified fatty acid concentrations are independently associated with hepatic steatosis in obese subjects.
Diabetologia 49, 141–148 (2006).
12. Steiner, J. & Lang, C. Alcohol, adipose tissue and lipid dysregulation. Biomolecules 7, 16 (2017).
13. Donnelly, K. L. et al. Sources of fatty acids stored in liver and secreted via lipoproteins in patients with nonalcoholic fatty liver
disease. J. Clin. Investig. 115, 1343–1351 (2005).
14. Vernon, R. G. Lipid metabolism during lactation: A review of adipose tissue-liver interactions and the development of fatty liver.
J. Dairy Res. 72, 460–469 (2005).
15. Frise, C. J., Mackillop, L., Joash, K. & Williamson, C. Starvation ketoacidosis in pregnancy. Eur. J. Obstet. Gynecol. Reprod. Biol.
167, 1–7 (2013).
16. Kalyesubula, M., Rosov, A., Alon, T., Moallem, U. & Dvir, H. Intravenous infusions of glycerol versus propylene glycol for the
regulation of negative energy balance in sheep: A randomized trial. Animals 9, 731 (2019).
17. Catunda, A. G. V. et al. Blood leptin, insulin and glucose concentrations in hair sheep raised in a tropical climate. Small Rumin.
Res. 114, 272–279 (2013).
18. Gastaldelli, A. et al. Importance of changes in adipose tissue insulin resistance to histological response during thiazolidinedione
treatment of patients with nonalcoholic steatohepatitis. Hepatology https://doi.org/10.1002/hep.23116 (2009).
19. Miller, D. W., Bennett, E. J., Harrison, J. L., Findlay, P. A. & Adam, C. L. Adiposity and plane of nutrition influence reproductive
neuroendocrine and appetite responses to intracerebroventricular insulin and neuropeptide-Y in sheep. Reprod. Fertil. Dev. 23,
329–338 (2011).
20. Gootwine, E. Meta-analysis of morphometric parameters of late-gestation fetal sheep developed under natural and artificial
constraints. J. Anim. Sci. 91, 111–119 (2013).
21. Jones, A. K. et al. Gestational restricted- and over-feeding promote maternal and offspring inflammatory responses that are distinct
and dependent on diet in sheep. Biol. Reprod. 98, 184–196 (2018).
22. Morohoshi, M., Fujisawa, K., Uchimura, I. & Numano, F. Glucose-dependent interleukin 6 and tumor necrosis factor production
by human peripheral blood monocytes in vitro. Diabetes 45, 954–959 (1996).
23. Gregor, M. F. & Hotamisligil, G. S. Inflammatory mechanisms in obesity. Annu. Rev. Immunol. 29, 415–445 (2011).
24. Shoelson, S. E. Inflammation and insulin resistance. J. Clin. Investig. 116, 1793–1801 (2006).
25. Yost, W. M., Young, J. W., Schmidt, S. P. & McGilliard, A. D. Gluconeogenesis in ruminants: propionic acid production from a
high-grain diet fed to cattle. J. Nutr. 107, 2036–2043 (1977).
26. Baldwin, R. L. & Allison, M. J. Rumen metabolism. J. Anim. Sci. 57, 461–473 (1983).
27. Huang, P. L. A comprehensive definition for metabolic syndrome. Dis. Model. Mech. 2, 231–237 (2009).
28. Helman, R. G., Adams, L. G. & Bridges, C. H. The lesions of hepatic fatty cirrhosis in sheep. Vet. Pathol. 32, 635–640 (1995).
29. Lee, L. et al. Nutritional model of steatohepatitis and metabolic syndrome in the Ossabaw miniature swine. Hepatology 50, 56–67
(2009).
30. De Brito, G. F., Ponnampalam, E. N. & Hopkins, D. L. The effect of extensive feeding systems on growth rate, carcass traits, and
meat quality of finishing lambs. Compr. Rev. Food Sci. Food Saf. 16, 23–38 (2017).
31. Postic, C., Dentin, R., Denechaud, P.-D. & Girard, J. ChREBP, a transcriptional regulator of glucose and lipid metabolism. Annu.
Rev. Nutr. 27, 179–192 (2007).
32. Horton, J. D., Goldstein, J. L. & Brown, M. S. SREBPs: Activators of the complete program of cholesterol and fatty acid synthesis
in the liver. J. Clin. Investig. https://doi.org/10.1172/JCI0215593 (2002).
33. Armentano, L. E. Ruminant hepatic metabolism of volatile fatty acids, lactate and pyruvate. J. Nutr. https: //doi.org/10.1093/jn/122.
suppl_3.838 (1992).
34. Brockman, R. P. Effect of insulin on the utilization of propionate in gluconeogenesis in sheep. Br. J. Nutr. 64, 95–101 (1990).
35. Weigand, E., Young, J. W. & McGilliard, A. D. Extent of butyrate metabolism by bovine ruminoreticulum epithelium and the
relationship to absorption rate. J. Dairy Sci. 55, 589–597 (1972).
36. Cook, R. M. & Miller, L. D. Utilization of volatile fatty acids in ruminants I Removal of them from portal blood by the liver. J.
Dairy Sci. 48, 1339–1345 (1965).
37. Petersen, M. C. & Shulman, G. I. Mechanisms of insulin action and insulin resistance. Physiol. Rev. 98, 2133–2223 (2018).
38. Petersen, K. F., Laurent, D., Rothman, D. L., Cline, G. W. & Shulman, G. I. Mechanism by which glucose and insulin inhibit net
hepatic glycogenolysis in humans. J. Clin. Investig. https://doi.org/10.1172/JCI579 (1998).
39. Avignon, A. et al. Chronic activation of protein kinase C in soleus muscles and other tissues of insulin-resistant type II diabetic
Goto-Kakizaki (GK), obese/aged, and obese/Zucker rats: A mechanism for inhibiting glycogen synthesis. Diabetes https://doi.
org/10.2337/diab.45.10.1396 (1996).
40. Ziegler, A., Gonzalez, L. & Blikslager, A. Large animal models: the key to translational discovery in digestive disease research. Cell.
Mol. Gastroenterol. Hepatol. 2, 716–724 (2016).
41. Ford, S. P. & Tuersunjiang, N. Maternal obesity: how big an impact does it have on offspring prenatally and during postnatal life?.
Expert Rev. Endocrinol. Metab. 8, 261–273 (2013).
42. del Valle, H. F., Lascano, E. C. & Negroni, J. A. Ischemic preconditioning protection against stunning in conscious diabetic sheep:
role of glucose, insulin, sarcolemmal and mitochondrial KATP channels. Cardiovasc. Res. 55, 642–659 (2002).
43. Gootwine, E., Reicher, S. & Rozov, A. Prolificacy and lamb survival at birth in Awassi and Assaf sheep carrying the FecB (Booroola)
mutation. Anim. Reprod. Sci. 108, 402–411 (2008).
44. Pichler, M. et al. Thresholds of whole-blood β-hydroxybutyrate and glucose concentrations measured with an electronic hand-held
device to identify ovine hyperketonemia. J. Dairy Sci. 97, 1388–1399 (2014).
45. Kenyon, P. R., Maloney, S. K. & Blache, D. Review of sheep body condition score in relation to production characteristics. N. Z. J.
Agric. Res. 57, 38–64 (2014).
Scientific Reports | (2020) 10:12189 | https://doi.org/10.1038/s41598-020-68909-z 11
Vol.:(0123456789)www.nature.com/scientificreports/
46. Chalasani, N. et al. The diagnosis and management of non-alcoholic fatty liver disease: Practice Guideline by the American Asso-
ciation for the Study of Liver Diseases, American College of Gastroenterology, and the American Gastroenterological Association.
Hepatology 55, 2005–2023 (2012).
47. Petäjä, E. & Yki-Järvinen, H. Definitions of Normal liver fat and the association of insulin sensitivity with acquired and genetic
NAFLD—a systematic review. Int. J. Mol. Sci. 17, 633 (2016).
48. Hoyumpa, A. M., Greene, H. L., Dunn, G. D. & Schenker, S. Fatty liver: biochemical and clinical considerations. Am. J. Dig. Dis.
20, 1142–1170 (1975).
49. Folch, J., Lees, M. & Stanley, G. H. S. A simple method for the isolation and purification of total lipids from animal tissues. J. Biol.
Chem. 226, 497–509 (1957).
50. Bligh, E. G. & Dyer, W. J. A rapid method of total lipid extraction and purification. Can. J. Biochem. Physiol. 37, 911–917 (1959).
51. Kleiner, D. E. et al. Design and validation of a histological scoring system for nonalcoholic fatty liver disease. Hepatology 41,
1313–1321 (2005).
52. Roe, J. H., Bailey, J. M., Gray, R. R. & Robinson, J. N. Complete removal of glycogen from tissues by extraction with cold trichlo-
roacetic acid solution. J. Biol. Chem. 236, 1244–1246 (1961).
53. Burns, C. et al. Proposal to initiate a project to evaluate a candidate International Standard for Human Recombinant Insulin.
(2010).
54. Reimers, T. J., Cowan, R. G., McCann, J. P. & Ross, M. W. Validation of a rapid solid-phase radioimmunoassay for canine, bovine,
and equine insulin. Am. J. Vet. Res. 43, 1274–1278 (1982).
55. McCann, J. P., Ullmann, M. B., Temple, M. R., Reimers, T. J. & Bergman, E. N. Insulin and glucose responses to glucose injection
in fed and fasted obese and lean sheep. J. Nutr. 116, 1287–1297 (1986).
56. Livak, K. J. & Schmittgen, T. D. Analysis of relative gene expression data using real- time quantitative PCR and the 2(-Delta Delta
C (T)) method. Methods 408, 402–408 (2001).
57. Holm, S. A simple sequentially rejective multiple test procedure. Scand. J. Stat. 6, 65–70 (1979).
Acknowledgements
We thank Hilary Voet from the Hebrew University for statistical advice and Elisha Gootwine from Volcani for
helpful discussions and experimental advice.
Author contributions
H.D. conceptualized the research, designed and supervised the experiments, analyzed the data, and wrote the
paper. M.K. performed animal and laboratory experiments, analyzed the data, and participated in the writing.
R.M. performed laboratory experiments, T.A. and A.R. participated in the animal experiments, N.E. histopatho-
logical analysis. U.M. experimental advice and manuscript revision.
Competing interests
The authors declare no competing interests.
Additional information
Supplementary information is available for this paper at https://doi.org/10.1038/s41598-020-68909-z.
Correspondence and requests for materials should be addressed to H.D.
Reprints and permissions information is available at www.nature.com/reprints.
Publisher’s note Springer Nature remains neutral with regard to jurisdictional claims in published maps and
institutional affiliations.
Open Access This article is licensed under a Creative Commons Attribution 4.0 International
License, which permits use, sharing, adaptation, distribution and reproduction in any medium or
format, as long as you give appropriate credit to the original author(s) and the source, provide a link to the
Creative Commons license, and indicate if changes were made. The images or other third party material in this
article are included in the article’s Creative Commons license, unless indicated otherwise in a credit line to the
material. If material is not included in the article’s Creative Commons license and your intended use is not
permitted by statutory regulation or exceeds the permitted use, you will need to obtain permission directly from
the copyright holder. To view a copy of this license, visit http://creativecommons.org/licenses/by/4.0/.
© The Author(s) 2020
Scientific Reports | (2020) 10:12189 | https://doi.org/10.1038/s41598-020-68909-z 12
Vol:.(1234567890)You can also read