Resting metabolic rate of obese patients under very low calorie ketogenic diet
←
→
Page content transcription
If your browser does not render page correctly, please read the page content below
Gomez-Arbelaez et al. Nutrition & Metabolism (2018) 15:18
DOI 10.1186/s12986-018-0249-z

 RESEARCH                                                                                                                                         Open Access

Resting metabolic rate of obese patients
under very low calorie ketogenic diet
Diego Gomez-Arbelaez1†, Ana B. Crujeiras1,5† , Ana I. Castro1,5, Miguel A. Martinez-Olmos1,5, Ana Canton1,5,
Lucia Ordoñez-Mayan1, Ignacio Sajoux2, Cristobal Galban3, Diego Bellido4 and Felipe F. Casanueva1,5*

  Abstract
  Background: The resting metabolic rate (RMR) decrease, observed after an obesity reduction therapy is a determinant
  of a short-time weight regain. Thus, the objective of this study was to evaluate changes in RMR, and the associated
  hormonal alterations in obese patients with a very low-calorie ketogenic (VLCK)-diet induced severe body weight
  (BW) loss.
  Method: From 20 obese patients who lost 20.2 kg of BW after a 4-months VLCK-diet, blood samples and body
  composition analysis, determined by DXA and MF-Bioimpedance, and RMR by indirect calorimetry, were obtained
  on four subsequent visits: visit C-1, basal, initial fat mass (FM) and free fat mass (FFM); visit C-2, − 7.2 kg in FM, − 4.
  3 kg in FFM, maximal ketosis; visit C-3, − 14.4 kg FM, − 4.5 kg FFM, low ketosis; visit C-4, − 16.5 kg FM, − 3.8 kg FFM, no
  ketosis. Each subject acted as his own control.
  Results: Despite the large BW reduction, measured RMR varied from basal visit C-1 to visit C-2, − 1.0%; visit C-3, − 2.4%
  and visit C-4, − 8.0%, without statistical significance. No metabolic adaptation was observed. The absent reduction in
  RMR was not due to increased sympathetic tone, as thyroid hormones, catecholamines, and leptin were reduced at
  any visit from baseline. Under regression analysis FFM, adjusted by levels of ketonic bodies, was the only predictor of
  the RMR changes (R2 = 0.36; p < 0.001).
  Conclusion: The rapid and sustained weight and FM loss induced by VLCK-diet in obese subjects did not induce the
  expected reduction in RMR, probably due to the preservation of lean mass.
  Trial registration: This is a follow up study on a published clinical trial.
  Keywords: Ketogenic diet, Very low-energy diet, Pronokal method, Protein diet, Obesity, Metabolic adaptation, Energy
  expenditure, Indirect calorimetry, DXA, Multifrequency BIA

Background                                                                             defined as a decrease in RMR out of proportion to the de-
It is widely accepted that during periods of energy deficit                            crease in body mass [5, 12]. Various groups have observed
or restriction (eg., weight-loss diets), the human body                                this phenomenon during obesity treatments independ-
tends to diminish energy expenditure by increasing the ef-                             ently of the strategy employed, including diet, exercise,
ficiency in its use and by decreasing the resting metabolic                            diet plus exercise, pharmacologic treatments, and surgical
rate (RMR) [18]. This phenomenon of metabolic adapta-                                  interventions, and suggest that metabolic adaptation pre-
tion to weight reduction is called adaptive thermogenesis,                             disposes weight reduced obese patients to weight regain.
                                                                                         Published research has shown that a very low calorie
                                                                                       ketogenic (VLCK)-diet was able to induce a significant
* Correspondence: endocrine@usc.es
†
 Equal contributors                                                                    weight loss and maintained their efficacy along 2 years
1
 Division of Endocrinology, Department of Medicine, Molecular and Cellular             [10, 11]. Because VLCK-diets target body fat mass (FM)
Endocrinology Area, Complejo Hospitalario Universitario de Santiago (CHUS),            with little reduction in fat free mass (FFM) [6], the
Instituto de Investigación Sanitaria de Santiago (IDIS), Travesia da Choupana
street s/n, 15706 Santiago de Compostela, La Coruña, Spain                             working hypothesis was that VLCK-diet may induce a
5
 CIBER de Fisiopatologia de la Obesidad y Nutricion (CIBERobn), Instituto              minor or null reduction in the RMR, thus preventing
Salud Carlos III, Santiago de Compostela, Spain                                        body weight regain.
Full list of author information is available at the end of the article

                                         © The Author(s). 2018 Open Access This article is distributed under the terms of the Creative Commons Attribution 4.0
                                         International License (http://creativecommons.org/licenses/by/4.0/), which permits unrestricted use, distribution, and
                                         reproduction in any medium, provided you give appropriate credit to the original author(s) and the source, provide a link to
                                         the Creative Commons license, and indicate if changes were made. The Creative Commons Public Domain Dedication waiver
                                         (http://creativecommons.org/publicdomain/zero/1.0/) applies to the data made available in this article, unless otherwise stated.
Gomez-Arbelaez et al. Nutrition & Metabolism (2018) 15:18 Page 2 of 10
The main target of this study was to observe the changes The weight loss program has five steps (Additional file 1:
in RMR induced by a VLCK-diet in obese subjects, as well Figure S1) and adheres to the most recent guidelines of
as the hormonal and metabolic alterations associated with 2015 European Food Safety Authority (EFSA) on total car-
that change. bohydrates intake [3]. The first three steps consist of a
VLCK diet (600–800 kcal/day), low in carbohydrates (<
Methods 50 g daily from vegetables) and lipids (only 10 g of olive
Study population oil per day). The amount of high-biological-value proteins
This is a follow up study on a published clinical trial [6]. ranged between 0.8 and 1.2 g per each kg of ideal body
It was an open, uncontrolled, nutritional intervention weight, to ensure patients were meeting their minimal
clinical trial conducted for 4 months, and performed in body requirements and to prevent the loss of lean mass.
a single center. In step 1, the patients ate high-biological-value protein
The patients attending the Obesity Unit at the Complejo preparations five times a day, and vegetables with low gly-
Hospitalario Universitario of Santiago de Compostela, cemic indexes. In step 2, one of the protein servings was
Spain to receive treatment for obesity were consecu- substituted by a natural protein (e.g., meat or fish) either
tively invited to participate in this study. at lunch or at dinner. In step 3, a second serving of low fat
The inclusion criteria were, age 18 to 65 years, body natural protein was substituted for the second serving of
mass index (BMI) ≥30 kg/m2, stable body weight in the biological protein preparation. Throughout these keto-
previous 3 months, desire to lose weight, and a history genic phases, supplements of vitamins and minerals sup-
of failed dietary efforts. The main exclusion criteria were, plements, such as K, Na, Mg, Ca, and omega-3 fatty acids,
diabetes mellitus, obesity induced by other endocrine dis- were provided in accordance to international recommen-
orders or by drugs, and participation in any active weight dations [22]. These three steps were maintained until the
loss program in the previous 3 months. In addition, those patient lost the target amount of weight, ideally 80%.
patients with previous bariatric surgery, known or sus- Hence, the ketogenic steps were variable in time depend-
pected abuse of narcotics or alcohol, severe depression or ing on the individual and the weight loss target.
any other psychiatric disease, severe hepatic insufficiency, In steps 4 and 5, the ketogenic phases were ended by
any type of renal insufficiency or gouts episodes, nephro- the physician in charge of the patient based on the amount
lithiasis, neoplasia, previous events of cardiovascular or of weight lost, and the patient started a low-calorie diet
cerebrovascular disease, uncontrolled hypertension, ortho- (800–1500 kcal/day). At this point, the patients underwent
static hypotension, and hydroelectrolytic or electrocardio- a progressive incorporation of different food groups and
graphic alterations, were excluded. Females who were participated in a program of alimentary re-education to
pregnant, breast-feeding, or intending to become preg- guarantee the long-term maintenance of the weight loss.
nant, and those with child-bearing potential and not using The maintenance diet, consisted of an eating plan balanced
adequate contraceptive methods, were also excluded. in carbohydrates, protein, and fat. Depending on the indi-
Apart from obesity and metabolic syndrome, participants vidual the calories consumed ranged between 1500 and
were generally healthy individuals. 2000 kcal/day, and the target was to maintain the weight
The study protocol was in accordance with the Declar- lost and promote healthy life styles.
ation of Helsinki and was approved by the Ethics Com- During this study, the patients followed the different
mittee for Clinical Research of Galicia, Santiago de steps of the method until they reach the target weight or
Compostela, Spain (registry 2010/119). Participants gave up to a maximum of 4 months of follow-up, although
informed consent before any intervention related to the patients remained under medical supervision for the fol-
study. Participants received no monetary incentive. lowing months.
Nutritional intervention Schedule of visits
All the patients followed a VLCK diet according to a Throughout the study, the patients completed a max-
commercial weight loss program (PNK method®), which imum of 10 visits with the research team (every 15 ±
includes lifestyle and behavioral modification support. 2 days), of which four were for a complete (C) physical,
The intervention included an evaluation by the specialist anthropometric and biochemical assessment, and the
physician conducting the study, an assessment by an expert remaining visits were to control adherence and evalu-
dietician, and exercise recommendations. This method is ation of potential side effects. The four complete visits
based on a high-biological-value protein preparations ob- were made according to the evolution of each patient
tained from cow milk, soya, avian eggs, green peas and through the steps of ketosis as follows: visit C-1 (baseline),
cereals. Each protein preparation contained 15 g protein, normal level of ketone bodies; visit C-2, maximum ketosis
4 g carbohydrates, 3 g fat, and 50 mg docohexaenoic acid, (approximately 1–2 months of treatment); visit C-3, reduc-
and provided 90–100 kcal. tion of ketosis because of partial reintroduction of normalGomez-Arbelaez et al. Nutrition & Metabolism (2018) 15:18 Page 3 of 10
nutrition (2–3 months); visit C-4 at 4 months, no ketosis body composition (bone mineral density, lean body mass
(Additional file 1: Figure S1 and Fig. 1a). The total ketosis and fat mass) was determined, and then rested in sitting
state lasted for 60–90 days only. In all the visits, patients position in a quiet and darkened room for a further 15 min
received dietary instructions, individual supportive counsel, before the test.
and encouragement to exercise on a regular basis using Test-re-test validation was performed and after rest-
a formal exercise program. Additionally, a program of ing, oxygen consumption was measured continuously
telephone reinforcement calls was instituted, and a phone for 15 min under thermo-neutral conditions, and the
number was provided to all participants to address any final 10 min of data were used to calculate RMR. The
concern. FitMate uses a turbine flow meter for measuring ventilation
and a galvanic fuel cell oxygen sensor for determining the
Anthropometric assessment fraction of oxygen in expired gases. Moreover, it has sensors
All anthropometric measurements were undertaken after for the measurement of temperature, humidity, and baro-
an overnight fast (8 to 10 h), under resting conditions, metric pressure for use in internal calculations. The Fit-
in duplicate, and performed by well-trained health Mate uses standard metabolic formulas to estimate oxygen
workers. Participant’s body weights were measured to the consumption, and RMR is calculated using a predeter-
nearest 0.1 kg on the same calibrated electronic device mined respiratory quotient (RQ) of 0.85. During the meas-
(Seca 220 scale, Medical Resources, EPI Inc. OH, USA), in urement period, participants remained sitting, breathed
underwear and without shoes. BMI was calculated by div- normally, and were instructed to remain awake, and to
iding body weight in kilograms by the square of height in avoid talking, fidgeting and hyperventilating. The reliability
meters (BMI = weight (kg)/height2 (m). of measuring RMR with Cosmed’s FitMate metabolic
system have been determined in several previous stud-
Resting metabolic rate ies [9, 15, 21], and by in house controls (Additional file 2:
The RMR was measured by indirect calorimetry using a Figure S2).
portable desktop metabolic system (FitMate PRO, Cosmed, For the purposes of this study measured RMR or the
Rome, Italy) and under overnight fasting conditions. Partic- crude values provided by the method were obtained and
ipants were instructed to arrive at the hospital by car, to expected-RMR was defined as the variation in energy
minimize vigorous physical activity during the 24 h prior to expenditure that could be explained by the observed
the measurement, and to avoid drinking caffeinated bever- changes in fat-free mass (FFM), because FFM is the
ages for at least 12 h before testing. All participants rested main determinant of RMR [13]. Firstly, we determined
supine for at least 20 min. During this resting time, the the basal energy equivalence per kilogram of FFM in our
Fig. 1 Ketone bodies (a) and body composition (b) during the study. The broken line represents the level at which the existence of ketosis is
defined.aP < 0.05 compared with Visit C-1; bP < 0.05 compared with Visit C-2; cP < 0.05 compared with Visit C-3 (Repeated measures ANOVA with
Tukey’s adjustment for multiple comparisons). β-OHB: β-hydroxy-butyrateGomez-Arbelaez et al. Nutrition & Metabolism (2018) 15:18 Page 4 of 10
study population. Then, this quotient was multiplied by Determination of levels of ketone bodies
the amount of change in FFM between the baseline and Ketosis was determined by measuring ketone bodies, spe-
each subsequent complete visit. Finally, this product was cifically β-hydroxy-butyrate (β-OHB), in capillary blood by
added to the basal measured RMR, and in this way the using a portable meter (GlucoMen LX Sensor, A. Menarini
expected RMR for each complete visit was obtained. Diagnostics, Neuss, Germany). As with anthropometric as-
This process is summarized by the following equation: sessments, all the determinations of capillary ketonemia
were made after an overnight fast of 8 to 10 h. These mea-
surements were performed daily by each patient during the
RMR expected ¼ RMR measuredBaseline
entire VLCK diet, and the corresponding values were
þ½ðRMR measuredBaseline =FFMBaseline Þ reviewed on the machine memory by the research team in
XΔFFMVisit‐Baseline : order to control adherence. Additionally, β-OHB levels
were determined at each visit by the physician in charge
of the patient. The measurements reported as “low value”
On the other hand, metabolic adaptation has been de- (< 0.2 mmol/l) by the meter were assumed as to be zero
scribed as the change in RMR not explained by changes in for the purposes of statistical analyses.
FFM [8, 19], and is calculated as the difference between
RMR measured at each complete visit and the expected Biochemical parameters
RMR for that visit i.e., Metabolic adaptation = RMR mea- During the study all the patients were strictly monitored
sured – RMR expected. with a wide range of biochemical analyses. However, for
the purposes of this work only certain values are reported.
Total body composition Serum tests for total proteins, albumin, prealbumin,
Body composition was first measured by dual-energy X-ray retinol-binding protein, red cell and white cells counts,
absorptiometry (DXA; GE Healthcare Lunar, Madison, uric acid, urea, creatinine and urine urea were performed
USA).Daily quality control scans were acquired during the using an automated chemistry analyzer (Dimension EXL
study period. No hardware or software changes were made with LM Integrated Chemistry System, Siemens Medical
during the course of the trial. Subjects were scanned using Solutions Inc., USA).Thyroid-stimulating hormone (TSH),
standard imaging and positioning protocols, while wearing free thyroxine (FT4), and free triiodothyronine (FT3)
only light clothing. For this study, the values of bone were measured by chemiluminescence using ADVIA
mineral density, lean body mass and FM that were dir- Centaur (Bayer Diagnostics, Tarrytown, NY, USA). All
ectly measured by the GE Lunar Body Composition the biochemical parameters were measured at the 4
Software option. Some derivative values, such as bone complete visits.
mineral content, regional lean mass, FFM, and fat mass The overnight fasting plasma levels of leptin were mea-
percentage (FM%), were also calculated. sured using commercially available ELISA kits (Millipore,
MA, USA). The fasting plasma levels of fractionated cate-
cholamines (dopamine, adrenaline and noradrenaline) were
Multifrequency bioelectrical impedance tested by high pressure liquid chromatography (HPLC;
Multifrequency bioelectrical impedance (MF–BiA) was Reference Laboratory, Barcelona, Spain).
also used for determining body composition. FM, FM%,
FFM, total body water, intra- and extracellular water, and Statistical analysis
skeletal muscle mass, were calculated with In Body 720 The data are presented as means (standard deviation).
(In Body 720, Biospace Inc.,Tokyo, Japan). This technology Each subject acted as his own control (baseline visit).
is non-invasive and uses eight contact electrodes, which The sample size of the current trial was calculated taking
are positioned on the palm and thumb of each hand and the weight loss after treatment (main variable) into ac-
on the front part of the feet and on the heels. count. It was calculated for an effect size ≥15 kg, and a
Multifrequency bioelectrical impedance uses the body’s α = 0.05, and a power (1-β) of 90%. Thus, the sample size
electrical properties and the opposition to the flow of an was established at a minimum of 19 volunteers who fin-
electric current by different body tissues. The analyzer ished the nutritional treatment. The sample size pro-
measures resistance at specific frequencies (1, 5, 50, 250, vided sufficient power to test for effects on a number of
500 and 1000 kHz) and reactance at specific frequencies other metabolic variables of interest.
(5, 50, and 250 kHz). The participants were examined All statistical analyses were carried out using Stata stat-
lightly dressed, and the examination took less than istical software, release 12.0 (Stata Corporation, College
2 min and required only a standing position. The valid- Station, TX, USA). A p < 0.05 was considered statistically
ity of this technology has been documented in previous significant. Changes in the different variables of interest
studies [6]. from the baseline and throughout the study visits wereGomez-Arbelaez et al. Nutrition & Metabolism (2018) 15:18 Page 5 of 10
analyzed following a repeated measures design. A repeated Although the patients underwent a total of 10 visits, the
measures analysis of variance (ANOVA) test was used to RMR and body composition analyses were synchronized
evaluate differences between different measurement times, with the ketone levels in four visits (Fig. 1a). Visit C-1 was
followed by post hoc analysis with Tukey’s adjustment for the baseline visit, before starting the diet and with no keto-
multiple comparisons. In addition, multivariate linear re- sis (0.0 ± 0.1 mmol/L) and initial weight. Visit C-2 was at
gression models were fitted to assess the potential predict- the time of maximum level of ketosis (1.0 ± 0.6 mmol/L)
ive factors of RMR at each complete visit. The regression with 11.7 kg of BW loss. At visit C-3 (after 89.7 ± 19.1 days
models included fat-free mass, FT3, catecholamines (i.e. of VLCK), patients started the return to a normal diet and
noradrenaline, adrenaline and dopamine), leptin and showed a reduction in ketone levels (0.7 ± 0.5 mmol/L)
β-OHB as plausible determinants of RMR. with 19.3 kg of BW loss. Finally, at visit C-4 the patients
were out of ketosis (0.2 ± 0.1 mmol/L) with a total of
20.8 kg of weight lost (Table 1 and Fig. 1).
Results Most of the initial BW loss was in the form of fat mass
Twenty obese patients, 12 females, age from 18 to 58 years (FM) with a minor reduction in fat free mass (FFA). The
(47.2 ± 10.2 yr) completed the study. Participants at base- reduction in kg for FM and FFM respectively from base-
line have a BMI of 35.5 ± 4.4 and body weight (BW) of line were; visit C-2 7.2 kg and 4.3 kg; visit C-3 14.4 kg and
95.9 ± 16.3 kg, 45.6 ± 5.4% of which was fat. Other baseline 4.5 kg; visit C-4 16.5 kg and 3.8 kg. (Table 1, Fig. 1b).
characteristics and their corresponding changes during The measured RMR was not significantly different from
the study are presented in Tables 1 and 2, and have also the baseline at any time during the study, although a
been previously reported [6]. downward trend in these values was observed (Fig. 2a).
Table 1 Changes in anthropometry, energy expenditure and ketone bodies during the study
VLCK diet LC diet
Visit C-1 Visit C-2 Visit C-3 Visit C-4
Diet time (days) 39.2 ± 8.4 89.7 ± 19.1 123.3 ± 17.6
Anthropometry
Weight (kg) 95.9 ± 16.3 84.2 ± 13.0a 76.6 ± 11.1a,b 75.1 ± 11.8a,b
Weight change (kg) −11.7 ± 3.7d − 19.3 ± 6.4d − 20.7 ± 6.9d
Weight change (%) −12.0 ± 2.0 d
− 19.7 ± 4.0 d
− 21.3 ± 4.8d
Body mass index (kg/m2) 35.5 ± 4.4 31.2 ± 3.3a 28.4 ± 2.6a,b 27.8 ± 2.9a,b
a a,b
Body fat DXA (%) 45.6 ± 5.4 43.1 ± 6.1 37.9 ± 5.8 35.7 ± 5.9a,b,c
Fat mass DXA (kg) 42.2 ± 9.1 35.0 ± 7.8a 27.8 ± 5.7a,b 25.7 ± 5.8a,b
a a
Fat-free mass DXA (kg) 52.8 ± 10.2 48.5 ± 9.2 48.3 ± 9.1 49.0 ± 9.7a
Muscle mass MF-BIA (kg) 31.2 ± 6.6 29.3 ± 6.4a 29.4 ± 6.3a 29.6 ± 6.6a
Energy expenditure
RMR-measured (kcal/d) 1978.1 ± 415.7 1913.1 ± 317.2ns 1860.3 ± 341.9ns 1776.6 ± 309.3ns
RMR-measured change (kcal/d) −65.0 ± 343.7 ns
− 117.8 ± 489.3 ns
−201.5 ± 313.5ns
RMR-measured change (%) −1.0 ± 18.8ns −2.4 ± 25.6ns −8.3 ± 15.0ns
RMR-expected FFM-DXA (kcal/d) 1820.2 ± 379.9 1811.1 ± 369.4 1837.7 ± 389.3
Metabolic adaptation FFM-DXA (kcal/d) 92.8 ± 339.5 ns
49.1 ± 470.5 ns
−61.0 ± 298.9ns
ns ns
RMR/Fat-free mass DXA (kcal/d/kg) 37.6 ± 5.5 40.1 ± 7.6 39.3 ± 8.7 36.5 ± 4.6ns
RMR-expected MM-MF-BIA (kcal/d) 1856.1 ± 409.0 1863.1 ± 402.8 1873.6 ± 410.8
Metabolic adaptation MM-MF-BIA (kcal/d) 56.9 ± 355.0ns −2.8 ± 504.4ns −96.9 ± 320.8ns
RMR/Muscle mass MF-BIA (kcal/d/kg) 63.9 ± 10.5 66.9 ± 13.2ns 65.1 ± 15.2ns 60.9 ± 8.3ns
Ketone bodies
β-OHB 0.0 ± 0.1 1.0 ± 0.6a 0.7 ± 0.5a,b 0.2 ± 0.1b,c
Data are presented as mean ± standard deviation. RMR: resting metabolic rate; FFM: fat-free mass; MM: muscle mass; β-OHB: β-hydroxy-butyrate
RMR-expected = RMR-measured Baseline – ((RMR-measured Baseline/Fat-free mass Baseline) X Δ Fat-free mass Visit-Baseline)
Metabolic adaptation = RMR-measured – RMR-expected
a
P < 0.05 compared with Visit C-1; bP < 0.05 compared with Visit C-2; cP < 0.05 compared with Visit C-3 (Repeated measures ANOVA with Tukey’s adjustment for
multiple comparisons); dP < 0.05 weight change significantly different from zero (Student’s t-test); ns: not significantGomez-Arbelaez et al. Nutrition & Metabolism (2018) 15:18 Page 6 of 10
Table 2 Biochemical measurements during the study
VLCK diet LC diet
Visit C-1 Visit C-2 Visit C-3 Visit C-4
Protein status
Total proteins (g/dl) 7.2 ± 0.4 7.2 ± 0.4 7.1 ± 0.4 7.0 ± 0.4
Albumin (g/dl) 3.8 ± 0.2 4.1 ± 0.1a 3.9 ± 0.1a,b 3.8 ± 0.2b
Prealbumin (mg/dl) 26.6 ± 3.7 19.4 ± 3.2a 20.6 ± 3.5a 24.0 ± 3.6a,b,c
a a
Retinol-binding protein (mg/dl) 4.7 ± 0.9 3.3 ± 0.7 3.5 ± 0.7 4.1 ± 0.7a,b,c
Lymphocytes (× 103/μl) 1.9 ± 0.4 1.4 ± 0.5a 1.6 ± 0.5a 1.8 ± 0.5b
Renal function
Serum uric acid (mg/dl) 5.1 ± 1.1 5.4 ± 0.9 5.4 ± 0.8 5.0 ± 0.8
Blood urea (mg/dl) 34.3 ± 10.0 26.3 ± 6.1a 34.1 ± 7.8b 33.1 ± 8.5b
Creatinine (mg/dl) 0.6 ± 0.1 0.6 ± 0.1 0.6 ± 0.1 0.6 ± 0.1
Glomerular filtration rate (ml/min/1,73 m2) 129.7 ± 65.3 128.4 ± 46.5 118.6 ± 35.6 110.2 ± 24.2
Nitrogen balance
Urine urea (g/day) 27.4 ± 9.7 23.4 ± 5.2 31.3 ± 8.2b 33.2 ± 7.7a,b
Urine urea nitrogen (g/day) 12.8 ± 4.5 10.9 ± 2.4 14.6 ± 3.8b 15.5 ± 3.6a,b
Protein intake (g nitrogen/day)* – 12 16.8 16.8
Nitrogen balance – 1.0 ± 2.4 2.1 ± 3.8 1.2 ± 3.6
Data are presented as mean ± standard deviation.*Refers to the amount of proteins prescribed in each step of the diet. aP < 0.05 compared with Visit C-1; bP < 0.05
compared with Visit C-2; cP < 0.05 compared with Visit C-3 (Repeated measures ANOVA with Tukey’s adjustment for multiple comparisons)
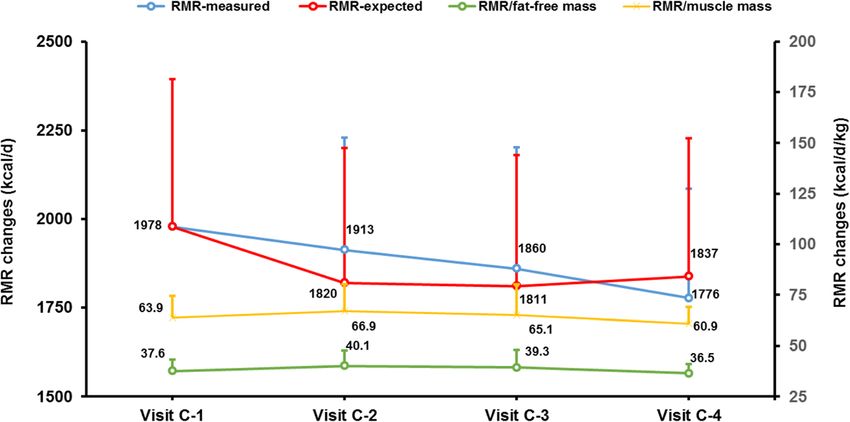
Compared to the baseline, at visits C-2, C-3 and C-4 the measured RMR was 61.0 ± 298.9 kcal/d lower than the ex-
measured RMR varied − 1.0 ± 18.8%, − 2.4 ± 25.6% and − pected RMR. None of the differences between the mea-
8.3 ± 15.0%, respectively. sured and expected RMR was statistically different (Fig. 2
To investigate how much of the mild and non-significant and Table 1), indicating that the phenomenon of metabolic
decrease in RMR could be accounted for by FFM change, adaptation was not present.
we used the baseline RMR data to generate an equation for The observation that the VLCK-diet preserved the RMR
calculating the expected-RMR in accordance with varia- in accordance to variations in FFM, thus avoiding the
tions in FFM (Table 1). The difference between the mea- metabolic adaptation was reinforced by the maintenance
sured and expected RMR defined the degree of metabolic of the RMR/FFM quotient during the study (Table 1
adaptation. At visit C-2 (maximum ketosis), the measured and Fig. 2). When, muscle mass evaluated by MF-BiA
RMR was 92.8 ± 339.5 kcal/d higher than expected RMR. was employed in the analysis, instead of DXA, results
At visit C-3, the measured RMR was 49.1 ± 470.5 kcal/d on the expected and observed RMR were similar
greater than expected RMR. Finally, at visit C-4, the (Table 1 and Fig. 2).
Fig. 2 Resting metabolic rate (RMR) changes during the study. RMR-expected refers to the change in energy expenditure explained by changes
in free fat mass (FFM) or muscle mass. Statistical analysis was performed by repeated measures ANOVA with Tukey’s adjustment for multiple comparisons)Gomez-Arbelaez et al. Nutrition & Metabolism (2018) 15:18 Page 7 of 10
The concern regarding the possible preservation of the
RMR as a consequence of the presence of stressing fac-
tors induced by the VLCK-diet and the rapid weight loss
was focused by a strict analysis of the protein metabolism.
Although there were some differences in protein status,
renal function and nitrogen balance-related parameters,
none of them was considered as clinically relevant (Table 2).
It is noteworthy that despite the considerable weight loss
induced by the VLCK-diet, there was a positive nitrogen
balance throughout the entire study. At visit C-2, the posi-
tive nitrogen balance was 1.0 ± 2.4, while at visits C-2 and
C-3 it was 2.1 ± 3.8 and 1.2 ± 3.6, respectively. It was not
possible to calculate the nitrogen balance at baseline since
the protein intake was not assessed at that visit.
Besides the FFM, that is considered the major contribut-
ing factor, several variables have been described as positive
determinants of the RMR, including thyroid hormones,
catecholamines, leptin and ketone bodies. In this study,
the level of influence of these mentioned factors on the
measured RMR was determined during the study. As Fig. 3
shows TSH and free T4 did not significantly change, free
T3 had a significant although expected decrease at visit C-
2, and thereafter. Adrenaline and dopamine did not sig-
nificantly change during the study, but noradrenaline had
a progressive decrease in their plasma levels that reached
significant differences at visit C-4. Similarly, leptin values
were severely reduced at visit 2, 3 and 4 in accordance
with the FM reduction.
Linear regression models reveals that when adjusted
by β-OHB, FFM was the best predictor of RMR (coefficient
β = 20–31; p < 0.05, Table 3) explaining more than 40% of
the variability of RMR (see Additional file 3: Table S1). Fig. 3 Thyroid hormones (a), Catecholamines (b) and Leptin (c)
levels during the study. a Changes in Thyroid Hormones; b. Changes in
Catecholamines; and c. Changes in Leptin. FT3: free triiodothyronine;
Discussion FT4: tyroxine. aP < 0.05 compared with Visit C-1; bP < 0.05 compared
To the best of our knowledge this study is the first asses- with Visit C-2; cP < 0.05 compared with Visit C-3 (Repeated measures
sing the effect of VLCK-diet on the RMR of obese pa- ANOVA with Tukey’s adjustment for multiple comparisons)
tients. The main findings of this work were: 1) the rapid
and sustained weight reduction induced by the VLCK-
diet did not induce the expected drop in RMR, 2) this component of total energy expenditure, being responsible
observation was not due to a sympathetic tone counter- for about 75% of daily total energy expenditure in Western
action through the increase of either catecholamines, societies [1, 16]. Therefore any RMR reduction after treat-
leptin or thyroid hormones, 3) the most plausible cause ment, translates in a large impact on energy balance, mak-
of the null reduction of RMR is the preservation of lean ing subjects more prone to weight regain over time [17].
mass (muscle mass) observed with this type of diet. This phenomenon was called metabolic adaptation or adap-
The greatest challenge in obesity treatment is to avoid tive thermogenesis, indicating that RMR is reduced after
weight recovery sometime after the previous reduction. weight loss, and furthermore that this reduction is usually
In fact, after one or few years the most obese patients re- larger than expected or out of proportion with the decrease
cover or even increase their weight, previously reduced by in fat or fat free mass [2].Therefore, preservation of initial
either, dietetic, pharmacological or behavioral treatments RMR after weight loss could play a critical role in facilitat-
[8], bariatric surgery being the only likely exception [7]. ing further weight loss and preventing weight regain in the
Since obesity reduction is accompanied by a slowing of long-term [4].
energy expenditure in sedentary individuals, mostly RMR, We have observed that the obesity-reduction by a VLCK-
this fact has been blamed for this negative outcome of the diet (Pnk method ®) was maintained 1 and 2 years after its
diet-based treatments [12]. RMR is recognized as the major completion [10, 11]. Although that follow up was not longGomez-Arbelaez et al. Nutrition & Metabolism (2018) 15:18 Page 8 of 10
Table 3 Independent effects of fat-free mass and β-hydroxy-butyrate on resting metabolic rate at each visit
Regression equations Corrected R2 Coefficients B 95% CI P Value
Visit C-1
Fat-free mass – 30.7 18.4–43.0 < 0.001
B-hydroxy-butyrate – − 791.7 − 1925.6 – 342.2 0.159
0.64 < 0.001
Visit C-2
Fat-free mass – 20.0 6.0–34.0 0.008
β-hydroxy-butyrate – 183.1 − 23.1 – 389.3 0.078
0.38 0.015
Visit C-3
Fat-free mass – 14.8 −3.5 – 33.3 0.108
β-hydroxy-butyrate – 146.2 − 172.4 – 464.9 0.346
0.15 0.239
Visit C-4
Fat-free mass – 25.1 14.3–35.8 < 0.001
β-hydroxy-butyrate – 9.9 − 586.5 – 606.3 0.972
0.62 < 0.001
95% CI: 95% confidence interval. Multivariate regression analysis
enough, the finding may be of particular importance for before any change in body weight [8]. On the other hand,
long-term effects. The present work shows that in a group leptin positively has been associated with sympathetic ner-
of obese patients treated with a VLCK-diet, the RMR was vous system activity in humans, and weight loss associated
relatively preserved, remaining within the expected limits changes in RMR and fat oxidation were previously related
for the variations in FFM, and avoided the metabolic to leptin levels changes [25]. If leptin is sensitive to the
adaptation phenomenon. Because FFM includes total energy flux and activate the autonomic nervous system,
body water, bone minerals and protein [14], the results the absence of metabolic adaptation here observed could
were corroborated by analyzing the FFM without bone be due to a leptin increase, or maintenance in the basal
minerals and total body water (muscle mass). levels. However, in this work, leptin levels decreased in
As the mechanisms supporting the metabolic adapta- accordance to the weight reduction.
tion phenomenon are not known, unraveling the reasons Then, an expected increase in thyroid hormones, cate-
behind the present findings is challenging enough in itself. cholamines, or leptin levels was discarded as explanation
Changes in any circulating hormone that participate in for the observed minor or absent reduction in RMR. This
thermogenesis could be the explanation for the absence of was also endorsed by the undertook multiple regression
a reduction in RMR, for example a concomitant increase in analysis (Table 3). In this analysis only the FFM (DXA) or
the sympathetic system activity, either directly or indirectly. the muscle mass (MF-BIA) appear as a plausible explan-
An increase in thyroid hormones generated by the VLCK- ation for the maintenance of RMR activity. In fact, a clear
diet was discarded because free T3 experienced the well preservation of FFM was reported in obese subjects on
described reduction after losing weight [20, 24] without VLCK-diet, in whom 20 kg reduction after 4 months of
alterations in free T4 or TSH. As thermogenesis in humans treatment was accompanied by less than 1 kg of muscle
is largely a function of the sympathetic nervous system ac- mass lost [6]. The assumption of muscle mass preserva-
tivity, and that activity decreases in response to weight loss tion is also supported by the data on kidney function
the results here reported may be the net result of a main- (Table 2) which shows that not only was renal activity not
tenance or relative increase in the plasma catecholamine altered as reported in other studies [23] but that even the
levels. However, it was found that adrenaline and dopamine nitrogen balance was positive.
remained unchanged throughout the study, while nor- The strength of this study is its longitudinal design,
adrenaline decreased considerably discarding their con- which allows the evaluation of the time-course of changes
tribution to any increase in the activity of the autonomic of RMR during a VLCK diet, by comparing each subject
nervous system. Leptin experienced a rapid decline in cir- to himself, as his own control. The scarce number of sub-
culation in situations of weight reduction, although the re- jects and the short duration of this study might be a limi-
duction is observed in energy restriction states it occurs tation, since one cannot make claims regarding the RMRGomez-Arbelaez et al. Nutrition & Metabolism (2018) 15:18 Page 9 of 10
status long-term after the completion of the VLCK diet. PronoKal Group ® for providing the diet for all the patients free of charge
However, no significant variations in body weight had and for support of the study. The funding source had no involvement in the
study design, recruitment of patients, study interventions, data collection, or
been observed after 4 months in previous studies [10, 11]. interpretation of the results. The Pronokal personnel (IS) was involved in the
In addition, although participants were instructed to exer- study design and revised the final version of the manuscript, without
cise on a regular basis using a formal exercise program, intervention in the analysis of data, statistical evaluation and final
interpretation of the results of this study.
we could not verify adherence to this instruction which
precludes determining whether changes in physical activ- Funding
ity patterns affected study outcomes. In the current work This work was supported by grants from the Fondo de Investigacion Sanitaria,
PE13/00024 and PI14/01012 research projects and CIBERobn (CB06/003), from the
a portable device that allows for easier measurement of Instituto de Salud Carlos III (ISCIII), Fondo Europeo de Desarrollo Regional (FEDER)
RMR and with lower cost was employed. This approach Spanish, and the Xunta de Galicia, Spain (GRC2014/034). DGA is grateful to the
may lead to errors when compared with the gold standard, Colombian Department of Science, Technology and Innovation – COLCIENCIAS as
a recipient of their pre-doctoral scholarship to support his work.
Deltatrac, but it is an easy-to-use metabolic system for
determining RMR and VO2 in clinical practice with a bet- Availability of data and materials
ter accuracy than predictive eqs. [9]. The Deltatrac device The datasets used during the current study are available from the corresponding
author on reasonable request.
is expensive and requires careful calibration. The Fitmate
has been previously validated as a suitable alternative to Author’s contributions
the traditional indirect calorimetry by both in-house ana- D G-A, ABC ad FFC designed and performed the experiments, analyzed the
data and wrote the manuscript. AIC, MAM-O, AC, LO-M, IS were responsible
lysis (Additional file 1: Figure S1), as well as by previous of the conduct and monitoring of the nutritional intervention. CG, DB
studies. Despite not measuring CO2 production it is a very participated in the study design and coordination and helped to draft the
convenient in the clinical setting assuming a minimal manuscript. FFC supervised the research and reviewed the manuscript
throught the study. All authors read and approved the final manuscript.
error of analysis.
Ethics approval and consent to participate
The study protocol was in accordance with the Declaration of Helsinki and
Conclusions was approved by the Ethics Committee for Clinical Research of Galicia,
In summary, this study shows that the treatment of Santiago de Compostela, Spain (registry 2010/119). Participants gave
obese patients with a VLCK-diet favors the maintenance informed consent before any intervention related to the study. Participants
received no monetary incentive.
of RMR within the expected range for FFM changes and
avoids the metabolic adaptation phenomenon. This find- Consent for publication
ing might explain the long-term positive effects of VLCK- Not applicable
diets on weight loss. Although, the mechanisms by which Competing interests
this effect could be justified are unclear, classical determi- DB, ABC and FFC received advisory board fees and or research grants from
nants of the energy expenditure, as thyroid hormones, cat- Pronokal Protein Supplies Spain. IS is Medical Director of Pronokal Spain SL
echolamines as well as leptin were discarded. The relative
good preservation of FFM (muscle mass) observed with Publisher’s Note
Springer Nature remains neutral with regard to jurisdictional claims in
this dietetic approach could be the cause for the absence published maps and institutional affiliations.
of metabolic adaptation.
Author details
1
Division of Endocrinology, Department of Medicine, Molecular and Cellular
Additional files Endocrinology Area, Complejo Hospitalario Universitario de Santiago (CHUS),
Instituto de Investigación Sanitaria de Santiago (IDIS), Travesia da Choupana
Additional file 1: Figure S1. Nutritional intervention program and street s/n, 15706 Santiago de Compostela, La Coruña, Spain. 2Medical
schedule of visits. Visit C-4 was performed at the end of the study according Department Pronokal, Pronokal Group, Barcelona, Spain. 3Intensive Care
to each case, once the patient achieved the target weight or maximum at Division, Complejo Hospitalario Universitario de Santiago (CHUS), Santiago
4 months of follow-up. (PDF 390 kb) de Compostela, Spain. 4Division of Endocrinology, Complejo Hospitalario
Universitario de Ferrol and Coruña University, Ferrol, Spain. 5CIBER de
Additional file 2: Figure S2. Bland Altman plots of Resting Metabolic Rate Fisiopatologia de la Obesidad y Nutricion (CIBERobn), Instituto Salud Carlos
(RMR) for Cosmed’s Fitmate device compared to the Deltatrac. (PDF 11 kb) III, Santiago de Compostela, Spain.
Additional file 3: Table S1. Independent effects of fat-free mass, free
triiodothyronine, catecholamines, leptin and β-hydroxy-butyrate on rest- Received: 21 September 2017 Accepted: 29 January 2018
ing metabolic rate at each visit. (DOCX 32 kb)
References
Abbreviations 1. Black AE, Coward WA, Cole TJ, Prentice AM. Human energy expenditure in
BMI: Body mass index; BW: Body weight; DXA: Dual-energy X-ray absorpti- affluent societies: an analysis of 574 doubly-labelled water measurements.
ometry; EFSA: European Food Safety Authority; FFM: Fat free mass; FM: Fat Eur J Clin Nutr. 1996;50:72–92.
mass; MF-BIA: Multifrequency bioelectrical impedance; RMR: Resting metabolic 2. Doucet E, St-Pierre S, Almeras N, Despres JP, Bouchard C, Tremblay A.
rate; RQ: Respiratory quotient; VLCK: Very low calorie ketogenic diet Evidence for the existence of adaptive thermogenesis during weight
loss. Br J Nutr. 2001;85:715–23.
Acknowledgements 3. EFSA Panel on Dietetic Products, Nutrition And Allergies (NDA). Scientific
We would like to thank A. Menarini Diagnostics Spain for providing free of opinion on the essential composition of total diet replacements for weight
charge the portable ketone meters for all the patients. We acknowledge the control. EFSA J. 2015;13:3957.Gomez-Arbelaez et al. Nutrition & Metabolism (2018) 15:18 Page 10 of 10
4. Fothergill E, Guo J, Howard L, Kerns JC, Knuth ND, Brychta R, Chen KY,
Skarulis MC, Walter M, Walter PJ, Hall KD. Persistent metabolic adaptation
6 years after "the biggest loser" competition. Obesity (Silver Spring).
2016;24:1612–9.
5. Galgani JE, Santos JL. Insights about weight loss-induced metabolic
adaptation. Obesity (Silver Spring). 2016;24:277–8.
6. Gomez-Arbelaez D, Bellido D, Castro AI, Ordonez-Mayan L, Carreira J, Galban
C, Martinez-Olmos MA, Crujeiras AB, Sajoux I, Casanueva FF. Body
composition changes after very low-calorie-ketogenic diet in obesity
evaluated by three standardized methods. J Clin Endocrinol Metab. 2017;
102:488–98.
7. Inge TH, Courcoulas AP, Jenkins TM, Michalsky MP, Helmrath MA, Brandt ML,
Harmon CM, Zeller MH, Chen MK, Xanthakos SA, Horlick M, Buncher CR,
Teen LC. Weight loss and health status 3 years after bariatric surgery in
adolescents. N Engl J Med. 2016;374:113–23.
8. Knuth ND, Johannsen DL, Tamboli RA, Marks-Shulman PA, Huizenga R, Chen
KY, Abumrad NN, Ravussin E, Hall KD. Metabolic adaptation following
massive weight loss is related to the degree of energy imbalance and
changes in circulating leptin. Obesity (Silver Spring). 2014;22:2563–9.
9. Lupinsky L, Singer P, Theilla M, Grinev M, Hirsh R, Lev S, Kagan I, Attal-Singer
J. Comparison between two metabolic monitors in the measurement of
resting energy expenditure and oxygen consumption in diabetic and non-
diabetic ambulatory and hospitalized patients. Nutrition. 2015;31:176–9.
10. Moreno B, Bellido D, Sajoux I, Goday A, Saavedra D, Crujeiras AB, Casanueva
FF. Comparison of a very low-calorie-ketogenic diet with a standard low-
calorie diet in the treatment of obesity. Endocrine. 2014;47:793–805.
11. Moreno B, Crujeiras AB, Bellido D, Sajoux I, Casanueva FF. Obesity treatment
by very low-calorie-ketogenic diet at two years: reduction in visceral fat and
on the burden of disease. Endocrine. 2016;54:681–90.
12. Muller MJ, Bosy-Westphal A. Adaptive thermogenesis with weight loss in
humans. Obesity (Silver Spring). 2013;21:218–28.
13. Muller MJ, Bosy-Westphal A, Kutzner D, Heller M. Metabolically active
components of fat-free mass and resting energy expenditure in humans:
recent lessons from imaging technologies. Obes Rev. 2002;3:113–22.
14. Muller MJ, Braun W, Pourhassan M, Geisler C, Bosy-Westphal A. Application
of standards and models in body composition analysis. Proc Nutr Soc.
2016;75:181–7.
15. Nieman DC, Austin MD, Benezra L, Pearce S, McInnis T, Unick J, Gross SJ.
Validation of Cosmed's FitMate in measuring oxygen consumption and
estimating resting metabolic rate. Res Sports Med. 2006;14:89–96.
16. Ravussin E, Lillioja S, Anderson TE, Christin L, Bogardus C. Determinants of
24-hour energy expenditure in man. Methods and results using a
respiratory chamber. J Clin Invest. 1986;78:1568–78.
17. Ravussin E, Lillioja S, Knowler WC, Christin L, Freymond D, Abbott WG,
Boyce V, Howard BV, Bogardus C. Reduced rate of energy expenditure as a
risk factor for body-weight gain. N Engl J Med. 1988;318:467–72.
18. Rosenbaum M, Hirsch J, Gallagher DA, Leibel RL. Long-term persistence of
adaptive thermogenesis in subjects who have maintained a reduced body
weight. Am J Clin Nutr. 2008;88:906–12.
19. Rosenbaum M, Leibel RL. Adaptive thermogenesis in humans. Int J Obes.
2010;34(Suppl 1):S47–55.
20. Sjostrom L, Narbro K, Sjostrom CD, Karason K, Larsson B, Wedel H, Lystig T,
Sullivan M, Bouchard C, Carlsson B, Bengtsson C, Dahlgren S, Gummesson A,
Jacobson P, Karlsson J, Lindroos AK, Lonroth H, Naslund I, Olbers T, Stenlof
K, Torgerson J, Agren G, Carlsson LM, Swedish Obese Subjects S. Effects of
bariatric surgery on mortality in Swedish obese subjects. N Engl J Med.
2007;357:741–52.
21. Stewart CL, Goody CM, Branson R. Comparison of two systems of Submit your next manuscript to BioMed Central
measuring energy expenditure. JPEN J Parenter Enteral Nutr. 2005;29:212–7. and we will help you at every step:
22. SCOOP-VLCD T. Reports on tasks for scientific cooperation. Collection of
data on products intendend for use in very-low-calorie-diets. Report • We accept pre-submission inquiries
Brussels European Comission 2002. • Our selector tool helps you to find the most relevant journal
23. Tagliabue A, Bertoli S, Trentani C, Borrelli P, Veggiotti P. Effects of the
• We provide round the clock customer support
ketogenic diet on nutritional status, resting energy expenditure, and
substrate oxidation in patients with medically refractory epilepsy: a 6-month • Convenient online submission
prospective observational study. Clin Nutr. 2012;31:246–9. • Thorough peer review
24. Van Gaal LF, Maggioni AP. Overweight, obesity, and outcomes: fat mass and
• Inclusion in PubMed and all major indexing services
beyond. Lancet. 2014;383:935–6.
25. Westerterp-Plantenga MS, Nieuwenhuizen A, Tome D, Soenen S, Westerterp • Maximum visibility for your research
KR. Dietary protein, weight loss, and weight maintenance. Annu Rev Nutr.
2009;29:21–41. Submit your manuscript at
www.biomedcentral.com/submitYou can also read