The Tridirectional Relationship among Physical Activity, Stress, and Academic Performance in University Students: A Systematic Review and ...
←
→
Page content transcription
If your browser does not render page correctly, please read the page content below
International Journal of
               Environmental Research
               and Public Health

Review
The Tridirectional Relationship among Physical Activity,
Stress, and Academic Performance in University Students:
A Systematic Review and Meta-Analysis
Kathrin Wunsch *,† , Janis Fiedler † , Philip Bachert †                         and Alexander Woll

                                           Institute of Sports and Sports Science, Karlsruhe Institute of Technology, 76131 Karlsruhe, Germany;
                                           Janis.Fiedler@kit.edu (J.F.); Philip.Bachert@kit.edu (P.B.); Alexander.Woll@kit.edu (A.W.)
                                           * Correspondence: Kathrin.Wunsch@kit.edu; Tel.: +49-721-608-45431
                                           † Authors contributed equally to the manuscript.

                                           Abstract: Higher education students often suffer from physiological and psychological health prob-
                                           lems caused by stress, which may negatively impact their academic performance (AP). Physical
                                           activity (PA) can be a promising strategy to buffer these stress-induced complaints. Therefore, the aim
                                           of this investigation was to summarize evidence for the tridimensional construct of PA, stress, and
                                           AP, as well as to quantify the relationships among these variables. Five databases (PubMed, Scopus,
                                           SMEI, ERIC, and Web of Science) were systematically searched in November 2019 for publications
                                           that examined PA, stress, and AP of university students, without any restrictions regarding the
                                           publication period. The systematic review includes four original research studies with a moderate-
                                           to-high risk of bias. Results of included studies were narratively summarized and quantified in a
                                           meta-analysis using random effect models. Whereas study results point to a positive relation between
                                 PA and AP, relationships between PA and stress seem to be negative, while the relation between
                                    stress and AP is undecided. The meta-analysis found no significant associations and considerable
Citation: Wunsch, K.; Fiedler, J.;         heterogeneity of the results. Findings indicate a research gap concerning the connection of PA, stress,
Bachert, P.; Woll, A. The Tridirectional   and AP in university students. Future studies should use validated measuring tools and consider the
Relationship among Physical Activity,      timepoint of data collection in order to extract truly stressful periods.
Stress, and Academic Performance in
University Students: A Systematic          Keywords: academic stress; exams; exercise; student’s health; grade point average
Review and Meta-Analysis. Int. J.
Environ. Res. Public Health 2021, 18,
739. https://doi.org/10.3390/
ijerph18020739
                                           1. Introduction

Received: 2 December 2020
                                                In recent years, a growing body of research has emerged, showing that a major concern
Accepted: 14 January 2021
                                           of higher education students is suffering from physiological and psychological health
Published: 16 January 2021                 problems. Stewart-Brown and colleagues showed that one-third of university students
                                           reported at least one long-standing illness [1]. More recent investigations revealed a similar
Publisher’s Note: MDPI stays neu-          amount of students suffering from mental issues, showing that student life can be a cause of
tral with regard to jurisdictional clai-   distress, as students report higher distress levels than their non-student peers [2], and high
ms in published maps and institutio-       levels of stress impact the quality of life [3]. An obvious causal factor being accountable for
nal affiliations.                          (periodic) high levels of student stress is the examination period at the end of each semester,
                                           thus forming a real-life stress situation. Particularly, this phase causes immediate negative
                                           effects on health-related outcomes, such as poor sleep quality and well-being [4], which
                                           are positively related to cognition and academic achievement or academic performance
Copyright: © 2021 by the authors. Li-
                                           (AP) [5,6]. Hence, AP is commonly affected in high-stress periods, where the highest
censee MDPI, Basel, Switzerland.
                                           cognitive functioning is required.
This article is an open access article
                                                Physical activity (PA) and exercise are known to be stress-buffering behaviors, as
distributed under the terms and con-
ditions of the Creative Commons At-
                                           engagement in regular PA can buffer negative effects of stress on health, which is postulated
tribution (CC BY) license (https://
                                           by the stress-buffering hypothesis [7,8]. In general, PA is known to have several positive
creativecommons.org/licenses/by/
                                           effects on physiological and psychological stress-related parameters. There is early evidence
4.0/).                                     to support the stress-modulatory effect of PA. Brown and Siegel [9] revealed that sedentary

Int. J. Environ. Res. Public Health 2021, 18, 739. https://doi.org/10.3390/ijerph18020739                        https://www.mdpi.com/journal/ijerph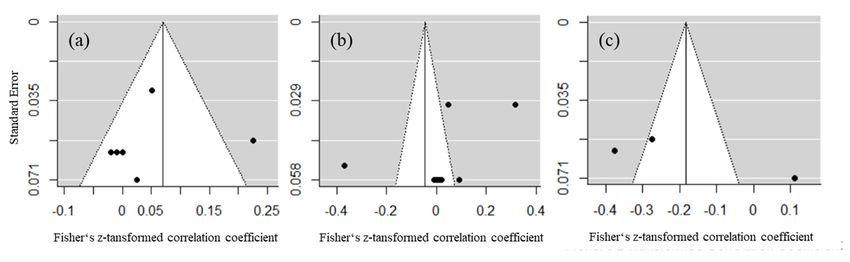
Int. J. Environ. Res. Public Health 2021, 18, 739                                                                                 2 of 18

                                        participants with high stress levels had an elevated disease incidence and that physically
                                        active participants with high stress were protected against the stress-induced increases in
                                        disease incidence. Furthermore, stress level, anxiety, and depression of university students
                                        increases as their sedentary time increased [10]. Similar results have been drawn regarding
                                        psychological health [8]. Klaperski, Seelig and Fuchs showed that PA exhibits a health-
                                        protective effect, especially under chronic stress conditions [11]. Overall, Nguyen-Michel,
                                        Unger, Hamilton, and Spruijt-Metz revealed a significant negative relationship between
                                        PA and stress in a student sample [12]. Especially in high-stress periods like examination
                                        phases, PA decreases and may therefore not provide a suitable stress-buffer for students.
                                              Hence, it is especially the examination phase in which students could profit from
                                        good stress-buffering abilities, as high amounts of perceived stress are known to diminish
                                        cognitive functioning in students [13], which in turn is highly correlated to AP [14]. Studies
                                        revealed significant negative correlations between perceived stress and AP in students,
                                        especially within examination periods at the end of a semester [15–17].
                                              Literature including child and adolescent populations suggests that PA positively in-
                                        fluences AP, as more active students show better AP [18,19], even if there is only limited
                                        evidence [20,21]. Interestingly, this association is commonly examined in pupils (school
                                        children) and needs to be further addressed in university student populations, particularly
                                        because the majority of university students do not meet the recommendations for PA [22–24].
                                              Until today, there has been a lack of knowledge on the relationship between PA,
                                        stress, and AP in university students. However, especially this tridirectional relationship
                                        is of interest, as stress burden is exceptionally high in academic examination phases,
                                        where cognitive function demands are concomitantly high to achieve best AP [13,14]. As
                                        the cross-stressor-adaptation hypothesis [25] posits that regular PA (as a stressor itself)
                                        elicits unspecific adaptations enabling humans to also show lower reactions to heterotypic
                                        stressors (i.e., psychosocial or cognitive stressors, like examinations periods; [26]), it is of
                                        high interest to also include AP as an outcome variable into this consideration. Based on
                                        knowledge of the bidirectional relationships of PA, stress and AP, it can be hypothesized
                                        that PA serves as a mediator or moderator in the relationship between stress and AP.
                                        To gain insights into the possible stress-buffering and cross-stressor-adaptation effects
                                        of PA and simultaneous benefits to AP in stressful periods in university students, the
                                        current investigation aims to form a systematic review and meta-analysis to expand upon
                                        research on bidirectional relationships of PA and stress, stress and AP, as well as PA and
                                        AP, while focusing only on studies assessing all three variables in order to gain insights
                                        into the tridirectional relationship. This is especially important in terms of public health,
                                        as policymakers and universities may profit from results in order to account for student-
                                        specific, PA-based health interventions to increase AP in real-life stress situations.

                                        2. Methods
                                            This systematic review was performed and reported following the Preferred Reporting
                                        Items for Systematic Reviews and Meta-Analysis (PRISMA) guidelines [27].

                                        2.1. Eligibility Criteria
                                              Primary source and peer-reviewed articles published in English were eligible for
                                        inclusion in this systematic review and meta-analysis if data were presented for PA, stress,
                                        and AP simultaneously. Specific eligibility criteria included the following: types of partici-
                                        pants: university students. Types of outcome measures: each dependent variable had to be
                                        measured and reported, i.e., PA (via self-report or accelerometry/pedometers), stress (via
                                        self-report or any physiological measure), and AP (via self-report or grades). Study design:
                                        no restrictions. Exclusion criteria: articles were excluded if they did not meet inclusion
                                        criteria or did not include findings related to inclusion criteria (i.e., measured PA, but failed
                                        to compare with stress or AP).
Int. J. Environ. Res. Public Health 2021, 18, 739 3 of 18
2.2. Information Sources
Five different databases were used for literature search: PubMed, Scopus, SMEI, ERIC,
and Web of Science. Search terms were applied to meet the specific demands of each
database. Two authors performed the search independently. In case of divergence or
ambiguity, results were discussed until a consensus was reached.
2.3. Search
Search terms were defined through group discussion among the research team and
were used in each database without any restriction regarding the publication period to
identify potential articles with abstracts for review in November 2019. Using the PICO
search tool [28], the following key search-terms were identified: university students, PA,
academic stress and AP. In combination with synonyms of all components, combined
searches were performed in the different databases. The specific search terms for each
database can be found in Supplementary Table S1. Identified publications were then
transferred to Citavi (version 6.5.0.0) for further processing.
2.4. Study Selection
Title and abstracts of retrieved studies were independently assessed for eligibility for
inclusion in the review by two authors. Disagreements regarding eligibility for inclusion
were resolved via consensus among all authors. Full-text articles for eligible abstracts
were retrieved and reviewed by the same two authors prior to inclusion in the review.
A Microsoft Excel spreadsheet was developed to track the eligibility status.
2.5. Data Collection Process and Data Items
Extracted data were entered into an Excel spreadsheet. Relevant data were extracted
from each manuscript by one author and the coding was verified by a second author.
Disagreements were resolved by discussion among these authors. Data extracted from each
article included general information (authors, year, country), basic information on methods
(aim, study design, sample characteristics, sampling time, methods used regarding PA,
stress and AP) as well as results (direct association statistics, central results, and sub
findings). If different measurement methods (e.g., self-reported success vs. grade point
average (GPA) or self-reported vs. device-measured PA) were used in the studies, the ones
which were most comparable between the studies (i.e., self-reported PA and GPA) were
included. For each relationship, relevant effect sizes were retrieved.
2.6. Risk of Bias in Individual Studies and Risk of Bias across Studies
To assess the risk of bias across studies, funnel plots were compiled using R [29].
For the assessment of the risk of bias in individual studies, the Appraisal Tool for Cross-
Sectional Studies (AXIS) was used [30]. To quantify the risk of bias of individual studies, a
scoring method has been adapted [31]. Following this method, the studies were categorized
as very low risk of bias if they scored correctly on at least 19 out of 20 of the questions, low
risk of bias if they scored 17 or 18 out of 20; moderate risk of bias if they scored 15 or 16 out
of 20 and high risk of bias if the studies scored 14 or less.
2.7. Summary Measures
In order to perform the meta-analysis, all effect sizes were extracted from the original
studies and transformed into correlation coefficients. If betas or effect size estimates were
reported in the studies and the original correlation coefficients could not be obtained,
the betas and effect size estimates were treated as correlation coefficients [32]. F-values
from ANOVAs were transformed to correlation coefficients using the online platform
psychometrica [33]. X2 values were transformed to Cramer’s V using the following formula:
s
X2
n ( K − 1)Int. J. Environ. Res. Public Health 2021, 18, 739 4 of 18
Here, K is the number of rows or number of columns, whichever shows the smaller
number [34]. Cramer’s V was treated as a correlation coefficient subsequently [35].
2.8. Additional Analyses and Synthesis of Results
An original analysis of the tridirectional relationship was not possible due to missing
information (see results of individual studies). Contacting the authors to provide the
missing information was not successful. Therefore, articles were grouped by the respective
dependent variable. Hence, three datasets were derived, based on correlational findings on
the relationships of: (1) PA and AP, (2) PA and stress, and (3) AP and stress.
To gain a basis for meta-analytical interpretation, all effect sizes were transformed
into correlation coefficients (see summary measures). These were Fishers-z-transformed
to gain comparable results. A random-effects model was used for the three multilevel
meta-analyses concerning the relationship of (1), (2), (3) (see above). The results were
interpreted following [36]. Based on empirically derived effect size distribution, correlation
coefficient values of 0.12, 0.24, and 0.41 should be interpreted as small, medium, and large
effects for social psychology studies.
The Q-test for heterogeneity [37] is reported to display the amount of heterogene-
ity among with the I2 value [38], where values of 0% to 40% indicate no important,
30% to 60% moderate, 50% to 90% substantial, and 75% to 100% considerable hetero-
geneity [39]. The analysis was carried out using R (version 3.6.1) [29] and the metafor
package (version 2.1.0) [40].
3. Results
3.1. Study Selection
Out of the 2589 studies initially located and downloaded, 837 doublets were automati-
cally removed in Citavi. Based on title and abstract screening, an additional 1710 studies
were excluded, which resulted in 42 studies for full-text screening. In this step, 38 studies
were excluded due to not meeting inclusion criteria. Thus, a total of four original research
studies were included in this meta-analysis [41–44]. Please see Figure 1 for the full study
selection process and reasons for exclusion during screening.
3.2. Study Characteristics
Two out of the four studies were conducted in the USA, one in France, and one in
China. The studies included three cross-sectional and one cohort study and were published
between 2011 and 2018. Participants were undergraduate students and sample sizes ranged
from 203 [41] to 1071 [44], resulting in a total sample size of 1952 participants (nfemale = 1220,
nmale = 732) throughout included studies. Detailed study characteristics can be retrieved
from Table 1.
3.3. Risk of Bias within Studies
While quantifying the risk of bias by the AXIS tool, one study was rated at moderate
risk of bias (15/20) [43] and three studies at high risk of bias (14/20) [41,42,44]. The main
weaknesses were the lack of sample size justification, not addressing non-responders, not
clarifying funding sources or conflict of interest, and not describing the ethical approval or
consent of participants. For more information on risk of bias assessment see Table 2.Int. J. Environ. Res. Public Health 2021, 18, 739 5 of 18
Int. J. Environ. Res. Public Health 2021, 18, x 5 of 24
Figure 1. Flow
Figure chart
1. Flow of study
chart selection
of study selectionprocess.
process.Note:
Note: AP: academicperformance;
AP: academic performance;PA:PA: physical
physical activity.
activity.
3.2. Study Characteristics
Two out of the four studies were conducted in the USA, one in France, and one in
China. The studies included three cross-sectional and one cohort study and were pub-
lished between 2011 and 2018. Participants were undergraduate students and sample
sizes ranged from 203 [41] to 1071 [44], resulting in a total sample size of 1952 participants
(nfemale = 1220, nmale = 732) throughout included studies. Detailed study characteristics can
be retrieved from Table 1.Int. J. Environ. Res. Public Health 2021, 18, 739 6 of 18
Table 1. Study characteristics of included studies.
Direct Association Statistics
Authors Study Sample Characteris- Sampling Time;
Aim Sample Size; Age (SD) PA Measure Stress Measure AP Measure Transformed Effect Sizes (to Central Results Sub-Findings
(Year)/Country Design tics/Population Stress Period?
Comply with r Values)
Self-report measure:
Freshmen Stress Scale
(Boujut and
Bruchon-Schweitzer, 2009);
a general score of
perceived stress and four
specific scores: (1) AS (e.g.,
Significant differences
To examine "examination revisions” or Rare sports practice (rare
Self-report measure: between three groups
differences between “new working methods”, and not every often): 406
single item regarding Data by the university PA to AP: chi-square = 2.82; on GS (F(2,1070) = 9.28,
rare, regular (2) stress-related to students (26.4% of male);
frequency of sports administration PA to AS: F = 13.88; pInt. J. Environ. Res. Public Health 2021, 18, 739 7 of 18
Table 1. Cont.
Direct Association Statistics
Authors Study Sample Characteris- Sampling Time;
Aim Sample Size; Age (SD) PA Measure Stress Measure AP Measure Transformed Effect Sizes (to Central Results Sub-Findings
(Year)/Country Design tics/Population Stress Period?
Comply with r Values)
To examine changes
in health
Self-report measure: Physical health symptoms,
perceptions and T1 at the start of the
single item regarding PA to AP: β = 0.025; general psychological
behaviors among Self- report measure: 7 academic year, T2
Undergraduate frequency of more than Grade Point Average of female β = 0.05; male β = −0.03 health, diet, tobacco use,
Ruthig et al. undergraduate 203 (140 female); 18.82 items from the PSS, sum toward the end (not No significant
Cohort psychology 30 min/day PA per introductory Stress to AP: β = 0.11 binge drinking and sleep;
(2011)/USA college students ± 1.50 years score (Cohen, Tamarck, clearly specified) association found
students week; (categorization: 1 psychology course female β = 0.15; male β = 0.02; gender differences;
over an academic and Mermelstein, 1983) Not controlled for
(never) to 7 (seven or β=r changes in health
year and to perceived stress
more times)) perceptions and behaviors
determine how such
changes impact AP
Note. PA: Physical Activity. AP: Academic Performance. GS: General Stress. AS: Academic Stress. Vig: vigorous. Mod: moderate. Obli: obligatory exercise. ICSRLE: Inventory of College Students’ Recent Life
Experiences. PSS: Perceived Stress Scale. ESE: Effect size estimate. GPA: Grade Point Average.Int. J. Environ. Res. Public Health 2021, 18, 739 8 of 18
Table 2. Risk of bias assessment using the Appraisal Tool for Cross-Sectional Studies (AXIS) tool for included studies.
AXIS Items 1–10
3_ 4_ methods 5_ meth- 6_ methods 7_methods 8_methods _appropri- 9_methods _appropri- 10_methods
1_intro_aims 2_methods_study_design
methods_sample_size _defined_population ods_representation _selection_process _non_responders ate_measures_aims ate_measures_methodogical _statistical_indices
Décamps et al.
Yes Yes No Yes Yes No No Yes Yes Yes
(2012)/France
See “Participants and See “Participants and First year college French university; 381 See “Participants and No information on See “Measures” in the See “Measures” in the
See “Introduction” p set to 0.05
procedure” procedure” students males and 690 females procedure” non-responders methods section methods section
Kayani et al.
Yes Yes No Yes Yes Yes Don’t know Yes Yes Yes
(2018)/China
See “Theoretical A sample of 358 see “Measures”; p set to 0.05; see
See “Measures” University students See “Participants” See “Participants” See “Participants” See “Measures”
background” students was studied. Depression = Stress confidence intervals
Rettinger (2011)/USA Yes Yes No Yes Yes Yes No Yes Yes Yes
An email was sent to
See “Introduction” Part Three-hundred twenty Undergraduate See “Participants and No information on
See “Methods” the undergraduate See “Measures” See “Survey Instruments” p set to 0.05
3 students responded. students recruitment” non-responders
student body
Ruthig et al.
Yes Yes No Yes Yes Yes No Yes Yes Yes
(2011)/USA
Participants were 203 Male and female The Stress: Time 1
See “The current See “Participants and See “Participants and see “Participants and No information on
undergraduate undergraduate college See “Measures” Inter-item reliability p set to 0.05
study” Procedure“ procedure” procedure” non-responders
students students (α = 0.86)
AXIS Items 11-20
11_methods 13_results 14_results _informa- 17_discussion
12_results_description 15_results_consistency 16_results_all_analysis 18_discussion_limitations 19_other_conflict_interest 20_other_ethical_approval Score
_description_overall _non_response_bias tion_non_responders _justified_discussion
Décamps et al. 14 (high
Yes Yes No No Yes Yes Yes Yes No Yes
(2012)/France risk)
See “measures” and No information on No information on ANOVA, Tukey post See “conflict of interest See “Participants and
See “Results” See “Results” See “Discussion” See “Limitations”
“analysis of data” non-responders non-responders hoc, chi-square statement” procedure”
15
Kayani et al.
Yes Yes No Yes Yes Yes Yes Yes No Do not know (moderate
(2018)/China
risk)
See “measures” and EFA, CFA, mediated The authors declare no
See “Table 1” See “Participants” See “Participants” See “Results” See “Discussion” See “Limitations” No information
“analysis of data” regression analysis conflict of interest.
14 (high
Rettinger (2011)/USA Yes Yes No No Yes Yes Yes Yes Don’t know Do not know
risk)
No information on
No information on A univariate general
See Data Analysis See “Results” non-responders; 23 did See “Results” See “Discussion” See “Limitations” No information No information
non-responders linear model (GLM)
not complete
Ruthig et al. 14 (high
Yes Yes No No Yes Yes Yes Yes Don’t know Do not know
(2011)/USA risk)
see “Methods & see “Results and no information on no information on ANOVA, t-tests,
see “Results” see “Discussion” see “Limitations” no information no information
Results” Participants” non-responders non-responders regression analysesInt. J. Environ. Res. Public Health 2021, 18, x 14 of 24
Int. J. Environ. Res. Public Health 2021, 18, 739 9 of 18
3.4. Risk of Bias across Studies
3.4. Risk of Bias across Studies
Publication bias across studies was assessed using funnel plots for the three bidirec-
Publication bias across studies was assessed using funnel plots for the three bidirec-
tional relationships. Statistical tests of publication bias were not conducted due to the
tional relationships. Statistical tests of publication bias were not conducted due to the
small number of studies [28]. Visual inspection of funnel plots (Figure 2) indicated a small
small number of studies [28]. Visual inspection of funnel plots (Figure 2) indicated a
publication bias for the relationship of PA and AP, but high publication bias for the rela-
small publication bias for the relationship of PA and AP, but high publication bias for the
tionships of PA
relationships of and stress
PA and as well
stress as for
as well asstress and AP
for stress andas
APofas
theofvisible asymmetry
the visible of effect
asymmetry of
sizes.
effect sizes.
Figure 2. Funnel plots for publication bias between studies for the bidirectional relationships. (a) Physical activity and
Figure 2. Funnel plots for publication bias between studies for the bidirectional relationships. (a) Physical activity and
academic performance; (b) physical activity and stress; (c) stress and academic performance.
academic performance; (b) physical activity and stress; (c) stress and academic performance.
3.5. Study Characteristics
3.5. Study Characteristics
Included studies used heterogeneous designs. Whereas Decamps and colleagues [44]
Included studies used heterogeneous designs. Whereas Decamps and colleagues [44]
and Kayani and colleagues [43] used cross-sectional designs, Rettinger and colleagues [42]
and Kayani and colleagues [43] used cross-sectional designs, Rettinger and colleagues [42]
gained longitudinal data, but performed their analyses from averaged data across measure-
gained longitudinal data, but performed their analyses from averaged data across meas-
ment points in a cross-sectional manner, therefore losing information from the repeated-
urement points in a cross-sectional manner, therefore losing information from the re-
measures design. Ruthig and colleagues [41] were the only to use a longitudinal design
peated-measures design. Ruthig and colleagues [41] were the only to use a longitudinal
and analyses and therefore the only ones to account for time-based alterations.
design and analyses and therefore the only ones to account for time-based alterations.
Studies also differed in assessment methods, especially regarding PA measures.
Studies also differed in assessment methods, especially regarding PA measures.
Whereas Kayani and colleagues [43] and Rettinger and colleagues [42] used the short
Whereas Kayani and colleagues [43] and Rettinger and colleagues [42] used the short form
form of the International Physical Activity Questionnaire [45] consisting of seven items
of the International
measuring PA, DecampsPhysical
and Activity
colleagues Questionnaire
[44] and Ruthig [45] and
consisting
colleaguesof seven itemsused
[41] both meas-a
uring PA, Decamps and colleagues [44] and Ruthig and colleagues
single-item to assess PA. However, they did not ask for PA in general, but for sports or [41] both used a single-
item to assess
exercise PA.
activity, However,
therefore they didPA
excluding not askactive
like for PA in general,
transport but for sports
or gardening, or exercise
which are not
classified as sports or exercise but also important in relation to PA. Analogous, not
activity, therefore excluding PA like active transport or gardening, which are classi-
measures
fiedstress
for as sports or exercise
also differed but also
between important
the studies. in relation
However, onlytovalidated
PA. Analogous, measures
and multi-item for
ques-
stress also differed between the studies. However, only validated
tionnaires were used by all studies [46–49]. Regarding AP, Kayani and colleagues [43] and and multi-item ques-
tionnairesand
Rettinger were used by all
colleagues studies
[42] both used[46–49].
GPA Regarding
measuresAP, Kayani
in form of and
averagecolleagues
course[43] and
grades
Rettinger and colleagues [42] both used GPA measures in form
over the past semester, providing a general view of AP. Decamps and colleagues [44] of average course grades
over the AP
assessed pastwith
semester, providing(only
a dichotomous a general
nominalview of AP.variable
scaled) Decamps and
(i.e., failcolleagues [44]and
vs. success), as-
sessed and
Ruthig AP with a dichotomous
colleagues [41] used a(onlysingle nominal scaled)for
course grade variable (i.e., fail vs. therefore
operationalization, success), not
and
Ruthig andthe
portraying colleagues
general AP[41]of
used a single course grade for operationalization, therefore not
students.
portraying the general
While Decamps andAPcolleagues
of students. [44], Kayani and colleagues [43] and Rettinger and
While Decamps and colleagues
colleagues [42] aimed to recruit a representative [44], Kayani and sample,
student colleagues [43]and
Ruthig andcolleagues
Rettinger [41]
and
colleagues [42] aimed to recruit a representative student sample,
investigated psychology students, resulting in a homogenous sample and limiting general- Ruthig and colleagues
[41] investigated
izability of results.psychology students, resulting in a homogenous sample and limiting
generalizability
Furthermore, of examining
results. sample demographics it becomes apparent that PA of in-
cluded Furthermore,
participantsexamining
differs from sample
what one demographics
could expect it of
becomes
a generalapparent
studentthat PA ofThe
sample. in-
cluded
study participants
conducted differs from
by Decamps and what one could
colleagues expectaofu-shaped
[44] reveals a general student sample.
distribution The
of activity
study conducted
levels: there are manyby Decamps and colleagues
inactive students as well as[44] reveals
many activea u-shaped
students (>8 distribution
h of sports ofper
ac-
tivity levels:
week). there are
Additionally, manyand
Kayani inactive students
colleagues as wella as
[43] report meanmany active
of 3.1 students
metabolic (>8 h of
equivalentInt. J. Environ. Res. Public Health 2021, 18, 739 10 of 18
(MET)-hours per week, which would be far below average, therefore representing a very
inactive student sample.
Regarding sampling time points, Kayani and colleagues [43] and Rettinger and col-
leagues [42] reported examination of students to take place between October and December,
which seems to be at the beginning of the semester. Decamps and colleagues [44] did not
report on sampling time. Only Ruthig and colleagues [41] chose to measure pre- and
within-examination-stress conditions. The stress level of the sample of Rettinger and col-
leagues does not differ significantly from a norm sample [43–49], whereas the samples of
Ruthig et al. [50] and Kayani et al. [49] tend to be more stressed, as there is no comparative
data available, no assumption can be drawn with regard to the stress level of the sample of
Decamps and colleagues.
3.6. Results of Individual Studies and Synthesis of Results
While all studies included all three dimensions (PA, AP, and stress), the only relation-
ship reported in all studies was the relation between PA and AP. Three studies analyzed
the relationship between stress and AP [41–43] and three studies provided results for the
relation of PA and stress [42–44]. Only one study [43] investigated the relationship of all
three variables within a mediation approach. Due to the fact that only one study examined
this relationship between all three variables, this relationship was not accounted for in
the following meta-analyses. Hence, bidirectional relationships were analyzed and the
results merged in narrative synthesis. As only one study used objective measures of PA,
and subjective and objective measures are known to produce divergent results (e.g., [51]),
only self-reported PA measures were included in analyses. Moreover, self-reported stress
as well as objectively documented AP (i.e., GPA) results were included to increase the
comparability between the studies, since those were reported in all studies.
Significant results for the relation between PA and AP were reported in one out
of the four studies [42] between walking and GPA and between total PA and GPA in a
second study [43].
The examination of relationships between PA and stress showed significant results
for obligatory exercise and the Inventory of College Students’ Recent Life Experiences (IC-
SRLE). However, the other measurement tools for Stress (Perceived Stress Scale (PSS)) and
PA (International Physical Activity Questionnaire (IPAQ)) did not indicate any statistical
significant relation [42]. Both academic and general stress measured by the Freshman-Stress
Scale were significantly associated with PA in one study (in the case of general stress, this
significant relationship was not present after the transformation to Fisher r-to-z transformed
correlation coefficients) [44] as well as general stress measured by the university-stress
scale in another [43].
The relationship of AP and stress showed significant results between general stress
measured by the ICSRLE and GPA in one study [42] and between general stress measured
by the university-stress scale and GPA by another [43]. The effect sizes and more detailed
results of the four included studies can be found in Table 1.
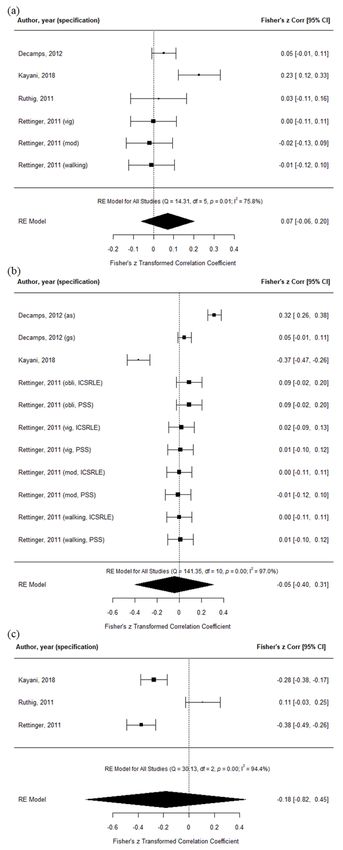
3.7. Overall Effect Sizes
A meta-analysis of effect sizes was conducted for the relationship between PA and AP,
PA and stress, and stress and AP.
The estimated average Fisher r-to-z transformed correlation coefficient based on
the random-effects model for the relationship between PA and AP, PA and stress, and
stress and AP was 0.07 (95% confidence interval (CI): −0.06–0.20, Q5 = 14.31, p = 0.01;
I2 = 75.8%), −0.05 (95% CI: −0.40–0.31, Q10 = 141.35, p < 0.01; I2 = 97.0%), and −0.18
(95% CI: −0.82–0.45, Q2 = 30.13, p < 0.01; I2 = 94.4%), respectively. Therefore, none of the
average outcomes of these relationships differed significantly from zero and the I2 values
indicate significant substantial to considerable heterogeneity. The forest plots for these
relationships are displayed in Figure 3.Int. J. Environ. Res. Public Health 2021, 18, 739 11 of 18
Int. J. Environ. Res. Public Health 2021, 18, x 17 of 24
Figure 3. Forest plots of bidirectional relationships. (a) Physical activity and academic performance;
(b) physical activity and stress; (c) stress and academic performance. Abbreviations: vig: vigorous
physical activity; mod: moderate physical activity; as: academic stress; gs: general stress; obli:
obligatory exercise; ICSRLE: Inventory of College Students’ Recent Life Experiences; PSS: perceived
stress scale.Int. J. Environ. Res. Public Health 2021, 18, 739 12 of 18
4. Discussion
This systematic review and meta-analysis provided an overview of studies that in-
cluded PA, stress, and AP in university students. Four studies with more than 1900
participants were identified within this review. The aim was to examine the tridirectional
relationship between PA, stress, and AP and to expand upon knowledge on bidirectional
relationships of PA and stress, stress and AP, as well as PA and AP, while focusing only
on studies assessing all three variables. A mediating or moderating effect of PA on the
relation between stress and AP was hypothesized based on theoretical assumptions [7,25].
Even though there were significant relations between the three dimensions in the indi-
vidual studies, the pooled bidirectional comparisons showed no significant relationship
between the dimensions. Only one of the included studies investigated the relationship
between all variables of interest: PA, AP, and stress [43]. The remaining three studies also
assessed all three variables but only focused on bidirectional relationships. Based on the
meta-analytical analyses none of these relationships gained significance and ES indicate
small effects for the relation of stress and AP (z’StressAP = −0.18,Int. J. Environ. Res. Public Health 2021, 18, 739 13 of 18
high-stress periods like examination phases, PA decreases and does therefore not execute
its potential as a suitable stress-buffer for students [4].
4.3. Bidirectional Relationship between Stress and Academic Performance
The pooled effect for stress and AP revealed a negative small, but non-significant
relation, meaning that participants with higher stress have a decreases AP in principle as
shown by two out of three studies, which is in line with former studies [15,17]. However,
the study conducted by Ruthig and colleagues [41] is out of the line and found a positive
relationship and therefore higher stress to elicit better AP. Here, the absolute stress amount
of the study population needs to be considered. With a perceived stress scale ranging
from 9 to 35, their sample scored around 22 on average (SD = 5.72), showing a high stress
amount as compared to the population mean [60,61]. One possible explanation for this
result might be that participants who prepared more for the AP also perceived a higher
amount of stress but at the same time showed better performance due to their throughout
preparation and probably their higher arousal as stated, e.g., by the Individual Zones of
Optimal Functioning (IZOF) Theory [62]. Therefore, future studies should assess levels of
arousal in students to examine student’s optimal stress zone for optimal AP.
4.4. Tridirectional Relationship among Physical Activity, Stress, and Academic Performance
Kayani and colleagues [43] were the only to investigate the relationship of all three
variables. They used a parallel mediation model, however, measuring the influence of
stress and self-esteem as concurrent mediators of the relationship between PA and AP,
with both were found to be significant mediators. Hence, this study is, to the best of our
knowledge, the only one to show a mediating effect of stress on the relation of PA and AP,
revealing that the higher the amount of PA, the lower the stress level and the higher the
stress level, the lower AP. However, even though the mediating effect increases the direct
effect of PA on PA, the stress-buffering hypothesis postulates a moderating effect of PA on
the relationship of stress and AP, which still remains unclear.
Especially in the examination phase students should have good stress-buffering abili-
ties by performing PA, as high amounts of perceived stress are known to diminish cognitive
functioning in students [13]. Moreover, cognitive functioning is highly correlated to AP [14].
The inclusion of all three variables PA, stress, and AP in one statistical (moderation) model
might be essential in this context since this might reveal indirect effects not captured by bidi-
rectional comparisons. However, based on theoretical deliberations, it cannot be assured
that a mediation approach is the correct underlying mechanism. A moderation approach
may also be expedient as also suggested by a review on PA and stress reactivity [63], which
has to be examined in future studies by comparing model fits of different approaches.
4.5. Limitations
A couple of limitations have to be considered in regard to this review.
First, a meta-analytic analysis of only four (quite heterogenic) studies was performed,
whose results has to be viewed with caution. However, the Cochrane Consumers and Com-
munication Review Group [64] stated that as few as two studies are sufficient to conduct a
meta-analysis. To account for the small sample, results drawn are less generalizable than
results drawn from bigger samples.
From a methodological perspective, the sample size was quite divergent across in-
cluded studies, ranging from 203 [41] to 1071 [44] and added up to a total of 1952 partici-
pants (nfemale = 1220, nmale = 732) throughout all studies. Individual sample sizes do not
appear to be extremely small. However, most studies did not provide any justification for
sample size estimation, leaving the question of appropriate sample size and power.
Besides restricted sample sizes, the risk-of-bias assessment revealed three out of the
four studies to suffer from a high risk of bias [41,42,44] within studies. Closer inspec-
tion revealed that this high risk is commonly caused by not reporting on non-responders.
Therefore, more information is needed about non-responders and dropouts in future inves-Int. J. Environ. Res. Public Health 2021, 18, 739 14 of 18
tigations to be able to better evaluate study quality and weighting results. A similar picture
emerged when evaluating risk of bias between studies. Here, a small bias can only be
assumed for the relation between PA and AP, whereas the other two suffer from high pub-
lication bias. However, this finding was accounted for by using random-effect models for
meta-analyses as suggested by the Cochrane Consumers and Communication Group [65].
Nevertheless, findings have to be interpreted with caution, as sources of heterogeneity are
unclear. Notably, the studies included different designs and various additional outcomes
that were not included in the meta-analysis to achieve a better comparison.
Several other methodological differences between studies made results difficult to
compare. Included studies used either cross-sectional [43,44] or longitudinal designs [41]
or analyzed longitudinal data cross-sectionally [42]. Moreover, studies differed regarding
assessment methods in all three variables of interest: PA is not thoroughly assessed in
any of the studies. As two studies used a 7-item short form of the IPAQ [45] measuring
PA in different facets [42,43], the two remaining studies only used single-item measures
to quantify PA. Here, the next methodological concern arises, as these two studies stated
to measure PA, though they explicitly asked for sport and exercise activities, excluding
PA like active transportation or gardening, for example. Hence, results regarding PA are
difficult to compare between studies. Another concern about terminology arose in the
study of Kayani and colleagues [43], who stated to measure depression, but used the
University Stress Scale [49] and therefore measured stress to operationalize depression.
Moreover, all studies used different, however validated measures for stress. Regarding
AP, two studies used GPA as course grade average [42,43], whereas one study used a
dichotomous outcome [44] and one used only a specific course grade of a single course [41].
As all studies were interested in influences of or on academic stress, sampling points at the
start of a semester, i.e., in a period with only low stress demands, is questionable. If stress is
a variable of interest, it should be measured towards the end of a semester (i.e., just before
the examination period), where stress demands are known to increase as examinations
approach. These differences make results difficult to compare and may have influenced
results on relationships of variables of interest.
Last, but not least, a major limitation of the current investigation is that we were
not successful in identifying and examining more studies elaborating the tridimensional
relationship of PA, stress, and AP, even though we explicitly included only studies with
all three variables. Unfortunately, only one of them examined the relation of interest. All
other studies focused on bidirectional relationships; thus, not enabling us to draw clear
conclusions.
5. Conclusions and Future Directions
The current investigation did not evoke any significant relationships between the
three variables of interest. Moreover, heterogeneity, the small amount of included studies
and above-mentioned limitations prohibited to state clear evidence at this point. Therefore,
more studies are needed, expanding upon the investigation of bidirectional relationships
and build up upon the study of Kayani and colleagues [43], investigating the tridirec-
tional relationship between PA, stress, and AP. Hence, to encounter the above discussed
limitations of the current investigation as well as of existing and included examinations,
directions for future research will be systematically compiled below.
(1) Adequate and validated measurement tools should be used. Regarding PA mea-
surement, objective measurement should be the means of choice [66] to conduct a
comprehensive quantification of PA. If for feasibility reasons or large sample size
requirements PA has to be measured by self-report, validated tools like the IPAQ [45]
should be used instead of single items to increase study quality. Regarding stress
measurement, a more comprehensive assessment method should be used which also
includes objective measures like cortisol to determine real stress exposure as com-
pared to perceived stress because this of the higher relevance from a physiological
perspective on stress and health (e.g., [67,68]). Regarding AP measurement, futureInt. J. Environ. Res. Public Health 2021, 18, 739 15 of 18
studies should either use objective measures which can display the overall AP or
should collect to the AP data which is directly associated to the measured stress
period.
(2) All variables should not only be assessed, but their relations should be analyzed in
terms of bi- and tridirectional relationships. Possibly, a theoretical foundation should
be used to investigate moderating or mediating effects of one or more variables. To
enable secondary data analyses, data should be provided by authors upon request, or
should be uploaded for common use in agreement with open science practices.
(3) Future studies should at least control for stressful and non-stressful times during the
semester and therefore control for real-life-stress situations or rather experimentally
manipulate the perceived amount of stress using randomized controlled designs.
(4) In addition, consistent use of terminology should be strived for to encounter misinter-
pretation of findings regarding PA, sports and exercise influences.
(5) Encouraging students to be more physically active could be achieved by awareness
raising campaigns through lecturers and tutors as well as investments in the sports
association and sports facilities at the campus. Following the Okanagan Charter for
Health Promoting Universities and Colleges [69], this approach can strengthen student
health by forming long term health habits [70]. There are plenty of opportunities to
implement PA habits in university students for example by offering sports courses
during the examination period or by providing mobile health interventions, which
are promising new tools in the area of primary prevention [71].
Taken together, there is currently not enough research available to make reliable
statements about the interaction of the three constructs regarding university students.
Therefore, it is recommended to conduct further research in this area in order to raise the
potential of PA as a predictor for AP under consideration of real life stressors.
Supplementary Materials: The following are available online at https://www.mdpi.com/1660-460
1/18/2/739/s1, Table S1: Individual search terms for databases.
Author Contributions: K.W., J.F. and P.B. designed the study, undertook the study selection process,
data extraction, risk of bias assessment, as well as statistical analyses. All authors contributed equally
and wrote the first draft of the manuscript. A.W. critically revised the manuscript and gave useful
comments to further improve study quality. All authors have read and agreed to the published
version of the manuscript.
Funding: This research received no external funding.
Institutional Review Board Statement: Not applicable.
Informed Consent Statement: Not applicable.
Data Availability Statement: The data that support the findings of this study are available from the
corresponding author, upon reasonable request.
Acknowledgments: We acknowledge support by the KIT-Publication Fund of the Karlsruhe Institute
of Technology.
Conflicts of Interest: The authors declare no conflict of interest.
References
1. Stewart-Brown, S.; Evans, J.; Patterson, J.; Petersen, S.; Doll, H.; Balding, J.; Regis, D. The health of students in institutes of higher
education: An important and neglected public health problem? J. Public Health Med. 2000, 22, 492–499. [CrossRef] [PubMed]
2. Pereira, S.; Reay, K.; Bottell, J.; Walker, L.; Dzikiti, C. University Student Mental Health Survey 2018: A Large Scale Study into the
Prevalence of Student Mental Illness within UK Universities. Available online: https://uploads-ssl.webflow.com/561110743bc7
e45e78292140/5c7d4b5d314d163fecdc3706_Mental%20Health%20Report%202018.pdf (accessed on 24 March 2020).
3. Ribeiro, Í.J.; Pereira, R.; Freire, I.V.; de Oliveira, B.G.; Casotti, C.A.; Boery, E.N. Stress and Quality of Life Among University
Students: A Systematic Literature Review. Health Prof. Educ. 2018, 4, 70–77. [CrossRef]
4. Wunsch, K.; Kasten, N.; Fuchs, R. The effect of physical activity on sleep quality, well-being, and affect in academic stress periods.
Nat. Sci. Sleep 2017, 9, 117–126. [CrossRef] [PubMed]Int. J. Environ. Res. Public Health 2021, 18, 739 16 of 18
5. Ahrberg, K.; Dresler, M.; Niedermaier, S.; Steiger, A.; Genzel, L. The interaction between sleep quality and academic performance.
J. Psychiatr. Res. 2012, 46, 1618–1622. [CrossRef] [PubMed]
6. Topham, P.; Moller, N. New students’ psychological well-being and its relation to first year academic performance in a UK
university. Couns. Psychother. Res. 2011, 11, 196–203. [CrossRef]
7. Cohen, S.; Wills, T.A. Stress, social support, and the buffering hypothesis. Psychol. Bull. 1985, 98, 310–357. [CrossRef]
8. Gerber, M.; Pühse, U. Review article: Do exercise and fitness protect against stress-induced health complaints? A review of the
literature. Scand. J. Public Health 2009, 37, 801–819. [CrossRef]
9. Brown, J.D.; Siegel, J.M. Exercise as a buffer of life stress: A prospective study of adolescent health. Health Psychol. 1988, 7, 341–353.
[CrossRef]
10. Lee, E.; Kim, Y. Effect of university students’ sedentary behavior on stress, anxiety, and depression. Perspect. Psychiatr. Care 2019,
55, 164–169. [CrossRef]
11. Klaperski, S.; Seelig, H.; Fuchs, R. Sportaktivität als Stresspuffer. Z. Sportpsychol. 2012, 19, 80–90. [CrossRef]
12. Nguyen-Michel, S.T.; Unger, J.B.; Hamilton, J.; Spruijt-Metz, D. Associations between physical activity and perceived
stress/hassles in college students. Stress Health 2006, 22, 179–188. [CrossRef]
13. Pradhan, G.; Mendinca, N.L.; Kar, M. Evaluation of Examination Stress and Its Effect on Cognitive Function among First Year
Medical Students. J. Clin. Diagn. Res. 2014, 8, BC05-7. [CrossRef] [PubMed]
14. Cadoret, G.; Bigras, N.; Duval, S.; Lemay, L.; Tremblay, T.; Lemire, J. The mediating role of cognitive ability on the relationship
between motor proficiency and early academic achievement in children. Hum. Mov. Sci. 2018, 57, 149–157. [CrossRef] [PubMed]
15. Vaez, M.; Laflamme, L. Experienced stress, psychological symptoms, self-rated health and academic achievement: A longitudinal
study of swedish university students. Soc. Behav. Personal. 2008, 36, 183–196. [CrossRef]
16. Talib, N.; Zia-ur-Rehman, M. Academic performance and perceived stress among university students. ERR 2012, 7, 127–132.
[CrossRef]
17. Rafidah, K.; Azizah, A.; Norzaidi, M.D.; Chong, S.C.; Salwani, M.I.; Noraini, I. Stress and academic performnce: Empirical
evidence from university students. Acad. Educ. Leadersh. J. 2009, 13, 37–51.
18. Castelli, D.M.; Hillman, C.H.; Buck, S.M.; Erwin, H.E. Physical fitness and academic achievement in third- and fifth-grade
students. J. Sport Exerc. Psychol. 2007, 29, 239–252. [CrossRef]
19. Howie, E.K.; Pate, R.R. Physical activity and academic achievement in children: A historical perspective. J. Sport Health Sci. 2012,
1, 160–169. [CrossRef]
20. Taras, H. Physical Activity and Student Performance at School. J. Sch. Health 2005, 75, 214–218. [CrossRef]
21. Donnelly, J.E.; Hillman, C.H.; Castelli, D.; Etnier, J.L.; Lee, S.; Tomporowski, P.; Lambourne, K.; Szabo-Reed, A.N. Physical
Activity, Fitness, Cognitive Function, and Academic Achievement in Children: A Systematic Review. Med. Sci. Sports Exerc. 2016,
48, 1197–1222. [CrossRef]
22. Irwin, J.D. Prevalence of university students’ sufficient physical activity: A systematic review. Percept. Mot. Skills 2004, 98, 927–943.
[CrossRef] [PubMed]
23. Rouse, P.C.; Biddle, S.J.H. An ecological momentary assessment of the physical activity and sedentary behaviour patterns of
university students. Health Educ. J. 2010, 69, 116–125. [CrossRef]
24. Clemente, F.M.; Nikolaidis, P.T.; Martins, F.M.L.; Mendes, R.S. Physical Activity Patterns in University Students: Do They Follow
the Public Health Guidelines? PLoS ONE 2016, 11, e0152516. [CrossRef] [PubMed]
25. Sothmann, M.S.; Buckworth, J.; Claytor, R.P.; Cox, R.H.; White-Welkley, J.E.; Dishman, R.K. Exercise training and the cross-stressor
adaptation hypothesis. Exerc. Sport Sci. Rev. 1996, 24, 267–288. [CrossRef] [PubMed]
26. Wunsch, K.; Wurst, R.; von Dawans, B.; Strahler, J.; Kasten, N.; Fuchs, R. Habitual and acute exercise effects on salivary biomarkers
in response to psychosocial stress. Psychoneuroendocrinology 2019, 216–225. [CrossRef]
27. Moher, D.; Liberati, A.; Tetzlaff, J.; Altman, D.G. Preferred reporting items for systematic reviews and meta-analyses: The PRISMA
statement. BMJ 2009, 339, b2535. [CrossRef] [PubMed]
28. Higgins, J.P.T.; Green, S. Cochrane Handbook for Systematic Reviews of Interventions; Wiley-Blackwell: Chichester, UK; Hoboken NJ,
USA, 2008; ISBN 0470057963.
29. R Core Team. R; R Foundation for Statistical Computing: Vienna, Austria, 2014.
30. Downes, M.J.; Brennan, M.L.; Williams, H.C.; Dean, R.S. Development of a critical appraisal tool to assess the quality of
cross-sectional studies (AXIS). BMJ Open 2016, 6, e011458. [CrossRef]
31. Taylor, M.; Masood, M.; Mnatzaganian, G. Longevity of complete dentures: A systematic review and meta-analysis. J. Prosthet.
Dent. 2020, 1–9. [CrossRef]
32. Peterson, R.A.; Brown, S.P. On the use of beta coefficients in meta-analysis. J. Appl. Psychol. 2005, 90, 175–181. [CrossRef]
33. Lenhard, W.; Lenhard, A. Computation of Effect Sizes. Available online: https://www.psychometrica.de/effect_size.html
(accessed on 15 January 2021).
34. McHugh, M.L. The chi-square test of independence. Biochem. Med. (Zagreb) 2013, 23, 143–149. [CrossRef]
35. Cohen, J. Statistical Power Analysis for the Behavioral Sciences; Elsevier Science: Burlington, NJ, USA, 2013; ISBN 9781483276489.
36. Lovakov, A.; Agadullina, E. Empirically Derived Guidelines for Interpreting Effect Size in Social Psychology. Available online:
https://psyarxiv.com/2epc4/ (accessed on 15 January 2021).
37. Cochran, W.G. The Combination of Estimates from Different Experiments. Biometrics 1954, 10, 101–129. [CrossRef]Int. J. Environ. Res. Public Health 2021, 18, 739 17 of 18
38. Higgins, J.P.T.; Thompson, S.G. Quantifying heterogeneity in a meta-analysis. Stat. Med. 2002, 21, 1539–1558. [CrossRef]
[PubMed]
39. Deeks, J.J.; Higgins, J.P.T.; Altman, D.G.; Cochrane Statistical Methods Group. Chapter 10: Analysing Data and Undertaking
Meta-Analyses. In Cochrane Handbook for Systematic Reviews of Interventions; Version 6.0 (Updated July 2019); Higgins, J.P.T.,
Thomas, J., Chandler, J., Cumpston, M., Li, T., Page, M.J., Welch, V.A., Eds.; Cochrane: London, UK, 2019; Available online:
https://training.cochrane.org/handbook/current/chapter-10 (accessed on 23 April 2020).
40. Viechtbauer, W. Conducting Meta-Analyses in R with the metafor Package. J. Stat. Softw. 2010, 36, 1–48. [CrossRef]
41. Ruthig, J.C.; Marrone, S.; Hladkyj, S.; Robinson-Epp, N. Changes in College Student Health: Implications for Academic
Performance. J. Coll. Stud. Dev. 2011, 52, 307–320. [CrossRef]
42. Rettinger, V.W. The Relationship between Physical Activity, Stress, and Academic Performance. Ph.D. Thesis, University of South
Carolina, Columbia, SC, USA, 2011; p. 2011.
43. Kayani, S.; Kiyani, T.; Wang, J.; Sanchez, M.L.Z.; Kayani, S.; Qurban, H. Physical Activity and Academic Performance: The
Mediating Effect of Self-Esteem and Depression. Sustainability 2018, 10, 3633. [CrossRef]
44. Decamps, G.; Boujut, E.; Brisset, C. French college students’ sports practice and its relations with stress, coping strategies and
academic success. Front. Psychol. 2012, 3, 104. [CrossRef]
45. Craig, C.L.; Marshall, A.L.; Sjöström, M.; Bauman, A.E.; Booth, M.L.; Ainsworth, B.E.; Pratt, M.; Ekelund, U.; Yngve, A.;
Sallis, J.F.; et al. International physical activity questionnaire: 12-country reliability and validity. Med. Sci. Sports Exerc.
2003, 35, 1381–1395. [CrossRef]
46. Cohen, S.; Kamarck, T.; Mermelstein, R. A Global Measure of Perceived Stress. J. Health Soc. Behav. 1983, 24, 385. [CrossRef]
47. Boujut, E.; Bruchon-Schweitzer, M. A construction and validation of a freshman stress questionnaire: An exploratory study.
Psychol. Rep. 2009, 104, 680–692. [CrossRef]
48. Kohn, P.M.; Lafreniere, K.; Gurevich, M. The Inventory of College Students’ Recent Life Experiences: A decontaminated hassles
scale for a special population. J. Behav. Med. 1990, 13, 619–630. [CrossRef] [PubMed]
49. Stallman, H.M.; Hurst, C.P. The University Stress Scale: Measuring Domains and Extent of Stress in University Students. Aust.
Psychol. 2016, 51, 128–134. [CrossRef]
50. Cohen, S.; Janicki-Deverts, D. Who’s Stressed? Distributions of Psychological Stress in the United States in Probability Samples
from 1983, 2006, and 2009. J. Appl. Soc. Psychol. 2012, 42, 1320–1334. [CrossRef]
51. Hagstromer, M.; Ainsworth, B.E.; Oja, P.; Sjostrom, M. Comparison of a subjective and an objective measure of physical activity in
a population sample. J. Phys. Act. Health 2010, 7, 541–550. [CrossRef] [PubMed]
52. Liposek, S.; Planinsec, J.; Leskosek, B.; Pajtler, A. Phyical activity of university students and its relation to physical fitness and
academic success. Ann. Kinesiol. 2018, 9, 89–104. [CrossRef]
53. El Ansari, W.; Stock, C. Relationship between attainment of recommended physical activity guidelines and academic achievement:
Undergraduate students in Egypt. Glob. J. Health Sci. 2014, 6, 274–283. [CrossRef] [PubMed]
54. Shephard, R.J. Habitual physical activity and academic performance. Nutr. Rev. 1996, 54, S32–S36. [CrossRef]
55. Lindner, K.J. The Physical Activity Participation–Academic Performance Relationship Revisited: Perceived and Actual Perfor-
mance and the Effect of Banding (Academic Tracking). Pediatric Exerc. Sci. 2002, 14, 155–169. [CrossRef]
56. Donnelly, J.E.; Lambourne, K. Classroom-based physical activity, cognition, and academic achievement. Prev. Med. 2011, 52
(Suppl. 1), S36–S42. [CrossRef]
57. Takehara, K.; Ganchimeg, T.; Kikuchi, A.; Gundegmaa, L.; Altantsetseg, L.; Aoki, A.; Fukuie, T.; Suwabe, K.; Bat-Erdene, S.;
Mikami, M.; et al. The effectiveness of exercise intervention for academic achievement, cognitive function, and physical health
among children in Mongolia: A cluster RCT study protocol. BMC Public Health 2019, 19, 697. [CrossRef]
58. Wunsch, K.; Meier, M.; Ueberholz, L.; Strahler, J.; Kasten, N. Acute psychosocial stress and working memory performance: The
potential of physical activity to modulate cognitive functions in children. BMC Pediatr. 2019, 19, 271. [CrossRef]
59. Stults-Kolehmainen, M.A.; Sinha, R. The effects of stress on physical activity and exercise. Sports Med. 2014, 44, 81–121. [CrossRef]
[PubMed]
60. Roberti, J.W.; Harringtion, L.N.; Storch, E.A. Further Psychometric Support for the 10-Item Version of the Perceived Stress Scale. J.
Coll. Couns. 2006, 9, 135–147. [CrossRef]
61. Klein, E.M.; Brähler, E.; Dreier, M.; Reinecke, L.; Müller, K.W.; Schmutzer, G.; Wölfling, K.; Beutel, M.E. The German version of the
Perceived Stress Scale—Psychometric characteristics in a representative German community sample. BMC Psychiatry 2016, 16, 159.
[CrossRef] [PubMed]
62. Hanin, Y.L. Emotions in Sport. Individual Zones of Optimal Functioning (IZOF) Model; Human Kinetics: Champaign, IL, USA, 1999;
ISBN 9780880118798.
63. Gerber, M.; Pühse, U. Sportliche aktivität und stressreaktivität: Ein review. Dtsch. Z. Sportmed. 2008, 59, 4–10.
64. Ryan, R.; Cochrane Consumers and Communication Review Group. Cochrane Consumers and Communication Group: Meta-
analysis. Available online: http://cccrg.cochrane.org/sites/cccrg.cochrane.org/files/public/uploads/meta-analysis_revised_
december_1st_1_2016.pdf (accessed on 28 August 2020).
65. Ryan, R.; Hill, S.; Cochrane Consumers and Communication Group. Heterogeneity and Subgroup Analyses: Cochrane Consumers
and Communication Group Reviews: Planning the Analysis at Protocol Stage. Available online: https://figshare.com/articles/
Heterogeneity_and_subgroup_analysis/6818882 (accessed on 28 August 2020).You can also read