Exo-Metabolites of Phaseolus vulgaris-Nodulating Rhizobial Strains - MDPI
←
→
Page content transcription
If your browser does not render page correctly, please read the page content below
H

         OH
               OH
                    metabolites
Article
Exo-Metabolites of Phaseolus vulgaris-Nodulating
Rhizobial Strains
Diana Montes-Grajales 1,2,3 , Nuria Esturau-Escofet 2, * , Baldomero Esquivel 2 and
Esperanza Martinez-Romero 1, *
 1            Centro de Ciencias Genómicas, Universidad Nacional Autónoma de México, Cuernavaca 62210, Mexico
 2            Instituto de Química, Universidad Nacional Autónoma de México, Mexico City 04510, Mexico;
              besquivel@iquimica.unam.mx
 3            Environmental and Computational Chemistry Group, University of Cartagena, Cartagena 130015, Colombia;
              dmontesg@unicartagena.edu.co
 *            Correspondence: nesturau@iquimica.unam.mx (N.E.-E.); emartine@ccg.unam.mx (E.M.-R.);
              Tel.: +52-555-6224770 (ext. 45648) (N.E.-E.); +52-777-3291692 (E.M.-R.)

 Received: 7 February 2019; Accepted: 18 March 2019; Published: 30 May 2019

 Abstract: Rhizobia are able to convert dinitrogen into biologically available forms of nitrogen through
 their symbiotic association with leguminous plants. This results in plant growth promotion, and also in
 conferring host resistance to different types of stress. These bacteria can interact with other organisms
 and survive in a wide range of environments, such as soil, rhizosphere, and inside roots. As most of
 these processes are molecularly mediated, the aim of this research was to identify and quantify the
 exo-metabolites produced by Rhizobium etli CFN42, Rhizobium leucaenae CFN299, Rhizobium tropici
 CIAT899, Rhizobium phaseoli Ch24-10, and Sinorhizobium americanum CFNEI156, by nuclear magnetic
 resonance (NMR). Bacteria were grown in free-living cultures using minimal medium containing
 sucrose and glutamate. Interestingly, we found that even when these bacteria belong to the same
 family (Rhizobiaceae) and all form nitrogen-fixing nodules on Phaseolus vulgaris roots, they exhibited
 different patterns and concentrations of chemical species produced by them.

 Keywords: rhizobia; nitrogen fixation; nuclear magnetic resonance; exo-metabolomics

1. Introduction
     Exo-metabolomics may contribute to the understanding of the bacteria communication
mechanisms through the study of the small-molecules excreted by the cells under determined
conditions [1]. In addition, it can provide useful information on the bacterial uptake or release
of nutrients in culture media, which provides useful insights to study bacterial physiology,
functional genomics, and strain characterization at molecular level [2,3].
     Rhizobia are gram-negative nitrogen-fixing bacteria, belonging to the Rhizobiaceae family
widespread in soils and employed in agriculture as biofertilizer. Rhizobia form symbiotic associations
with leguminous plants promoting their growth through the formation of root nodules, inside which
they reduce dinitrogen providing ammonia to their hosts [4]. This interaction is mediated by signaling
molecules and metabolic pathways [5], which help in sensing the micro-environmental conditions in
the host, and also allow rhizobia to respond to stress conditions and benefit the host by playing a role
in immunity [6].
     Most rhizobia are endosymbionts of leguminous plants, where they enter into the root and
form new organs called nodules in a biochemically orchestrated process. The infection process
occurs mainly through two mechanisms: the entrance of rhizobium by a fissure in the root tissue,
or mediated by flavonoids and nodulation factors, which is the most common [7]. Once inside the root,

Metabolites 2019, 9, 105; doi:10.3390/metabo9060105                                 www.mdpi.com/journal/metabolites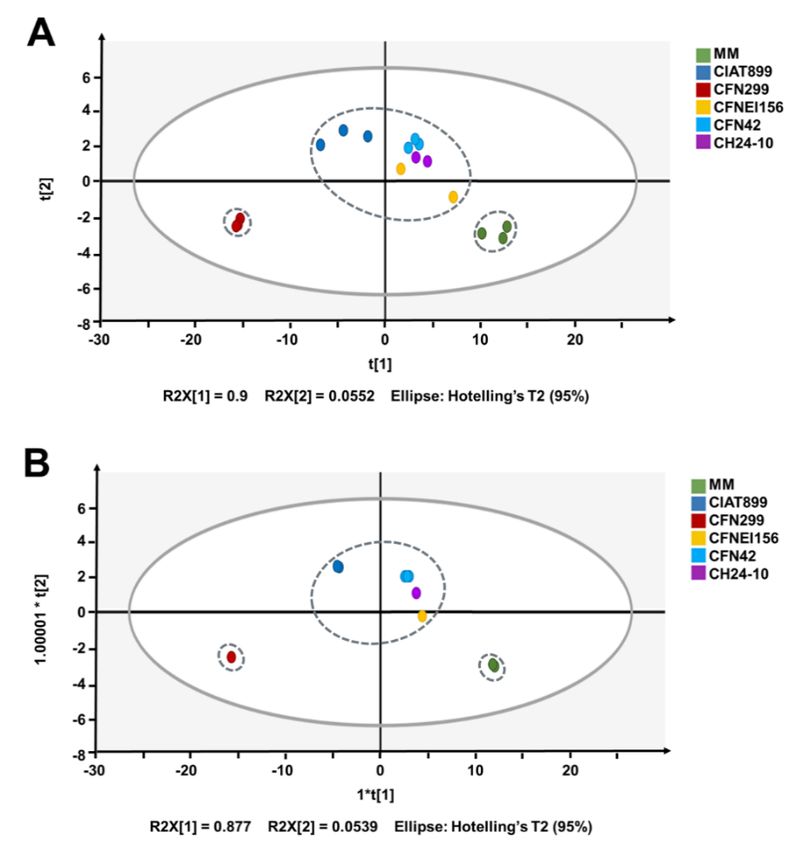
Metabolites 2019, 9, 105                                                                             2 of 13

the differentiation of the epithelium starts to subsequently form nodules. In addition, a peribacteroid
plant-derived membrane is created and rhizobia differentiate into bacteroids, the nitrogen-fixing
form of the bacteria. The nitrogen fixation process requires a huge amount of energy obtained from
adenosine triphosphate (ATP) molecules, to reduce the nitrogen to ammonia, via the nitrogenase
enzyme complex in which several steps of electron transfer occur [8].
      These bacteria can survive in soil and rhizosphere [9], and some of them in contaminated
soils [10,11]. Thus their interactions are not only restricted to the hosts, but also occur with predators
and other rhizobia. This symbiotic association may be host-specific [12]. However, some legumes
are nodulated by multiple bacterial strains, thus selection of highly effective ones is important in the
development of biofertilizers [13].
      Recently, rhizobia have been tested for growth promotion of non-leguminous plants that may
be used for feed or biofuels [9]. Rhizobia can establish associations with rice, maize, wheat,
and other cereals, sometimes as endophytes, without nodule formation, promoting plant growth [14].
Biofertilizers based on rhizobia are becoming an effective tool for sustainable agriculture of leguminous
and non-leguminous plants, by substituting for some agrochemicals. Therefore, the identification of
their exo-metabolites is needed because they are crucial in the symbiotic association, communication
with other organisms, and as growth substrates in the rhizosphere and soil niche [15,16]. There is also
a great lack of knowledge in this area.
      Significant advances in nuclear magnetic resonance (NMR) sensitivity by the development of
associated tools, such as cryoprobes that increase the sensitivity by around 20-fold, have opened
the possibility of identifying and quantifying a broad range of natural compounds [17,18]. It has
benefited the emergence of new fields such as microbial metabolomics [19,20], and in particular the
study the exometabolomes of bacteria without requiring chemical extractions or derivatizations of the
samples [3,21–25]. This non-destructive and highly reproducible technique can detect a wide range of
structural diverse compounds at micromolar concentrations [26]. NMR and mass spectrometry (MS)
are widely used techniques for metabolomics and exo-metabolomics [27–30]. However, they both have
different analytical strength and weaknesses [27]. We used an 1H-NMR exo-metabolomics approach
in this article [19]. This quantitative technique analyzes structurally diverse compounds in a single
run at nearly room temperature [20]. In addition, NMR offers enormous benefits in terms of simple
sample preparation that is important in microbial metabolomics, as bacterial matrices usually contain
compounds that interfere with derivatization [31], sample processing, and analysis [32]. Other benefits
of NMR-based exo-metabolomics compared to MS is its nondestructive and nonequilibrium perturbing
technique [27], as well as its high reproducibility and quantification power [28].
      For many years our focus on rhizobial research has been on the nitrogen-fixing symbionts of
Phaseolus vulgaris (widely consumed as grains for human nutrition), especially Rhizobium phaseoli, R. etli,
R. tropici and R. leucaena. Sinorhizobium americanum, though isolated from acacia plants, is capable of
forming nitrogen-fixing nodules in common bean plants. We chose all of them to evaluate if there were
convergent excreted molecules due to their sharing a legume host. Exo-metabolite analysis by Nuclear
Magnetic Resonance (NMR) is a novel approach in P. vulgaris symbiont research.

2. Results

2.1. Bacterial Growth and Sample Preparation
     A growth curve (OD600 ) and colony forming units (CFUs, Figure S1) of the rhizobial strains
cultured in liquid minimal medium (MM) at 30 ◦ C and 250 rpm) were used to determine adequate
time points for sampling. Based on the data, two time points were selected, one at exponential or late
exponential phase (24 h) and the other at stationary phase (50 h). The CFUs of all the strains were
above 2 × 10⁸ CFU/mL at both sampling times, except for R. phaseoli Ch24-10 at 50 h of growth with
5.0 × 10⁷ CFU/mL.
Metabolites 2019, 9, 105 3 of 13
Metabolites 2019, 9, x 3 of 14
2.2. Exo-Metabolite Identification
2.2. Exo-Metabolite Identification by
by NMR
NMR
A 1
A total
total of
of 37
37 molecules
molecules were
were detected
detected in
in the
the samples
samples by
by 1HH NMR,
NMR, ofof which
which nine
nine were
were from
from the
the
liquid minimal medium (MM) and 28 corresponded to exo-metabolites solely present
liquid minimal medium (MM) and 28 corresponded to exo-metabolites solely present in rhizobia in rhizobia
extracellular
extracellular supernatants. The chemical
supernatants. The chemical shift
shift of
of the
the compounds
compounds used
used for
for identification
identification purposes
purposes are
are
presented in Table S1.
presented in Table S1.
Representative 1 NMR spectra for the rhizobial strains and reference culture medium at 24 h of
Representative 1H H NMR spectra for the rhizobial strains and reference culture medium at 24 h
growth areare
of growth shown in Figure
shown 1. 1.
in Figure
Figure Representative 11H
Figure 1.1. Representative H nuclear
nuclear magnetic
magnetic resonance
resonance (NMR)
(NMR) spectra
spectra (700
(700 MHz,
MHz, 298298 K,
K,
TSP = 1 mM, D O sodium phosphate buffer 0.123 M at pH 7.4) of minimal
TSP = 1 mM, D2O sodium phosphate buffer 0.123 M at pH 7.4) of minimal medium (MM)
2 medium (MM) and
rhizobial strainstrain
and rhizobial cultureculture
supernatants at exponential
supernatants growth (24
at exponential h). Labeled
growth (24 h).metabolites: 1: Formate,
Labeled metabolites:
2: S-Adenosylhomocysteine, 7: Glucose-1-phosphate, 8: Sucrose, 9: Glucose, 10: Maltose, 12: Tartrate,
1: Formate, 2: S-Adenosylhomocysteine, 7: Glucose-1-phosphate, 8: Sucrose, 9: Glucose, 10:
13: Pyroglutamate, 14: Gluconate, 15: Methanol, 16: Dimethyl sulfone, 17: Malonate, 18: Ornithine,
Maltose, 12: Tartrate, 13: Pyroglutamate, 14: Gluconate, 15: Methanol, 16: Dimethyl sulfone,
19: 2-Oxoglutarate, 20: N,N-Dimethylglycine, 21: Aspartate, 22: Glutamate, 23: Acetone, 24: Methionine,
17: Malonate, 18: Ornithine, 19: 2-Oxoglutarate, 20: N,N-Dimethylglycine, 21: Aspartate, 22:
25: Homoserine, 26: Acetate, 27: Alanine, 28: Threonine, 29: Lactate, 30: 3-Hydroxy-3-methylglutarate,
Glutamate, 23: Acetone, 24: Methionine, 25: Homoserine, 26: Acetate, 27: Alanine, 28:
31: 3-Hydroxyisovalerate, 32: 3-Hydroxybutyrate, 33: Ethanol, 35: Valine, 36: 3-Methylglutarate,
Threonine, 29: Lactate, 30: 3-Hydroxy-3-methylglutarate, 31: 3-Hydroxyisovalerate, 32: 3-
and 37: Caprylate.
Hydroxybutyrate, 33: Ethanol, 35: Valine, 36: 3-Methylglutarate, and 37: Caprylate.
The recorded 1 H NMR spectra of extracellular cultures of the five strains at 50 h exhibited a
The recorded
significant variationHofNMR
1 spectra with
the signals, of extracellular cultures
a clear decrease of of the five
sucrose in strains
some ofatthem.
50 h exhibited
Methanol, a
significant variation of the signals, with a clear decrease of sucrose in some of them. Methanol,
and other compounds such as malonate, alanine, and threonine, appear to be present at 50 h but not and
other
at 24 hcompounds such asRepresentative
for some strains. malonate, alanine, andof
spectra threonine, appear to beand
the exo-metabolites present at 50 h
reference MMbutat
not
50ath 24
is
h for some
presented strains.2;Representative
in Figure spectra those
the numbers represent of the exo-metabolites
molecules that wereand reference
not present in MM at 50 h of
the spectrum is
presented in Figure
the same strain at 24 h.2; the numbers represent those molecules that were not present in the spectrum
of the same strain at 24 h.2D-NMR recorded spectra were analyzed with Chenomx (Chenomx Inc., Edmonton, AB,
Canada) for accurate assignment and identification of the exo-metabolites. This was exceptionally
useful in crowded regions to clarify the multiplicity and number of signals through 2D J-resolved
spectra (JRES) spectra, as well as to determine the association between peaks. Lactate, aspartate,
sucrose, glutamate, and pyroglutamate were confirmed by the correlation of signals in correlation
Metabolites 2019, 9, 105 4 of 13
spectroscopy (COSY) NMR spectra (Figure S2).
1 H1 NMR spectra (700 MHz, 298K, TSP = 1 mM, D O sodium phosphate
Figure
Figure 2.2. Representative
Representative H NMR spectra (700 MHz, 298K, TSP = 12 mM, D2O sodium
buffer 0.123M
phosphate at pH
buffer 7.4) ofatMM
0.123M pH and
7.4) rhizobial
of MM and strains culture strains
rhizobial supernatant at stationary
culture supernatant phase
at
(50 h), the phase
stationary compounds(50 h),that
thewere only detected
compounds at thisonly
that were sampling timeatinthis
detected comparison
samplingtotimespectra
in
of rhizobial strains
comparison at 24 hofofrhizobial
to spectra growth are shown.
strains at Labeled metabolites:
24 h of growth 3: Oxypurinol,
are shown. Labeled 4: metabolites:
UDP-glucose,
5: Phenylalanine, 6: Tyrosine, 11: Trehalose, 15: Methanol, 17: Malonate, 27:
3: Oxypurinol, 4: UDP-glucose, 5: Phenylalanine, 6: Tyrosine, 11: Trehalose, 15: Methanol, Alanine, 28: Threonine,
32: 3-Hydroxybutyrate, 34: 3-hydroxyisobutyrate, and 36: 3-Methylglutarate.
17: Malonate, 27: Alanine, 28: Threonine, 32: 3-Hydroxybutyrate, 34: 3-hydroxyisobutyrate,
and 36: 3-Methylglutarate.
2D-NMR recorded spectra were analyzed with Chenomx (Chenomx Inc., Edmonton, AB, Canada)
for accurate assignment and identification of the exo-metabolites. This was exceptionally useful in
2.3. Statistical
crowded Analysis
regions to clarify the multiplicity and number of signals through 2D J-resolved spectra (JRES)
spectra, as well as
Certain moleculesto determine
appearedthe association
and others werebetween peaks. Lactate,
not detected or changedaspartate, sucrose, glutamate,
their concentration at 50
hand
in pyroglutamate
contrast with the were NMRconfirmed by the correlation
data recorded at 24 h ofofgrowth.
signals In
in correlation
order to betterspectroscopy
visualize (COSY)
this, a
NMR spectra
heatmap with (Figure
clusteringS2).trees on top is presented in Figure 3, which is based on the exo-metabolites
concentrations determined by Chenomx (Chenomx Inc.) using 1H NMR spectra (Tables S2 and S3).
2.3. Statistical
To evaluate Analysis
variations between biological replicates and the extracellular medium of the
different rhizobial
Certain strains
molecules according
appeared to theirwere
and others NMR notspectra,
detecteda ormultivariate
changed their analysis was carried
concentration at 50out.
h in
Principal component
contrast with the NMRanalysis (PCA)at and
data recorded 24 h oforthogonal
growth. Inpartial
order toleast
bettersquares-discriminant
visualize this, a heatmapanalysis
with
(OPLS-DA) of 1H
clustering trees onNMR
top isspectra
presented showed a clear
in Figure discrimination
3, which is based onbetween MM (negative-control)
the exo-metabolites and
concentrations
samples
determined (Figure 4B), with
by Chenomx a R2X (cum)
(Chenomx Inc.) using 1
of 0.981 and 0.999,
H NMR spectraand Q2 S2
(Tables (cum) of 0.957 and 0.841,
and S3).
respectively.
To evaluateThevariations
sample corresponding
between biologicalto R. leucaenae
replicatesCFN 299extracellular
and the was differentmedium
from the of others, with
the different
the lowest concentration of sucrose and glutamate, which are two of the most concentrated
rhizobial strains according to their NMR spectra, a multivariate analysis was carried out. Principal molecules
in the rest ofanalysis
component the samples
(PCA)(Figure 3).
and orthogonal partial least squares-discriminant analysis (OPLS-DA) of 1 H
NMR spectra showed a clear discrimination between MM (negative-control) and samples (Figure 4B),
with a R2X (cum) of 0.981 and 0.999, and Q2 (cum) of 0.957 and 0.841, respectively. The sample
corresponding to R. leucaenae CFN 299 was different from the others, with the lowest concentration of
sucrose and glutamate, which are two of the most concentrated molecules in the rest of the samples
(Figure 3).
One-dimensional analysis of variance (ANOVA) showed that significant differences existed in
the concentrations of the detected compounds at 24 h, except for ethanol, N,N-dimethylglycine and
pyroglutamate, which are suspected to be impurities of the MM. In addition, Tukey’s HSD post-hoc
tests with 95% confidence interval were used to evaluate the concentration differences in molecules
detected in both MM and bacterial supernatants (Table S4).Metabolites 2019, 9, 105 5 of 13
Metabolites 2019, 9, x 5 of 14
Figure 3. Heatmap and clustering trees based on the concentration profiles of the molecules
Figure 3. Heatmap andinclustering
found supernatants trees
either based
producedonbythe concentration
rhizobial profiles
strains or from the MM of the molecules
(devoid of found in
supernatants either produced
bacteria) byh rhizobial
at: (A) 24 and (B) 50 h strains
of growth.or from the MM (devoid of bacteria) at: (A) 24 h and
(B) 50 h of growth.
Metabolites 2019, 9, x 6 of 14
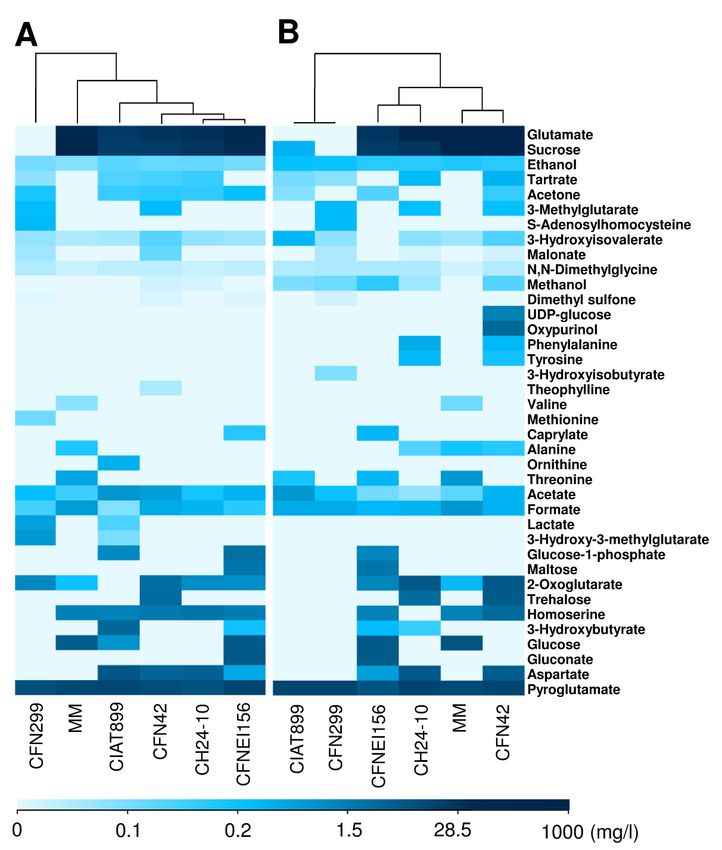
Figure 4. ScoreFigure
plots4. Score
of (A)plots of (A) principal component analysis (PCA) and (B) orthogonal partial
principal component analysis (PCA) and (B) orthogonal partial least
least squares-discriminant analysis (OPLS-DA) of the 1H NMR spectra of the five rhizobial
squares-discriminant analysis 1
strains and MM. (OPLS-DA) of the H NMR spectra of the five rhizobial strains and MM.
One-dimensional analysis of variance (ANOVA) showed that significant differences existed in
the concentrations of the detected compounds at 24 h, except for ethanol, N,N-dimethylglycine and
pyroglutamate, which are suspected to be impurities of the MM. In addition, Tukey’s HSD post-hoc
tests with 95% confidence interval were used to evaluate the concentration differences in molecules
detected in both MM and bacterial supernatants (Table S4).
3. DiscussionMetabolites 2019, 9, 105 6 of 13
3. Discussion
The increase in NMR sensitivity allows the study of microbial exo-metabolomes without
requirements of extraction or derivatization of the samples. In this research, we identified and quantified
the extracellular metabolites of five rhizobial strains by NMR, with the minimum concentration of a
detected compound at 0.018 mg/L. Most of the identified compounds were related to fermentative
metabolism and stress resistance.
The exo-metabolomic profile of the distinct strains was found to be diverse, but remarkably
related strains had a tendency to share common patterns, as observed in R. phaseoli and R. etli which
are closely related species. However this is not observed in R. tropici and R. leucaenae, which belong to
the tropici group, but belong to two different types having significant phenotypic differences [33]. It is
notable that R. leucaenae exo-metabolites are notably different from the other rhizobial strains, maybe in
relation to the optimal growth of the bacteria in the minimal medium that was originally designed to
grow the R. leucaenae strain CFN299. A further analysis with more strains from each species will help
to define if the exo-metabolomic profile is species or strain specific.
The only compound that was excreted by all of the tested rhizobial strains at 24 h was acetone
at concentrations ranging from 0.21 to 0.34 mg/L. However, this was not detected or had lower
concentrations in most of the strains at 50 h of growth. This product of bacterial fermentation,
has also been reported as a microbial carbon source in some gram-positive bacteria [34]. Tartrate,
a C4-dicarboxylate, was excreted by all the strains at 24 h except by Sinorhizobium americanum CFNEI156.
On the other hand, aspartate was released in high amounts (0.74–16.58 mg/L) from all the strains
except by R. leucaenae CFN299T . It has been observed that this amino acid stimulates nitrogen fixation
of bacteroids isolated from soybean root nodules [35].
R. leucaenae CFN299 was the only strain that totally consumed the glutamate and sucrose provided
in the MM at 24 h. Glutamate concentrations in the culture medium after 24 h were 505.73 to 635.38 mg/L,
compared to 800.65 mg/L in the MM. In contrast, sucrose concentrations in the culture medium ranged
from 275.31 to 626.78 mg/L at 24 h of growth. Besides R. leucaenae CFN299, R. tropici CIAT 899 was the
strain with a low glutamate and sucrose concentration in the final medium.
Ornithine was only detected in the culture supernatant of R. tropici CIAT 899T at 24 h but not at
50 h. This finding is interesting as this strain produces ornithine containing membrane lipids, which are
involved in symbiotic efficiency and resistance to stress conditions, such as acidity [36,37].
R. leucaenae CFN299 was the only strain in which methionine and S-adenosylhomocysteine were
detected at 24 h, and the latter was also present at 50 h of growth. In some rhizobial strains, such as
R. etli, methionine is required for growth and formation of effective nodules [38,39]. This amino
acid is also used as a precursor of ethylene in plants, and has numerous benefits in plant growth
and development [40]. Furthermore, methionine synthase involved in methionine synthesis [41] is
annotated in the genome of R. leucaenae (WP_028752452.1). On the other hand, S-adenosylhomocysteine
is used in the biosynthesis of the membrane lipid phosphatidylcholine by rhizobia [42].
Trehalose was found in Bradyrhizobium japonicum bacteroids [43,44] and in Phaseolus vulgaris
nodulated plants associated with osmotic stress tolerance [45,46] indicating that trehalose is a product
provided to the plant by the bacteria. Trehalose was identified in the culture supernatant of R. etli
CFN42 at 24 h and the genes encoding enzymes of its biosynthetic pathway have been found in this
strain and are likely to be present in most rhizobia [46]. Trehalose was also present in the culture
medium of R. phaseoli Ch24-10 at 50h.
3-hydroxybutyrate was present in supernatants of R. tropici CIAT899 and S. americanum CFNEI156
at 24 h, as well as in R. phaseoli Ch24-10 at 50 h of growth. Poly-3-hydroxybutyrate is one of the major
carbon storage compounds and affects nitrogen fixation in Rhizobium etli [47]. This compound has also
been reported to be accumulated in some rhizobia in free-living state [48], and seems to be a potent
cryoprotectant metabolite produced by several bacteria [49].
Caprylate, gluconate, and maltose were only detected in the culture supernatant of S. americanum
CFNEI 156 at 24 h and 50 h of growth. Caprylate is used against envelope viruses [50], its sodiumMetabolites 2019, 9, 105 7 of 13
salt is an antifungal agent [51], and currently some production processes of this compound include
chain-elongating bacteria [52]. Some bacteria such as Clostridium kluyveri can transform acetate and
ethanol to short- and medium-chain fatty acids such as butyrate, caproate, and caprylate through
chain elongation [53]. This is interesting, as we also found acetate in MM (0.2 mg/L) and in higher
concentrations in the culture medium of all strains at 24 h (0.30–1.17 mg/L). Gluconate has been
observed to be produced from rhizobium and other bacteria metabolism of glucose by glucose
dehydrogenase [54], and is considered responsible for acidifying the rhizosphere [55].
Glucose-1-phosphate was present in CIAT899 and CFNEI156 supernatants at 24 h of growth and
only in the latter at 50 h, with a decrease in concentration. Glucose-1-phosphate has been suggested
as intermediate of exo-polysaccharide formation in rhizobia [56] and in some maltose-assimilating
bacteria [57], which is interesting as maltose production was also found in S. americanum CFNEI156.
Malonate was present in R. leucaenae CFN299 and R. etli CFN42 supernatants at 24 h and at 50 h
with a reduction in its concentration, and in R. phaseoli Ch24-10 at 50 h of growth. This compound is
produced by plants and seems to have an important role in the legume symbiotic-association with
rhizobia [58,59], and could be produced by a limited number of bacteria as a result of the degradation
of pyrimidines and purines [60].
Dimethyl sulfone was detected in R. leucaenae CFN299, S. americanum CFNEI156, and R. etli CFN42
at 24 h, and only in CFN299 at 50 h. Sinorhizobium sp. KT 55 has been reported to use dimethyl sulfone
and other compounds as a sole sulfur source, and the bacterium has been proposed as a bioremediator
because of its desulfurization activity, and in particular the degradation of benzothiophene, useful in
petroleum processing to avoid acid rain [61].
3-methylglutarate was present in R. leucaenae CFN299 and R. etli CFN42. Besides,
3-hydroxy-3-methylglutarate and lactate were detected in R. leucaenae CFN299 and R. tropici CIAT
899. Lactate is a byproduct of the carbon metabolism in rhizobia, as well as oxaloacetate, ethanol,
malate, succinate, or L-alanine [62]. The gene encoding lactate dehydrogenase, an enzyme involved
in producing lactate [63], is present in the genomes of R. leucaenae (WP_028754357.1) and R. tropici
(WP_015341529.1). On the other hand, 3-hydroxy-3-methylglutarate has been proposed as a mediator
in the synthesis of polyketides, such as mupirocin in Pseudomonas, using acetate as a starting material,
with the involvement of other molecules such as S-adenosyl-methionine in the biosynthesis process [64].
This is interesting as it has been hypothesized that polyketides may have a role in the host specify
association of rhizobia [65]. Furthermore, we found that the culture medium of R. leucaenae CFN299 at
24 h contains acetate, 3-hydroxy-3-methylglutarate, and S-adenosylhomocysteine, which is formed by
the demethylation of S-adenosyl methionine. These metabolites could be involved in the formation of
polyketides in this strain.
Some compounds were not detected in the culture medium of the strains at 24 h but at 50 h (Figure 2),
and vice versa. Among the compounds that were detected at 50 h in contrast with the spectrum of
the same strain at 24 h were: oxypurinol, UDP-glucose, phenylalanine, tyrosine, trehalose, methanol,
malonate, alanine, threonine, 3-hydroxybutyrate, 3-hydroxyisobutyrate, and 3-methylglutarate.
However, further studies are recommended to establish which of these molecules could be released by
cellular lysis or through micro-vesicles secreted by rhizobia.
Oxypurinol is produced by CFN42 and maybe a scavenger of the highly reactive hydroxyl radical
and a metabolite of allopurinol [66]. These products seem to be released in hypoxic conditions and
inhibit the nitrogenase activity in established nodules of cowpea plants, which could be reversed
by increasing the oxygen concentration [67]. In Escherichia coli, UDP-glucose acts as signaling
molecule in the control of the expression of genes related to osmotic regulation and induction of
the stationary-phase [68]. Phenylalanine is a precursor of flavonoids biosynthesis in plants [69].
Rhizobia are not tyrosine auxotrophs thus they have all enzymes to produce it. In addition, this amino
acid has been described as a precursor in the synthesis of the black pigment melanine in R. etli
CFN42 [70,71]. In agreement with that, we found this aromatic amino acid in the extracellular medium
of CFN42, but also of Ch24-10 at 50 h. In other bacteria, glucose-1-phosphate and UDP-glucoseMetabolites 2019, 9, 105 8 of 13
have been reported to be intermediates in the biosynthesis of exopolysaccharides [72]. In addition,
UDP-glucose 4-epimerase GalE (WP_012482602.1) and UTP-glucose-1-phosphate uridylyltransferase
GalU (WP_041683936.1) have been found in Rhizobium sp., which may be involved in UDP-glucose
biosynthesis [73]. Interestingly, all tested rhizobial strains produced methanol at 50 h of growth.
This compound has been described as carbon source for the methylotrophic Methylobacterium [74].
The compounds consumed, transformed, or degraded by at least one strain at 50 h
that were identified in the spectrum of the same strain at 24 h were glutamate, acetone,
3-hydroxyisovalerate, dimethyl sulfone, methionine, ornithine, glucose-1-phosphate, 2-oxoglutarate,
3-hydroxy-3-methylglutarate, lactate, homoserine, 3-hydroxybutyrate, glucose, and aspartate (Figure 3).
According to the heatmap and clustering tree generated in R using the concentrations of identified
compounds (Figure 3), as well as the OPLS-DA analysis based on the metabolic footprinting of the
strains (Figure 4), rhizobial strains exhibit commonalities and differences between them, not only in
terms of the concentration ranges but in the compounds consumed and generated. Such differences
between strains may be conferring them distinct phenotypical features. Some of the identified
compounds are related to carbon metabolism, stress resistance, and symbiotic efficiency, among others.
Further studies on the role of the released compounds of rhizobia in symbiosis, plant growth promotion,
or bioremediation are needed. This first study of the exo-metabolites of rhizobia by 1H NMR opens the
possibility to use similar approaches to identify exo-metabolites from rhizobia using different culture
media composition or oxygen levels. A joint transcriptomic analysis would allow us to correlate
bacterial gene expression with metabolite production.
4. Materials and Methods
4.1. Bacterial Growth and Sample Preparation
The nitrogen-fixing rhizobial strains used in this study were Rhizobium etli CFN 42T ,
Rhizobium leucaenae CFN 299T , Rhizobium tropici CIAT 899T , Rhizobium phaseoli Ch24-10,
and Sinorhizobium americanum CFNEI 156T .
Each rhizobial strain was grown separately on peptone yeast (PY) agar (peptone, 5 g; yeast extract,
3 g; CaCl2 , 0.6 g; agar, 18 g per L) for 2 days. They were precultured by triplicate in 30 mL of MM:
K2 HPO4 3.8 g/L, KH2 PO4 3 g/L, sucrose 1 g/L, glutamate 1 g/L, MgSO4 ·7H2 O 0.1 g/L, CaCl2 0.1 g/L,
H3 BO3 2.86 mg/L, ferric citrate 5 mg/L, MnSO4 ·4H2 O 2.03 mg/L, ZnSO4 ·7H2 O 0.22 mg/L, CuSO4 ·5H2 O
0.08 mg/L and Na2 MoO4 ·H2O 0.08 mg/L for 48 h at 30 ◦ C with continuous shaking. Three biological
replicates of final bacterial cultures were made by diluting the precultures 1:20 with fresh MM
(OD600 ~ 0.1) to a final volume of 30 mL, and they were kept at 30 ◦ C with continuous shaking. In order
to select the sampling times, growth curves based on the optical density OD600 and colony forming
units (CFU) were determined at 8 h, 24 h, and 50 h.
The rhizobial strains were precultured and cultured by triplicates following the previous protocol,
and samples were taken at 24 h (exponential phase) and 50 h (stationary phase). A volume of 1.5 mL of
the liquid bacterial cultures and MM incubated under the same conditions (control) were transferred
to eppendorf tubes and centrifuged during 10 min at 4000 g, 1 mL of the supernatant was taken and
lyophilized to dryness.
4.2. Exo-Metabolite Identification by NMR
The equipment we used was a 700 MHz NMR spectrometer equipment CryoProbe (Bruker,
Fällanden, Switzerland) which improves the sensitivity and provides highly reproducible data,
useful for multivariate statistical methods [31].
A total of 24 samples were processed: three biological replicates of the culture supernatants of
five rhizobial strains and MM at 24 h, and one replicate of each at 50 h of incubation. The freeze-dried
extracellular cultures and MM were separately dissolved in 600 µL of D2 O sodium phosphate buffer
0.123M at pH 7.4 with 1 mM of sodium salt of trimethylsilylpropionic acid (TSP) as internal standard.Metabolites 2019, 9, 105 9 of 13
NMR analysis was carried out on an Avance III HD 700 spectrometer at 298 K with a 1 H frequency of
699.95 MHz (Bruker, Billerica, MA, USA) equipped with a 5-mm z-axis gradient TCI cryogenic probe.
1D 1 H NMR spectra were acquired by using the standard NOESY-1D pulse sequence (Bruker
program noesypr1d) that allows water suppression maintaining the intensity of most of the remaining
signals [75]. Water resonance was irradiated during relaxation delay (RD) of 4.0 s and mixing time
of 10 ms. Each spectrum consisted of 256 scans with 14 kHz spectral width, 64 k data points and
an acquisition time of 2.3 s. An exponential line-broadening factor of 0.3 Hz was applied to the free
induction decays (FID) before Fourier transformation.
Additionally, 2D-NMR experiments were carried out on representative samples to confirm chemical
shift assignments, including JRES, COSY, total correlation spectroscopy (TOCSY), heteronuclear multiple
bond correlation (HMBC), heteronuclear single quantum coherence spectroscopy (HSQC), and diffusion
ordered NMR spectroscopy (DOSY).
NMR data were recorded using Topspin v 3.5.6 and processed using MestReNova v. 12.0
(MestreLab Research SL., Santiago de Compostela, Spain). Phase and baseline were corrected
manually, and TSP chemical shift referenced to 0.000 ppm.
1 H NMR raw data were used as input to Chenomx NMR Suite v. 8.31 (Chenomx Inc., Edmonton,
AB, Canada) for identification and quantification of the extracellular metabolites in the rhizobial
strains and the molecules present in the MM in each of the biological replicates at 24 h and 50 h of
growth. Chenomx Processor was used to manually adjust the phase and baseline of each spectrum,
with the following parameters, TSP concentration: 1 mM, pH: 7.4 ± 0.50 and line broadening: 0.30 Hz.
Water regions were removed and the chemical shape indicator (CSI) adjusted to the TSP 1 mM peak.
Once prepared, these spectra were charged to Chenomx Profiler for the identification of small-molecules
based on the location of their resonances on the 700-MHz 1H-NMR spectra. This software is linked to
a database containing the NMR spectral signatures of more than 250 compounds.
4.3. Statistical Analysis
Based on the quantification of the compounds in the extracellular culture medium by 1 H NMR
and Chenomx software v. 8.31 (Chenomx Inc., Edmonton, AB, Canada), heatmaps for exo-metabolites
at 24 h and 50 h were built using the “heatmap.2” function of the gplots 3.0.1 library [76] of R version
3.5.1. [77]. Due to the broad dispersion of the data, the color breaks were set up according to quantiles,
in which dark blue represent those molecules with the highest concentration. Dendrograms were
added on top of the heatmaps for comparison purposes between strains.
Spectra of rhizobium strains and their replicates at 24 h were reduced to ASCII format. These were
previously processed by MestreNova software v. 12.0 (MestreLab Research SL., Santiago de Compostela,
Spain) through phase and baseline correction, normalization at TSP (0.000 ppm), water region
suppression (4.730–4880 ppm) and superposition of the spectra. In the region from −0.5 to 10.0 ppm,
1H-NMR spectra were split in regions of width: 0.06 ppm, giving a total of 258 spectral segments per
spectrum (bins) by using Chenomx software v. 8.31 (Chenomx Inc., Edmonton, AB, Canada). These data
were used for multivariate analysis (MVDA) with SIMCA 14.1.0.2047 software (MKS Umetrics, Malmö,
Sweden).
To identify differences in the exo-metabolomics profiles of the five rhizobial strains,
principal component analysis (PCA), orthogonal partial least squares-discriminant analysis (OPLS-DA),
and score plots of the binned spectral data were generated in SIMCA 14.1.0.2047 software (MKS Umetrics,
Sweden) by pareto scaling. Data were organized in six classes—five strains and the control—and
replicates were considered as observations of the same group. In addition, ANOVA and Tukey’s HSD
post-hoc tests were performed in R version 3.5.1. [77] to evaluate if significant differences exist between
the concentrations of the molecules detected in MM and bacterial supernatants. Outliers were removed.
Supplementary Materials: The following are available online at http://www.mdpi.com/2218-1989/9/6/105/s1,
Figure S1: (a) Growth curve based on optical density (OD600 ) at logarithmic scale and (b) colony formation units;
Figure S2: Representative 1 H 2-D COSY NMR spectra of the (a) MM, and the culture medium of the strains (b)Metabolites 2019, 9, 105 10 of 13
CFN299 and (c) ch24-10; Table S1: Chemical shifts of the compounds identified by 1 H NMR (700 MHz, 298K,
TSP = 1 mM, D2 O sodium phosphate buffer 0.123M at pH 7.4). TSP was used as internal standard and referenced
to chemical shift 0.000 ppm; Table S2: Concentrations of the detected molecules by 1 H NMR (700 MHz, 298K,
TSP = 1 mM, D2 O sodium phosphate buffer 0.123M at pH 7.4) in the MM and bacterial culture supernatants at
24 h of incubation; Table S3: Concentrations of the detected molecules by 1 H NMR (700 MHz, 298K, TSP = 1
mM, D2 O sodium phosphate buffer 0.123M at pH 7.4) in the MM and bacterial culture supernatants at 50 h of
incubation. Table S4. Results of one-way ANOVA (p-values) and Tukey´s HSD post hoc test with 95% confidence
interval (p-values adjusted) calculated in R.
Author Contributions: Conceptualization, D.M.-G., N.E.-E., B.E., and E.M.-R.; methodology, D.M.-G., N.E.-E.,
B.E., and E.M.-R.; formal analysis, D.M.-G., N.E.-E., B.E., and E.M.-R.; investigation, D.M.-G. and N.E.-E.; resources,
N.E.-E. and E.M.-R.; writing—original draft preparation, D.M.-G., N.E.-E., and E.M.-R.; writing—review and
editing, D.M.-G., N.E.-E., B.E., and E.M.-R.; supervision, N.E.-E., B.E., and E.M.-R.; project administration, E.M.-R.;
funding acquisition, N.E.-E., B.E., and E.M.-R.
Funding: This research was funded by Universidad Nacional Autónoma de México [Grant: Programa de Becas
Posdoctorales en la UNAM 2016 to D. M-G] and CONACyT [Grant: 253116]. This study made use of UNAM’s
NMR lab: LURMN at IQ-UNAM, which is funded by CONACYT Mexico (Project: 0224747) and UNAM.
Acknowledgments: The authors thank Marco Antonio Rogel, Julio Martínez, Laura Cervantes (CCG-UNAM),
Circe Hernández-Espino, Beatriz Quiroz García (LURMN-IQ-UNAM), Mayra León Santiago, and Everardo Tapia
(LANCIC-IQ-UNAM) for their technical assistance, and Michael Dunn for reading the manuscript.
Conflicts of Interest: The authors declare no conflict of interest.
References
1. Mapelli, V.; Olsson, L.; Nielsen, J. Metabolic footprinting in microbiology: Methods and applications in
functional genomics and biotechnology. Trends Biotechnol. 2008, 26, 490–497. [CrossRef] [PubMed]
2. Behrends, V.; Williams, H.D.; Bundy, J.G. Metabolic footprinting: Extracellular metabolomic analysis.
In Pseudomonas Methods and Protocols; Filloux, A., Ramos, J.-L., Eds.; Springer New York: New York, NY,
USA, 2014; pp. 281–292.
3. Palama, T.L.; Canard, I.; Rautureau, G.J.; Mirande, C.; Chatellier, S.; Elena-Herrmann, B. Identification of
bacterial species by untargeted NMR spectroscopy of the exo-metabolome. Analyst 2016, 141, 4558–4561.
[CrossRef]
4. Guinel, F.C. Ethylene, a hormone at the center-stage of nodulation. Front. Plant Sci. 2015, 6, 21. [CrossRef]
5. Peix, A.; Velazquez, E.; Silva, L.R.; Mateos, P.F. Key Molecules Involved in Beneficial Infection Process in
Rhizobia-Legume Symbiosis; Springer-Verlag Wien: Vienna, Austria, 2010; pp. 55–80.
6. Gibson, K.E.; Kobayashi, H.; Walker, G.C. Molecular determinants of a symbiotic chronic infection. In Annual
Review of Genetics; Annual Reviews: Palo Alto, CA, USA, 2008; Volume 42, pp. 413–441.
7. Poole, P.; Ramachandran, V.; Terpolilli, J. Rhizobia: From saprophytes to endosymbionts. Nat. Rev. Microbiol.
2018, 16, 291. [CrossRef]
8. Mitsch, M.J.; diCenzo, G.C.; Cowie, A.; Finan, T.M. Succinate transport is not essential for symbiotic nitrogen
fixation by Sinorhizobium meliloti or Rhizobium leguminosarum. Appl. Environ. Microbiol. 2018, 84, 15.
[CrossRef] [PubMed]
9. Janczarek, M. Environmental signals and regulatory pathways that influence exopolysaccharide production
in rhizobia. Int. J. Mol. Sci. 2011, 12, 7898–7933. [CrossRef]
10. Arora, N.K.; Khare, E.; Singh, S.; Maheshwari, D.K. Effect of Al and heavy metals on enzymes of nitrogen
metabolism of fast and slow growing rhizobia under explanta conditions. World J. Microbiol. Biotechnol. 2010,
26, 811–816. [CrossRef]
11. Keum, Y.S.; Seo, J.S.; Li, Q.X.; Kim, J.H. Comparative metabolomic analysis of Sinorhizobium sp. C4 during
the degradation of phenanthrene. Appl. Microbiol. Biotechnol. 2008, 80, 863–872. [CrossRef]
12. Janczarek, M.; Rachwal, K.; Marzec, A.; Grzadziel, J.; Palusinska-Szysz, M. Signal molecules and cell-surface
components involved in early stages of the legume-rhizobium interactions. Appl. Soil Ecol. 2015, 85, 94–113.
[CrossRef]
13. Marczak, M.; Mazur, A.; Koper, P.; Zebracki, K.; Skorupska, A. Synthesis of rhizobial exopolysaccharides and
their importance for symbiosis with legume plants. Genes 2017, 8, 24. [CrossRef]
14. Mia, M.B.; Shamsuddin, Z. Rhizobium as a crop enhancer and biofertilizer for increased cereal production.
Afr. J. Biotechnol. 2010, 9, 6001–6009.Metabolites 2019, 9, 105 11 of 13
15. Gemperline, E.; Jayaraman, D.; Maeda, J.; Ane, J.M.; Li, L.J. Multifaceted investigation of metabolites during
nitrogen fixation in medicago via high resolution MALDI-MS Imaging and ESI-MS. J. Am. Soc. Mass Spectrom.
2015, 26, 149–158. [CrossRef]
16. Jacoby, R.P.; Martyn, A.; Kopriva, S. Exometabolomic profiling of bacterial strains as cultivated using
arabidopsis root extract as the sole carbon source. Mol. Plant Microbe Interact. 2018, 31, 803–813. [CrossRef]
17. Dear, G.J.; Roberts, A.D.; Beaumont, C.; North, S.E. Evaluation of preparative high performance liquid
chromatography and cryoprobe-nuclear magnetic resonance spectroscopy for the early quantitative estimation
of drug metabolites in human plasma. J. Chromatogr. B 2008, 876, 182–190. [CrossRef]
18. Molinski, T.F. Nanomole-scale natural products discovery. Curr. Opin. Drug Discov. Dev. 2009, 12, 197–206.
19. Tang, J. Microbial metabolomics. Curr. Genom. 2011, 12, 391–403. [CrossRef]
20. Mashego, M.R.; Rumbold, K.; De Mey, M.; Vandamme, E.; Soetaert, W.; Heijnen, J.J. Microbial metabolomics:
Past, present and future methodologies. Biotechnol. Lett. 2007, 29, 1–16. [CrossRef]
21. Puntus, I.; Sakharovsky, V.; Filonov, A.; Boronin, A. Surface activity and metabolism of hydrocarbon-degrading
microorganisms growing on hexadecane and naphthalene. Process Biochem. 2005, 40, 2643–2648. [CrossRef]
22. Lee, J.-E.; Hwang, G.-S.; Lee, C.-H.; Hong, Y.-S. Metabolomics reveals alterations in both primary and
secondary metabolites by wine bacteria. J. Agric. Food Chem. 2009, 57, 10772–10783. [CrossRef]
23. Murovec, B.; Makuc, D.; Repinc, S.K.; Prevoršek, Z.; Zavec, D.; Šket, R.; Pečnik, K.; Plavec, J.; Stres, B.
1 H NMR metabolomics of microbial metabolites in the four MW agricultural biogas plant reactors: A case
study of inhibition mirroring the acute rumen acidosis symptoms. J. Environ. Manag. 2018, 222, 428–435.
[CrossRef]
24. Hoerr, V.; Duggan, G.E.; Zbytnuik, L.; Poon, K.K.; Große, C.; Neugebauer, U.; Methling, K.; Löffler, B.;
Vogel, H.J. Characterization and prediction of the mechanism of action of antibiotics through NMR
metabolomics. BMC Microbiol. 2016, 16, 82. [CrossRef] [PubMed]
25. Chen, T.; Sheng, J.; Fu, Y.; Li, M.; Wang, J.; Jia, A.-Q. 1 H NMR-based global metabolic studies of pseudomonas
aeruginosa upon exposure of the quorum sensing inhibitor resveratrol. J. Proteome Res. 2017, 16, 824–830.
[CrossRef]
26. Griffith, C.M.; Morgan, M.A.; Dinges, M.M.; Mathon, C.; Larive, C.K. Metabolic profiling of chloroacetanilide
herbicides in earthworm coelomic fluid using 1H NMR and GC-MS. J. Proteome Res. 2018, 17, 2611–2622.
[CrossRef] [PubMed]
27. Beckonert, O.; Keun, H.C.; Ebbels, T.M.; Bundy, J.; Holmes, E.; Lindon, J.C.; Nicholson, J.K. Metabolic
profiling, metabolomic and metabonomic procedures for NMR spectroscopy of urine, plasma, serum and
tissue extracts. Nat. Protoc. 2007, 2, 2692. [CrossRef] [PubMed]
28. Markley, J.L.; Brüschweiler, R.; Edison, A.S.; Eghbalnia, H.R.; Powers, R.; Raftery, D.; Wishart, D.S. The future
of NMR-based metabolomics. Curr. Opin. Biotechnol. 2017, 43, 34–40. [CrossRef] [PubMed]
29. Baharum, S.N.; Azizan, K.A. Metabolomics in systems biology. In Omics Applications for Systems Biology;
Springer: Berlin/Heidelberg, Germany, 2018; pp. 51–68.
30. Wishart, D.S. Quantitative metabolomics using NMR. TrAC Trends Anal. Chem. 2008, 27, 228–237. [CrossRef]
31. Pan, Z.; Raftery, D. Comparing and combining NMR spectroscopy and mass spectrometry in metabolomics.
Anal. Bioanal. Chem. 2007, 387, 525–527. [CrossRef] [PubMed]
32. Koek, M.M.; Muilwijk, B.; van der Werf, M.J.; Hankemeier, T. Microbial metabolomics with gas
chromatography/mass spectrometry. Anal. Chem. 2006, 78, 1272–1281. [CrossRef] [PubMed]
33. Ramírez-Puebla, S.T.; Hernández, M.A.R.; Ruiz, G.G.; Ormeño-Orrillo, E.; Martinez-Romero, J.C.;
Servín-Garcidueñas, L.E.; Núñez-de la Mora, A.; Amescua-Villela, G.; Negrete-Yankelevich, S.;
Martínez-Romero, E. Nodule bacteria from the cultured legume Phaseolus dumosus (belonging to the
Phaseolus vulgaris cross-inoculation group) with common tropici phenotypic characteristics and symbiovar
but distinctive phylogenomic position and chromid. Syst. Appl. Microbiol. 2018, in press.
34. Taylor, D.G.; Trudgill, P.W.; Cripps, R.E.; Harris, P.R. The microbial metabolism of acetone. Microbiology 1980,
118, 159–170. [CrossRef]
35. Kouchi, H.; Fukai, K.; Kihara, A. Metabolism of glutamate and aspartate in bacteroids isolated from soybean
root nodules. Microbiology 1991, 137, 2901–2910. [CrossRef]
36. Rojas-Jiménez, K.; Sohlenkamp, C.; Geiger, O.; Martínez-Romero, E.; Werner, D.; Vinuesa, P. A ClC chloride
channel homolog and ornithine-containing membrane lipids of Rhizobium tropici CIAT899 are involved in
symbiotic efficiency and acid tolerance. Mol. Plant Microbe Interact. 2005, 18, 1175–1185. [CrossRef] [PubMed]Metabolites 2019, 9, 105 12 of 13
37. Vences-Guzmán, M.Á.; Guan, Z.; Ormeño-Orrillo, E.; González-Silva, N.; López-Lara, I.M.;
Martínez-Romero, E.; Geiger, O.; Sohlenkamp, C. Hydroxylated ornithine lipids increase stress tolerance in
Rhizobium tropici CIAT899. Mol. Microbiol. 2011, 79, 1496–1514. [CrossRef] [PubMed]
38. Taté, R.; Riccio, A.; Caputo, E.; laccarino, M.; Patriarca, E.J. The Rhizobium etli metZ gene is essential for
methionine biosynthesis and nodulation of Phaseolus vulgaris. Mol. Plant Microbe Interact. 1999, 12, 24–34.
[CrossRef] [PubMed]
39. Watson, R.J.; Heys, R.; Martin, T.; Savard, M. Sinorhizobium meliloti Cells Require Biotin and either Cobalt or
Methionine for Growth. Appl. Environ. Microb. 2001, 67, 3767–3770. [CrossRef]
40. Szilagyi-Zecchin, V.J.; Mógor, Á.F.; Figueiredo, G.G.O. Strategies for characterization of agriculturally
important bacteria. In Microbial Inoculants in Sustainable Agricultural Productivity: Vol. 1: Research Perspectives;
Singh, D.P., Singh, H.B., Prabha, R., Eds.; Springer India: New Delhi, India, 2016; pp. 1–21.
41. Barra, L.; Fontenelle, C.; Ermel, G.; Trautwetter, A.; Walker, G.C.; Blanco, C. Interrelations between glycine
betaine catabolism and methionine biosynthesis in Sinorhizobium meliloti strain 102F34. J. Bacteriol. 2006, 188,
7195–7204. [CrossRef] [PubMed]
42. de Rudder, K.E.; Sohlenkamp, C.; Geiger, O. Plant-exuded choline is used for rhizobial membrane lipid
biosynthesis by phosphatidylcholine synthase. J. Biol. Chem. 1999, 274, 20011–20016. [CrossRef]
43. Vauclare, P.; Bligny, R.; Gout, E.; Widmer, F. An overview of the metabolic differences between Bradyrhizobium
japonicum 110 bacteria and differentiated bacteroids from soybean (Glycine max) root nodules: An in vitro
13C-and 31P-nuclear magnetic resonance spectroscopy study. FEMS Microbiol. Lett. 2013, 343, 49–56.
[CrossRef]
44. Streeter, J.G. Accumulation of alpha, alpha-trehalose by Rhizobium bacteria and bacteroids. J. Bacteriol. 1985,
164, 78–84.
45. Farías-Rodríguez, R.; Mellor, R.B.; Arias, C.; Peña-Cabriales, J.J. The accumulation of trehalose in nodules of
several cultivars of common bean (Phaseolus vulgaris) and its correlation with resistance to drought stress.
Physiol. Plantarum 1998, 102, 353–359. [CrossRef]
46. McIntyre, H.J.; Davies, H.; Hore, T.A.; Miller, S.H.; Dufour, J.-P.; Ronson, C.W. Trehalose biosynthesis in
Rhizobium leguminosarum bv. trifolii and its role in desiccation tolerance. Appl. Environ. Microbiol. 2007, 73,
3984–3992. [CrossRef]
47. Wang, C.X.; Saldanha, M.; Sheng, X.Y.; Shelswell, K.J.; Walsh, K.T.; Sobral, B.W.S.; Charles, T.C. Roles of
poly-3-hydroxybutyrate (PHB) and glycogen in symbiosis of Sinorhizobium meliloti with Medicago sp.
Microbiology 2007, 153, 388–398. [CrossRef] [PubMed]
48. Kim, S.A.; Copeland, L. Acetyl coenzyme A acetyltransferase of Rhizobium sp. (Cicer) strain CC 1192.
Appl. Environ. Microb. 1997, 63, 3432–3437.
49. Obruca, S.; Sedlacek, P.; Krzyzanek, V.; Mravec, F.; Hrubanova, K.; Samek, O.; Kucera, D.; Benesova, P.;
Marova, I. Accumulation of poly (3-hydroxybutyrate) helps bacterial cells to survive freezing. PLoS ONE
2016, 11, e0157778. [CrossRef]
50. Korneyeva, M.; Hotta, J.; Lebing, W.; Rosenthal, R.; Franks, L.; Petteway, S., Jr. Enveloped virus inactivation
by caprylate: A robust alternative to solvent-detergent treatment in plasma derived intermediates. Biologicals
2002, 30, 153–162. [CrossRef] [PubMed]
51. Alsaeed, T.I. Antibacterial eFFICacy and Discoloration Effect of a Novel Intracanal Antibiotic Dressing.
Ph.D. Thesis, University of Maryland, Baltimore, MD, USA, 2015.
52. Angenent, L.T.; Kucek, L. Methods of and Systems for Producing Caprylic Acid And/Or Caprylate. US Patents
15/607,188, 30 November 2017.
53. Reddy, M.V.; Mohan, S.V.; Chang, Y.-C. Medium-Chain Fatty Acids (MCFA) Production Through Anaerobic
Fermentation Using Clostridium kluyveri: Effect of Ethanol and Acetate. Appl. Biochem. Biotech. 2018, 185,
594–605. [CrossRef] [PubMed]
54. Van Schie, B.; De Mooy, O.; Linton, J.; Van Dijken, J.; Kuenen, J. PQQ-dependent production of gluconic acid
by Acinetobacter, Agrobacterium and Rhizobium species. Microbiology 1987, 133, 867–875. [CrossRef]
55. Giles, C.D.; Hsu, P.-C.; Richardson, A.E.; Hurst, M.R.; Hill, J.E. The role of gluconate production by
Pseudomonas spp. in the mineralization and bioavailability of calcium–phytate to Nicotiana tabacum. Can. J.
Microbiol. 2015, 61, 885–897. [CrossRef] [PubMed]
56. Skorupska, A.; Janczarek, M.; Marczak, M.; Mazur, A.; Król, J. Rhizobial exopolysaccharides: Genetic control
and symbiotic functions. Microb. Cell Fact. 2006, 5, 7. [CrossRef]Metabolites 2019, 9, 105 13 of 13
57. Sjöberg, A.; Hahn-Hägerdal, B. β-Glucose-1-phosphate, a possible mediator for polysaccharide formation in
maltose-assimilating Lactococcus lactis. Appl. Environ. Microb. 1989, 55, 1549–1554.
58. Kim, Y.-S. Malonate metabolism: Biochemistry, molecular biology, physiology, and industrial application.
BMB Rep. 2002, 35, 443–451. [CrossRef]
59. An, J.H.; Lee, H.Y.; Ko, K.N.; Kim, E.-S.; Kim, Y.S. Symbiotic effects of deltamatB Rhizobium leguminosarum bv.
trifolii mutant on clovers. Mol. Cells 2002, 14, 261–266. [PubMed]
60. Vogels, G.v.d.; Van der Drift, C. Degradation of purines and pyrimidines by microorganisms. Bacteriol. Rev.
1976, 40, 403.
61. Tanaka, Y.; Onaka, T.; Matsui, T.; Maruhashi, K.; Kurane, R. Desulfurization of benzothiophene by the
gram-negative bacterium, Sinorhizobium sp. KT55. Curr. Microbiol. 2001, 43, 187–191. [CrossRef] [PubMed]
62. Stowers, M.D. Carbon metabolism in Rhizobium species. Ann. Rev. Microbiol. 1985, 39, 89–108. [CrossRef]
[PubMed]
63. Trinchant, J.C.; Rigaud, J. Lactate dehydrogenase from Rhizobium. purification and role in indole metabolism.
Physiol. Plantarum 1974, 32, 394–399. [CrossRef]
64. El-Sayed, A.K.; Hothersall, J.; Cooper, S.M.; Stephens, E.; Simpson, T.J.; Thomas, C.M. Characterization of
the mupirocin biosynthesis gene cluster from Pseudomonas fluorescens NCIMB 10586. Chem. Biol. 2003, 10,
419–430. [CrossRef]
65. Hopwood, D.A.; Sherman, D.H. Molecular genetics of polyketides and its comparison to fatty acid
biosynthesis. Annu. Rev. Genet. 1990, 24, 37–62. [CrossRef]
66. Moorhouse, P.C.; Grootveld, M.; Halliwell, B.; Quinlan, J.G.; Gutteridge, J.M. Allopurinol and oxypurinol are
hydroxyl radical scavengers. FEBS Lett. 1987, 213, 23–28. [CrossRef]
67. Atkins, C.A.; Sanford, P.J.; Storer, P.J.; Pate, J.S. Inhibition of nodule functioning in cowpea by a xanthine
oxidoreductase inhibitor, allopurinol. Plant Physiol. 1988, 88, 1229–1234. [CrossRef] [PubMed]
68. Böhringer, J.; Fischer, D.; Mosler, G.; Hengge-Aronis, R. UDP-glucose is a potential intracellular signal
molecule in the control of expression of sigma S and sigma S-dependent genes in Escherichia coli. J. Bacteriol.
1995, 177, 413–422. [CrossRef]
69. Recourt, K.; van Tunen, A.J.; Mur, L.A.; van Brussel, A.A.; Lugtenberg, B.J.; Kijne, J.W. Activation of flavonoid
biosynthesis in roots of Vicia sativa subsp. nigra plants by inoculation with Rhizobium leguminosarum biovar
viciae. Plant Mol. Biol. 1992, 19, 411–420.
70. Santos, C.N.S.; Stephanopoulos, G. Melanin-based high-throughput screen for L-tyrosine production in
Escherichia coli. Appl. Environ. Microb. 2008, 74, 1190–1197. [CrossRef]
71. Cubo, M.T.; Buendia-Claveria, A.M.; Beringer, J.E.; Ruiz-Sainz, J.E. Melanin production by Rhizobium strains.
Appl. Environ. Microb. 1988, 54, 1812–1817.
72. Boels, I.C.; Ramos, A.; Kleerebezem, M.; de Vos, W.M. Functional analysis of the Lactococcus lactis galU and
galE genes and their impact on sugar nucleotide and exopolysaccharide biosynthesis. Appl. Environ. Microb.
2001, 67, 3033–3040. [CrossRef]
73. Audy, J.; Labrie, S.; Roy, D.; LaPointe, G. Sugar source modulates exopolysaccharide biosynthesis in
Bifidobacterium longum subsp. longum CRC 002. Microbiology 2010, 156, 653–664. [PubMed]
74. Bourque, D.; Pomerleau, Y.; Groleau, D. High-cell-density production of poly-β-hydroxybutyrate (PHB)
from methanol by Methylobacterium extorquens: Production of high-molecular-mass PHB. Appl. Microbiol.
Biotechnol. 1995, 44, 367–376. [CrossRef]
75. Le Guennec, A.; Tayyari, F.; Edison, A.S. Alternatives to nuclear overhauser enhancement spectroscopy
presat and carr–purcell–meiboom–gill presat for NMR-based metabolomics. Anal. Chem. 2017, 89, 8582–8588.
[CrossRef]
76. Warnes, G.; Bolker, B.; Bonebakker, L.; Gentleman, R.; Huber, W.; Liaw, A. Gplots: Various R Programming
Tools for Plotting Data. 2016. (R package version 3.0.). Available online: https://rdrr.io/cran/gplots/
(accessed on 20 October 2018).
77. Team, R.C. R: A Language and Environment for Statistical Computing. Available online: https://www.gbif.
org/tool/81287/r-a-language-and-environment-for-statistical-computing (accessed on 20 October 2018).
© 2019 by the authors. Licensee MDPI, Basel, Switzerland. This article is an open access
article distributed under the terms and conditions of the Creative Commons Attribution
(CC BY) license (http://creativecommons.org/licenses/by/4.0/).You can also read