Sensing Hydration of Biomimetic Cell Membranes - MDPI
←
→
Page content transcription
If your browser does not render page correctly, please read the page content below
biosensors
Article
Sensing Hydration of Biomimetic Cell Membranes
Madhurima Chattopadhyay *,† , Hanna Orlikowska † , Emilia Krok                                and Lukasz Piatkowski *

                                          Faculty of Materials Engineering and Technical Physics, Institute of Physics, Division of Molecular Physics,
                                          Poznan University of Technology, Piotrowo 3, 60-965 Poznan, Poland; hanna.orlikowska@put.poznan.pl (H.O.);
                                          emilia.krok@put.poznan.pl (E.K.)
                                          * Correspondence: madhurima.chattopadhyay@put.poznan.pl (M.C.); lukasz.j.piatkowski@put.poznan.pl (L.P.)
                                          † These authors contributed equally to this work.

                                          Abstract: Biological membranes play a vital role in cell functioning, providing structural integrity,
                                          controlling signal transduction, and controlling the transport of various chemical species. Owing to
                                          the complex nature of biomembranes, the self-assembly of lipids in aqueous media has been utilized
                                          to develop model systems mimicking the lipid bilayer structure, paving the way to elucidate the
                                          mechanisms underlying various biological processes, as well as to develop a number of biomedical
                                          and technical applications. The hydration properties of lipid bilayers are crucial for their activity in
                                          various cellular processes. Of particular interest is the local membrane dehydration, which occurs
                                          in membrane fusion events, including neurotransmission, fertilization, and viral entry. The lack of
                                          universal technique to evaluate the local hydration state of the membrane components hampers
                                          understanding of the molecular-level mechanisms of these processes. Here, we present a new
                                          approach to quantify the hydration state of lipid bilayers. It takes advantage of the change in the
                                          lateral diffusion of lipids that depends on the number of water molecules hydrating them. Using
                                          fluorescence recovery after photobleaching technique, we applied this approach to planar single and
                                          multicomponent supported lipid bilayers. The method enables the determination of the hydration
                                          level of a biomimetic membrane down to a few water molecules per lipid.


Citation: Chattopadhyay, M.;
                                          Keywords: hydration; lipid mobility; lateral diffusion; FRAP; model biomembrane; solid supported
Orlikowska, H.; Krok, E.; Piatkowski,     lipid bilayer; biological water; hydration sensing
L. Sensing Hydration of Biomimetic
Cell Membranes. Biosensors 2021, 11,
241. https://doi.org/10.3390/
bios11070241                              1. Introduction
                                                Phospholipid membranes are indispensable architectural components of cells, subcel-
Received: 31 May 2021
                                          lular compartments, and nanometer-sized biological objects such as exosomes or viruses [1].
Accepted: 6 July 2021
                                          The basic role of biological membranes is to define boundaries and enable compartmental-
Published: 16 July 2021
                                          ization of different parts of the cell, thus fulfilling a fundamental condition for the existence
                                          of life [2]. Besides providing structural integrity, biological membranes carry out a variety
Publisher’s Note: MDPI stays neutral
                                          of other important functions, including but not limited to, mediating and modulating the
with regard to jurisdictional claims in
                                          transport of ions and sugars, regulating the permeability of nonelectrolytes, and facilitating
published maps and institutional affil-
                                          signal transduction and metabolic reactions [3,4].
iations.
                                                Lipids, due to their amphiphilic nature, spontaneously self-assemble in the aqueous
                                          environment. This efficient self-organization has been widely used to mimic the essential
                                          lipid bilayer structures of biological systems in both basic and applied research. Bilayers
                                          in the form of black lipid membranes, vesicles (free-standing or tethered to supports),
Copyright: © 2021 by the authors.
                                          and planar supported bilayers (interacting directly with a solid substrate or tethered to
Licensee MDPI, Basel, Switzerland.
                                          the substrate) are commonly used as biomimetic membranes [5]. Such model systems,
This article is an open access article
                                          on the one hand, preserve the essential characteristic of the lipid bilayer and, on the
distributed under the terms and
                                          other hand, simplify the biological membrane system so that the roles of the individual
conditions of the Creative Commons
                                          membrane components, as well as their organization and dynamics, can be effectively
Attribution (CC BY) license (https://
creativecommons.org/licenses/by/
                                          explored. Consequently, the use of biomimetic membranes, often integrated with functional
4.0/).
                                          proteins, has proven to be a powerful tool used in drug screening [6–8] and delivery

Biosensors 2021, 11, 241. https://doi.org/10.3390/bios11070241                                           https://www.mdpi.com/journal/biosensors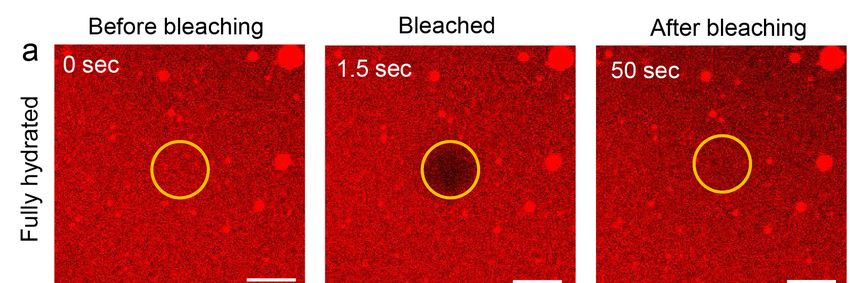
Biosensors 2021, 11, 241                                                                                           2 of 13

                           systems [9,10], artificial cell design [11], nanoreactors [12,13], biosensors [14–16], and the
                           most commercially developed water purification applications [17–19], to name just a few
                           spectacular examples from the very long list reported in the literature.
                                 Essential to the activity of biological and biomimetic membranes are their hydration
                           properties, in which water molecules form partially ordered structures due to dipole in-
                           teractions and hydrogen bonding with the membrane [20–22]. Of particular interest, yet
                           remaining elusive, is the local, temporary membrane dehydration, which is believed to
                           be one of the crucial steps in various biological processes such as adsorption of biomacro-
                           molecules or membrane fusion events. Membrane fusion constitutes a central mechanism
                           in phenomena involving subcellular compartmentalization, cell growth, hormone secretion,
                           neurotransmission, fertilization, viral entry, and exocytosis [1,23]. A certain amount of
                           hydration barrier has to be overcome to initiate the hydrophobic interactions between
                           the two fusing bilayers. To understand the molecular-level mechanism of these cellular
                           processes, information about the local hydration state (i.e., the number of water molecules
                           hydrating a lipid headgroup) of the membrane components at each intermediate step is
                           very important.
                                 For the investigation of phospholipid membrane hydration, different experimental
                           methods have been applied. Among the most widely used, one can mention nuclear
                           magnetic resonance spectroscopy [24], X-ray [25] and neutron [26] diffraction, dielectric
                           relaxation spectroscopy [27,28], quartz crystal microbalance measurements [29], linear
                           and nonlinear infrared spectroscopy [30,31], and various fluorescence microscopy ap-
                           proaches [32–34], often combined with the theoretical simulations [22,35]. In particular,
                           fluorescence methods are convenient tools for studying lipid membranes due to the ex-
                           istence of the ever-expanding palette of fluorescent probes and techniques that allow for
                           data collection over a wide range of spatial and temporal scales. Fluorescence studies
                           aimed at understanding the local hydration state of the lipid membrane rely on dedicated
                           fluorophores, whose spectroscopic and photophysical properties depend on the microen-
                           vironment (so-called environment-sensitive probes), and in particular, on the polarity of
                           the immediate environment in which they are located [33]. As such, various fluorescence-
                           based techniques have flourished such as fluorescent solvent relaxation [36–38], general
                           polarization [39], and red edge excitation shift [40,41]. Although these techniques provide
                           important information about the lipid bilayer hydration, they pose two major inconve-
                           niences, namely the need to know the precise probe location and the challenging process
                           of data correlation, both crucial for drawing valuable conclusions [42,43]. Consequently,
                           it is clear that a novel experimental approach towards molecular-level sensing of local
                           hydration conditions of lipid membranes is needed.
                                 Here, we present a new approach to gain insight into the hydration state of the lipid
                           membranes. It is based on measuring the change in the lateral diffusion coefficient of lipids
                           forming a bilayer, which is dependent on the number of water molecules hydrating the
                           lipids. We illustrate and validate the method using fluorescence recovery after photobleach-
                           ing (FRAP) technique applied to a planar solid-supported lipid bilayer (SLB). Our approach
                           exhibits sensitivity at the quasi-single molecule level, enabling the determination of the hy-
                           dration level of a biomimetic membrane down to a few water molecules per lipid. This new
                           approach has the potential to reveal the local heterogeneity in hydration of biomimetic and
                           biological lipid membranes, and thus sheds light on the processes incorporating changes
                           in membrane hydration, such as membrane fusion.

                           2. Materials and Methods
                           2.1. Materials
                                1,2-dimyristoleoyl-sn-glycero-3-phosphocholine (DMoPC), egg yolk sphingomyelin
                           (SM), and cholesterol were purchased from Avanti Polar Lipids (Alabaster, AL, USA). 1,2-
                           dioleoyl-sn-glycero-3-phosphoethanolamine (DOPE) labeled with Atto 633, sodium chlo-
                           ride (NaCl), and chloroform (HPLC grade) were purchased from Merck KGaA (Darmstadt,
                           Germany). 4-(2-hydroxyethyl)piperazine-1-ethanesulphonic acid (HEPES PUFFERAN® )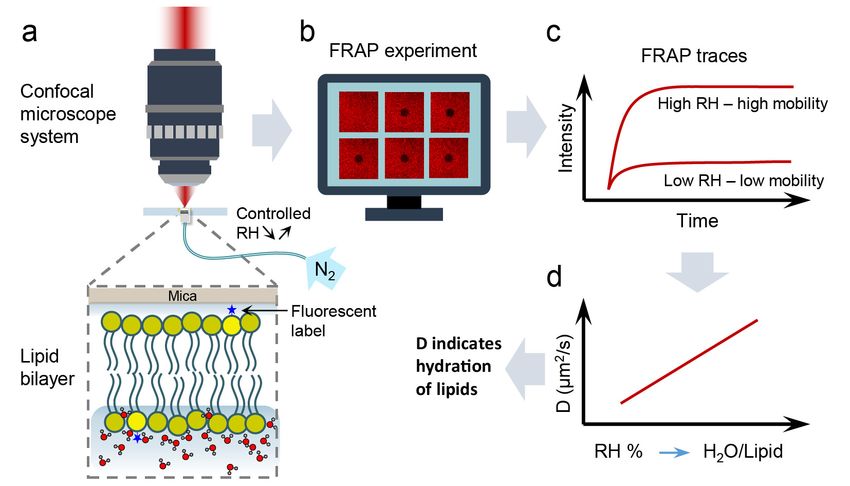
Biosensors 2021, 11, 241                                                                                          3 of 13

                           was obtained from Carl Roth GmbH&Co KG (Karlsruhe, Germany). Calcium chloride
                           (CaCl2 ) was purchased from P.P.H. STANLAB sp. j., Lublin, Poland. Optical adhesive
                           glue Norland 68 was purchased from Thorlabs Sweden AB (Mölndal, Sweden). All the
                           materials were used without further purification. The ultrapure water (ddH2 O) was ob-
                           tained by using Milli-Q reference water purification system from Merck KGaA (Darmstadt,
                           Germany).

                           2.2. Methods
                           2.2.1. SLB Preparation
                                 SLBs were prepared by a widely used vesicle deposition method [44] with required
                           modification. For single component SLBs, 10 mM solution of DMoPC was prepared in
                           chloroform along with 0.1 mol% of DOPE-Atto 633. DMoPC, egg SM, and cholesterol
                           were mixed in 1:1:1 molar ratio with an overall 10 mM lipid concentration, along with
                           0.1 mol% of Atto-633-DOPE, for the preparation of phase-separated SLBs. The chloroform
                           was evaporated by dry nitrogen gas depositing a thin film of lipid at the bottom of the glass
                           vial followed by vacuum desiccation for a minimum of 2 h. After complete evaporation of
                           the organic solvent, a 10 mM suspension of DMoPC multilamellar vesicles (MLVs) was
                           prepared by dissolving the lipid film in a suitable amount of 10 mM HEPES with 150 mM
                           NaCl buffer, adjusted to pH 7.4. The solution was vigorously vortexed and heated to 60 ◦ C
                           to obtain a homogeneous suspension of MLVs. Aliquots of 1 mM lipid concentration were
                           prepared by diluting the solution 10 times with the previously mentioned buffer solution
                           and stored at −20 ◦ C in sterilized glass vials for further use. In order to obtain small
                           unilamellar vesicles (SUVs) from MLVs, the aliquoted lipid solution was bath-sonicated for
                           at least 10 min until the solution became clear. A thin sheet of freshly cleaved mica was
                           glued to a coverslip using UV-activated glue Norland 68. A half-cut Eppendorf tube was
                           attached and sealed with silicone adhesive on top of the coverslip. At room temperature,
                           100 µL of 1 mM SUVs solution was deposited on mica followed by immediate addition of
                           0.2 µL of 0.1 M CaCl2 in a buffer. After 30 s, 400 µL of HEPES-NaCl buffer (pH adjusted to
                           7.4) was added to the sample to prevent drying out of the SLB. The sample was incubated
                           for 30 min at room temperature and then rinsed multiple times with a total of 20 mL of
                           buffer solution. To obtain a fully hydrated sample, the Eppendorf tube sample reservoir
                           was completely filled with buffer, closed with another coverslip, and sealed by silicone
                           adhesive.

                           2.2.2. SLBs Hydration State Control
                                 Precise control over the hydration state of the sample was achieved using a home-built
                           humidity control set-up. Nitrogen gas of desired relative humidity (RH) was purged inside
                           the open half-cut Eppendorf tube of the sample. The relative humidity of the nitrogen gas
                           was regulated by mixing wet (~90% RH) and dry (2%–3% RH) nitrogen with a suitable
                           ratio. The flows of wet and dry N2 gas were individually adjusted using two manual
                           valves while monitoring the readings shown in the two flowmeters connected to the wet
                           and dry N2 flow paths. A third flowmeter along with a manual valve were used to keep
                           the final flow of N2 gas constant at ~1.2 L/min throughout the experiment. An electronic
                           hygrometer (0%–95% RH range and 1% precision) was employed to record the RH and
                           temperature of the final flow purged towards the sample, and it also created a feedback
                           loop for adjusting the amount of wet and dry N2 gas. The silicone seal of the fully hydrated
                           sample was cut and the buffer was pipetted out completely followed by immediate purging
                           of N2 gas of 90% RH. FRAP measurements were taken for SLBs equilibrated to 90%, 70%,
                           50%, 30%, and 0% RH at constant temperature. The dehydration and rehydration were
                           performed in steps of ~20% RH with change rate of 2%–3% RH/min. The sample was
                           rehydrated in a similar manner that is by purging N2 gas and increasing its RH. Finally the
                           sample was again filled with buffer and sealed to obtain bulk rehydration of the sample.
Biosensors 2021, 11, 241 4 of 13
2.2.3. FRAP Experiments
Zeiss LSM 710 (Carl Zeiss, Jena, Germany) microscope with 40×, 1.3 NA oil immersion
objective was used for confocal imaging and FRAP experiments. Atto-633 was excited by a
laser with a 633 nm wavelength. Laser power was adjusted to a minimum to avoid excessive
overall photobleaching of the sample during measurements. For FRAP experiments, a
selected circular spot of 10 µm diameter within a 50 µm × 50 µm area was instantaneously
bleached with maximum laser power in every measurement. In the experiment 100
consecutive fluorescence images of the same area were recorded with 0.5 s intervals. The
data were analyzed using MATLAB software and the diffusion coefficient was determined
considering free Brownian lateral diffusion of lipid molecules in the membrane, by fitting
the fluorescence recovery curve using modified Soumpasis Formula (1) [45]:
F ( t ) = b + a · f ( t ), (1)
where a is the amplitude of the recovery function, b is the remaining fluorescence after
bleaching, and f (t) is the Soumpasis function. The FRAP traces were normalized taking the
overall fluorescence intensity signal of the image except the bleached spot as the reference.
FRAP experiments were performed on one representative single component and one phase-
separated SLB throughout complete dehydration-rehydration cycles. A minimum of 5
FRAP measurements at various areas of the samples were recorded at a particular RH for
each sample.
3. Results
3.1. Measurement and Analysis of Diffusion Coefficient of Lipids at Different Hydration Conditions
In this study, lateral diffusion of DMoPC in single component SLB as well as in phase-
separated DMoPC/egg SM/cholesterol 1:1:1 SLB was investigated by FRAP experiments
at different hydration conditions, starting from fully hydrated to membrane equilibrated
to ~0% RH. In order to achieve the desired hydration state, the SLBs, immediately after
removal of bulk water from the sample, were carefully equilibrated to the atmosphere of
a nitrogen gas of specific relative humidity using our home-built hydration control unit.
SLBs dehydrated by this method can withstand multiple dehydration-rehydration cycles
without experiencing major structural damage [46].
The representative confocal images, selected from the FRAP measurement series of
single component SLB at pre-bleached, bleached, and recovered (completely or partially)
conditions are shown in Figure 1. Clearly, remarkable differences in bleaching depth
and recovery of fluorescence intensity within the bleached spot are observed. FRAP
experiments are based on measuring the recovery of fluorescence intensity in the bleached
area that is caused by lateral Brownian motion due to the reorganization of bleached and
non-bleached lipid molecules [45]. The dehydrated membrane showed higher bleaching
depth and slower fluorescence intensity recovery (Figure 1b) than a fully hydrated one
(Figure 1a). Thus, it can be concluded that there is a vivid decline in lateral mobility of
lipids in the absence of full hydration of membrane constituents. This observation is clearly
reflected in the FRAP traces for fully hydrated and dehydrated (~30% RH) membranes, as
shown in Figure 2a,c, for single component and phase-separated SLBs, respectively. In the
case of fully hydrated membranes, the fluorescence intensity recovers up to 95 ± 2% of the
initial intensity within ~50 s after bleaching, whereas more than 50% fluorescence recovery
is scarcely achieved for dried SLBs within the same time frame. For a detailed investigation
of the dependence of the lateral diffusion (D) of lipids on hydration conditions, diffusion
coefficients of DMoPC were measured for single component and phase-separated SLBs
at various relative humidity levels, starting from fully hydrated to ~0% RH via 85%, 65%,
45%, and 30% RH. The SLBs were rehydrated subsequently by increasing RH levels in
steps up to ~85%, and they were finally rehydrated fully with the addition of bulk water.
Figure 2b,d depicts the diffusion coefficients of DMoPC during a complete dehydration and
rehydration cycle for single component and phase-separated SLBs, respectively, averagedBiosensors 2021, 11, x FOR PEER REVIEW 5 of 13
65%, 45%, and 30% RH. The SLBs were rehydrated subsequently by increasing RH levels
Biosensors 2021, 11, 241 in steps up to ~85%, and they were finally rehydrated fully with the addition of bulk 5wa-of 13
ter. Figure 2b,d depicts the diffusion coefficients of DMoPC during a complete dehydra-
tion and rehydration cycle for single component and phase-separated SLBs, respectively,
averaged over at least five FRAP traces from various spots of the sample at a particular
over at least five FRAP traces from various spots of the sample at a particular RH level. It
RH level. It should be duly noted that the absolute mobility of liquid-disordered (Ld)
should be duly noted that the absolute mobility of liquid-disordered (L ) phase lipids in
phase lipids in phase-separated membranes is significantly lower than ind pure Ld phase,
phase-separated membranes is significantly lower than in pure Ld phase, single component
single component membranes, as part of Lo lipids and cholesterol partition into the Ld
membranes, as part of Lo lipids and cholesterol partition into the Ld phase, thus increasing
phase, thus increasing the order and viscosity [47].
the order and viscosity [47].
Figure
Figure1.1.Representative
Representativeconfocal
confocalimages
imagesfrom
fromthetheFRAP
FRAPexperiment
experimentfor
foraafully
fullyhydrated,
hydrated,single
singlecomponent
componentSLBSLB(a)
(a)and
and
SLB
SLBexposed
exposedtoto0%
0%RH
RH(b).
(b).The
Theareas
areasmarked
markedby byyellow
yellow(a) (a)and
andwhite
white(b)
(b)circles
circlesdenote
denotethe
thespot
spotofof10
10µm
µmdiameter
diameterthat
that
was
wasbleached
bleachedduring
duringFRAP
FRAPmeasurements.
measurements.InIncase
caseofoffully
fullyhydrated
hydratedsample
sample(a),(a),the
thebleached
bleachedarea
areacompletely
completelyregained
regainedits
its
fluorescence within 50 s, while for sample exposed to 0% RH (b), the spot remained largely bleached after 50 s. The scale
fluorescence within 50 s, while for sample exposed to 0% RH (b), the spot remained largely bleached after 50 s. The scale
bars correspond to 10 µm.
bars correspond to 10 µm.
At the fully hydrated condition, the diffusion coefficients of DMoPC in a single compo-
nent and phase-separated SLBs were found to be 5.35 ± 0.79 µm2 /s and 1.66 ± 0.22 µm2 /s,
respectively. A roughly 3.5-fold higher D explains the shallower bleaching of fully hy-
drated single component SLB compared to the phase-separated one (see Figure 2a,c). In
spite of the difference in absolute values of diffusion coefficients of lipids for both sys-
tems, the change of lateral diffusion followed an analogous trend with dehydration and
subsequent rehydration. A strong correlation between the lipid mobility and the relative
humidity of the sample environment was observed. The D of DMoPC in the single com-
ponent SLB steadily dropped down from 4.75 ± 1.14 µm2 /s to 0.25 ± 0.18 µm2 /s as the
hydration of the atmosphere was lowered from ~85% RH to ~0% RH. Likewise, in phase-
separated SLBs, a sharp downfall of D was noticed from 1.52 ± 0.08 µm2 /s at ~85% RH to
0.04 ± 0.01 µm2 /s at ~0% RH. This firmly indicates that water molecules attached to the
polar head group of the lipid molecules play a key role in modulating the lateral move-
ment of lipids. Interestingly, with consecutive rehydration, lipid mobility increased back
following the same trend as during dehydration, with relatively lower absolute values
of D. However, with bulk rehydration, the lipids regained their natural mobility, which
is the same as for fully hydrated conditions measured before de- and rehydration. Thus,
from fully hydrated to fully rehydrated conditions, D changes reversibly with change in
native hydration state of the membrane. The strong dependence of D on the membranes’
hydration state can be associated with a reversible change in the local hydration structure
around the lipid head group caused by de(re)hydration [46]. Furthermore, it is clearlyBiosensors 2021, 11, 241 6 of 13
evident from Figure 2b,d that the most dramatic change of D values took place in the range
of 100–50% RH; lowering the relative humidity below this range hardly affected the lateral
diffusion of lipids. This breaking point at ~50% RH can be correlated with the breaking of
clathrate cage structure around the phosphocholine group of DMoPC molecule [46]. We
Biosensors 2021, 11, x FOR PEER REVIEW
note that at the salt concentrations used in the buffer for experiments (10 mM HEPES6 ofand
13
150 mM NaCl), lipid diffusion remained unaffected by the change in ionic strength [48].
Figure 2.
Figure FRAP traces
2. FRAP traces of
of fully
fully hydrated
hydrated andand dehydrated
dehydrateddown
downto to30%
30%RHRHSLBs
SLBsfor
foraa single
single component
component(a) (a)and
andphase-
phase-
separated
separated (c)
(c) membrane.
membrane. Panels
Panels(b,d)
(b,d) show
show the
the dependence
dependence ofof diffusion
diffusion coefficient
coefficient with
with RH RH for
for aa single
single component
component and and
phase-separated
phase-separated SLB,SLB, respectively.
respectively. The
The magenta
magentadashed
dashedand
andgreen
greendotted
dottedlines
linesare
are the
the average
average values
valuesofof D
D at
at the
the fully
fully
hydrated
hydrated condition and fully
condition and fully rehydrated
rehydratedcondition,
condition,respectively.
respectively.The
Theblack
black dashed
dashed line
line is aisguide
a guide to the
to the eyeeye to highlight
to highlight the
the trend in D with de(re)hydration.
trend in D with de(re)hydration.
At
The thepresented
fully hydrated
resultscondition,
reveal that thethe
diffusion
lateralcoefficients
diffusion ofoflipids
DMoPC in a Lsingle
in the com-
d phase of
ponent and phase-separated
the zwitterionic lipid bilayerSLBs were foundsensitive
is particularly to be 5.35towards
± 0.79 µm 2/s and 1.66 ± 0.22 µm2/s,
the hydration state of the
respectively.
membrane, or A more
roughly 3.5-foldofhigher
precisely, the lipidD explains the shallower
itself. Moreover, bleaching of
the dependence of fully
D on hy-
the
drated single component SLB compared to the phase-separated
hydration of the membrane constituents uniformly applies to phosphatidycholines (PC) one (see Figure 2a,c). In
spite of the difference in absolute values of diffusion coefficients of
in a completely liquid-disordered environment as well as in phase-separated membranes, lipids for both systems,
the change ofoflateral
irrespective diffusion
the presence of followed
Lo domains an slowing
analogous trend
down thewith dehydration
overall mobility. and subse-
quent rehydration. A strong correlation between the lipid mobility and the relative hu-
3.2. Hydration
midity Sensingenvironment was observed. The D of DMoPC in the single compo-
of the sample
nent SLB
Our steadily dropped
results reveal down from
a significant 4.75 ± 1.14
dependence of µm /s to 0.25 coefficient
the 2diffusion ± 0.18 µm2of /s lipids
as the onhydra-
their
tion
localofhydration
the atmosphere was itlowered
state. Thus, gives the from ~85% RH
possibility to exploited
to be ~0% RH. Likewise,
as a techniquein phase-sepa-
to quantify
rated SLBs, a sharp
the hydration level of downfall of D was
the membrane bynoticed
using Dfrom 1.52 ± 0.08indicator.
as a hydration µm2/s at In~85% RH toX-ray
previous 0.04
±diffraction
0.01 µm /s[49]
2 at ~0%
and RH. Thisspectroscopy
infrared firmly indicates [30]that waterthe
studies, molecules
RH of theattached
membrane to the polar
environ-
mentgroup
head has been correlated
of the with theplay
lipid molecules number
a keyofrolewater molecules present
in modulating in the
the lateral hydration
movement of
shell ofInterestingly,
lipids. a single lipidwithmolecule, specifically
consecutive in its head
rehydration, group
lipid region.
mobility Approximately
increased 10.5,
back follow-
6.3, the
ing 3.6, same
and 2.4 water
trend asmolecules, averaged from
during dehydration, withtherelatively
results oflower
the above-mentioned
absolute valuesexperi-of D.
mental studies, were found per PC lipid when stacked lipid membranes
However, with bulk rehydration, the lipids regained their natural mobility, which is the were exposed to
an atmosphere with 95%, 75%, 50%, and 25% RH, respectively.
same as for fully hydrated conditions measured before de- and rehydration. Thus, from Marrying these findings
fully hydrated to fully rehydrated conditions, D changes reversibly with change in native
hydration state of the membrane. The strong dependence of D on the membranes’ hydra-
tion state can be associated with a reversible change in the local hydration structure
around the lipid head group caused by de(re)hydration [46]. Furthermore, it is clearly
evident from Figure 2b,d that the most dramatic change of D values took place in thetheir local hydration state. Thus, it gives the possibility to be exploited as a technique to
quantify the hydration level of the membrane by using D as a hydration indicator. In pre-
vious X-ray diffraction [49] and infrared spectroscopy [30] studies, the RH of the mem-
brane environment has been correlated with the number of water molecules present in the
hydration shell of a single lipid molecule, specifically in its head group region. Approxi-
Biosensors 2021, 11, 241 7 of 13
mately 10.5, 6.3, 3.6, and 2.4 water molecules, averaged from the results of the above-men-
tioned experimental studies, were found per PC lipid when stacked lipid membranes
were exposed to an atmosphere with 95%, 75%, 50%, and 25% RH, respectively. Marrying
theseour
with findings with
results, theour results,
number of the number
water of water
molecules permolecules
lipid headper lipidcorresponding
group head group cor- to
aresponding
particular toRHa can
particular RH canwith
be correlated be correlated with D. Consequently,
D. Consequently, the precise of
the precise determination deter-
the
mination
lipids’ of the lipids’
diffusion diffusion
coefficient can givecoefficient
insights can
intogive insights
the local into the
hydration local
state ofhydration state
the membrane.
of the
The membrane.
changes in theThe changes
lipids’ in the
mobility canlipids’
be used mobility can hydration
as a local be used assensor
a localnot
hydration
only in
sensor not only
biomimetic in biomimetic
membranes, membranes,
but also in nativebutcellalso in native cell
membranes. Themembranes. The general
general concept of our
concept of our approach is depicted in Figure 3. It should be noted
approach is depicted in Figure 3. It should be noted here that while extrapolating the here that while extrap-
olatingexperimental
above the above experimental results for equilibrated
results for membranes membranes with equilibrated
0% RH, one withwould
0% RH, one
expect
would
the expect thetomembranes
membranes to be free
be free of water. of water.
However, However,
previous previous
molecular molecular
dynamics dynamics
simulations
revealed,
simulations even after drastic
revealed, drying,
even after up drying,
drastic to 3–4 water
up to 3–4molecules per lipid remain
water molecules per lipidstrongly
remain
hydrogen bonded tobonded
strongly hydrogen the carbonyl
to theand/or
carbonylphosphate group [22,35].
and/or phosphate Hence,
group for membranes
[22,35]. Hence, for
equilibrated to RH < 25%,toone
membranes equilibrated RHcan state
< 25%, onethat
can there
stateare not
that more
there arethan
not four
morewater molecules
than four water
associated with the lipids.
molecules associated with the lipids.
Figure Schematicdiagram
Figure 3. Schematic diagramofofthe
thehydration
hydrationsensing
sensingconcept.
concept.(a)(a) Once
Once thethe bulk
bulk water
water is removed,
is removed, sample
sample is inserted
is inserted into
the microscope
into system
the microscope andand
system subjected to to
subjected a acontrolled
controlleddehydration/rehydration
dehydration/rehydrationprocess
processusing
usingnitrogen
nitrogengas
gas of known
known
humidity. (b) At each hydration state, FRAP measurements are performed. (c) From FRAP traces acquired for a particular
humidity, the diffusion coefficient (D) of lipids is calculated. (d) The diffusion coefficient is then presented as a function of
relative humidity (RH) of the sample environment, which in turn can be directly related to the number of water molecules
hydrating a single lipid molecule. Thus, using this calibration plot, the hydration of the lipid membrane can be determined
from the measured lipid lateral diffusion coefficient.
3.3. Validation of Hydration Sensing Approach
The reversibility, repeatability, and response time of the sensor are crucial criteria
to validate a sensing technique. To check these parameters, a single component DMoPC
SLB was exposed to high (80%) and low (5%) RH alternatively several times. The RH
was instantaneously adjusted from 80% to 5% by closing the N2 flow through the water
reservoir and only letting dry N2 flow over the membrane. A humidity sensor attached
to the flow tube close to the outlet was used to continuously monitor the RH of N2 gas.
The set RH (5% or 80%) was reached typically within 1 min. Subsequently, the RH was
kept constant for the next four minutes after each consecutive RH alteration, and two
FRAP measurements were performed. Figure 4 shows the change of D over time upon
sudden increase or decrease in RH in several dehydration-rehydration cycles. Clearly, the
successive de(re)hydration cycles do not leave a permanent effect on the lateral diffusion
of lipids, instead, a variation of D is absolutely reversible and repeatable. We note that
the measured D at high/low RH appeared to be lower/higher than the average D values
at these two hydration levels, as shown in Figure 2b. This results from the fact that the(5% or 80%) was reached typically within 1 min. Subsequently, the RH was kept constant
for the next four minutes after each consecutive RH alteration, and two FRAP measure-
ments were performed. Figure 4 shows the change of D over time upon sudden increase
or decrease in RH in several dehydration-rehydration cycles. Clearly, the successive
Biosensors 2021, 11, 241 de(re)hydration cycles do not leave a permanent effect on the lateral diffusion of lipids, 8 of 13
instead, a variation of D is absolutely reversible and repeatable. We note that the meas-
ured D at high/low RH appeared to be lower/higher than the average D values at these
two hydration levels, as shown in Figure 2b. This results from the fact that the RH of the
RH of the
purged purgedgas
nitrogen nitrogen gas wasquickly
was swapped swapped (75%quickly (75% RH
RH change in 1 change
min), andin the
1 min),
FRAP and the
meas-
FRAP measurements
urements were startedwere started immediately
immediately before the SLB before the SLB
was fully was fullyto
equilibrated equilibrated
the particular to
the particular RH provided. This is also evident from the fact that the second
RH provided. This is also evident from the fact that the second FRAP trace always yields FRAP trace
always yields
higher (for 80%higher
RH) and(forlower
80% RH) andRH)
(for 5% lower
D, (for
while 5% RH)
the D, whilestill
membrane theundergoes
membraneequi- still
undergoes equilibration. Generally, in our experiments, we noticed that the equilibration
libration. Generally, in our experiments, we noticed that the equilibration time at a partic-
time
ular at
RH a particular
was aroundRH10 was around
min. 10 min. Nevertheless,
Nevertheless, the prompt the prompt
change change
of D, shown of D,
in shown
Figure in 4,
Figure 4, within 1 min of changing RH is sufficient to unambiguously indicate
within 1 min of changing RH is sufficient to unambiguously indicate a significant change a significant
change in the hydration
in the hydration state
state of the of the This
system. system. This confirms
confirms thatresponse
that a quick a quick response in D is
in D is expected
expected as soon as the hydration state
as soon as the hydration state is altered. is altered.
Figure 4. Diffusion coefficients of single component
component DMoPC
DMoPC SLB
SLB exposed
exposed to to aa successive
successive switching
switching
between high
high (80%)
(80%)andandlow
low(5%)
(5%)RH RHover
overtime. Each
time. datadata
Each point corresponds
point corresponds to the
todiffusion coef-
the diffusion
ficient derived from a single FRAP trace. The confidence bounds of the fits of the FRAP
coefficient derived from a single FRAP trace. The confidence bounds of the fits of the FRAP traces traces were
used to
were form
used to the
formerror
thebars
errorfor the for
bars data points.
the One minute
data points. One time wastime
minute taken to alter
was takentheto RH from
alter the 80%
RH
to 5%. In the following four minutes, two FRAP measurements were performed before re-altering
from 80% to 5%. In the following four minutes, two FRAP measurements were performed before
the RH.
re-altering the RH.
4. Discussion
4.1. Applicability and Measurement Criteria
Transient, local dehydration of membranes is one of the most important intermediate
steps in numerous biological processes, for example, endo- and exocytosis, fertilization,
viral entry, biogenesis of muscle tissue [50], etc. The central mechanism of these processes
constitutes membrane fusion. The lipid layers merge, overcoming a specific hydration
barrier. This results from the removal of water molecules from lipid head groups when the
hydrophobic tails come into contact with the water-caged hydrophilic head groups of the
two lipid layers [51]. A molecular-level understanding of such processes requires quan-
tification of the local hydration state in terms of the number of water molecules attached
per lipid in each intermediate step of the process. Our hydration sensing methodology
forms a solid base for developing a complete stepwise map of hydration structures of
lipid molecules in the course of membrane fusion or any other process that involves local
dehydration of the membrane. Here, we verified the hydration sensing approach for
DMoPC as a representative PC lipid, being one of the most abundant group of lipids found
in biological cell membranes. As water molecules present in the clathrate cage around
phosphocholine head group are related to lipid mobility, it is expected for other PC lipids
to show dependence of the diffusion on hydration. It is important to note that the observed
correlation between the diffusion coefficient and hydration state of the membrane is equally
valid for a single component membrane as well as for more complex, multicomponent
lipid bilayers that exhibit phase separation and formation of domains.
A few criteria of measurement conditions should be considered for an effective and
fruitful hydration sensing. Apart from the hydration level, several additional parameters
affect lipid dynamics in a membrane. The presence of saturated and unsaturated lipids,Biosensors 2021, 11, 241 9 of 13
cholesterol, membrane proteins, and phase separation in membranes influence the absolute
values of the diffusion coefficients of lipids. In presence of various ions in the medium,
the complex formation of an ion binding with more than one lipid may slow down the
mobility of lipids and weaken the polarization of water molecules in the interior of the
membranes [48]. Moreover, physical factors such as temperature variation also affect the
diffusion of lipids. In order to obtain a clear picture of the hydration state of lipids in a
membrane, lipid diffusion should be measured keeping all other parameters constant. In
complex biological membranes, where a variety of parameters modulates lipid dynam-
ics, the presented approach still enables comparative studies of hydration structure and
hydration heterogeneity between various membrane sites. The high sensitivity of this
methodology (few water molecules per lipid) allows for the qualitative determination of
the hydration state.
4.2. Perspectives
From the technical standpoint, it must be emphasized that our approach is not limited
to using the FRAP technique. In fact, it could be easily transferred to any method that en-
ables quantitative analysis of lipid diffusion, such as, for instance, fluorescence correlation
spectroscopy (FCS). Although both FRAP and FCS techniques meet the temporal resolution
needed to resolve membrane dynamics, their spatial resolution, when performed with
conventional confocal microscopes, is diffraction limited [52]. Consequently, the hetero-
geneity of diffusion, and thus the heterogeneity of hydration that can occur at the nanoscale,
may be overlooked due to the inherent ensemble averaging across the entire illumination
area [53,54]. One of the strategies to breach the diffraction limit barrier is a coupling of the
well-established FCS approach with super-resolution imaging technique such as stimu-
lated emission depletion (STED) nanoscopy [52,55,56]. STED-FCS has been successfully
applied to model biomembranes for studying nanoscale lipid dynamical heterogeneities
induced by pore-forming proteins [56], as well as to the plasma membrane of living cells to
discern nanoscale molecular diffusion modes [52]. An alternative approach is marrying the
aforementioned FSC with near-field scanning optical microscopy, capable of confining the
illumination light at the nanoscale [54,57]. High spatial resolution has also been achieved
with a single-molecule FRAP (smFRAP) approach, which was employed to determine
the distribution and translocation rates of inner and outer nuclear membrane proteins
in live cells in real-time conditions [58]. An alternative solution is to trace the motion of
individual particles attached to the lipids of interest using the single-particle tracking (SPT)
technique [59]. Although conventional SPT yields a limited temporal resolution (often
in the millisecond range), solutions have already emerged to improve it by combining
SPT with interferometric scattering microscopy (iSCAT) techniques. Using the SPT–iSCAT
approach, microsecond temporal resolution with simultaneous sub-1 nm spatial precision
of lipid localization has been achieved [60–62].
Clearly, the possibilities are tremendous. Synthesizing the evidence from our studies
with single-molecule approaches could truly provide capabilities to sense biomimetic
and biological membrane hydration at the single-molecule level. Adsorption of large
biomolecules (such as proteins) onto the membrane often disturbs the hydration layer
locally in the vicinity of the binding site [63]. Using single-molecule approach, it is feasible
to sense hydration changes even in the case of single biomolecule–membrane interactions.
For using lipid diffusion as a hydration marker, two distinct approaches can be
undertaken. One of these approaches is to provide an absolute number of water molecules
per lipid in a membrane looking at the diffusion coefficient of the very lipid. However, as
the exact number of water molecules per lipid varies depending on the lipid structure and
its surroundings, the number of water molecules per lipid at different relative humidity
levels should be determined precisely for that specific system. Additionally, to gain
information on the number of water molecules correlated with diffusion coefficient of
lipids accurately, calibration for complete dehydration and rehydrated cycle is essential.
On the other hand, for a system that is homogeneous in terms of diffusion-affectingBiosensors 2021, 11, 241 10 of 13
parameters other than hydration state, by local probing of lipid diffusion in different sites
of interest, a qualitative comparison of the hydration structure and state can be revealed.
In this scenario, the method becomes self-referential and the requirement for calibration is
eliminated.
5. Conclusions
We developed a novel approach for sensing the hydration state of lipids and hydration
heterogeneity within lipid membranes, based on the strong correlation between lateral
mobility of phospholipids with the number of water molecules forming the hydration
shell around lipids’ polar head groups. Hence, the diffusion coefficient of a lipid can be
considered as a measure of its hydration state at a molecular level. The change in lateral
diffusion coefficients of lipids with the number of water molecules hydrating a lipid is
fully reversible and repeatable. For a comparative study of hydration heterogeneity of
different sites within the membrane, the methodology is self-sufficient and self-referential.
Finally, the presented approach can readily be equipped with a single-molecule hydration
sensing capabilities if the diffusion coefficient is measured with single-molecule sensitivity
approaches such as SPT or FCS. Thus, the approach for hydration sensing possesses an
enormous potential for quantitative, molecular-level studies of the (de)hydration-mediated
processes in lipid membranes.
6. Patents
Chattopadhyay, M.; Krok, E.; Orlikowska, H.; Piatkowski, L. Method for Measur-
ing the Local Hydration of Lipid Layers of Biomimetic and Biological Systems. Patent
Application (Poland), P.437600 and P.437601, 16.04.2021.
Author Contributions: Conceptualization, M.C. and L.P.; methodology, M.C., E.K., and L.P.; valida-
tion, L.P.; formal analysis, M.C.; investigation, M.C. and E.K.; writing—original draft preparation,
M.C. and H.O.; writing—review and editing, M.C., H.O., E.K., and L.P.; supervision, L.P.; funding
acquisition, L.P. and H.O.; patent application writing, H.O. and L.P. All authors have read and agreed
to the published version of the manuscript.
Funding: This research was funded by Foundation for Polish Science (First TEAM grant POIR.04.04.00-
00-5D32/18-00), EMBO Installation Grant 2019, and National Science Centre (Poland) 2020/37/B/ST4/
01785. This work was also financed from the budget funds allocated for science in the years 2019–2023
as a research project under the “Diamond Grant” program (decision: 0042/DIA/2019/48).
Institutional Review Board Statement: Not applicable.
Informed Consent Statement: Not applicable.
Data Availability Statement: All data underlying the study are available from the authors.
Acknowledgments: The authors gratefully thank Petra Schwille and Henri G. Franquelim for their
suggestions and useful discussion.
Conflicts of Interest: The authors declare no conflict of interest. The funders had no role in the design
of the study; in the collection, analyses, or interpretation of data; in the writing of the manuscript, or
in the decision to publish the results.
References
1. Aeffner, S.; Reusch, T.; Weinhausen, B.; Salditt, T. Energetics of Stalk Intermediates in Membrane Fusion Are Controlled by Lipid
Composition. Proc. Natl. Acad. Sci. USA 2012, 109, 1609–1618. [CrossRef]
2. Subczynski, W.K.; Pasenkiewicz-Gierula, M.; Widomska, J.; Mainali, L.; Raguz, M. High Cholesterol/Low Cholesterol: Effects in
Biological Membranes: A Review. Cell Biochem. Biophys. 2017, 75, 369–385. [CrossRef]
3. Jackman, J.A.; Cho, N.J. Supported Lipid Bilayer Formation: Beyond Vesicle Fusion. Langmuir 2020, 36, 1387–1400. [CrossRef]
4. Richter, R.P.; Bérat, R.; Brisson, A.R. Formation of Solid-Supported Lipid Bilayers: An Integrated View. Langmuir 2006, 22,
3497–3505. [CrossRef]
5. Chan, Y.H.M.; Boxer, S.G. Model Membrane Systems and Their Applications. Curr. Opin. Chem. Biol. 2007, 11, 581–587. [CrossRef]
6. Nieciecka, D.; Królikowska, A.; Krysinski, P. Probing the Interactions of Mitoxantrone with Biomimetic Membranes with
Electrochemical and Spectroscopic Techniques. Electrochim. Acta 2015, 165, 430–442. [CrossRef]Biosensors 2021, 11, 241 11 of 13
7. Khadka, N.K.; Cheng, X.; Ho, C.S.; Katsaras, J.; Pan, J. Interactions of the Anticancer Drug Tamoxifen with Lipid Membranes.
Biophys. J. 2015, 108, 2492–2501. [CrossRef]
8. Bilginer, R.; Arslan Yildiz, A. Biomimetic Model Membranes as Drug Screening Platform. In Biomimetic Lipid Membranes:
Fundamentals, Applications, and Commercialization; Springer International Publishing: Cham, Switzerland, 2019; pp. 225–247.
9. Wang, H.; Liu, Y.; He, R.; Xu, D.; Zang, J.; Weeranoppanant, N.; Dong, H.; Li, Y. Cell Membrane Biomimetic Nanoparticles for
Inflammation and Cancer Targeting in Drug Delivery. Biomater. Sci. 2020, 8, 552–568. [CrossRef] [PubMed]
10. Zhang, M.; Cheng, S.; Jin, Y.; Zhang, N.; Wang, Y. Membrane Engineering of Cell Membrane Biomimetic Nanoparticles for
Nanoscale Therapeutics. Clin. Transl. Med. 2021, 11, e292. [CrossRef] [PubMed]
11. Hindley, J.W.; Law, R.V.; Ces, O. Membrane Functionalization in Artificial Cell Engineering. SN Appl. Sci. 2020, 2, 1–10. [CrossRef]
12. Zhang, L.; Wang, Z.; Zhang, Y.; Cao, F.; Dong, K.; Ren, J.; Qu, X. Erythrocyte Membrane Cloaked Metal-Organic Framework
Nanoparticle as Biomimetic Nanoreactor for Starvation-Activated Colon Cancer Therapy. ACS Nano 2018, 12, 10201–10211.
[CrossRef]
13. Liu, W.; Wu, J.; Ji, X.; Ma, Y.; Liu, L.; Zong, X.; Yang, H.; Dai, J.; Chen, X.; Xue, W. Advanced Biomimetic Nanoreactor for
Specifically Killing Tumor Cells through Multi-Enzyme Cascade. Theranostics 2020, 10, 6245–6260. [CrossRef] [PubMed]
14. Andersson, J.; Knoll, W. Tethered Lipid Membranes as Platforms for Biophysical Studies and Advanced Biosensors. In Biomimetic
Lipid Membranes: Fundamentals, Applications, and Commercialization; Springer International Publishing: Cham, Switzerland, 2019;
pp. 183–191.
15. Alvarez-Malmagro, J.; García-Molina, G.; De Lacey, A.L. Electrochemical Biosensors Based on Membrane-Bound Enzymes in
Biomimetic Configurations. Sensors 2020, 20, 3393. [CrossRef] [PubMed]
16. Ito, Y.; Osaki, T.; Kamiya, K.; Yamada, T.; Miki, N.; Takeuchi, S. Rapid and Resilient Detection of Toxin Pore Formation Using a
Lipid Bilayer Array. Small 2020, 16, 2005550. [CrossRef] [PubMed]
17. Li, Y.; Qi, S.; Tian, M.; Widjajanti, W.; Wang, R. Fabrication of Aquaporin-Based Biomimetic Membrane for Seawater Desalination.
Desalination 2019, 467, 103–112. [CrossRef]
18. Di Vincenzo, M.; Tiraferri, A.; Musteata, V.E.; Chisca, S.; Sougrat, R.; Huang, L.B.; Nunes, S.P.; Barboiu, M. Biomimetic Artificial
Water Channel Membranes for Enhanced Desalination. Nat. Nanotechnol. 2021, 16, 190–196. [CrossRef] [PubMed]
19. Abaie, E.; Xu, L.; Shen, Y.X. Bioinspired and Biomimetic Membranes for Water Purification and Chemical Separation: A Review.
Front. Environ. Sci. Eng. 2021, 15, 124. [CrossRef]
20. Fukuma, T.; Higgins, M.J.; Jarvis, S.P. Direct Imaging of Individual Intrinsic Hydration Layers on Lipid Bilayers at Ångstrom
Resolution. Biophys. J. 2007, 92, 3603–3609. [CrossRef]
21. Pasenkiewicz-Gierula, M.; Baczynski, K.; Markiewicz, M.; Murzyn, K. Computer Modelling Studies of the Bilayer/Water Interface.
Biochim. Biophys. Acta Biomembr. 2016, 1858, 2305–2321. [CrossRef]
22. Disalvo, E.A.; Lairion, F.; Martini, F.; Tymczyszyn, E.; Frías, M.; Almaleck, H.; Gordillo, G.J. Structural and Functional Properties
of Hydration and Confined Water in Membrane Interfaces. Biochim. Biophys. Acta Biomembr. 2008, 1778, 2655–2670. [CrossRef]
23. Tian, Z.; Gong, J.; Crowe, M.; Lei, M.; Li, D.; Ji, B.; Diao, J. Biochemical Studies of Membrane Fusion at the Single-Particle Level.
Prog. Lipid Res. 2019, 73, 92–100. [CrossRef] [PubMed]
24. Sparrman, T.; Westlund, P.O. An NMR Line Shape and Relaxation Analysis of Heavy Water Powder Spectra of the Lα, Lβ0 and
Pβ0 Phases in the DPPC/Water System. Phys. Chem. Chem. Phys. 2003, 5, 2114–2121. [CrossRef]
25. Tristram-Nagle, S.; Nagle, J.F. Lipid Bilayers: Thermodynamics, Structure, Fluctuations, and Interactions. Chem. Phys. Lipids 2004,
127, 3–14. [CrossRef]
26. Rheinstädter, M.C.; Ollinger, C.; Fragneto, G.; Demmel, F.; Salditt, T. Collective Dynamics of Lipid Membranes Studied by
Inelastic Neutron Scattering. Phys. Rev. Lett. 2004, 93, 108107. [CrossRef]
27. Berntsen, P.; Svanberg, C.; Swenson, J. Interplay between Hydration Water and Headgroup Dynamics in Lipid Bilayers. J. Phys.
Chem. B 2011, 115, 1825–1832. [CrossRef]
28. Tielrooij, K.J.; Paparo, D.; Piatkowski, L.; Bakker, H.J.; Bonn, M. Dielectric Relaxation Dynamics of Water in Model Membranes
Probed by Terahertz Spectroscopy. Biophys. J. 2009, 97, 2484–2492. [CrossRef]
29. Gennaro, A.; Deschaume, O.; Pfeiffer, H.; Bartic, C.; Wagner, P.; Wübbenhorst, M. Understanding the Dehydration Stress in Lipid
Vesicles by a Combined Quartz Crystal Microbalance and Dielectric Spectroscopy Study. Phys. Status Solidi 2020, 217, 1900986.
[CrossRef]
30. Piatkowski, L.; De Heij, J.; Bakker, H.J. Probing the Distribution of Water Molecules Hydrating Lipid Membranes with Ultrafast
Förster Vibrational Energy Transfer. J. Phys. Chem. B 2013, 117, 1367–1377. [CrossRef]
31. Volkov, V.V.; Palmer, D.J.; Righini, R. Distinct Water Species Confined at the Interface of a Phospholipid Membrane. Phys. Rev.
Lett. 2007, 99, 078302. [CrossRef]
32. Demchenko, A.P.; Mély, Y.; Duportail, G.; Klymchenko, A.S. Monitoring Biophysical Properties of Lipid Membranes by
Environment-Sensitive Fluorescent Probes. Biophys. J. 2009, 96, 3461–3470. [CrossRef]
33. Watanabe, N.; Suga, K.; Slotte, J.P.; Nyholm, T.K.M.; Umakoshi, H. Lipid-Surrounding Water Molecules Probed by Time-Resolved
Emission Spectra of Laurdan. Langmuir 2019, 35, 46. [CrossRef]
34. Jurkiewicz, P.; Olżyńska, A.; Langner, M.; Hof, M. Headgroup hydration and mobility of DOTAP/DOPC bilayers: A fluorescence
solvent relaxation study. Langmuir 2006, 22, 8741–8749. [CrossRef] [PubMed]Biosensors 2021, 11, 241 12 of 13
35. Calero, C.; Franzese, G. Membranes with Different Hydration Levels: The Interface between Bound and Unbound Hydration
Water. J. Mol. Liq. 2019, 273, 488–496. [CrossRef]
36. Hutterer, R.; Hof, M. Dynamics in Diether Lipid Bilayers and Interdigitated Bilayer Structures Studied by Time-Resolved Emission
Spectra, Decay Time and Anisotropy Profiles. J. Fluoresc. 2001, 11, 227–236. [CrossRef]
37. Sýkora, J.; Kapusta, P.; Fidler, V.; Hof, M. On What Time Scale Does Solvent Relaxation in Phospholipid Bilayers Happen?
Langmuir 2002, 18, 571–574. [CrossRef]
38. Jurkiewicz, P.; Cwiklik, L.; Jungwirth, P.; Hof, M. Lipid Hydration and Mobility: An Interplay between Fluorescence Solvent
Relaxation Experiments and Molecular Dynamics Simulations. Biochimie 2012, 94, 26–32. [CrossRef]
39. Parasassi, T.; De Stasio, G.; d’Ubaldo, A.; Gratton, E. Phase Fluctuation in Phospholipid Membranes Revealed by Laurdan
Fluorescence. Biophys. J. 1990, 57, 1179–1186. [CrossRef]
40. Mukherjee, S.; Chattopadhyay, A. Wavelength-Selective Fluorescence as a Novel Tool to Study Organization and Dynamics in
Complex Biological Systems. J. Fluoresc. 1995, 5, 237–246. [CrossRef]
41. Chattopadhyay, A. Exploring Membrane Organization and Dynamics by the Wavelength-Selective Fluorescence Approach. Chem.
Phys. Lipids 2003, 122, 3–17. [CrossRef]
42. Barucha-Kraszewska, J.; Kraszewski, S.; Jurkiewicz, P.; Ramseyer, C.; Hof, M. Numerical Studies of the Membrane Fluorescent
Dyes Dynamics in Ground and Excited States. Biochim. Biophys. Acta Biomembr. 2010, 1798, 1724–1734. [CrossRef] [PubMed]
43. Jurkiewicz, P.; Sýkora, J.; Olzyńska, A.; Humpolíčková, J.; Hof, M. Solvent Relaxation in Phospholipid Bilayers: Principles and
Recent Applications. J. Fluoresc. 2005, 15, 883–894. [CrossRef]
44. Matysik, A.; Kraut, R.S. Preparation of Mica Supported Lipid Bilayers for High Resolution Optical Microscopy Imaging. J. Vis.
Exp. 2014, 88, 52054. [CrossRef]
45. Soumpasis, D.M. Theoretical Analysis of Fluorescence Photobleaching Recovery Experiments. Biophys. J. 1983, 41, 95–97.
[CrossRef]
46. Chattopadhyay, M.; Krok, E.; Orlikowska, H.; Schwille, P.; Franquelim, H.G.; Piatkowski, L. Hydration Layer of Only Few
Molecules Controls Lipid Mobility in Biomimetic Membranes. bioRxiv 2021. [CrossRef]
47. Honigmann, A.; Mueller, V.; Hell, S.W.; Eggeling, C. STED Microscopy Detects and Quantifies Liquid Phase Separation in
Lipid Membranes Using a New Far-Red Emitting Fluorescent Phosphoglycerolipid Analogue. Faraday Discuss. 2012, 161, 77–89.
[CrossRef]
48. Böckmann, R.A.; Hac, A.; Heimburg, T.; Grubmüller, H. Effect of Sodium Chloride on a Lipid Bilayer. Biophys. J. 2003, 85,
1647–1655. [CrossRef]
49. Hristova, K.; White, S.H. Determination of the Hydrocarbon Core Structure of Fluid Dioleoylphosphocholine (DOPC) Bilayers by
X-ray Diffraction Using Specific Bromination of the Double-Bonds: Effect of Hydration. Biophys. J. 1998, 74, 2419–2433. [CrossRef]
50. Leikin, S.L.; Kozlov, M.M.; Chernomordik, L.V.; Markin, V.S.; Chizmadzhev, Y.A. Membrane Fusion: Overcoming of the Hydration
Barrier and Local Restructuring. J. Theor. Biol. 1987, 129, 411–425. [CrossRef]
51. Wilschut, J.; Hoekstra, D. Membrane Fusion: Lipid Vesicles as a Model System. Chem. Phys. Lipids 1986, 40, 145–166. [CrossRef]
52. Schneider, F.; Waithe, D.; Galiani, S.; Bernardino De La Serna, J.; Sezgin, E.; Eggeling, C. Nanoscale Spatiotemporal Diffusion
Modes Measured by Simultaneous Confocal and Stimulated Emission Depletion Nanoscopy Imaging. Nano Lett. 2018, 18,
4233–4240. [CrossRef] [PubMed]
53. Manzo, C.; Van Zanten, T.S.; Garcia-Parajo, M.F. Nanoscale Fluorescence Correlation Spectroscopy on Intact Living Cell
Membranes with NSOM Probes. Biophys. J. 2011, 100, L8. [CrossRef]
54. Sezgin, E.; Schneider, F.; Galiani, S.; Urbančič, I.; Waithe, D.; Lagerholm, B.C.; Eggeling, C. Measuring Nanoscale Diffusion
Dynamics in Cellular Membranes with Super-Resolution STED–FCS. Nat. Protoc. 2019, 14, 1054–1083. [CrossRef]
55. Eggeling, C. Super-Resolution Optical Microscopy of Lipid Plasma Membrane Dynamics. Essays Biochem. 2015, 57, 69–80.
56. Sarangi, N.K.; Roobala, C.; Basu, J.K. Unraveling Complex Nanoscale Lipid Dynamics in Simple Model Biomembranes: Insights
from Fluorescence Correlation Spectroscopy in Super-Resolution Stimulated Emission Depletion Mode. Methods 2018, 140–141,
198–211. [CrossRef]
57. Regmi, R.; Winkler, P.M.; Flauraud, V.; Borgman, K.J.E.; Manzo, C.; Brugger, J.; Rigneault, H.; Wenger, J.; García-Parajo, M.F.
Planar Optical Nanoantennas Resolve Cholesterol-Dependent Nanoscale Heterogeneities in the Plasma Membrane of Living
Cells. Nano Lett. 2017, 17, 6295–6302. [CrossRef]
58. Mudumbi, K.C.; Schirmer, E.C.; Yang, W. Single-Point Single-Molecule FRAP Distinguishes Inner and Outer Nuclear Membrane
Protein Distribution. Nat. Commun. 2016, 7, 1–6. [CrossRef]
59. Manzo, C.; Garcia-Parajo, M.F. A Review of Progress in Single Particle Tracking: From Methods to Biophysical Insights. Rep. Prog.
Phys. 2015, 78, 124601. [CrossRef] [PubMed]
60. Wu, H.M.; Lin, Y.H.; Yen, T.C.; Hsieh, C.L. Nanoscopic Substructures of Raft-Mimetic Liquid-Ordered Membrane Domains
Revealed by High-Speed Single-Particle Tracking. Sci. Rep. 2016, 6, 1–10.
61. Spillane, K.M.; Ortega-Arroyo, J.; De Wit, G.; Eggeling, C.; Ewers, H.; Wallace, M.I.; Kukura, P. High-Speed Single-Particle
Tracking of Gm1 in Model Membranes Reveals Anomalous Diffusion Due to Interleaflet Coupling and Molecular Pinning. Nano
Lett. 2014, 14, 5390–5397. [CrossRef]Biosensors 2021, 11, 241 13 of 13
62. Hsieh, C.L.; Spindler, S.; Ehrig, J.; Sandoghdar, V. Tracking Single Particles on Supported Lipid Membranes: Multimobility
Diffusion and Nanoscopic Confinement. J. Phys. Chem. B 2014, 118, 1545–1554. [CrossRef]
63. Pohl, P.; Saparov, S.M.; Pohl, E.E.; Evtodienko, V.Y.; Agapov, I.I.; Tonevitsky, A.G. Dehydration of Model Membranes Induced by
Lectins from Ricinus Communis and Viscum Album. Biophys. J. 1998, 75, 2868–2876. [CrossRef]You can also read