An investigation of the influence of age and saliva flow on the oral retention of whey protein and its potential effect on the perception and ...
←
→
Page content transcription
If your browser does not render page correctly, please read the page content below
An investigation of the influence of age
and saliva flow on the oral retention of
whey protein and its potential effect on the
perception and acceptance of whey
protein beverages
Article

Published Version

Creative Commons: Attribution 4.0 (CC-BY)

Open access

Norton, V., Lignou, S., Bull, S. P., Gosney, M. A. and
Methven, L. (2020) An investigation of the influence of age
and saliva flow on the oral retention of whey protein and its
potential effect on the perception and acceptance of whey
protein beverages. Nutrients, 12 (9). 2506. ISSN 2072-6643
doi: https://doi.org/10.3390/nu12092506 Available at
http://centaur.reading.ac.uk/92385/

It is advisable to refer to the publisher’s version if you intend to cite from the
work. See Guidance on citing .

To link to this article DOI: http://dx.doi.org/10.3390/nu12092506

Publisher: MDPI
All outputs in CentAUR are protected by Intellectual Property Rights law,
including copyright law. Copyright and IPR is retained by the creators or other
copyright holders. Terms and conditions for use of this material are defined in
the End User Agreement .

www.reading.ac.uk/centaur

CentAUR

Central Archive at the University of Reading
Reading’s research outputs online
nutrients
Article
An Investigation of the Influence of Age and Saliva
Flow on the Oral Retention of Whey Protein and Its
Potential Effect on the Perception and Acceptance of
Whey Protein Beverages
Victoria Norton 1 , Stella Lignou 1 , Stephanie P. Bull 1 , Margot A. Gosney 2 and Lisa Methven 1, *
 1   Department of Food and Nutritional Sciences, University of Reading, Whiteknights, Reading,
     Berkshire RG6 6AD, UK; v.l.norton@pgr.reading.ac.uk (V.N.); s.lignou@reading.ac.uk (S.L.);
     s.p.bull@reading.ac.uk (S.P.B.)
 2   Royal Berkshire NHS Foundation Trust, London Road, Reading RG1 5AN, UK; m.a.gosney@reading.ac.uk
 *   Correspondence: l.methven@reading.ac.uk; Tel.: +44-(0)118-378-8714; Fax: +44-(0)118-931-0080

 Received: 16 July 2020; Accepted: 17 August 2020; Published: 19 August 2020

 Abstract: Protein fortified products are regularly recommended to older adults to improve nutritional
 status and limit sarcopenia. However protein fortification can elicit negative sensory attributes such
 as mouthdrying. Sensitivity to mouthdrying can increase with age, yet the influence of saliva flow
 and mucoadhesion remain uncertain. Here, two studies tested different whey protein beverages
 (WPB); 22 healthy younger volunteers completed a pilot and 84 healthy volunteers from two age
 groups (18–30; 65+) completed the main study. In both studies salivary flow rates (mL/min) were
 measured and saliva samples were collected at time intervals post beverage consumption to measure
 mucoadhesion to the oral cavity, where protein concentration was analysed by Bradford Assay.
 Volunteers rated perception and acceptability of WPBs in the main study. WPB consumption resulted
 in significantly increased protein concentration (p < 0.0001) in saliva samples compared with a control
 whey permeate beverage. Older adults had significantly lower unstimulated saliva flow (p = 0.003)
 and significantly increased protein concentration (p = 0.02) in saliva samples, compared with younger
 adults. Heating of WPB significantly (p < 0.05) increased mouthdrying and thickness perception
 and reduced sweetness compared with unheated WPB. Mucoadhesion is concluded to be a true
 phenomenon in WPBs and increases with age.

 Keywords: mucoadhesion; mouthdrying; older adults; whey protein; saliva flow

1. Introduction
     Malnutrition is prevalent within the UK, with over one million older adults affected, and the risk
of malnutrition is considered to increase in clinical settings (hospitals, care homes and mental health
units) [1]. Such malnutrition has multiple contributing factors and can refer to an overall insufficient
intake of all nutrients or specific macro- or micronutrients [1]. Protein is of specific interest as protein
needs are considered to increase with age, for example, the PROT-AGE study group recommend a
protein intake of 1.0–1.2 g/kg/d for older adults [2]. They suggested that this higher requirement was to
maintain good health, encourage recovery from illness and preserve functionality; and that increased
needs of older adults compared with younger adults resulted from age-related changes in protein
metabolism [2]. The intake of food generally, and of protein rich foods specifically, can be reduced in
older age due to chemosensory impairments, such as loss of taste and smell, which are commonly
associated with older adults and considered to relate to ageing, medication, disease, malnutrition,

Nutrients 2020, 12, 2506; doi:10.3390/nu12092506                               www.mdpi.com/journal/nutrients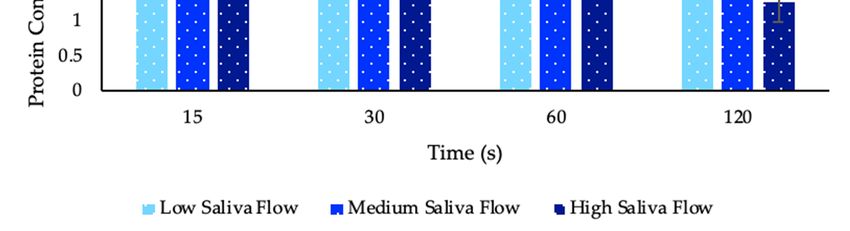
Nutrients 2020, 12, 2506                                                                                    2 of 21

environment and surgical interventions [3]. However, the influence of saliva, and age-related changes
in saliva, on the sensory perception of foods and protein fortified foods, has received little attention.
      Saliva is a viscoelastic solution, consisting of 99% water, with the remainder being protein and ion
components, which enable taste, aid digestion and prevent tooth decay, as well as acting as a lubricant
and having antimicrobial properties [4]. Saliva flow is considered to decrease with age [5], accordingly,
a reduced saliva flow is considered a problem and is commonly associated with decreased lubrication,
protection, oral clearance, mucosal surface hydration and coating abilities within the oral cavity [6–9].
Furthermore, food breakdown and perception of taste, flavour and texture of foods are all influenced
by saliva, impacting upon the eating process and food intake [10,11]. This emphasises the need to
understand how saliva can impact sensory perception and consumption of foods in older adults.
      Foods for older adults are often fortified by whey protein due to the high bioavailability of this
protein source [12]. To increase energy, protein and micronutrient intake, oral nutritional supplements
(ONS) are often prescribed to older adults, and these are commonly fortified with whey protein,
and other dairy proteins sources. However, ONS typically have poor consumer acceptance, which has
been linked to both undesirable taste and aroma and a build-up of perceived mouthdrying following
repeated consumption [13–16]. Previous research has shown that older adults have greater sensitivity to
mouthdrying compared with younger adults following consumption of dairy beverages [17]. Sensory
profiling has identified negative mouthfeel attributes to be perceived after consumption of whey protein
(e.g., chalky, drying, mouthcoating, astringent) and heat treatment of whey protein is considered to
intensify further these sensory properties [18]. Such findings have clinical significance, particularly as
individuals are commonly recommended to consume up to 600 mL of ONS per day [16]. Astringency,
drying and mouthdrying are terms commonly used to describe the ‘textural defects’ associated with
dairy products [19]; these terms are often used within the literature as interchangeable. Astringency
typically refers to a mouth puckering like sensation caused by precipitation of salivary proteins on
binding to polyphenols which reduces salivary lubrication [20]; however polyphenols (a group of
secondary plant metabolites) [21] are not present in whey protein. In this paper the term mouthdrying
is used to refer to a drying sensation in the mouth during or after the consumption of a product.
The causes of whey protein derived mouthdrying are currently not fully understood, despite previous
investigation and are summarised in Table 1.

          Table 1. Commonly proposed causes of whey protein beverage (WPB) derived mouthdrying.

                    Proposed Cause                                    Description
                                              Low pH can cause precipitation of the protein, however, there
                    The pH of WPB             is evidence of mouthdrying from WPB at both low and neutral
                                                                     pH [18,22–26]
                                                Perception of mouthdrying has links to saliva and protein
            Saliva and protein interactions
                                                               interactions [22,23,25,27,28]
                                                  Increased friction within the oral cavity from reduced
             Reduced lubrication of saliva
                                                                      lubrication [29]
                                                 Whey proteins binding to oral epithelial cells, proteins
           Adhesion and binding properties    remaining on surfaces, mucoadhesive properties and increased
                                                                  oral retention [30–33]
                                              Mouthdrying is considered to increase with product heating
                      Heating time
                                                 time, potentially due to protein denaturation [18,34]

     Our research group consider the adhesion of whey protein to be a highly probable cause of
whey protein derived mouthdrying. Mucoadhesion, a concept that has been utilised in drug delivery
systems [35–38] and more recently considered in a food context [39]. Mucoadhesion can be described
as physicochemical interactions between a polymetric material and mucosal environment [38] and
is considered in the context of this paper to be the binding or sticking of whey proteins to the oral
cavity [18]. An oral retention method has been developed to measure the amount of protein retained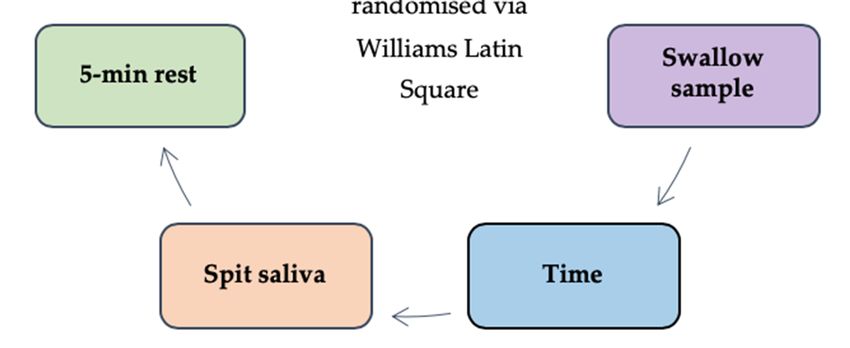
Nutrients 2020, 12, 2506                                                                          3 of 21

in the mouth over time by measuring protein in saliva samples with factors such as salivary flow,
composition and viscosity considered to influence retention of samples [33,40]. One limitation of the
oral retention method of measuring protein mucoadhesion to date has been small subject sample
sizes [33]. Currently, the extent to which mucoadhesion and mouthdrying are influenced by saliva
flow in older adults remains uncertain. This paper hypothesises whey protein beverages (WPB) will
cause mucoadhesion of protein to the oral cavity following consumption, and that older adults will
have reduced salivary flow, greater adhesion of protein to the oral cavity, and increased mouthdrying
perception of WPB, when compared with younger adults. This hypothesis was tested through the
following objectives:

(1)   A pilot study was carried out with the objective of establishing whether the protein measured
      in the oral cavity post WPB consumption resulted from mucoadhesion of the WPB (rather than
      resulting from consumption-induced release of salivary protein). The pilot study was conducted in
      younger adults and measured protein concentration of saliva samples post beverage consumption
      (WPB and whey permeate beverage (WPeB)) at 4 different timepoints (15 s, 30 s, 60 s and 120 s),
      in order to validate the oral retention method.
(2)   The main study had the following objectives: (a) to measure salivary flow rates from unstimulated
      and stimulated saliva, (b) to determine if protein adheres to the oral cavity of older adults to a
      greater extent than younger adults, (c) to determine if salivary flow rates influence mucoadhesion
      and perception of WPBs, and (d) to evaluate whether heat treatment of protein in WPB causes
      mouthdrying and reduced acceptance within each volunteer group. This study recruited younger
      and older adults to test these objectives.

2. Materials and Methods

2.1. Overview of Pilot and Main Study
      The pilot study was a single blinded randomised crossover trial with one study visit, involving
22 healthy male and female younger volunteers (18–30 years; 25.7 ± 3.0 years). The main study consisted
of 84 healthy male and female volunteers from two age groups (42 younger adults; 18–30 years,
24.3 ± 3.6 years and 42 older adults; over 65 years, 73.6 ± 6.2 years) who completed a single blinded
randomised crossover trial involving three study visits (volunteer overview; Supplementary Materials,
Table S1). In both studies the subject size was determined by power calculations (alpha risk = 0.05 and
80% power) based on previous study data [33] using protein retention in the oral cavity as the primary
outcome measure. In the pilot study comparing WPB with WPeB we estimated a difference in protein
concentration of 1.5 mg/mL saliva and standard deviation of 1.5, which concluded a minimum sample
size of 15. In the main study to compare oral retention for WPB in younger versus older adults we
anticipated a smaller difference of 0.7 mg/mL (standard deviation 1.5), inferring a minimum sample
size of 72. Volunteers were recruited from the local Reading area. The studies were conducted in
accordance with the Declaration of Helsinki. All volunteers had the study fully explained to them and
provided informed written consent before taking part. They were informed that all data would be
anonymous and kept fully confidential and that there was a right to withdraw. The studies received
a favourable opinion for conduct from the University of Reading Research Ethics Committee (pilot
study: SCFP 28/19 and main study: UREC 18/46) and the study was registered on the clinical trials
database (www.clinicaltrials.gov as NCT03798730).
      All volunteers were screened to ensure suitability (minimal medication, non-smoker, no food
allergies or intolerances, non-diabetic and not having had either cancer, oral surgery or a stroke).
Volunteers who met the inclusion criteria and were willing to take part were invited to attend study
visits held at the Sensory Science Centre, University of Reading; the study overview is summarised in
Figure 1. In order to control extraneous variables, volunteers refrained on the day of each study visit
from tea and coffee and drank a glass of water one hour before the visit. Each individual volunteer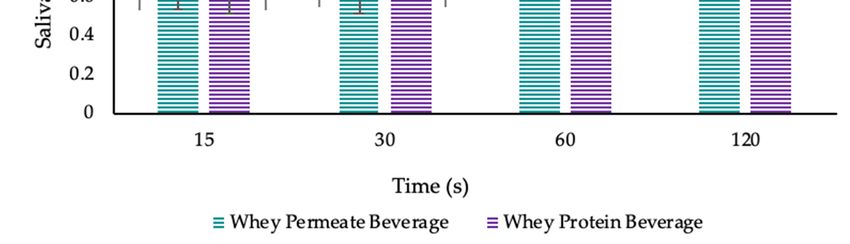
Nutrients 2020, 12, 2506 4 of 21
completed all their study visits at the same time of day in a temperature-controlled room (22 ◦ C) under
Nutrients
artificial2020, 12, x FOR PEER REVIEW
daylight. 4 of 21
Figure 1. Overview of pilot and main studies (WPB: whey protein beverage).
Figure 1. Overview of pilot and main studies (WPB: whey protein beverage).
2.2. Materials
2.2. Materials
Whey powders were provided by Volac (Volac International Ltd., Royston, UK) as whey protein
concentratepowders
Whey were provided
(WPC, Volactive by Volac
Ultra-Whey 80,(Volac International
providing a minimum Ltd.,protein
Royston, UK) as
content ofwhey protein
80% and the
concentrate (WPC, Volactive Ultra-Whey 80, providing a minimum protein
remaining 20% being lactose, fat, moisture and ash), as well as whey permeate (WPe, Volactose Taw content of 80% and the
remaining
Whey Permeate,20% being lactose,afat,
providing moisturelactose
minimum and ash), as well
content of as
89%whey
andpermeate
the remaining(WPe, 11%Volactose
beingTawash,
Whey Permeate, providing a ®
minimum lactose content of 89% and the remaining
moisture, protein and fat). Parafilm , Bradford reagent (500 mL, 0.1–1.4 mg/mL) and protein standard 11% being ash,
moisture, protein and
2 mg/mL (Bovine Serumfat).Albumin,
Parafilm®BSA)
, Bradford reagent (500
were supplied mL, 0.1–1.4 mg/mL)
by Sigma-Aldrich (Dorset,andUK).
protein standard
2 mg/mL (Bovine Serum Albumin, BSA) were supplied by Sigma-Aldrich (Dorset, UK).
2.3. Liquid Model Preparation
2.3. Liquid Model Preparation
The pilot study tested two different beverages, first, a WPB (10% w/v, WPC powder in deionised
water)Thewaspilot study
used as tested twobeverage.
a protein different beverages, first, a WPB is
A 10% concentration (10% w/v, WPCsufficient
considered powder in to deionised
stimulate
water) was usedmuscle
a postprandial as a protein
proteinbeverage.
synthesisAresponse
10% concentration
in older adultsis considered sufficient tobeen
and has previously stimulate
used in a
postprandial muscle protein
WPB testing [18,41]. Second,synthesis
a WPeB (4% response in older
w/v, whey adults powder
permeate and has previously
in deionised been used
water) in WPB
was used
testing [18,41]. Second,
as the control beverage. a WPeB (4% w/v,
The WPeB whey permeate
concentration waspowder
selectedinasdeionised
being below water) thewas used as
lactose the
sweet
control beverage. The WPeB concentration was selected as being below the lactose
recognition threshold (4.19%), therefore unlikely to cause sweetness-stimulated additional saliva flow sweet recognition
threshold
and having (4.19%), therefore
a relatively unlikely
similar to cause
mineral profilesweetness-stimulated
to the protein beverage additional
[42,43]. saliva
The main flowstudy
and having
tested
atwo
relatively
differentsimilar
WPBsmineral
(10% w/v,profile
WPC to powder
the protein beverage [42,43].
in deionised water, asThe main study
outlined above)tested
for two different
the influence
WPBs
of heat(10% w/v, WPC
treatment; usingpowder
unheated in WPB
deionised
(WPCU) water,
andasheated
outlined
WPB above)
(WPCH) for samples,
the influence of heat
an overview
treatment; usingbeverages
of both studies unheatedisWPB (WPCU)
outlined and2.heated
in Table Sample WPB (WPCH)
heating samples,(70
temperature an ◦overview of both
C) was chosen as
studies beverages isthe
beta-lactoglobulin, outlined in Tableprotein
most abundant 2. Sample heating
in WPC, hastemperature (70 °C) was
a critical temperature for chosen as beta-
denaturation of
◦
lactoglobulin,
70 C [18,44,45]. theThe
most abundant
sample protein
heating time inof WPC,
20-minhas wasa selected
critical temperature
as the maximum for denaturation of 70
time the product
°C [18,44,45]. The sample heating time of 20-min was selected as the maximum time the product
could be maintained at 70 °C without aggregation and remain acceptable to serve to consumers [18].
In both the pilot and the main study, the method was adapted from previous work [18] with both
samples being prepared simultaneously, as summarised in Figure 2.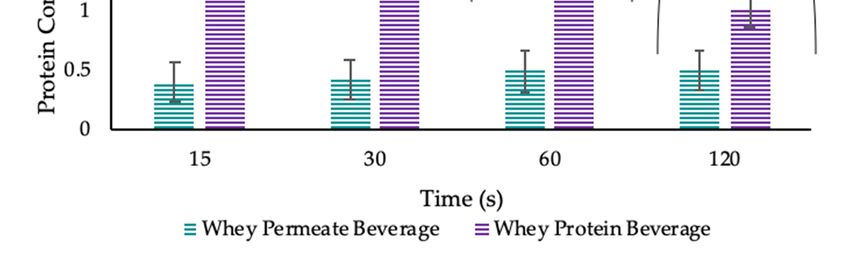
Nutrients 2020, 12, 2506 5 of 21
Nutrients 2020, 12, x FOR PEER REVIEW 5 of 21
could Table 2. Overview
be maintained at of
70 whey protein aggregation
◦ C without beverage (WPB,
and10% w/v) and
remain whey permeate
acceptable to servebeverage (WPeB,[18].
to consumers
4% w/v).
In both the pilot and the main study, the method was adapted from previous work [18] with both
samples being prepared simultaneously, as summarised
Whey in Figure 2.
Protein Beverage Whey Permeate Beverage
Per 5 mL 1 Per 10 mL 2
Perand
100whey
mL permeate beverage
Per Per 10 mL 2
100 mL
Table 2. Overview of whey protein beverage (WPB, 10% w/v) (WPeB,
Nutritional
4% w/v). Composition
Energy (kcal) 2.0 4.0 39.7 1.5 14.7
Fat (g) 0.04Whey Protein
0.07Beverage 0.7 Whey Permeate Beverage
0.0008 0.008
of which saturates (g) mL 1
Per 50.01 Per 10 mL 2
0.03 0.3mL
Per 100 - 2
Per 10 mL -
Per 100 mL
Carbohydrate
Nutritional (g)
Composition 0.02 0.04 0.4 0.4 3.6
of which
Energysugars
(kcal) (g) 0.02
2.0 0.04
4.0 0.4
39.7 1.5- 14.7 -
Fat (g)(g)
Protein 0.04
0.4 0.07
0.8 0.7
8.2 0.0008
0.01 0.0080.1
of which saturates
Typical Mineral (g)
Profile 0.01 0.03 0.3 - -
Carbohydrate (g) 0.02 0.04 0.4 0.4 3.6
of Calcium (mg)(g)
which sugars 0.02- 5.5
0.04 55
0.4 -2.2 - 21.6
Magnesium
Protein (g)(mg) 0.4- 0.5
0.8 8.25 0.4
0.01 0.14.4
Phosphorus
Typical Mineral (mg)
Profile - 3.5 35 2.4 24.4
Calcium (mg)
Potassium (mg) -- 5.5
5 5550 2.25.7 21.6
57.2
Magnesium (mg) - 0.5 5 0.4 4.4
Sodium (mg) - 1.5 15 1.8 18.4
Phosphorus (mg) - 3.5 35 2.4 24.4
Potassium (mg)
Chloride (mg) -- 0.5
5 505 5.71.8 18.4
57.2
Chemical
SodiumProperties
(mg) - 1.5 15 1.8 18.4
Protein(mg)
Chloride % -- 0.8
0.5 58.2 0.01
1.8 18.40.1
Chemical Properties
Moisture % - 0.05 0.5 0.004 0.04
Protein % - 0.8 8.2 0.01 0.1
Ash % - 0.04 0.4 0.02 0.2
Moisture % - 0.05 0.5 0.004 0.04
Lactose
Ash % % - - 0.04
0.04 0.4
0.4 0.4
0.02 0.23.6
Fat %%
Lactose - - 0.07
0.04 0.7
0.4 0.008
0.4 0.008
3.6
pH%
Fat -- 6.5
0.07 6.5
0.7 5.6
0.008 5.6
0.008
1 5 mL sippH
size was used for WPB-perception and
6.5liking in the 6.5 5.6 2 10 mL sip 5.6
main study only; size was
1 5 mL sip size oral
was used for WPB perception and liking in the main study only; 2 10 mL sip size was used in the oral
used in the retention method in both studies.
retention method in both studies.
Figure 2. Overview of beverage preparation in both studies (WPB: whey protein beverage; WPeB: whey
Figure 2.beverage;
permeate OverviewWPC:of beverage preparation
whey protein in bothWPCU:
concentrate; studiesunheated
(WPB: wheyWPB;protein
WPCH: beverage; WPeB:
heated WPB).
1 whey permeate beverage; WPC: whey protein concentrate; WPCU: unheated2 WPB; WPCH:
additional time period was based on the time it took to heat and cool WPCH; the time to 70 C was ◦ heated
WPB). 1 (20.9
recorded additional time and
± 4.7-min) period was based
maintained on◦the
at 70 time
C for it took20-min
a further to heatand
andcooled
cool WPCH; 2 the time to 70
to room temperature.
°C was recorded (20.9 ± 4.7-min) and maintained at 70 °C for a further 20-min and cooled to room
2.3.1. Salivary Flow Rates
temperature.
Saliva collection methods were adapted from previous studies [5,46]. In the pilot study saliva
2.3.1. Salivary Flow Rates
collection (unstimulated and stimulated saliva) was carried out at the beginning of the study visit with
approximately 10 to 15-min
Saliva collection breakwere
methods between collection
adapted methods.studies
from previous During[5,46].
the main study
In the unstimulated
pilot study saliva
collection (unstimulated and stimulated saliva) was carried out at the beginning of the study visit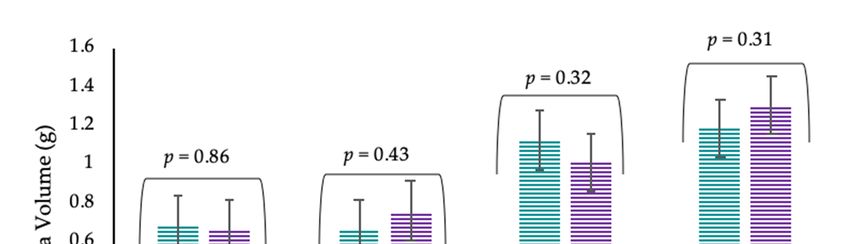
Nutrients 2020, 12, 2506 6 of 21
saliva was collected by volunteers at the beginning of all three study visits and two replicates of
stimulated saliva were collected from volunteers during study visit one, with approximately 10 to
15-min break between each collection. The rationale for the saliva collection was based on unstimulated
saliva being considered a baseline measure and potentially more influenced by age than stimulated
saliva [47,48]. In addition, it was unrealistic to expect older volunteers to provide a total of 10 saliva
samples during a single study visit, therefore it was considered impossible to collect both unstimulated
and stimulated saliva at study visits two and three. However, stimulated saliva was used as a baseline
value for saliva samples post beverages consumption (see Section 2.3.2) as stimulated saliva is produced
during food mastication and has supported better correlations with study outcomes compared with
unstimulated saliva [48,49] and accordingly has been used in other saliva studies for analytical saliva
analysis [50].
Unstimulated saliva was collected by asking volunteers to collect saliva in their mouths and to
spit out saliva every time they felt the urge to swallow during a 5-min time period; saliva was collected
in a wide lid collection tube (60 mL). Stimulated saliva was collected by asking volunteers to spit
out saliva every time they felt the urge to swallow during a 2-min time period, while chewing on
parafilm® (5 × 5 cm), again into a wide lid collection tube (60 mL). Saliva weights for all volunteers
were monitored by weighing collection tubes before and after collection. Using the weights collected,
salivary flow rates were calculated as mL/min, using the assumption 1 g of saliva equates to 1 mL.
All saliva samples were stored on ice pending analysis.
2.3.2. Saliva Samples Post Beverage Consumption
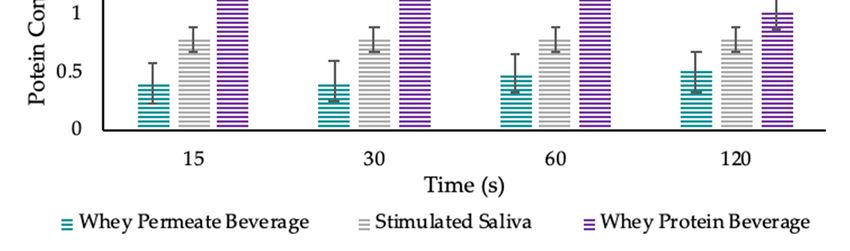
An adapted oral retention method (Figure 3) [33,40] was used in both studies to measure the
protein remaining in saliva samples post beverage consumption. Stimulated saliva samples were
collected (as described above) and used as a baseline measurement. All volunteers were provided
with eight 10 mL beverage samples (pilot study: 4 ×WPB and 4 × WPeB; main study: 4 × WPCU
and 4 × WPCH) monadically in a balanced order; all samples were presented in opaque black plastic
cups (25 mL) (BB Plastics, West Yorkshire, UK) (to mask minor visual differences between samples)
coded with a random three-digit number. Volunteers also gave eight saliva samples post beverage
consumption at defined randomised time points (15 s, 30 s, 60 s and 120 s). The procedure was carried
out in duplicate for all volunteers (visits two and three) during the main study. In order to prevent
crossover effects, volunteers had an enforced 5-min break between samples where they consumed
warm filtered water; this is considered more effective than cold water at removing fatty dairy residues
from the mouth [17]. The rationale for choosing a 5-min break was based on protein in saliva samples
being considered to have plateaued within 3-min of WPB consumption (regardless of heating time) [33].
Saliva weight of all samples was measured by recording tube weight pre and post collection; all saliva
samples were stored on ice pending analysis. The oral retention method development stages are
outlined in Appendix A.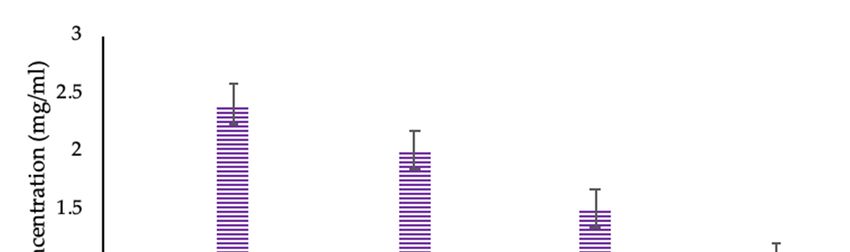
Nutrients 2020, 12, 2506                                                                                           7 of 21
Nutrients 2020, 12, x FOR PEER REVIEW                                                                              7 of 21

     Figure 3. Brief overview of saliva samples post beverage consumption protocol. Volunteers were
     Figure 3. Brief overview of saliva samples post beverage consumption protocol. Volunteers were
     provided with verbal and written instructions as to the protocol and given the opportunity to ask
     provided with verbal and written instructions as to the protocol and given the opportunity to ask
     questions. Volunteers were provided with one 10 mL sample and asked to swill the sample around in
     questions. Volunteers were provided with one 10 mL sample and asked to swill the sample around
     their mouth for 10 s before swallowing. After this a randomised countdown clock (time; either 15 s,
     in their mouth for 10 s before swallowing. After this a randomised countdown clock (time; either 15
     30 s, 60 s or 120 s) was started and once it reached zero, volunteers gave a saliva sample into wide lid
     s, 30 s, 60 s or 120 s) was started and once it reached zero, volunteers gave a saliva sample into wide
     collection tube (60 mL). A 5-min rest period followed, with the procedure being repeated for the seven
     lid collection tube (60 mL). A 5-min rest period followed, with the procedure being repeated for the
     remaining samples and timepoints.
     seven remaining samples and timepoints.
2.3.3. Protein Analysis of Saliva Samples
2.3.4. WPB Individual Perception and Liking
      In both studies, protein concentration (mg/mL) in saliva samples was analysed using Bradford
Assay During
        [51,52].theSamples
                     main study      volunteersinrated
                             were measured                 liking,
                                                     triplicate  witheffort  to consume
                                                                        biological            (easinessreplicates
                                                                                    and analytical        to drinkusingand
swallow),   attribute   perception     and  appropriateness       of  attribute  level   (Just-About-Right,
a 96 Well Plate Assay Protocol (Tecan Spark Control v2.1, Maneodorf, Switzerland). BSA was used                   JAR)   of
WPBs
as the (WPCU      and WPCH)
        protein standard,        (Figure 64)decreasing
                             providing       individually     on an iPad
                                                           dilutions   mixed(Apple,   UK), either
                                                                               with purified         in isolated
                                                                                                 water   (SUEZ, booths
                                                                                                                   Bristol,
(younger   adults)   or at a table  (older  adults)   using   Compusense       Cloud   software
UK), ranging from 2 mg/mL to 0.125 mg/mL in triplicate, as well as a blank consisting of purified  (Compusense,        ON,
Canada).   Samples,   coded   with   three-digit   random     numbers,    were   provided     in a monadic
water on each individual 96 well plate. All saliva samples collected were analysed as a 1:2 dilution          sequential
balanced
combining order,
             salivawith
                     andsample
                          purifiedsets  randomly
                                    water  with 5 µLallocated   to into
                                                         pipetted  volunteers.   Volunteers
                                                                         each well.  Bradfordreceived
                                                                                                  Reagent5(250
                                                                                                             mL µL)
                                                                                                                  of WPB
                                                                                                                       was
in opaque   black   plastic cups   (25  mL)  and   all volunteers    were   trained  by   a  short video
added to each well and each plate was placed on a shaker for 30 s and read within a 5 to 60-min period.    as  to  how   to
use  the generalised
All analysis  was carriedLabelled    Magnitudefollowing
                             out immediately        Scale (gLMS),     a scalestudy
                                                              a volunteer’s     ranging
                                                                                      visit.from
                                                                                              Eachno   sensationbaseline
                                                                                                    volunteers       (0) to
strongest  imaginable
saliva protein           sensation
                 measurement          of any kind
                                 (stimulated   saliva(100)  [53].concentration)
                                                        protein   Volunteers had  wasansubtracted
                                                                                         enforced restfromperiod    of 45 s
                                                                                                            their sample
between   samples and at
saliva measurements       consumed
                             each timewarmpointfiltered   waterthe
                                                to calculate     before   completing
                                                                    concentration     ofthe   sameremaining
                                                                                          protein   series of questions
                                                                                                                 in saliva
on the second
samples          sample. consumption.
          post beverage

2.3.4. WPB Individual Perception and Liking
      During the main study volunteers rated liking, effort to consume (easiness to drink and swallow),
attribute perception and appropriateness of attribute level (Just-About-Right, JAR) of WPBs (WPCU
and WPCH) (Figure 4) individually on an iPad (Apple, UK), either in isolated booths (younger adults)
or at a table (older adults) using Compusense Cloud software (Compusense, ON, Canada). Samples,
coded with three-digit random numbers, were provided in a monadic sequential balanced order,
with sample sets randomly allocated to volunteers. Volunteers received 5 mL of WPB in opaque black
plastic cups (25 mL) and all volunteers were trained by a short video as to how to use the generalised
Nutrients 2020, 12, 2506 8 of 21
Labelled Magnitude Scale (gLMS), a scale ranging from no sensation (0) to strongest imaginable
sensation of any kind (100) [53]. Volunteers had an enforced rest period of 45 s between samples and
Nutrients 2020, 12, x FOR PEER REVIEW 8 of 21
consumed warm filtered water before completing the same series of questions on the second sample.
Figure
Figure 4. Overview
4. Overview of whey
of whey protein
protein beverage
beverage (WPB)
(WPB) individual
individual perception
perception and liking
and liking (gLMS:
(gLMS:
generalised Labelled Magnitude Scale; JAR: Just-About-Right; 2AFC: two alternative forced choice).
generalised Labelled Magnitude Scale; JAR: Just-About-Right; 2AFC: two alternative forced choice).
2.4. Statistical Analysis
2.4. Statistical Analysis
2.4.1. Pilot Study
2.4.1. Pilot Study
Statistical analysis was all carried out in SAS® software (SAS Institute Inc., Version 9.4, North
StatisticalNC,
Carolina, analysis was all
USA) using carried
a linear out in
mixed SAS®considered
model software (SASrobustInstitute
enough Inc., Version 9.4,
for unbalanced North
data [54] and
Carolina, NC, USA) using a linear mixed model considered robust enough for
adjusted for multiplicity using Bonferroni. Saliva samples post beverage consumption were analysedunbalanced data [54]
and using
adjusted for multiplicity
explanatory variablesusingsuch asBonferroni. Salivatime,
beverage type, samples
gender post
andbeverage consumption
with volunteer code as awere
random
analysed
effect using
and theexplanatory
dependentvariables
variable wassuchprotein
as beverage type, time, gender and with volunteer code
concentration.
as a random effect and the dependent variable was protein concentration.
2.4.2. Main Study
2.4.2. Main Study
Tertiary analysis was used to categorise volunteers into low, medium and high groups, based
Tertiary
on average analysis was
salivary flowusedratesto using
categorise
XLSTATvolunteers
(versioninto low, medium
2019.2.2, Addinsoft, andBoston,
high groups,
MA, USA);basedthese
on average
groupingssalivary
were flow rates for
also used using XLSTAT
statistical (version
analysis for2019.2.2, Addinsoft,
unstimulated Boston,
salivary flow MA,
rates.USA); these
In order to test
groupings were also
associations usedage
between for and
statistical analysis
categorical datafor unstimulated
(saliva flow rate salivary
groupingflow andrates. In ordera to
medication) test
chi-square
associations
test was between
carried outageonand categorical
contingency datausing
tables (saliva flow rate
XLSTAT. grouping
Statistical and medication)
analysis was also carrieda chi-
out in
square ®
SAStestsoftware
was carried
usingout on contingency
a linear mixed model tables
and using XLSTAT.
adjusted Statistical analysis
for multiplicity was also carried
using Bonferroni. Analysis of
out in SASsamples
saliva ® softwarepostusing
WPBaconsumption
linear mixed used model and adjusted
explanatory for multiplicity
variables such as visit,using
age,Bonferroni.
beverage type,
Analysis
time, of salivasaliva
gender, samples
flow,post WPB consumption
medication used explanatory
and with volunteer variables
code as a random suchand
effect as the
visit, age,
dependent
beverage type,
variable wastime, gender,
protein saliva flow, medication
concentration. Baseline salivaand samples
with volunteer code asflow
and salivary a random effectanalysed
rates were and
the dependent variablevariables
using explanatory was protein concentration.
of age, gender, visit Baseline
and withsaliva samplescode
volunteer and assalivary
a randomfloweffect
rates and
weretheanalysed
dependentusingvariables
explanatorywerevariables of age, gender,and
protein concentration visitsaliva
and with
flowvolunteer codeThe
respectively. as adata
randomrelating
effect
toand the dependent
volunteer variables and
WPB perception wereliking
protein concentration
was analysed using and saliva flow respectively.
explanatory variables ofThe age,data
gender,
relating to volunteer
beverage WPBflow,
type, saliva perception
medication andandliking
with was analysed
volunteer using
code as aexplanatory
random effect variables
and the of age,
dependent
gender, beverage
variables weretype,
gLMS saliva
data,flow,
likingmedication and with
and JAR scores. volunteerdata
All attribute code as a random
which effecton
was collected andthethe
gLMS
dependent variables were gLMS data, liking and JAR scores. All attribute data which was collected
on the gLMS log-scale was transformed to linear data (antilogged). Values are expressed as least
square means (LSM) estimates, as these values best reflect the statistical model. Penalty analysis was
carried out by XLSTAT with WPB JAR and liking scores, with 20% selected as the threshold for
population size. Penalty analysis evaluated the influence of volunteer perception of appropriatenessNutrients 2020, 12, 2506 9 of 21
log-scale was transformed to linear data (antilogged). Values are expressed as least square means
(LSM) estimates, as these values best reflect the statistical model. Penalty analysis was carried out
by XLSTAT with WPB JAR and liking scores, with 20% selected as the threshold for population size.
Penalty analysis evaluated the influence of volunteer perception of appropriateness of attribute level
rating (JAR) on volunteer liking by calculating the mean drop in liking rating (scale 1–9) compared
with mean liking
Nutrients 2020,of
12,volunteers that rated the attribute as JAR (JAR 3 on 1–5 scale), determined
x FOR PEER REVIEW 9 of 21whether
this drop in liking score is significant. Analysis of significant preferences between WPB samples was
1–9) compared with mean liking of volunteers that rated the attribute as JAR (JAR 3 on 1–5 scale),
calculated using a Binomial expansion in V-Power [55]. In all analysis p < 0.05 was used as the value
determined whether this drop in liking score is significant. Analysis of significant preferences
for significant difference.
between WPB samples was calculated using a Binomial expansion in V-Power [55]. In all analysis p
< 0.05 was used as the value for significant difference.
3. Results
3. Results
3.1. Pilot Study (Salivary Flow Rates and Saliva Samples Post Beverage Consumption)
3.1. Pilot Study (Salivary Flow Rates and Saliva Samples Post Beverage Consumption)
Salivary flow rates were 0.89 ± 0.33 mL/min and 2.56 ± 0.94 mL/min for unstimulated and
stimulated Salivary flow rates were
saliva respectively. 0.89 ± 0.33
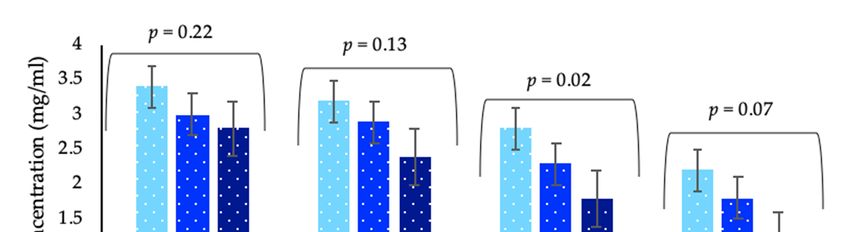
Beverage mL/min
type (WPB andor2.56 ± 0.94
WPeB) hadmL/min for unstimulated
a significant effect (pand
< 0.0001),
stimulated saliva respectively. Beverage type (WPB or WPeB) had a significant effect (p < 0.0001),
with the WPB leading to substantially and significantly more protein being collected in the saliva
with the WPB leading to substantially and significantly more protein being collected in the saliva
samplessamples
at all time points
at all time post
points beverage
post beverage consumption (Figure
consumption (Figure 5). Time
5). Time also
also had had a significant
a significant effect (p effect
(p = 0.0004), with
= 0.0004), saliva
with saliva samples post
samples post WPB WPB consumption
consumption showingshowing a higher
a higher protein protein
content at 15content
s which at 15 s
which decline
decline over time(30,
over time (30,6060and
and120
120
s) s) whereas
whereas WPeB
WPeB had had a lower
a lower salivasaliva protein
protein contentcontent throughout
throughout
which remained relatively
which remained relatively constant. constant.
Figure 5. Protein
Figure concentration
5. Protein in in
concentration saliva
salivasamples postbeverage
samples post beverage consumption
consumption by timepoints.
by timepoints. Values Values
are expressed as LSM
are expressed estimates
as LSM ± standard
estimates ± standarderror fromSAS
error from SASoutput.
output. Significant
Significant differences
differences (p < 0.05)
(p < 0.05)
were reported
were reported betweenbetween beverages
beverages at all
at all timepoints with
timepoints withrelevant
relevantp value above
p value each each
above timepoint.
timepoint.
3.2. Main
3.2.Study
Main Study
3.2.1. Salivary
3.2.1. Salivary FlowFlow Rates
Rates
Older Older
adultsadults demonstrated significantly lower unstimulated saliva flow (p = 0.003) when
demonstrated significantly lower unstimulated saliva flow (p = 0.003) when
compared with younger adults (LSM estimates ± SE: younger adults 0.90 ± 0.07 and older adults 0.62
compared with younger adults (LSM estimates ± SE: younger adults 0.90 ± 0.07 and older adults
± 0.06 mL/min). However, age had no significant effect (p = 0.53) on stimulated saliva flow (younger
0.62 ± 0.06
adultsmL/min). However,
2.53 ± 0.19 and age2.37
older adults had no mL/min).
± 0.18 significant effect (p
Volunteers = 0.53)
were grouped onbystimulated saliva flow
tertiary analysis
(younger adults
into 2.53 ± 0.19
low, medium and salivary
and high older adults
flow rate, ± 0.18
2.37based onmL/min). Volunteers
average salivary were
flow rates grouped
(Table by tertiary
3). There
analysiswas a significant
into low, medium association (p = 0.04)
and high between
salivary agerate,
flow and saliva
basedflowon grouping
average for unstimulated
salivary saliva,(Table 3).
flow rates
however,
There was stimulated
a significant saliva flow (p
association grouping
= 0.04)was shown to
between agebeand
not significantly
saliva flow(pgrouping
= 0.20) related to age.
for unstimulated
Age was significantly associated (p < 0.0001) with medication, indicating increasing use of medication
saliva, however, stimulated saliva flow grouping was shown to be not significantly (p = 0.20) related
with age (Table S1) however, medication had no significant effect on saliva flow in older adults
to age. (unstimulated
Age was significantly associated
saliva flow (USF): p = 0.70 (pNutrients 2020, 12, 2506 10 of 21
shown). Gender had a significant effect (USF: p = 0.02 and SSF: p = 0.02) on saliva flow regardless of
collection method; males having significantly higher salivary flow compared with females (USF: males
0.88 ± 0.07 and females 0.66 ± 0.05 mL/min and SSF: males 2.73 ± 0.20 and females 2.17 ± 0.15 mL/min).
Table 3. Summary of volunteers salivary flow rates categories 1 (ml/min).
Unstimulated Saliva Flow Stimulated Saliva Flow
Low Medium High Low Medium High
(0.04–0.53) (0.53–0.77) (0.77–2.18) (0.23–1.63) (1.63–2.76) (2.77–6.13)
Total (n = 84) 28 27 29 25 30 29
Younger Adults
9 14 19 9 18 15
(n = 42)
Older Adults
19 13 10 16 12 14
(n = 42)
1 Categories are defined by tertiles with mL/min range for the category.
3.2.2. Saliva Samples Post WPB Consumption
Older adults had significantly higher protein concentration (p = 0.02) in their saliva samples
compared with younger adults post WPB consumption, at all timepoints (Figure 6). Time had a
significant effect (p < 0.0001) with most saliva samples post WPB consumption demonstrating a higher
protein content at 15 s when compared with 30, 60 and 120 s. Although there was an overall significant
difference (p = 0.05) between samples, with unheated WPB samples leading to a slightly higher protein
concentration in saliva samples compared with a heated sample, this difference was not consistent
at each time point and there were no significant differences between the samples at the timepoints
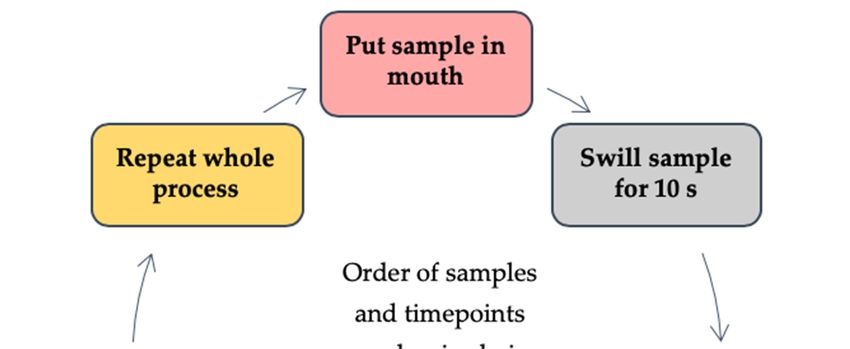
(p = 0.14). There was significant variability between individual visits (p < 0.0001), but the overall
trends remained the same (Figure S1). Although there was no overall significant effect of saliva flow
(p = 0.06) on adhered protein concentration, the tendency was for the adhered protein content to
decrease with increasing unstimulated saliva flow rate and this was significant at the 60 s collection
time (p = 0.02) (Figure 7). There was no significant effect on protein concentration relating to gender
and medication
Nutrients 2020, (Figure S2).REVIEW
12, x FOR PEER 11 of 21
Figure 6. Protein concentration in saliva samples post whey protein beverage (WPB) consumption
Figure 6. Protein concentration in saliva samples post whey protein beverage (WPB) consumption by
by ageage
and timepoints (WPCU: unheated WPB; WPCH: heated WPB). Values are expressed as LSM
and timepoints (WPCU: unheated WPB; WPCH: heated WPB). Values are expressed as LSM
estimates ± standard
estimates ± standard error
errorfrom SASoutput.
from SAS output. Significant
Significant differences
differences (p < 0.05) (p < 0.05)
were reportedwere reported between
between
age groups at allat timepoints
age groups all timepointswith relevant
with relevant p value
p value aboveabove each timepoint.
each timepoint. Data from Data
visit 2 from YA 2 (n = 84; YA
(n = 84;visit
(Younger
(Younger Adults) n =n 42
Adults) = 42and
and OA
OA (Older
(OlderAdults)
Adults) n =and
n = 42) 42)visit
and 3 (nvisit
= 82;3YA(nn== 82;
40 (2YA = 40 (2 YA dropped
YAndropped
out after visit 2) and OA n = 42) combined. Baseline saliva protein concentration values are outlined
out after visit 2) and OA n = 42) combined. Baseline saliva protein concentration values are outlined in
in Table S2.
Table S2.estimates ± standard error from SAS output. Significant differences (p < 0.05) were reported between
age groups at all timepoints with relevant p value above each timepoint. Data from visit 2 (n = 84; YA
(Younger Adults) n = 42 and OA (Older Adults) n = 42) and visit 3 (n = 82; YA n = 40 (2 YA dropped
out after visit 2) and OA n = 42) combined. Baseline saliva protein concentration values are outlined
Nutrients 2020, 12,
in Table S2.2506 11 of 21
Figure 7. Protein concentration in saliva samples post whey protein beverage consumption by
Figure 7. Protein concentration in saliva samples post whey protein beverage consumption by
timepoints and saliva flow groupings. Values are expressed as LSM estimates ± standard error from
timepoints and saliva flow groupings. Values are expressed as LSM estimates ± standard error from
SAS output. Significant differences (p < 0.05) were reported only at 60 s with relevant p value above each
SAS output. Significant differences (p < 0.05) were reported only at 60 s with relevant p value above
timepoint. Data from visit 2 (n = 84) and visit 3 (n = 82) combined. Individual saliva flow groupings
each timepoint. Data from visit 2 (n = 84) and visit 3 (n = 82) combined. Individual saliva flow
are derived from unstimulated saliva flow only, through tertiary analysis.
groupings are derived from unstimulated saliva flow only, through tertiary analysis.
3.2.3. WPB Individual Perception and Liking
The heated WPB was perceived as significantly (p < 0.05) thicker, less sweet and easy to swallow
and resulted in more mouthdrying compared with the unheated WPB (Table 4). The increased thickness
resulted in the beverage being significantly closer to “Just-About-Right” thickness as opposed to too
thin (Table 5). There were no significant differences between the age groups, however, older adults did
score attributes thickness and mouthdrying significantly lower than the younger adults for the heated
WPB (Table 4). There was a significant effect (p = 0.03) of liking where older adults had significantly
higher liking scores following the heated WPB compared with younger adults, however, there was
no significant effect of liking on the unheated WPB. There was no significant effect of age on effort
to consume and JAR attributes, though younger adults scored unheated WPB notable thicker than
older adults (Tables 4 and 5). There was no overall significant effect of saliva flow on WPB liking and
perception, however, by categorising the volunteers into low, medium and high saliva flow groupings
by tertiary analysis using unstimulated saliva flow, we found there were some interesting trends.
In particular there was trends at a lower saliva flow for mouthdrying to be lower (low versus medium
and high SF: p = 0.33 and p = 0.36 respectively), sweetness to be higher (low versus medium and high
SF: p = 0.44 and p = 0.09 respectively) and thickness to be lower (low versus medium and high SF:
p = 0.55 and p = 0.23 respectively) (Table 4). Volunteers not taking medication had significantly higher
overall liking scores (p = 0.03) compared with medication users and males reported significantly higher
easiness to swallow scores (p = 0.02) compared with females, however, no further significant effects on
perception and liking were reported relating to medication or gender (Table S3).Nutrients 2020, 12, 2506 12 of 21
Table 4. Volunteers liking, effort to consume and attribute perception mean ratings of whey protein beverages (WPB); overall and by age and unstimulated saliva
flow rate.
Overall (n = 84) Age Unstimulated Saliva Flow
Significance of Sample (p Value) Younger Adults (n = 42) Older Adults (n = 42) Low Saliva Flow (n = 27) Medium Saliva Flow (n = 28) High Saliva Flow (n = 29)
Overall Liking
WPCU 3.7 ± 0.3 3.6 ± 0.4 A 3.7 ± 0.3 3.5 ± 0.4 3.8 ± 0.3 A 3.6 ± 0.4
0.10
WPCH 3.3 ± 0.3 2.8 ± 0.4 aB 3.9 ± 0.3 b 2.9 ± 0.4 3.3 ± 0.3 B 3.7 ± 0.4
Easiness to Drink
WPCU 3.9 ± 0.1 4.0 ± 0.2 3.9 ± 0.2 4.2 ± 0.2 A 3.8 ± 0.2 3.8 ± 0.2
0.11
WPCH 3.7 ± 0.1 3.6 ± 0.3 3.8 ± 0.2 3.7 ± 0.2 B 3.8 ± 0.2 3.6 ± 0.2
Easiness to Swallow
WPCU 4.2 ± 0.1 4.4 ± 0.2 A 4.1 ± 0.2 4.4 ± 0.2 A 4.2 ± 0.1 A 3.9 ± 0.2
0.0004
WPCH 3.9 ± 0.1 3.7 ± 0.2 B 4.0 ± 0.2 3.9 ± 0.2 B 3.9 ± 0.1 B 3.9 ± 0.2
Mouthdrying
WPCU 16.9 ± 3.5 18.1 ± 5.2 A 15.7 ± 3.8 A 15.5 ± 4.8 A 15.8 ± 4.6 A 19.3 ± 5.0 ANutrients 2020, 12, 2506 13 of 21
3.2.4. Preference, Penalty Analysis and Qualitative Feedback
There was no significant preference (p = 0.46) between WPB samples, however preference was
significantly influenced (p = 0.03) by age; younger adults preferred the unheated WPB, with older
adults preferring the heated WPB (Table S4). The volunteers’ perception of appropriateness of attribute
level (Just-About-Right, JAR, ratings) can influence their overall liking, as shown in the penalty analysis
(Table 5). There was a significant influence of thickness; where the older adults found the heated
WPB to be too thin this led to a significant and substantial reduction in the liking rating. Volunteers’
comments were categorised into emerging themes, such as, flavour, texture, descriptive feedback,
positive and negative comments and no comments provided (Table S5). Overall, there was a general
negative feedback provided for all WPB samples; volunteers provided comments relating to flavour
and texture for both the unheated and heated WPB. In total 211 comments were provided with
only 30 positive comments and the remaining 181 comments were all negative, some examples are
summarised in Table 6.
Table 6. Examples of volunteers whey protein beverage (WPB) comments (WPCU; unheated WPB and
WPCH; heated WPB).
Sample Comments and Volunteers Details
Tasteless and mouthdrying (v3, female, younger adult, aged 22). Bland flavour,
WPCU
unappealing colour, unsatisfying dry finish and aftertaste (v49, male, older adult, aged 65).
It felt strange. It was thick and made my mouth feel dry afterwards. Almost as if all the
moisture in my mouth had been sucked from it (v9, male, younger adult, aged 19). My
WPCH
mouth and teeth feel yucky. Like when you eat rhubarb, I would like to go and clean my
teeth (v79, female, older adult, aged 75).
4. Discussion
4.1. Mucoadhesion and WPB
The pilot study demonstrated that whey protein does adhere to the oral cavity (mucoadhesion) as
the protein measured in the saliva samples following the consumption of a WPB was significantly and
substantially higher than the protein content in saliva samples following consumption of a control whey
permeate beverage (WPeB).These findings are supported by previous work which suggested proteins
have adhesion and binding properties, for example: milk proteins can remain on oral surfaces [31],
WPB can bind to oral epithelial cells [30], have mucoadhesive properties [32] and increased oral
retention following a heated WPB compared with an unheated WPB [33]. However, these studies were
carried out using animal models in vivo (measuring adhesion of proteins to porcine oral mucosa),
with small subject sample sizes in human studies (5 volunteers) or without a non-protein source
control. The pilot study demonstrated that our oral retention method is an effective and valid method
to measure mucoadhesion in a WPB model.
4.2. Salivary Flow Rates
Older adults had, on average, a 27% lower unstimulated salivary flow rate when compared with
younger adults. These findings are supported by Vandenberghe-Descamps et al. who found that
healthy older adults had 38.5% lower resting salivary flow when compared with younger adults and
a 38% lower stimulated saliva; theirs results were independent of dental and medication status [5].
However, our study did not find any difference in stimulated salivary flow rate between younger and
older adults. It should however be noted that Vandenberghe-Descamps et al. measured unstimulated
and stimulated saliva over a 10 and 5-min time period [5] compared with our study which used a 5
and 2-min time period which could have caused a greater difference between age groups. Age related
changes to saliva flow are considered to relate to the submandibular and sublingual glands, whichNutrients 2020, 12, 2506 14 of 21
provide 70% of unstimulated saliva but less than 50% of stimulated saliva, providing a rationale for
the greater reduction in unstimulated saliva compared with stimulated saliva in older adults [48].
Almost all of our study volunteers lacked experience in saliva collection, accordingly stress
and behavioural factors could have contributed to poor adherence [56], for example, embarrassment
about spitting, particularly in an unfamiliar setting. Our volunteers reported collecting stimulated
saliva easier than unstimulated saliva therefore, stimulated saliva could be considered a more robust
and representative measure compared with unstimulated saliva. As some volunteers struggled
to produce unstimulated saliva, despite being considered healthy, future studies should consider
familiarisation sessions before collecting such samples. Poor oral clearance is associated with reduced
saliva function [7] and therefore could potentially explain the cause of food debris in unstimulated
saliva samples, which was more prevalent in older adults in our study. However, there are age related
changes associated with saliva (reduced volume and altered composition) resulting in saliva being
potentially less watery and more concentrated [9]. A key challenge is understanding the causes of high
variability in saliva flow associated within and between groups, however both lifestyle and the ageing
process are thought to be potential causes of reduced saliva flow [5].
4.3. Saliva Samples Post WPB Consumption
There was an age-related increase in protein concentration in saliva samples post WPB consumption,
which supported increased adhesion to the oral cavity from mucoadhesion [32,33]. A link between
increasing protein concentration and reduced salivary flow rates has been previously suggested [6],
and this was demonstrated by our volunteers where a low saliva flow correlated with increased protein
concentration, therefore suggesting increased mucoadhesion of the whey protein, however, this needs
further investigation. There is evidence of increased salivary albumin concentrations associated with
frail older adults [57]. Salivary albumin has a role within the oral cavity as a serum ultrafiltrate
and can potentially leak into saliva secretions [58] and is therefore a further possible contributor to
increased protein concentrations found within this study. Therefore, although from the pilot study
we can conclusively report that the protein content in the oral cavity post WPB consumption is due
to adhesion of the protein from the beverage; we cannot rule out the possibility that the difference
between younger and older adults could result from differences in salivary proteins rather than
differences in mucoadhesion of the whey protein. The role of saliva composition and the changes to
its physical properties were not measured in our study, however our study did find reduced salivary
flow rates with age. A reduced saliva flow can be associated with decreased lubrication, protection,
oral clearance, mucosal surfaces hydration and coating abilities within the oral cavity [6–9] and could
lead to strengthened mucoadhesion by increased tissue exposure to whey proteins and therefore more
adherence and interactions from proteins within the oral cavity [33]. In addition, there is evidence of
saliva protein concentration being influenced by stress, inflammation, infection, hormonal changes and
circadian variation [59]. These factors could potentially explain the differences in protein concentrations
between visits, it should be noted however the overall trend was not affected.
There were minimal differences in protein adhesion related to whey protein heat treatment
(unheated and heated WPB) which was unexpected. Previously, greater adhesion had been found to
correlate with heated WPB samples compared with unheated WPB in a study using a small sample size
of younger adults [33]. It is unlikely that the minimal differences found were due to cross-over effects
and build-up of protein in the mouth, as the pilot study demonstrated substantial and significant
differences between WPB and WPeB adhesion levels. This suggests that crossover effects between
samples were minimal and indeed volunteers were provided with warm filtered water as a palate
cleanser between samples, as well as having a 5-min rest between samples to minimise such effects.
We therefore conclude that whey protein does adhere to the oral cavity and that any difference in
adhesion due to heating treatment of the protein is minimal. Consideration is also required into how
the different collection timepoints (15, 30, 60 and 120 s) influence saliva samples as a result of oral
processing. For example, decreased muscle strength and swallowing difficulties are associated withNutrients 2020, 12, 2506 15 of 21
ageing [60,61]. In the context of this work this could have influenced how quickly an individual
could swallow a 10 mL sample (which could be particularly relevant at the 15 s timepoint) and affect
their ability to hold a sample in the mouth during the 10 s swill time and the gathering of saliva in
preparation for spitting, especially relevant at 120 s.
4.4. WPB Individual Perception and Liking
Mouthdrying was reported in this study following both unheated and heated WPB consumption.
The heated WPB resulted in significantly increased perception of mouthdrying and thickness and
significantly reduced sweetness, which led to a reduction in easiness to swallow. These differences
were potentially caused by increased particle size on protein denaturation [18]. There was no difference
in liking nor preference between the unheated and heated samples, which is explained by the overall
low liking scores and potentially lack of familiarity amongst the volunteers with the taste and flavours
associated with protein beverages.
4.5. Saliva and WPB Individual Perception and Liking
Individual saliva flow rates did significantly influence perception and liking of products. It was
expected that a reduced saliva flow would result in increased perception of mouthdrying, however,
the trend proved inconsistent, as unexpectedly, individuals with medium or high salivary flow rated
mouthdrying higher compared with those with low salivary flow. This does support previous research
which indicate an increased particle size detection threshold with increased saliva production in
semi solid foods [62]. This may suggest a hydration mechanism associated with mucoadhesion,
where the lubrication ability of saliva will strengthen adhesion properties with a resulting perception
of mouthdrying [39]. It would therefore be assumed that within a liquid model, such as WPB, a low
salivary flow will have reduced lubrication properties and therefore reduced adhesion properties,
with lower resulting mouthdrying intensity. Although current results provide only a trend, it should
be noted that mouthdrying in this study was measured at a single point in time. Therefore, future
work should focus on investigating mouthdrying over time to gain a better understanding into the role
of saliva flow on perception.
4.6. Age Related Changes in WPB Individual Perception and Liking
Age related trends were found within the age groups, however in most cases these trends lacked
significance between the age groups, apart from the heated WPB, where older adults had significantly
higher liking scores compared with younger adults. It could be therefore suggested that both age
groups perceived the differences within a similar range. It was hypothesised that younger adults
would be less sensitive to mouthdrying [17], however, younger adults reported greater intensity of
mouthdrying compared with older adults. It could be suggested that the cause of the minimal difference
between age groups may relate to how our study measured perception rather than lack of differences
between age groups. For example, Withers et al. measured mouthdrying using a paired discrimination
test [17] and our study measured mouthdrying using a gLMS scale, therefore potentially the differences
in the results between the two studies could relate to the sensitivity of the tests used. Older adults
tend to be less sensitive to taste and tactile sensations [63,64] which supports the conclusion in our
study where older adults reported ‘too little flavour’ more frequently than younger adults and ‘too
little thickness’ as the JAR attributes. Older adults reported a significant preference for the heated
WPB which was the thicker beverage which contrasted with the younger adults. Perception of fluid
viscosity has been found to decline with age [64] potentially explaining why our older adults preferred
a thicker beverage and providing a design pointer for products for older adults.You can also read