Urine lipoarabinomannan in HIV uninfected, smear negative, symptomatic TB patients: effective sample pretreatment for a sensitive immunoassay and ...
←
→
Page content transcription
If your browser does not render page correctly, please read the page content below
www.nature.com/scientificreports
OPEN Urine lipoarabinomannan in HIV
uninfected, smear negative,
symptomatic TB patients: effective
sample pretreatment for a sensitive
immunoassay and mass
spectrometry
Anita G. Amin1, Prithwiraj De1, Barbara Graham1, Roger I. Calderon2,3, Molly F. Franke4 &
Delphi Chatterjee1*
Our study sought to determine whether urine lipoarabinomannan (LAM) could be validated in a
sample cohort that consisted mainly of HIV uninfected individuals that presented with tuberculosis
symptoms. We evaluated two tests developed in our laboratory, and used them on clinical samples
from Lima, Peru where incidence of HIV is low. ELISA analysis was performed on 160 samples (from
140 adult culture-confirmed TB cases and 20 symptomatic TB-negative child controls) using 100 μL
of urine after pretreatment with Proteinase K. Two different mouse monoclonal antibodies-CS35 and
CHCS9-08 were used individually for capture of urine LAM. Among cases, optical density (OD450) values
had a positive association with higher bacillary loads. The 20 controls had negative values (below the
limit of detection). The assay correctly identified all samples (97–100% accuracy confidence interval).
For an alternate validation of the ELISA results, we analyzed all 160 urine samples using an antibody
independent chemoanalytical approach. Samples were called positive only when LAM surrogates—
tuberculostearic acid (TBSA) and d-arabinose (d-ara)—were found to be present in similar amounts.
All TB cases, including the 40 with a negative sputum smear had LAM in detectable quantities in urine.
None of the controls had detectable amounts of LAM. Our study shows that urinary LAM detection is
feasible in HIV uninfected, smear negative TB patients.
Tuberculosis (TB) remains one of the leading causes of death worldwide. The number of new cases of TB has
been declining steadily in recent years. However, the burden remains high among low-income and marginal-
ized populations with about 10 million people developing TB in 2 0181. The report also notes that an estimated
3 million of those with TB still are not getting the care they need. This could have been preventable if a sensitive
and early diagnosis were available. Mycobacterial culture, the current gold diagnostic standard and conventional
techniques for diagnosing TB normally take two to three weeks. In 2018, only 55% of pulmonary cases were
bacteriologically confirmed. It is estimated that 42% of pulmonary TB (PTB) cases are smear n egative2. The
Xpert/RIF assay provides rapid detection of Mycobacterium tuberculosis nucleic acids from sputum and delivers
a diagnostic accuracy of 79%, provided patients with HIV are able to expectorate3,4. This delay in diagnosis and
further increase in detection complexity due to the emerging risks of XDR-TB (Extensively drug Resistant-TB)
and MDR-TB (Multidrug Resistant-TB) are evoking interest of researchers in the field of developing rapid TB
detection techniques. Early diagnosis and on-time effective treatment are indispensable for the control of TB—a
life threatening infectious communicable disease.
1
Mycobacteria Research Laboratory, Department of Microbiology, Immunology and Pathology, Colorado State
University, Fort Collins, CO 80523, USA. 2Socios en Salud Sucursal Peru, Lima 15001, Peru. 3Programa Academico
de Tuberculose, Faculdade de Medicina, Universidade Federal do Rio de Janeiro, Rio de Janeiro 21941‑590,
Brazil. 4Department of Global Health and Social Medicine, Harvard Medical School, Boston, MA 02115,
USA. *email: delphi.chatterjee@colostate.edu
Scientific Reports | (2021) 11:2922 | https://doi.org/10.1038/s41598-021-82445-4 1
Vol.:(0123456789)
www.nature.com/scientificreports/
Initial cohort (60) Follow-up cohort (100)
10 culture negative (children) 10 unlikely TB (children)
All smear (−) No smear recorded
90 culture positive (adult)
50 culture positive (adult)
26 smear (−) [29%]
14 smear (−) [28%]
4 smear AFB [4%]
13 smear (+) [26%]
29 smear (+) [32%]
11 smear (++) [22%]
23 smear (++) [26%]
12 smear (+++) [24%]
8 smear (+++) [9%]
Table 1. Clinical Categorization of 160 urine sample set. Only 10/60 in the initial cohort and 2/100 in the
follow-up cohort were HIV infected. Children are presumed HIV uninfected.
In recent years, urinary lipoarabinomannan (LAM) based diagnostics for TB have gained significant
a dvances5–9. Specimens like serum and urine collection are less invasive and can be easily collected from patients
visiting or admitted to the hospital or even outside of the hospital setting (e.g. at home). Current commercial uri-
nary LAM based diagnostic kits have a specificity of 95% or more and sensitivity of 40–70% but are recommended
only for patients with HIV and CD4 counts less than 100 cells per microliter. One such test, Alere Determine
TB LAM Ag (AlereLAM), is a lateral flow assay designed to detect LAM in urine and used as a point-of-care
test for active t uberculosis10–12.
There is extensive evidence that LAM is found in serum and urine in measurable quantities, established
using both chemo-analytical assays and immunoassays7,8,13–16; however, only the Alere LAM test is currently
in the market for clinical usage. The clinical performance of this test has had a questionable lack of sensitivity;
this could be due to a low abundance of LAM in urine in TB patients who have a low bacterial load, particularly
for patients who are HIV uninfected. It has been proposed that low LAM could remain undetected due to: first,
TB pathology such as kidney dysfunction or dissemination of M. tuberculosis to the k idneys17,18; second, LAM
sequestration in serum and urine, whereby sample pretreatment could enhance the level of detection 100 fold
in serum and two to threefold in urine9,14; and third, urinary LAM possibly presenting different epitopes than
that from LAM in the culture8,19.
Studies suggest that refinement of assays may provide improved limits of detection, leading to increased
sensitivity and improved p erformance20. To this end, a novel urine based immunoassay, Fujifilm SILVAMP TB
LAM (FujiLAM, Fujifilm, Tokyo, Japan) was recently developed and v alidated21. The assay involves the use of
two high affinity monoclonal antibodies and a silver amplification s tep22 to intensify the control band and signal
bands for LAM in urine, thus increasing the sensitivity of the assay compared to the AlereLAM test. However, the
specificity of the FujiLAM test was lower than the AlereLAM test, maybe due to the antibodies used for the test
as the presentation of antigenic determinants in urinary LAM in structural organization and increased/reduced
multiplicity may have direct consequences on LAM immunoassay. Moreover, the reduced specificity of FujiLAM
as indicated by the authors could be partly due to the imperfect reference (culture and Xpert) standard that lacks
complete sensitivity. It is limited in its ability to detect TB in patients with HIV infection. Despite the fact that
urinary LAM has been validated in several laboratories9,18,21,23,24 focusing mainly on HIV infected TB-positive
cases, questions remain whether this is applicable to a more general population that includes HIV uninfected
TB positive, pediatric TB or extrapulmonary TB patients. Accordingly, the focus of our present study was to
test our immunoassay on a well characterized set of urine samples originating from Peru where the incidence
of HIV is low. These samples were tested in a simple ELISA format that can be applied in any laboratory. Our
assay did not require any urine concentration, involved rigorous sample pretreatment, and utilized monoclo-
nal antibodies (mAb) that are available to us. Overall, in this study, we abolished the concentration step of the
sample and instead apply a one-step pretreatment with reduced sample volume and processing time. The test is
now more sensitive (LoD increased from ~ 0.1 to 0.05 ng/mL) than earlier r eport9. The data were validated with
mass-spectrometry based quantification of LAM in the same samples.
Methods and materials
Sample cohort. Anonymized urine samples used in our study were provided by Laboratorio Socios En
Salud Sucursal, Peru. The study samples were collected from adult patients with culture confirmed TB (cases;
n = 140) and symptomatic children in whom TB was ruled out by a pediatric pulmonologist on the basis of nega-
tive bacteriological (i.e., smear and culture) results from sputum or gastric aspirate; chest X-ray, and tuberculin
skin testing (controls; n = 20). All samples were collected between 6 and 11 AM in the morning.
Pre anti TB treatment urine samples were collected and EDTA was immediately added to achieve a final
concentration of 10 mM. Samples were transported to the lab via cold chain and stored at − 80 °C. Samples
were sent to Colorado State University (CSU) in two batches, one set of 60 and a second set of 100 (Table 1).
The frozen urine samples were received barcoded and were given arbitrary Colorado State University (CSU)
numbers (UP 1–160).
On receipt, the samples were aliquoted into 1 mL aliquots and stored frozen at − 80 °C until use. To prevent
contamination, all samples were processed in a biosafety cabinet. All reagents and buffers were sterilized before
each use. Samples were collected between May 2015 and February 2018 and analysed in late 2019–March 2020.
Additional urine control samples were obtained from healthy volunteers from a TB non-endemic region
and stored frozen at − 80 °C until further use. The control urine (NEU) was spiked with CDC1551 LAM (range
Scientific Reports | (2021) 11:2922 | https://doi.org/10.1038/s41598-021-82445-4 2
Vol:.(1234567890)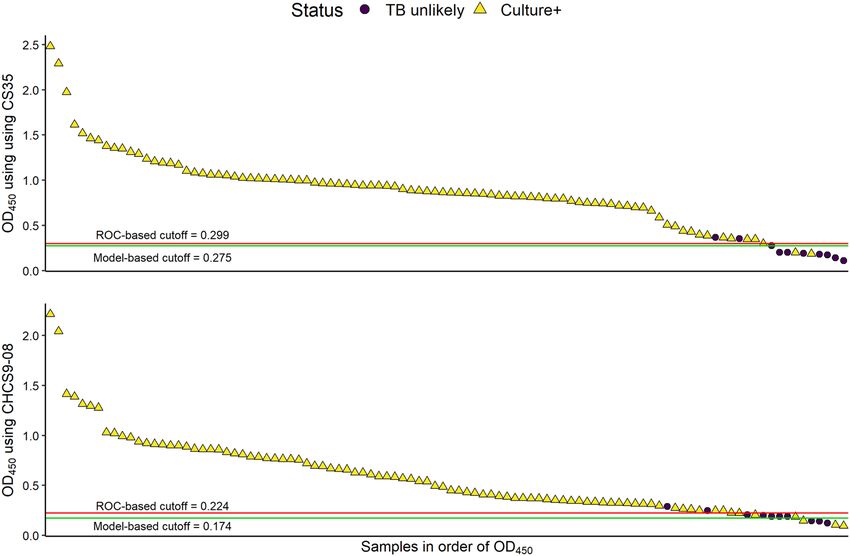
www.nature.com/scientificreports/
12.5 ng–0.02 ng/mL) to derive an assay standard curve by serially diluting the LAM twofold to obtain a con-
centration range and compared to the unspiked urine sample which was used as a negative control. A standard
curve was routinely extrapolated every time.
Ethics statement. The study generating the urine samples conformed to the Declaration of Helsinki and
was approved by the Ethics Committee of the Peru National Institute of Health and the Institutional Review
Board of Harvard Medical School. Written informed consent was provided by adults and guardians, and written
assent was obtained from children ages 8 to 14 years. The present research was approved by the CSU Institutional
Biosafety Committee (IBC), and the CSU Integrity and Compliance Review Board (IRB) under approval IRB
protocol number 09-006B (Lipoarabinomannan Analysis of Urine and Serum).
LAM for assay standardization. The LAM used in this study was isolated and purified from Mycobacte-
rium tuberculosis (Mtb) CDC1551 in large quantities (20–30 mg of LAM isolated from ~ 90-g of wet cells) so that
the same standard was used throughout the year for recurring experiments25.
Mouse monoclonal antibodies. CS35 IgG3 and CHCS9-08 IgG3, both mouse monoclonal antibodies
raised against Mycobacterium leprae, were purified in our laboratory from hybridoma cell lines generated by
the fusion of myeloma cells with immunized mouse splenocytes26. Briefly, female BALB/c mouse was primed
intraperitoneally with whole M. leprae cells in presence of complete Freund adjuvant followed by several booster
doses of crude LAM extract. Spleen cells were fused with SP20 myeloma cells and hybrid cells were selected and
screened by ELISA for the secretion of antibodies reactive to the ethanol extract of delipidated M. leprae cells27.
These antibodies were taken from the Colorado State University repository and no animal experiments was
required or performed for this work. Animal experiments conducted about 30 years ago followed IACUC animal
protocols and animals received proper care by CSU’s staff veterinarian and laboratory animal care staff follow-
ing the guidelines and regulations then in place. There was an approved CSU Animal Care and Use Committee
protocol at that time and Animal Welfare Assurance number A3572-01 was on file with the Office for Protection
from Research Risks at CSU.
Human IgG1 monoclonal antibody. A194-01 was obtained from New Jersey Medical School, Rutgers
University. This antibody was molecularly cloned from a patient diagnosed with pulmonary TB who had been
on TB drug therapy for a month before screening the culture supernatant against LAM from Mtb in an immu-
noassay using a high throughput in vitro B cell culture method. Variable heavy ( VH) and light ( VL) chain gene
sequences were amplified using RT-PCR followed by nested PCR with different VH–VL specific primers, then
cloned into an IgG expression vector. The antibody was then expressed by transient transfection of 293 T cells28.
Pretreatment of urine samples. Sample aliquots were thawed on ice before use. A 100 µL aliquot of the
urine sample was transferred to a fresh screw-cap tube and treated with Proteinase K (Pro K, Thermo Fisher
Scientific) at a final concentration of 200 µg/mL at 55 °C for 30 min followed by inactivation by boiling (100 °C)
for 10 min. To check the optimal time required for denaturation of Pro K by boiling the samples, a time course
was performed at 0 min, 10 min, 20 min and 30 min. The supernatant obtained after centrifugation at 12,000×g
for 10 min was directly used for ELISA.
Immunoassay. Capture ELISA was employed to analyze the clinical samples for presence or absence of
LAM as previously described9. Polystyrene microplates (Corning Costar) were coated with the capture anti-
body at a concentration of 10 µg/mL for CS35 or 5 µg/mL for CHCS9-08 in phosphate buffered saline (PBS)
and incubated at 4 °C overnight. Urine control samples used for generating a standard curve were spiked with
known amounts of LAM and incubated at room temperature for 30 min to allow for the complexation of LAM
and protein/s and then stored at -20 °C overnight. Control and clinical samples were pretreated with Pro K and
the supernatant used for ELISA. After overnight incubation, the antibody coated plates and the LAM samples
were brought to room temperature. The blocking of nonspecific binding sites in the plate wells was done with
1% Bovine Serum Albumin (BSA) in 0.1 M phosphate-buffered saline PBS (blocking buffer) and the plates
incubated for 1 h at room temperature. The plates were washed with the blocking buffer before adding the con-
trol and the clinical samples to the appropriate wells and incubated for 2 h at room temperature. After washing
ten times with 0.1 M PBS/Tw80 (wash buffer), the plates were incubated for 2 h at room temperature with the
biotinylated A194-01 at a final concentration of 250 ng/mL. Biotinylation of the antibody was carried out using
EZ-Link Sulfo NHS-LC Biotin (Thermofisher Scientific) following the kit protocol and the labeled antibody was
desalted on Zeba spin desalting columns 7K MWCO (ThermoFisher Scientific) as per the kit protocol. The plates
were washed with wash buffer followed by addition of Streptavidin–Horseradish Peroxidase (R & D Systems) at
1:200 dilution, then incubated at room temperature for 25 min. The plates were washed and Ultra TMB-ELISA
chromogenic substrate (ThermoFisher Scientific) added and incubated for at least 30 min and observed for color
development. The reaction was stopped by addition of sulphuric acid and the absorbance was read at 450 nm. All
controls were run in triplicate and reported as the mean ± standard deviation. The samples were run in duplicate
and plotted against the standard curve. Limits of blank (LoB) and limits of detection (LoD) were generated from
the standard curve using Clinical and Laboratory Standards Institute (CLSI) standards29.
Gas chromatography/mass spectrometry analysis for TBSA and d‑ara in urine LAM. The
etail15,16. Typically, urine samples (1 mL) were subjected to hydropho-
method developed has been described in d
Scientific Reports | (2021) 11:2922 | https://doi.org/10.1038/s41598-021-82445-4 3
Vol.:(0123456789)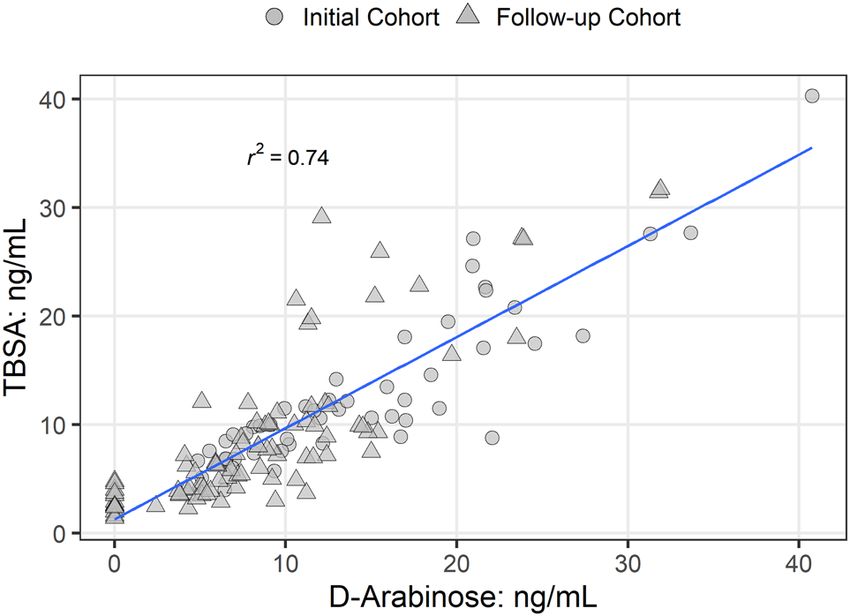
www.nature.com/scientificreports/
bic interaction chromatography (HIC) over Octyl Sepharose (OS)-CL 4B. The 40% and 65% n-propanol in 0.1 M
NH4OAc eluents from the HIC column was divided in two and processed for GC/MS analysis downstream. For
tuberculostearic acid (TBSA), the Octyl Sepharose purified LAM from urine was subjected to alkaline hydrolysis
to make the corresponding pentafluorobenzyl tuberculostearate derivative. D2-palmitic acid (5 ng) was used as
an internal standard. The GC/MS analysis of the pentafluorobenzoate ester was carried out using selective ion
monitoring program in a negative chemical ionization mode. GC/MS chromatograms with respective peaks
were integrated manually (i.e., peak areas were defined manually and integrated areas were generated by the
Chromeleon v 7.2 software for the estimation of total TBSA content. The instrument was set to collect data for
m/z 257.3 (Internal standard) in the range of 5 to 19 min and m/z 297.3 after 19 min for TBSA, to collect suffi-
cient data points for low-level mass detection. It was then used to calculate the LAM-equivalent from previously
reported formulae15. GC/MS analyses were carried out using a Thermo GC-TSQ8000 Evo Triple Quad GC mass
spectrometer.
For d-ara estimation, acid hydrolysis (2 M TFA) was carried out to release d-ara and synthesize 1-(α/β-O-
(R)-2-octyl)-2,3,5 tri-O-trifluoroactyl-d-arabinofurano/pyranoside. The d-ara derivatives were then analyzed
by GC/MS using MS/MS. The ions m/z 420.9 (parent ion) to 192.9 (daughter ion), and m/z 425.9 (parent ion)
to 197.9 (daughter ion) were monitored respectively for d-ara and D-UL-13C5-arabinose (internal standard;
Cambridge Isotope Laboratories Inc., 100 or 10 ng as reported e arlier15. The amount of LAM-equivalent was
calculated using the previously reported formulae (also see equations in the Additional Files). The LoD was set
at 2.4 ng, below which peaks appeared as broad humps and could not be quantified. Values below the LoD were
designated as LAM negative.
Statistics. In addition to using a cutoff based on the OD values from a healthy volunteer, the data were ana-
lyzed to determine the optimal cutoff with both an ROC-based method (i.e. the value in the data set which gives
the largest area under the curve of a receiver operating characteristic curve) and a model-based method (i.e. the
point of inflection of a logistic curve, as calculated using coefficients of a logistic model built with the data). Lev-
els of OD450 in different smear statuses were evaluated with Kruskal–Wallis tests; if significant, the group means
were compared with a Dunn’s test with p-values adjusted for false discovery rate.
The relationship of ranks of OD450 values for each smear status to ranks of smear status was also tested using
an ordered heterogeneity (OH) statistic30. Since there is no inherent numerical measure of distance between
levels of smear results, a directional heterogeneity test is used rather than linear regression to examine whether
median OD450 values increase with smear rank. This statistic is analogous to a one-sided test on whether median
OD450 values increase as smear category increases. A regression model was built to test the linear relationship
of results from the two ELISA tests. Two results were found to be over-influential, creating the appearance of
stronger relationship than was true for the majority of the samples. These samples were omitted when building
the linear model, resulting in a more conservative estimate of the relationship. A third result was lower than
expected in the CS35 O D450 value and was omitted in order to meet assumptions for the model.
Rank correlation between the two values was also tested using Kendall’s τ. All samples were included in the
calculation of the correlation.
All analyses were conducted in R version 3.6.231.
Results
Sample cohort. The 140 adult TB cases had a median age of 32.4 years; child controls had a median age of
8.4. Twelve cases out of 140 were HIV infected and child controls were not tested.
The samples were analyzed in two sets as received (Table 1). The first batch was a set of 60 (Initial cohort)
and the second batch was 100 (Follow-up cohort). All were received blind and clinical status was revealed only
after analyses was completed.
Urine pretreatment for LAM ELISA. In the past, the detection of LAM spiked in urine from a healthy
volunteer with capture ELISA has consistently been shown to have an LoD at ~ 100 pg/mL after pretreatment
with Pro K followed by fivefold concentration prior to ELISA9. In the present work, we have optimized the Pro
K pretreatment on 100 µL urine and were able to abolish the need for any concentration. We show that the LoD
improved two-fold with two sets of antibody pairs (CS35/A194-01 and CHCS9-08/A194-01) to ~ 50 pg/mL, and
Pro K inactivation by boiling the samples at 100 °C for 10 min did not inhibit the antibody efficiency (Fig. 1).
Thus, these conditions were applied to the processing and analyses of the 160 clinical urine samples.
Antibody selection. Earlier we reported that using CS35/A194-01 as the antibody pair for capture and
detection respectively, after Pro K pretreatment followed by fivefold sample concentration, we achieved a sensi-
tivity of 98% and specificity of 92%9. In this study, in addition to CS35, we used CHCS9-08 ms mAb as an alter-
native capture while maintaining the same detection antibody and found the LoD to be ~ 50 pg/mL.
ELISA validation on clinical samples. To validate the “no concentration protocol” for ELISA, we used
the initial cohort of 60 blinded urine samples from Peru. First, to derive a standard curve and the values for
background signals, urine from two healthy volunteers from a TB non-endemic area and two clinically TB nega-
tive samples were analyzed. These four samples were spiked with known amounts of LAM (ranging from 12.5
to 0.02 ng/mL) by serially diluting twofold and pretreated with Pro K at 200 ug/mL final concentration before
performing the capture ELISA. The 4 samples without LAM but pretreated with Pro K were used as negative
control for the background signals. The samples spiked with LAM showed an LoD of approximately 0.05 ng/mL
and the unspiked samples showed comparatively negative signals. As expected, we found variations in ELISA
Scientific Reports | (2021) 11:2922 | https://doi.org/10.1038/s41598-021-82445-4 4
Vol:.(1234567890)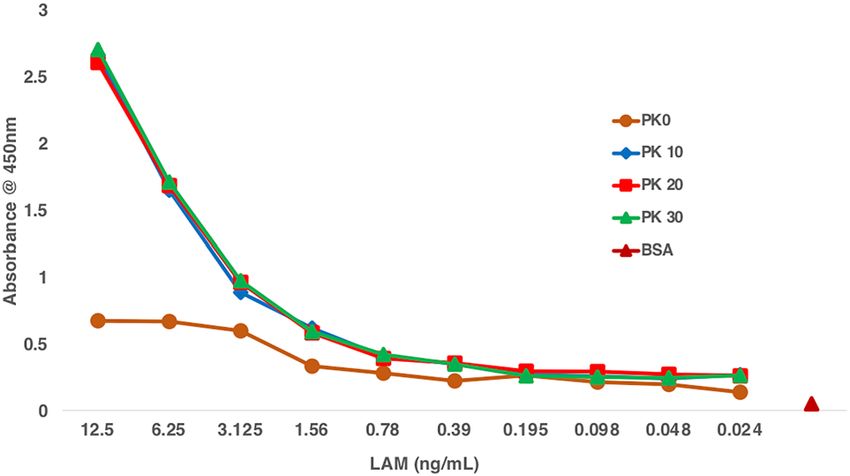
www.nature.com/scientificreports/
Figure 1. Inactivation of Proteinase K before ELISA, Urine from a healthy volunteer from TB non endemic
region was spiked with Mtb (CDC1551) LAM (ranging from 12.5 to 0.02 ng/mL) and pretreated with Pro K
(200 ug/mL) to release LAM. Before ELISA, Pro K was inactivated at different time points (0 min to 30 min) to
ensure complete inactivation. At 0 min inactivation after pretreatment, the ELISA signal is very weak (brown
line), however, with 10 (blue line), 20 (red line) and 30 (green line) min inactivation a proper standard curve is
achieved with no difference between the inactivation times.
Figure 2. Capture ELISA showing LAM standard curve. Urine from two healthy volunteers (NEU#2, NEU#3)
from a TB non endemic region and two clinical samples (UP148, UP158) that were collected from clinically TB
negative patients in a TB endemic region were spiked with known amount of LAM and serially diluted two fold
(ranging from 12.5 to 0.02 ng/mL) to derive a standard curve and pretreated with Pro K (200 ug/mL). Urine
with no LAM but treated with Pro K were used as negative control for background signals. (A) Urine from
healthy volunteers spiked with LAM show the LoD at ~ 0.05 ng/mL and (B) urine from TB negative patients
spiked with LAM also show LoD at ~ 0.05 ng/mL. The background signal from urine from one of the healthy
volunteers is lower than the signals from the urine from clinical samples with no LAM. This also shows that
urine from different sources give varying background levels in an ELISA.
OD values among different donors’ urine and TB negative clinical samples (Fig. 2); baseline values were cor-
rected for the absorbance using values of urine with no LAM added but treated with Pro K (negative control for
background signals).
The 10/60 samples that were both smear and culture negative were also clearly LAM negative based on the
optimal cutoff value. The remaining 50/60 culture confirmed TB cases, 14 of whom were smear negative, were
positive for LAM irrespective of their smear gradation (Table 1, Fig. 3; OD450 values in Supplementary File
Table S1). These sixty samples were evaluated to determine an optimal value of O D450 to correctly identify TB
positive from non-TB samples. The optimal cutoff value was 0.252 (95% CI (bootstrap): 0.252–0.263). This value
perfectly separated the TB positive samples from non-TB samples.
We subsequently analyzed a follow-up set of 100 urine samples. The samples were all blinded as for the initial
cohort and processed for capture ELISA using the two separate sets of antibodies (CS35/ biotinylated A194-01
and CHCS9-08 /biotinylated A194-01). When testing, altogether, nine samples out of 100 gave unexpected results
in that there was a mismatch of OD450 values between the two sets of antibodies used (Table S2). Therefore, a
total of 11 samples were retested (UP70, UP74, UP75, UP79, UP94, UP100, UP105, UP140, UP 146, UP156
and UP159). Among these 11 samples there were 9 samples that had ambiguous results the first time and two
additional samples (UP75 and UP 159) were retested as a control for ELISA. Retested values resulted in 100%
accuracy of classification and stronger associations (Supplementary File Fig. S1).
OD values above or at the optimal cutoff value as determined by a logistic model were considered positive for
LAM and those below the cutoff value were negative for the test (Fig. 4, Table S2). Using the healthy control as a
cutoff, prior to re-testing samples, 95–96% of culture-positive and 80% of culture-negative samples were correctly
Scientific Reports | (2021) 11:2922 | https://doi.org/10.1038/s41598-021-82445-4 5
Vol.:(0123456789)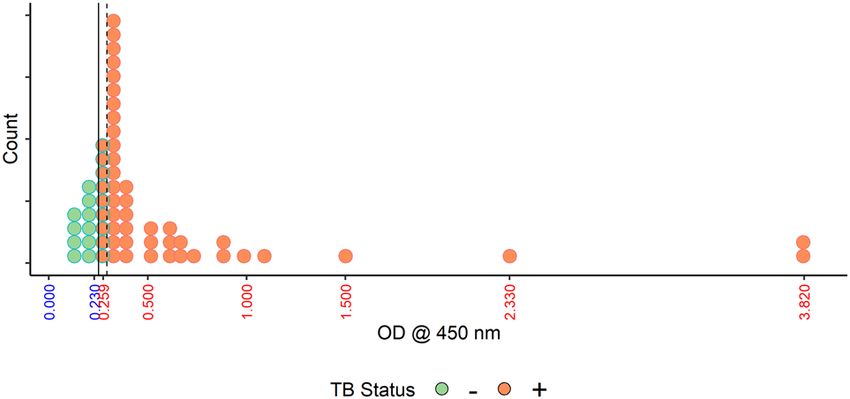
www.nature.com/scientificreports/
Figure 3. ELISA assay validation on the initial cohort of 60 urine samples. OD values are plotted along the
x-axis; each dot represents a single sample. A vertical solid line at 0.252 represents the cutoff value that separates
all Non-TB samples from all TB positive samples. A dashed line is placed at the maximum cutoff chosen by
bootstrap. The ten samples that would be classified differently with the higher cutoff are outlined in green.
Samples in orange dots are all considered positive.
Figure 4. Comparative ELISA on follow-up cohort of 100 urine samples using two sets of antibodies. OD
values for 100 samples are listed in descending order, with cutoff values for prediction shown by the horizontal
lines. Points below the line were identified as negative, and above the line as positive. Yellow triangles indicate
culture positive samples, black dots indicate culture negative samples. 9/100 samples were misidentified perhaps
due to experimental error which were later correctly identified (Supplemental File Fig. S1) after reanalysis.
identified (88% balanced accuracy). An additional culture-negative sample was misclassified using CHCS9-08
prior to re-testing, resulting in 84% balanced accuracy. Because of the small number of negative samples these
results may not be as robust as we would like.
Relationship of ELISA to smear gradation status. Further analyses were conducted using the com-
bined sets. Both ELISA tests showed evidence for differences in OD450 comparing those with the smear grade
of + versus 3+, although the evidence was weaker for CHCS8-09 (CS35; adjusted p < 0.001; CHCS8-09: adjusted
p = 0.045). Culture-negative samples were not included in these analyses.
OD450 values from the ELISA tests did not have a linear association with smear values; however, the median
LAM value increased with smear rank. This relationship was tested using the ordered heterogeneity (OH)
statistic30.
The ranks of median ELISA tests using CS35 had a strong relationship to (smear grade) category (OH = 0.97).
Because two samples from patients with a high smear grade (2+ and 3+) status had exceptionally high OD450
values (Supplementary File Table S2), analyses were re-run without those samples. The relationship remained
strong (OH = 0.87). The ranks of median tests using CHCS9-08 also had a strong relationship to smear grade
Scientific Reports | (2021) 11:2922 | https://doi.org/10.1038/s41598-021-82445-4 6
Vol:.(1234567890)www.nature.com/scientificreports/
Figure 5. Correlation between d-ara and TBSA by GC/MS analysis in each urine sample analyzed.
both with (OH = 0.85) and without (OH = 0.83) an outlying result from a patient with a smear grade of 3+ (Sup-
plementary File Fig. S2).
Comparison of CS35 to CHCS9‑08. After 11/100 samples were re-tested, the OD values from the two
ELISA tests had a Kendall’s correlation of 0.74, which was only slightly higher than before re-testing. The associa-
tion indicated by a linear model that excluded the three influential samples was similar ( R2 = 0.65). On average,
OD values from CS35 were 1.5 times higher than those from CHCS9-08 (Supplementary File Fig. S2C).
LAM quantification of all samples (n = 160) using GC/MS. LAM from the in vitro grown Mtb is
known to be composed of d-arabinose (55–60%), d-mannose (36–40%), and fatty acyls (1–3%; palmitate C:16;
tuberculostearate (TBSA) C:19:1)32,33. In the context of detecting LAM by GC/MS in urine, d-ara and TBSA were
chosen as structural surrogates as the “full-length” LAM is difficult to analyze due to its size and heterogeneity.
These monomeric LAM units are unique and mycobacteria specific34. The application of HIC, an integral part
of our GC/MS protocol, ensures elimination of d-arabinose as a component of similar neutral polysaccharides
found in vegetables and f ood35,36. The criteria for calling a sample LAM positive in the GC/MS analysis of TBSA
and d-ara is that the same fraction eluting off of the Octyl Sepharose column (40–65%), must have both TBSA
and d-ara in amounts that calculate (using set formulae) to be comparable to LAM (i.e. molar ratio of d-ara vs.
TBSA). Through this analysis, in this set of 160 samples we found an excellent correlation between d-ara and
TBSA analyzed in each sample (Fig. 5). The amount of LAM equivalent was calculated using the previously
reported formulae15.
Furthermore, when we correlated the amount of LAM with smear status, there was not a strong correlation
(i.e., samples from patients with a smear grade of 3+ sometimes had lower amounts of LAM than samples from
patients with a smear of 1+). However, most importantly, 40/140 urine samples that were smear negative (smear-
culture+; Supplementary File Tables S1, S2) had detectable amounts of LAM (Fig. 6). Furthermore, all of these
samples were ELISA positive. For all 20 clinically negative samples we could not detect any LAM by either TBSA
or d-ara indicating high specificity of these assays.
A representative compilation of GC/MS chromatograms of 20 negatives and 20 positives are provided as
Supplemental Files Figs. S3–S10 (raw data). Levels of d-ara and TBSA did not correlate with the ELISA results.
A number of the samples had ELISA OD450 < 0.51 (42% of samples for CS35 and 64% of samples for CHCS9-
08). The top 25% of ranks spread widely, with the top two samples (UP4 and UP45) reaching an O D450 of 3.8.
However, these two samples had relatively low amounts of d-ara and TBSA by GC/MS. Even when excluding
ELISA values > 1.5, the correlation between OD450 and GC–MS is low. A compilation of ELISA (with mAb
CS35) and LAM quantification with GC/MS are presented in Tables 2 and 3 with a more detailed raw data in
Supplementary File Tables S1 and S2.
Discussion
Prior studies have shown that circulating LAM amounts in urine are relatively low in HIV uninfected patients,
thereby its detection is below the sensitivity by earlier i mmunoassays37,38. This is in accord with a recent report
where large volumes of urine samples were concentrated with nano cage. High affinity copper dye was used as
a bait for effectively sequestered LAM away from any potential interfering substances and the analyte concen-
trated many folds, depending on initial volume used. LAM could be then detected efficiently using enhanced
chemiluminescence20. We, on the other hand show that urine LAM assay adds to the diagnostic potential for
adults who present with TB-related symptoms and a negative sputum AFB smear microscopy. In this study, nearly
all case samples were from adults with culture confirmed TB who were HIV uninfected persons who present
TB-related symptoms with a negative sputum AFB smear microscopy. In our previous studies, Pro K pretreat-
ment followed by fivefold sample concentration using CS35 and A194-01 as the antibody pair for capture and
detection respectively, we achieved a sensitivity of 98% and specificity of 92%. This study cohort of 100 samples
Scientific Reports | (2021) 11:2922 | https://doi.org/10.1038/s41598-021-82445-4 7
Vol.:(0123456789)www.nature.com/scientificreports/
Figure 6. Correlation of smear− and smear+ category with LAM amounts in urine. For TBSA, the LoD is set to
be 2 ng/mL below which the peaks are discernable and for d-ara 4 peaks must be present to conclude as positive.
LoD for d-ara was found to be < 2.4 ng/mL. Both TBSA and d-ara must calculate out to be in similar amounts
(± 5% error for manual integration). Overall, 138 of 140 TB-positive samples has LAM above LoD by TBSA
(98.5%) and 127 has LAM by d-ara (90.7%). All 20 clinically TB negative samples had no LAM by either assay
(Specificity > 99%).
from various demographical origin consisted of both HIV infected and HIV uninfected subjects9. Equipped with
this knowledge, first, we set out to optimize the Pro K pretreatment and observed that after 30 min incubation
at 55 °C of LAM spiked urine, followed by inactivation at 100 °C for 10, 20 and 30 min, there was no variation
in the absorbance values (Fig. 1) confirming that the antibodies used were stable under these harsh conditions
used for pretreatment.
In the present study, first, we tested a small cohort of 60 urine samples (initial cohort) by capture ELISA
(Tables 1, 2). Patients at or above the cut-off value were classified as TB LAM positive and below the cut-off value
as non-TB. LAM was detected in all 50 samples that were culture and smear positive (36/50) and in 14/50 samples
that were culture positive but smear negative. Sputum smear microscopy for acid fast bacilli has a sensitivity of
50–60%39,40. Significantly, the 10 clinically TB- (smear and culture) negative urine samples from children had
OD450 values below the cut-off value and were designated as LAM negative samples (Fig. 3). Classifying patients
at or above the cut-off value of 0.252 as TB positive and below the value as non-TB resulted in a 100% sensitivity
and specificity. We recognize that the calculated cut-off values maybe too specific to this dataset. Following this,
a follow-up cohort of 100 samples were analyzed and for nine samples, there was a mismatch of OD between the
two sets of antibodies (CS35/A194-01 and CHCS9-08/A194-01) used. CHCS9-08 is a mouse mAb IgG3 subtype
and was selected as a capture as it has high affinity to TBLAM41, epitope mapping of this antibody is currently
under investigation.
Retested values resulted in 100% accuracy of classification and stronger associations (Fig. S1). In general,
the urine LAM immunoassay had high diagnostic sensitivity. The sensitivity reported here is not meant to indi-
cate diagnostic accuracy, but rather is pointing out that we have a clear cutoff between the groups. The ELISA
improved the overall diagnostic accuracy of sputum AFB testing, however the samples tested were all pulmonary
TB. It needs to be further substantiated in extra-pulmonary, paucibacillary TB and pediatric TB.
The GC/MS analyses of LAM in urine is a robust method and has been validated using over 700 samples
to date9,15,41. Most of the clinical samples with respective OD450 values did not correspond to detected LAM
amounts by GC/MS, for instance, very high OD for samples UP4, UP45 and UP135 where LAM amounts by
GC/MS are ≤ 10 ng. Whereas one could explain high OD450 due to non-specific binding (quite common for clini-
cal samples) or inefficient sample pretreatment. Mtb CDC 1551 LAM has been used to generate the standard
curves for both ELISA and GC/MS. We argue that GC/MS methods are true representation of LAM amounts
as the quantification of the monomeric units (d-ara 60% and TBSA 1–2% in LAM) reflects their distribution
in full-length LAM. The use of known amounts of internal standards such as 13C5 d-ara and D 2 palmitic acid
makes the quantitation robust. Figure 7 explains the LAM equivalent calculations based on the monomeric unit
abundance (TBSA) in samples spiked with known amounts of LAM. Data from two different GC/MS instru-
ments at two different times shows the consistency and reproducibility of the analysis (calculation of d-ara in
two representative samples are presented in the Supporting Information Fig S11. In addition, d-ara and TBSA
based urine LAM calculations of two representative clinical samples UP81 and UP3 were also included as Sup-
porting Information Figs. S12 and S13 respectively. Based on these calculations, majority of the TB positive
samples in this study cohort had ~ 3–40 ng/mL of LAM in urine. The TBLAM amounts in urine is in agreement
with published literature that suggested ranges from 1–100 ng/mL42,43. On the contrary, in an immunoassay, a
mAb will only bind to specific antigenic arabinan epitopes with distinct glycosidic arrangements which is only
Scientific Reports | (2021) 11:2922 | https://doi.org/10.1038/s41598-021-82445-4 8
Vol:.(1234567890)www.nature.com/scientificreports/
Sample ID Sputum smear ELISA OD @ 450 nma TBSA-LAMc D-Ara-LAMc Sample ID Sputum smear ELISA OD @ 450 n
ma TBSA-LAMc D-Ara-LAMc
UP1* 1+ 0.866 17.5 24.6 UP31* 2+ 0.351 9.8 8.1
UP2 1+ 0.2935 10.7 15.0 UP32* 2+ 0.635 9.9 8.5
UP3 3+ 0.9005 14.2 13.0 UP33 2+ 0.323 19.5 19.5
UP4* 3+ 3.8175 10.8 16.2 UP34 2+ 0.341 18.1 17.0
UP5 1+ 0.327 6.8 7.0 UP35 2+ 0.987 5.1 5.1
UP6* 3+ 0.5905 4.0 6.4 UP36* 3+ 1.0905 6.9 6.5
UP7 1+ 0.3115 6.8 6.5 UP37* 3+ 0.3495 27.7 33.7
UP8 Neg 0.2595 40.3 40.8 UP38 3+ 0.31 6.7 4.9
UP9 Neg 0.5005 20.8 23.4 UP39 3+ 0.368 10.6 12.0
UP10 Neg 0.3405 18.2 27.4 UP40* 3+ 0.414 11.7 11.2
UP11 Neg 0.611 8.2 10.2 UP41 Neg 0.265 22.4 21.7
UP12 Neg 0.3145 11.5 19.0 UP42 2+ 1.501 27.6 31.3
UP13 Neg 0.2955 7.6 5.5 UP43 1+ 0.5325 11.3 11.7
UP14 Neg 0.259 12.3 16.9 UP44 Neg 0.734 13.5 15.9
UP15 Neg 0.292 10.4 17.0 UP45 3+ 3.816 9.2 7.7
UP16 Neg 0.2765 8.3 12.2 UP46 3+ 0.662 8.7 10.1
UP17 Neg 0.2645 6.0 6.9 UP47 Neg 0.252 8.8 22.1
UP18 1+ 2.332 17.1 21.6 UP48 1+ 0.325 11.5 9.9
UP19 1+ 0.672 14.6 18.5 UP49 1+ 0.395 7.6 9.7
UP20 1+ 0.362 8.5 6.5 UP50 Neg 0.292 12.2 13.6
UP21 1+ 0.511 5.7 9.3 UP51# Neg < Cut-off b < LODd ND
UP22 1+ 0.321 9.1 6.9 UP52# Neg < Cut-offb < LODd ND
UP23 1+ 0.378 10.0 9.1 UP53# Neg < Cut-offb < LODd ND
UP24 1+ 0.3145 27.2 21.0 UP54# Neg < Cut-offb < LODd ND
UP25* 1+ 0.3495 7.4 8.1 UP55# Neg < Cut-offb < LODd ND
UP26 1+ 0.3165 12.3 12.5 UP56# Neg < Cut-offb < LODd ND
UP27 1+ 0.3835 11.4 13.1 UP57# Neg < Cut-offb < LODd ND
UP28 1+ 0.3375 22.7 21.7 UP58# Neg < Cut-offb < LODd ND
b
UP29 2+ 0.263 8.9 16.7 UP59# Neg < Cut-off < LODd ND
UP30* 2+ 0.376 24.6 20.9 UP60# Neg < Cut-offb < LODd ND
Table 2. Initial cohort of 60 patient’s urine samples from Peru. 50 were sputum culture positive adult TB
patients. #10 (UP51-UP60) Culture negative, smear negative pediatric TB negative control from same endemic
region. *Only 10 samples were from HIV infected person. a ELISA was done using CS35 as capture and
A194-biotin as detection antibodies and recorded at 450 nM. b ELISA cut-off was set at OD value 0.252. c LAM
concentration determined by measurement of tuberculostearic acid (TBSA) and d-Arabinose (D-Ara) and
presented in ng/mL. d LOD for TBSA-LAM was 2.0 ng/mL.
in the terminal end of LAM. About 30–40% arabinan (α1 → 5 linked) is non immunogenic. Moreover, LAM is
structurally heterogenous and the abundance of antigenic epitopes needed for mAbs to bind and response will
vary. It is clear that urinary LAM terminal arabinan also varies19.
Thus, we anticipate that each urine sample with respect to patient demographic origin may have structurally
different LAM. Our present efforts are directed to establish the commonality of urinary LAM to achieve a suc-
cessful and uniform LAM detection immunoassay.
Nevertheless, the final outcome after applying the two assays does not deter from correctly identifying TB
positive vs. TB negative using patients’ urine samples. In this study we also show that urine LAM assays have
diagnostic potential among HIV uninfected and smear negative patients. Both assays described are detecting
LAM with high sensitivity and high specificity, but admittedly are not perfect and not point-of-care. These
assays could now move forward to a clinical study encompassing all possible cases of TB. GC/MS is a special-
ized platform available only in certain laboratories, can be utilized by outsourcing when/if ambiguous results
are obtained in immunoassays.
Our study has several strengths and limitations. Primary strengths are the availability of high quality, prop-
erly characterized clinical samples, in-house purified ELISA reagents, and an antibody independent validation
method for clear assignment of presence or absence of LAM in clinical samples. The ELISA is reproducible, needs
no sophisticated instrumentation and can be adapted in any clinical setting, with readouts obtained in 24 h.
Limitations include unavailability of a large set of TB negative samples from the same study group. The TB
negative samples in our study were from children. We did not have samples from symptomatic adults in whom
TB was ruled out. Therefore, we estimated specificity from samples collected from children with signs and
symptoms of TB and a household contact, but in whom TB ruled out by a pediatric pulmonologist following a
careful work-up, which included chest X-ray, sputum smear and culture and tuberculin skin testing. Assessing
Scientific Reports | (2021) 11:2922 | https://doi.org/10.1038/s41598-021-82445-4 9
Vol.:(0123456789)www.nature.com/scientificreports/
ELISA
Sputum ELISA OD TBSA- D-Ara- Sputum OD@450 TBSA- D-Ara-
CSU ID smear @450 nMa LAMc LAMc CSU ID smear nMa LAMc LAMc
UP61 1+ 0.9535 21.8 15.2 UP111 Neg 0.999 3.9 3.7
UP62 1+ 0.9415 6.2 4.2 UP112 Neg 1.357 11.1 9.5
UP63* 2+ 0.8625 10 10.5 UP113 1+ 0.8135 7.7 8.9
UP64 Scanty 1.0245 10.3 11.2 UP114 1+ 1.0525 10.1 9
UP65 2+ 0.7955 9.9 11.7 UP115 3+ 1.102 8.3 7.5
UP66 2+ 1.061 12 12.3 UP116 3+ 1.015 29.1 12.1
UP67 1+ 0.663 4.8 < LODd UP117 2+ 1.196 8 8.4
UP68 3+ 1.2915 9.9 8.8 UP118 Neg 1.35 7.2 4.1
UP69 Neg 0.94 27.2 23.8 UP119 2+ 0.9295 7.3 7.1
UP70 3+ 0.958 10 9.1 UP120 1+ 0.9395 5.3 7.2
UP71 1+ 1.3125 4 < LOD UP121 Neg 1.171 12.1 5.1
UP72 2+ 0.9375 5 9.2 UP122 2+ 0.7505 1.6 < LOD
UP73 Neg 0.349 2.9 < LOD UP123 2+ 1.074 1.4 < LOD
UP74 Neg 0.431 9.3 15.4 UP124 2+ 2.29 19.8 11.5
UP75 Neg 0.489 2.6 < LOD UP125 2+ 1.4415 2.9 6.2
UP76 Neg 0.8565 4.2 7.1 UP126 Neg 0.8885 31.7 31.9
UP77 Neg 0.399 2.6 < LOD UP127 Neg 1.0035 16.4 19.7
UP78 Scanty 0.827 7.5 15 UP128 Neg 1.0395 6.5 5.9
UP79 Neg 0.8215 7 11.2 UP129 Neg 0.964 4 4.2
UP80 1+ 0.876 8.8 7.4 UP130 Neg 1.4645 4.4 5.1
UP81 Neg 0.848 22.8 17.8 UP131 Neg 1.084 5.8 6.8
UP82 1+ 0.9585 4.6 < LOD UP132 Neg 1.379 3.5 5.1
UP83 2+ 1.0625 3.5 < LOD UP133 Neg 1.02 4.1 4.4
UP84 1+ 0.8295 3.7 11.2 UP134 Neg 0.867 3.2 4.8
UP85 Neg 0.4395 7.2 9.5 UP135 Neg 2.483 4.8 6.1
UP86 3+ 1.613 5.1 6.6 UP136 Neg 0.999 4.1 5.2
UP87 Scanty 0.367 3.7 < LOD UP137 Neg 1.518 3.9 5.6
UP88 1+ 1.1895 6 8.5 UP138 Neg 0.972 3.5 3.8
UP89 Neg 0.356 2 < LOD UP139 Neg 0.9475 2.5 < LOD
UP90 Neg 0.299 11.7 12.5 UP140 Neg 0.7365 3.6 3.8
UP91 Neg 0.348 4.9 10.6 UP141 2+ 0.9015 5.4 7.4
UP92 1+ 0.389 10.2 8.3 UP142 2+ 1.2075 7.2 12.4
UP93 1+ 0.8595 3.6 4.3 UP143 1+ 1.023 12 7.8
UP94 Neg 0.529 19.3 11.3 UP144# Neg < Cut-offb < LODd < LOD
UP95 Neg 0.5085 4.5 5 UP145# Neg < Cut-off < LOD < LOD
UP96 1+ 0.743 9.3 14.8 UP146# Neg < Cut-off < LOD < LOD
UP97 2+ 0.716 7.8 9.2 UP147 2+ 0.967 2.4 < LOD
UP98 1+ 0.7 25.9 15.5 UP148# Neg < Cut-off < LOD < LOD
UP99 1+ 0.797 8 8.4 UP149 1+ 0.8015 6.3 5.9
UP100 Scanty 0.841 11.7 11.5 UP150# Neg < Cut-off < LOD < LOD
UP101 2+ 1.01 9.9 14.3 UP151 2+ 0.698 6.2 6.0
UP102* Neg 0.883 18 23.5 UP152# Neg < Cut-off < LOD < LOD
UP103 1+ 0.718 2.3 4.3 UP153 2+ 0.7575 7 11.6
UP104 3+ 1.975 27.1 23.9 UP154# Neg < Cut-off < LOD < LOD
UP105 2+ 0.82 31.4 31.8 UP155 1+ 0.589 5.6 4.7
UP106 2+ 0.746 8.9 12.4 UP156# Neg < Cut-off < LOD < LOD
UP107 1+ 1.008 2.5 2.4 UP157 1+ 1.237 3.6 5.4
UP108 2+ 0.853 9.8 14.5 UP158# Neg < Cut-off < LOD < LOD
UP109 2+ 0.809 3 9.4 UP159 1+ 0.8735 6.3 5.9
UP110 1+ 0.771 21.5 10.6 UP160# Neg < Cut-off < LOD < LOD
Table 3. Follow-up cohort of 100 patient’s urine samples from Peru. 90 were sputum culture positive adult
TB patients. #10 Culture negative, smear negative TB negative pediatric control from same endemic region.
*Only 2 (UP63, UP 102) samples were from HIV infected person. a ELISA was done using CS35 as capture and
A194-biotin as detection antibodies and recorded at 450 nM. b ELISA cut-off was set at OD value 0.289. c LAM
concentration determined by measurement of tuberculostearic acid (TBSA) and d-Arabinose (d-Ara) and
presented in ng/mL. d LOD for d-ara-LAM was 2.4 ng/mL and TBSA-LAM was 2.0 ng/mL.
Scientific Reports | (2021) 11:2922 | https://doi.org/10.1038/s41598-021-82445-4 10
Vol:.(1234567890)www.nature.com/scientificreports/
Figure 7. TBSA detection of spiked (non-endemic urine; 1 mL) CDC1551 LAM on Varian CP3800 and TSQ
8000 mass spectrometer in 2015 and 2017 respectively. Out of 15 ng LAM spiked, 12.5 ng was detected on
Varian and out of 10 ng LAM spiked, 9.0 ng was detected on TSQ 8000. These spiked samples were subjected to
Octyl-Sepharose column chromatography and subsequent pentafluorobenzyl derivative synthesis before GC/MS
analyses. D2-Palmitic acid (10 ng and 5 ng respectively) were added to the samples as internal standard before
synthesis. Calculations are shown on the right.
clear demarcation between TB positive vs. TB negative when bacterial load is low or at borderline levels as seen
in samples is difficult (e.g. UP146, UP156 (Table S2) and so on). In some cases, ELISA needed to be repeated to
obtain unambiguous data; more importantly, the sample pretreatment with Pro K needs further optimization
(currently pursued in the laboratory). The most important aspect of any immunoassay development is the high
affinity capture antibody. We strongly feel this is the area that needs to be strengthened for future development
of a TB specific sensitive assay. We recently observed that our TB ELISAs do not work with samples from CF
patients with NTM infection for reasons unexplained41. LAM being extremely heterogeneous with many struc-
tural intricacies, there could be multiple epitopes that will eventually direct its binding capacity. We are already
seeing some evidence in this a spect8,19,41. In addition, all samples tested to date have been through at least three
freeze thaw cycles and the condition of clinical samples may lead to variable ELISA performance from time to
time. Although LAM is thermo stable and freeze thaw cycles should not affect the antigenicity of LAM, however,
there could be adverse effects (contamination, complexation etc.) on the biological matrix (urine). We hope
future research will better inform these areas of uncertainty to enable a more comprehensive and evidence based
method of diagnosing pulmonary TB.
Received: 17 September 2020; Accepted: 20 January 2021
References
1. WHO. Global Tuberculosis Report 2019 (WHO, Geneva, 2019).
2. Tostmann, A. et al. Tuberculosis transmission by patients with smear-negative pulmonary tuberculosis in a large cohort in the
Netherlands. Clin. Infect. Dis. 47, 1135–1142. https://doi.org/10.1086/591974 (2008).
3. Elliott, A. M. et al. The impact of human immunodeficiency virus on presentation and diagnosis of tuberculosis in a cohort study
in Zambia. J. Trop. Med. Hyg. 96, 1–11 (1993).
4. Steingart, K. R. et al. Xpert(R) MTB/RIF assay for pulmonary tuberculosis and rifampicin resistance in adults. Cochrane Database
Syst. Rev. https://doi.org/10.1002/14651858.CD009593.pub3 (2014).
5. Drain, P. K. et al. Rapid urine lipoarabinomannan assay as a clinic-based screening test for active tuberculosis at HIV diagnosis.
BMC Pulm. Med. 16, 147. https://doi.org/10.1186/s12890-016-0316-z (2016).
6. Mashamba-Thompson, T. P., Jama, N. A., Sartorius, B., Drain, P. K. & Thompson, R. M. Implementation of point-of-care diagnostics
in rural primary healthcare clinics in South Africa: Perspectives of key stakeholders. Diagnostics (Basel). https://doi.org/10.3390/
diagnostics7010003 (2017).
7. Broger, T. et al. Sensitive electrochemiluminescence (ECL) immunoassays for detecting lipoarabinomannan (LAM) and ESAT-6
in urine and serum from tuberculosis patients. PLoS ONE 14, e0215443. https://doi.org/10.1371/journal.pone.0215443 (2019).
Scientific Reports | (2021) 11:2922 | https://doi.org/10.1038/s41598-021-82445-4 11
Vol.:(0123456789)www.nature.com/scientificreports/
8. Sigal, G. B. et al. A novel sensitive immunoassay targeting the 5-methylthio-d-xylofuranose-lipoarabinomannan epitope meets
the WHO’s performance target for tuberculosis diagnosis. J. Clin. Microbiol. https://doi.org/10.1128/JCM.01338-18 (2018).
9. Amin, A. G. et al. Detection of lipoarabinomannan in urine and serum of HIV-positive and HIV-negative TB suspects using an
improved capture-enzyme linked immuno absorbent assay and gas chromatography/mass spectrometry. Tuberculosis (Edinb.)
111, 178–187. https://doi.org/10.1016/j.tube.2018.06.004 (2018).
10. Kerkhoff, A. D. & Lawn, S. D. A breakthrough urine-based diagnostic test for HIV-associated tuberculosis. Lancet 387, 1139–1141.
https://doi.org/10.1016/S0140-6736(16)00146-X (2016).
11. Lawn, S. D. Point-of-care detection of lipoarabinomannan (LAM) in urine for diagnosis of HIV-associated tuberculosis: A state
of the art review. BMC Infect. Dis. 12, 103. https://doi.org/10.1186/1471-2334-12-103 (2012).
12. Lawn, S. D., Kerkhoff, A. D., Vogt, M. & Wood, R. Diagnostic accuracy of a low-cost, urine antigen, point-of-care screening assay
for HIV-associated pulmonary tuberculosis before antiretroviral therapy: A descriptive study. Lancet. Infect. Dis. 12, 201–209.
https://doi.org/10.1016/S1473-3099(11)70251-1 (2012).
13. Crawford, A. L. et al. Detection of the tuberculosis antigenic marker mannose-capped lipoarabinomannan in pretreated serum
by surface enhanced raman scattering. Analyst 142, 186–196. https://doi.org/10.1039/c6an02110g (2016).
14. Laurentius, L. B. et al. Importance of specimen pretreatment for the low-level detection of mycobacterial lipoarabinomannan in
human serum. Analyst 142, 177–185. https://doi.org/10.1039/C6AN02109C (2016).
15. De, P. et al. Estimation of D-Arabinose by gas chromatography/mass spectrometry as surrogate for mycobacterial lipoarabinoman-
nan in human urine. PLoS ONE 10, e0144088. https://doi.org/10.1371/journal.pone.0144088 (2015).
16. De, P. et al. Structural determinants in a glucose-containing lipopolysaccharide from Mycobacterium tuberculosis critical for
inducing a subset of protective T cells. J. Biol. Chem. 293, 9706–9717. https://doi.org/10.1074/jbc.RA118.002582 (2018).
17. Wood, R. et al. Lipoarabinomannan in urine during tuberculosis treatment: Association with host and pathogen factors and
mycobacteriuria. BMC Infect. Dis. 12, 47. https://doi.org/10.1186/1471-2334-12-47 (2012).
18. Lawn, S. D. & Gupta-Wright, A. Detection of lipoarabinomannan (LAM) in urine is indicative of disseminated TB with renal
involvement in patients living with HIV and advanced immunodeficiency: Evidence and implications. Trans. R. Soc. Trop. Med.
Hyg. 110, 180–185. https://doi.org/10.1093/trstmh/trw008 (2016).
19. De, P. et al. Comparative structural study of terminal ends of lipoarabinomannan from mice infected lung tissues and urine of a
tuberculosis positive patient. ACS Infect. Dis. 6, 291–301. https://doi.org/10.1021/acsinfecdis.9b00355 (2020).
20. Paris, L. et al. Urine lipoarabinomannan glycan in HIV-negative patients with pulmonary tuberculosis correlates with disease
severity. Sci. Transl. Med. https://doi.org/10.1126/scitranslmed.aal2807 (2017).
21. Broger, T. et al. Novel lipoarabinomannan point-of-care tuberculosis test for people with HIV: A diagnostic accuracy study. Lancet.
Infect. Dis 19, 852–861. https://doi.org/10.1016/S1473-3099(19)30001-5 (2019).
22. Mitamura, K. et al. Clinical evaluation of highly sensitive silver amplification immunochromatography systems for rapid diagnosis
of influenza. J. Virol. Methods 194, 123–128. https://doi.org/10.1016/j.jviromet.2013.08.018 (2013).
23. MacLean, E. et al. A systematic review of biomarkers to detect active tuberculosis. Nat. Microbiol. 4, 748–758. https://doi.
org/10.1038/s41564-019-0380-2 (2019).
24. Lawn, S. D., Kerkhoff, A. D., Nicol, M. P. & Meintjes, G. Underestimation of the true specificity of the urine lipoarabinomannan
(LAM) point-of-care diagnostic assay for HIV-associated tuberculosis. J. Acquir. Immune Defic. Syndr. https://doi.org/10.1097/
QAI.0000000000000672 (2015).
25. Shi, L., Torrelles, J. B. & Chatterjee, D. Lipoglycans of Mycobacterium tuberculosis: Isolation, purification, and characterization. In
Mycobacteria Protocols Vol. 465 (eds Parish, T. & Brown, A. C.) 23–45 (Humana Press, Totowa, 2009).
26. Gaylord, H., Brennan, P. J., Young, D. B. & Buchanan, T. M. Most Mycobacterium leprae carbohydrate-reactive monoclonal anti-
bodies are directed to lipoarabinomannan. Infect. Immunol. 55, 2860–2863 (1987).
27. Hunter, S. W., Gaylord, H. & Brennan, P. J. Structure and antigenicity of the phosphorylated lipopolysaccharide antigens from the
leprosy and Tubercle bacilli. J. Biol. Chem. 261, 12345–12351 (1986).
28. Choudhary, A. et al. Characterization of the antigenic heterogeneity of lipoarabinomannan, the major surface glycolipid of
Mycobacterium tuberculosis, and complexity of antibody specificities toward this antigen. J Immunol 200, 3053–3066. https://doi.
org/10.4049/jimmunol.1701673 (2018).
29. Armbruster, D. A. & Pry, T. Limit of blank, limit of detection and limit of quantitation. Clin. Biochem. Rev. 29, S49–S52 (2008).
30. Rice, W. R. & Gaines, S. D. The ordered-heterogeneity family of tests. Biometrics 50, 746–752 (1994).
31. A Language and Environment for Statistical Computing. (R Foundation for Statistical Computing., Vienna, Austria, 2019).
32. Chatterjee, D., Hunter, S. W., McNeil, M. & Brennan, P. J. Lipoarabinomannan. Multiglycosylated form of the mycobacterial man-
nosylphophatidylinositols. J. Biol. Chem. 267, 6228–6233 (1992).
33. Hunter, S. W. & Brennan, P. J. Evidence for the presence of a phosphatidylinositol anchor on the lipoarabinomannan and lipoman-
nan of Mycobacterium tuberculosis. J. Biol. Chem. 265, 9272–9279 (1990).
34. Chatterjee, D., Roberts, A. D., Lowell, K., Brennan, P. J. & Orme, I. M. Structural basis of capacity of lipoarabinomannan to induce
secretion of tumor necrosis factor. Infect. Immunol. 60, 1249–1253 (1992).
35. Lindqvist, L. & Jansson, P. E. Determination of the absolute configuration of sugar residues using gas chromatography. Method
with potential for elimination of references. J. Chromatogr. A 769, 253–261 (1997).
36. Fisher, W. One step purification of bacterial lipid macroamphiphiles by hydrophobic interaction chromatography. Anal. Biochem.
194, 353–358 (1991).
37. Lawn, S. D. et al. Determine TB-LAM lateral flow urine antigen assay for HIV-associated tuberculosis: Recommendations on the
design and reporting of clinical studies. BMC Infect. Dis. 13, 407. https://doi.org/10.1186/1471-2334-13-407 (2013).
38. Shah, M. et al. Lateral flow urine lipoarabinomannan assay for detecting active tuberculosis in HIV-positive adults. Cochrane
Database Syst. Rev. 5, 011420. https://doi.org/10.1002/14651858.CD011420.pub2 (2016).
39. Padmapriyadarsini, C. et al. Evaluation of a diagnostic algorithm for sputum smear-negative pulmonary tuberculosis in HIV-
infected adults. J. Acquir. Immune Defic. Syndr. 63, 331–338. https://doi.org/10.1097/QAI.0b013e31829341af (2013).
40. Bark, C. M. et al. Sputum smear-positive, culture-negative state during anti-tuberculosis treatment in the MGIT liquid culture
era. Int. J. Tuberc. Lung Dis. 22, 306–308. https://doi.org/10.5588/ijtld.17.0655 (2018).
41. De, P. et al. Urine lipoarabinomannan as a marker for low-risk of NTM infection in the CF airway. J. Cyst. Fibros https://doi.
org/10.1016/j.jcf.2020.06.016 (2020).
42. Boehme, C. et al. Detection of mycobacterial lipoarabinomannan with an antigen-capture ELISA in unprocessed urine of Tanzanian
patients with suspected tuberculosis. Trans. R. Soc. Trop. Med. Hyg. 99, 893–900. https://doi.org/10.1016/j.trstmh.2005.04.014
(2005).
43. Lawn, S. D. et al. Urine lipoarabinomannan assay for tuberculosis screening before antiretroviral therapy diagnostic yield and
association with immune reconstitution disease. AIDS 23, 1875–1880 (2009).
Acknowledgements
This work was funded through NIH AI R01 AI132680 (to DC) and NIH/NAID U19 AI109755 (to MFF). We
gratefully acknowledge Dr. Abraham Pinter from PHRI, NJMS, Rutgers for the generous contribution of the
human monoclonal antibody A194.
Scientific Reports | (2021) 11:2922 | https://doi.org/10.1038/s41598-021-82445-4 12
Vol:.(1234567890)You can also read