Nowaczyk, N. (2021): Redeposition experiments with natural sediments from the SE Black Sea in magnetic fields between about 2 and 114 µT ...
←
→
Page content transcription
If your browser does not render page correctly, please read the page content below
Originally published as:

Nowaczyk, N. (2021): Redeposition experiments with
natural sediments from the SE Black Sea in magnetic
fields between about 2 and 114 µT. - Geophysical Journal
International, 224, 1, 271-289.
https://doi.org/10.1093/gji/ggaa455

Institutional Repository GFZpublic: https://gfzpublic.gfz-potsdam.de/
Geophys. J. Int. (2020) 224, 271–289                                                                                         doi: 10.1093/gji/ggaa455
Advance Access publication 2020 September 25
GJI Geomagnetism, Rock Magnetism and Palaeomagnetism

Redeposition experiments with natural sediments from the SE Black
Sea in magnetic fields between about 2 and 114 μT

Norbert R. Nowaczyk
Helmoltz Centre Potsdam GFZ German Research Centre for Geosciences, Climate Dyanamics and Landscape Evolution, Telegrafenberg, 14473 Potsdam,
Germany. E-mail: Norbert.Nowaczyk@gfz-potsdam.de

Accepted 2020 September 23. Received 2020 September 21; in original form 2020 April 27

                                                                                                                                                        Downloaded from https://academic.oup.com/gji/article/224/1/271/5911579 by guest on 12 November 2020
                                      SUMMARY
                                      Diluted slurry with an initial density of 1.30 g cm−3 prepared from natural glacial Black
                                      Sea sediments was deposited under controlled field conditions between 1.72 and 114.21 μT.
                                      Compaction was achieved by evaporation of a portion of the pore water from the open sample
                                      boxes over 4–7 d until a density of about 1.44–1.55 g cm−3 was reached. Magnetizations M
                                      acquired in a magnetic field B follow a slightly non-linear function with M ∼ B0.82 . Similar
                                      relationships were also obtained for palaeointensity estimates for the artificial samples by using
                                      normalization by low-field susceptibility, anhysteretic remanent magnetization and saturation
                                      magnetization. All samples are characterized by a magnetic fabric typical for natural sediments
                                      as checked by determining the anisotropy of magnetic susceptibility. The sediments’ anisotropy
                                      is in the range of 6–7 per cent and it is characterized by an oblate anisotropy ellipsoid with its
                                      small axis perpendicular to the deposition plane. According to scanning electron microscope
                                      imaging low-Ti magnetite particles present in the used sediments are in the range of 1–30 μm
                                      with the majority of particles 2–5 μm in size. Obtained results confirm the conclusion from
                                      other magnetostratigraphic studies that the Laschamps geomagnetic polarity excursion in the
                                      Black Sea area exhibited field values as low as 2.8 μT in its transitional phase between normal
                                      and reversed polarity.
                                      Key words: Magnetic properties; Geomagnetic excursions; Magnetic fabrics and anisotropy;
                                      Palaeointensity; Palaeomagnetism.

                                                                             more and more particles become completely aligned so that no fur-
1 I N T RO D U C T I O N
                                                                             ther magnetization can be acquired. Theoretically, going to low field
Magnetostratigraphic investigations of marine and lacustrine sedi-           amplitudes, it might be possible that below a certain threshold level
ments have provided a lot of detailed information about temporal             no magnetization at all is acquired. It could also be possible that the
as well as spatial variations of the geomagnetic field throughout the        acquired magnetization is an underestimation of the field present
geological past. Therefore, it is important to know how sediments            during deposition, due to friction inhibiting a proper alignment of
acquire their magnetization. In the past about 70 yr several redeposi-       magnetic particles inside the sediment matrix.
tion studies of various types of artificial and natural sediments were
performed in order to test their ability to properly record (relative)
                                                                             1.1 Motivation of the study
changes in geomagnetic field strength (e.g. Johnson et al. 1948;
Irving & Major 1964; Kent 1973; Løvlie 1976; Barton et al. 1980;             The analyses of sediment cores recovered from the SE Black
Tucker 1980, 1981; Otofuji & Sasajima 1981; Tauxe & Kent 1984;               Sea yielded a fairly large amplitude range in the record of rel-
Yoshida & Katsura 1985; Tauxe 1993, van Vreumingen 1993a,b;                  ative palaeointensity (Nowaczyk et al. 2013). By comparison to
Katari & Tauxe 2000; Katari et al. 2000; Gilder et al. 2019). Sev-           results from absolute palaeointensity investigations, the obtained
eral studies found a non-linear relationship between an acquired             Black Sea relative palaeointensity data were recalculated into ab-
magnetization and the applied field (Fig. 1). However, this non-             solute field values (Liu et al. 2020). For the N-R-transition of
linearity takes place only at fields higher than about 50 μT (Yoshida        the Laschamps excursion (Bonhommet & Babkine 1967; Gillot
& Katsura 1985) to 100 μT, with highest fields applied of up to              et al. 1979; Guillou et al. 2004; Plenier et al. 2007; Nowaczyk
about 1000 μT (Johnson et al. 1948; Barton et al. 1980). In these            et al. 2012; Kornprobst & Lénat 2019) at 41.3 ka a field am-
studies, towards the maximum field applied, the acquired magne-              plitude as low as 2.8 μT was calculated, whereas at around
tizations seem to reach a saturation, that is, with increasing field         50 ka field intensities of 60 μT prevailed. The present-day field


C The Author(s) 2020. Published by Oxford University Press on behalf of The Royal Astronomical Society. All rights reserved. For
permissions, please e-mail: journals.permissions@oup.com
                                                                                                                                                 271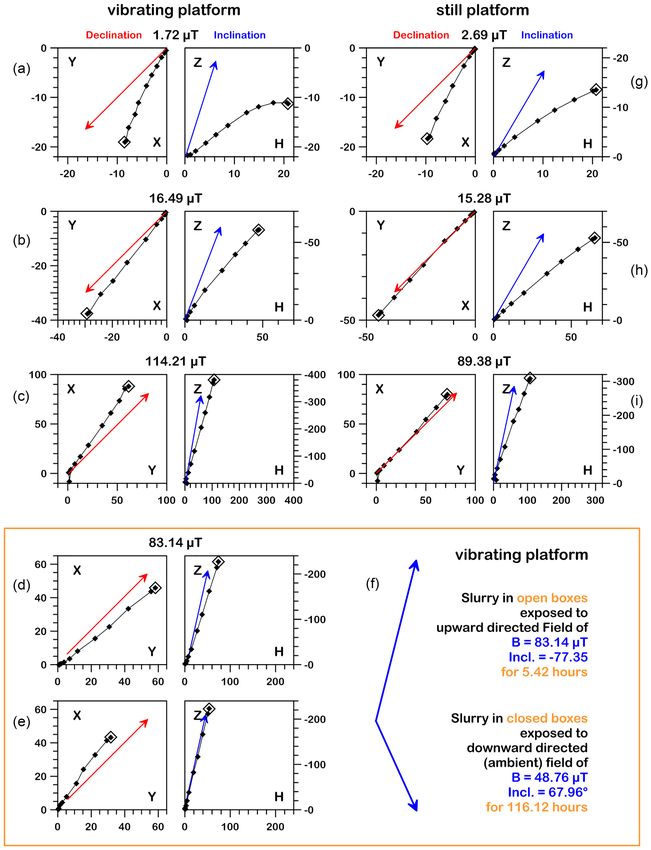
272       N.R. Nowaczyk

                                                                                                                                                                       Downloaded from https://academic.oup.com/gji/article/224/1/271/5911579 by guest on 12 November 2020

Figure 1. Overview of some published redeposition experiments to check the acquisition of a detrital remanent magnetization (DRM) in sediments shown in
double-log plots. Most of the experiments only cover the range of present-day field intensities (∼20–70 μT; bracketed by green dashed lines) to about twice
of the present-day field maximum (marked by an orange dashed line), which was probably reached 3 ka ago in the Near-East (Shaar et al. 2018). For this field
range (apparently) a more or less linear relationship between field during deposition and the acquired magnetization could be found as plotted with linear axes
in the original publications. At higher fields, due to an increasing number of particles getting completely aligned to the applied field, the acquired magnetization
approaches a saturation value (e.g. Johnson et al. 1948, brown crosses; Barton et al. 1980, black open diamonds). From these studies there are just a few data
available for the acquisition of a DRM at low fields of down to 2 μT (∼10 per cent of today’s lowest field, marked by a blue dashed line), as expected for the
geomagnetic field during reversals and excursion. This time interval is the major subject of this study.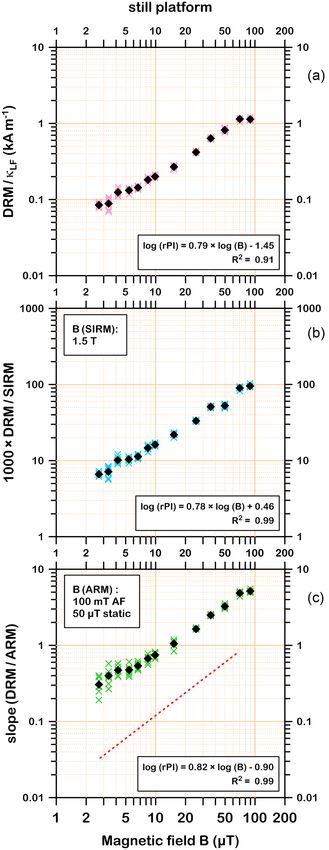
DRM experiments with Black Sea mud                   273

in the SE Black Sea is 48.9 μT (A.D. 2020; WMM 2019–2024,                  brownish to greyish siliciclastic material with variable amounts of
https://www.ngdc.noaa.gov/geomag-web/?model = igrf ). Thus, a              calcium carbonate. There are no clear traces from bioturbation vis-
ratio of about 24:1 between highest and lowest field intensities dur-      ible in the sediment cores but ostracods, which could be used for
                                                                           14
ing marine isotope stage (MIS) 3 was determined. Some palaeoin-               C dating, are fairly abundant. They indicate oxic conditions dur-
tensity stacks (see Nowaczyk et al. 2013, and references therein)          ing deposition. Glacial sediments from cooler phases in the Black
yielded much lower dynamic ranges, with the lowest of only 4:1             sea area contain some ice rafted detritus (IRD), defined as parti-
(e.g. PISO1500, Channell et al. 2009) for the same time window.            cles >125 μm (Nowaczyk et al. 2012). Greigite (Fe3 S4 ), found in
Therefore, the question was raised whether the studied depositional        some of the sediments, is unstable and quickly oxidizes into goethite
magnetization of SE Black Sea sediments reacted linearly to ge-            (FeOOH) when exposed to water and oxygen (Skinner et al. 1964).
omagnetic field variations, or not (Nowaczyk et al. 2013, 2018).           This was explicitly tested by keeping magnetically extracted greig-
If they did, palaeointensity stacks showing a much lower dynamic           ite in an open beaker filled with water. After about two to three
range have to be treated with caution since it has to be assumed that      months only orange goethite was floating in the water. Since the
they reflect time series significantly damped in amplitude. If the         material used for this study was kept under water in open beakers
studied Black Sea sediments did not linearly record geomagnetic            for years with frequent stirring it can be assumed that all greigite
field intensities it has to be found out how this non-linearity can be     has vanished. Anyway, all glacial sediments were shown to be very

                                                                                                                                                        Downloaded from https://academic.oup.com/gji/article/224/1/271/5911579 by guest on 12 November 2020
defined.                                                                   homogenous with fairly constant mineral magnetic properties in
   Experimental data from samples prepared in fields lower than            terms of concentration, grain size and composition (Nowaczyk et
100 μT, plotted with linear field and magnetization axes, were in-         al. 2012, 2013, 2018; Liu et al. 2018, 2019). Sedimentation rates
terpreted by, for example Kent (1973) and Tucker (1980), to reflect        in the glacials (MIS 2–4, MIS 6) were about 10 times higher than
an approximate linear relationship. When data is plotted in a double-      during the Holocene and the (lower) Eemian (Wegwerth et al. 2019;
log plot (Fig. 1a), and fitted with:                                       Liu et al. 2020; Nowaczyk et al. in prepration). Therefore, the sed-
                                                                           imentary material collected for this study is by far dominated by
log (M) = a · log (B) + c                                           (1)
                                                                           the siliciclastic material from the glacials that have reproducibly
actually, a strict linear relationship is only given when the slope a is   recorded directional and intensity variations across the Laschamps
equal to 1, since eq. (1) is equivalent to:                                (41.0 ka) and Mono Lake excursions (34.5 ka) in the very detail
M = c · Ba                                                          (2)    (Liu et al. 2020).

with the factor c comprising influences by, for example magnetic
concentration in the sediment. Although the data from Kent (1973)
and Tucker (1980) plot along a straight line also in the double-           2.2 Initial experiments
log plot, the relationship between determined magnetization and            Initial tests with incremental redeposition of dispersed sediment ma-
magnetic field is not strictly linear, since the slopes are around 1.10    terial performed inside a water column of 35 cm turned out to be not
and 0.83, respectively (Fig. 1). Anyway, the field range between           useful (Figs S1 and S2). A separation of the different grain size frac-
0 and 40 μT was covered only by 3 data points, lowest applied              tions occurred, resulting in clearly visible fining upward graded lay-
field 20 μT (Kent 1973), or 4 data points, lowest applied field            ers of 1–2 mm in thickness. Such sequences of graded layers are not
8 μT (Tucker 1980). Thus, a focused check for a potential non-             seen in the studied natural sediments. Therefore, this way of rede-
linearity with respect to low fields has not been studied in detail yet.   position was dismissed. In a next step, dispersed slurry was directly
Therefore, in this study, a special focus was set on the remanence         injected into standard palaeomagnetic boxes made from clear plas-
acquisition in low fields. The range between 1.72 and 114.21 μT            tic with an internal size of 20 × 20 × 15 mm (6 cm3 ), but still under
was studied in detail in order to check whether an underestimation         water inside an 800 cm3 glass beaker. The resulting samples did not
of the applied field by the acquired magnetization occurs, or not.         show a visible grain size grading but the slurry inside the boxes was
This would then clarify the question whether the dynamic range in          mechanically too unstable to keep the acquired magnetization. As a
the determined (relative) palaeointensities obtained from Black Sea        compromise, it was decided to prepare a fairly thin slurry, sequen-
sediments are an artefact, or an expression of real geomagnetic field      tially inject it into the boxes, but placing these in air instead of under
variability.                                                               water. Thus, the liquid slurry could slowly loose pore water until it
                                                                           reached a pasty consistency about similar to natural sediments from
                                                                           the SE Black Sea. The precise procedure is explained in the next
2 M AT E R I A L A N D M E T H O D S
                                                                           sections.
2.1 Properties of collected material
For the redeposition experiment of this study natural sediment ma-
                                                                           2.3 Magnetic field control
terial was collected when cleaning palaeomagnetic samples taken
from various sediment cores recovered from the SE Black Sea (e.g.          For the control/compensation of the ambient magnetic field a system
Nowaczyk et al. 2012, 2013; Liu et al. 2018, 2019). Studied sed-           of two nested pairs of rectangular and quadratic coils, respectively,
iments comprise marine isotope stages (MIS) 1 to upper MIS 4               was constructed (Fig. 2). A computer program was used to optimize
and (lower) MIS 5e to MIS 6, with a major erosive hiatus from              the shapes and the number of windings of the coil pairs (Figs S3–
68 ka back to about 120–130 ka, depending on site. Most of the             S7). Since it was initially intended to perform sedimentation in a
Holocene and the lower Eemian (MIS 5e) sediments are built up              small water column, the coils compensating the horizontal compo-
of soft laminated dark green organic-rich marine sapropels and             nent H were vertically extended. Because of restricted place in the
whitish coccolith oozes (partly not collected for this study), while       laboratory finally a pair of rectangular coils of 110.5 × 80.5 cm, a
the glacial sediments, deposited under freshwater lacustrine con-          spacing of 52.2 cm and 48 windings per coil (horizontal compen-
ditions, consist of mostly homogeneous fine grained organic-poor           sation), and a pair of quadratic coils, with a size of 71.0 × 71.0 cm,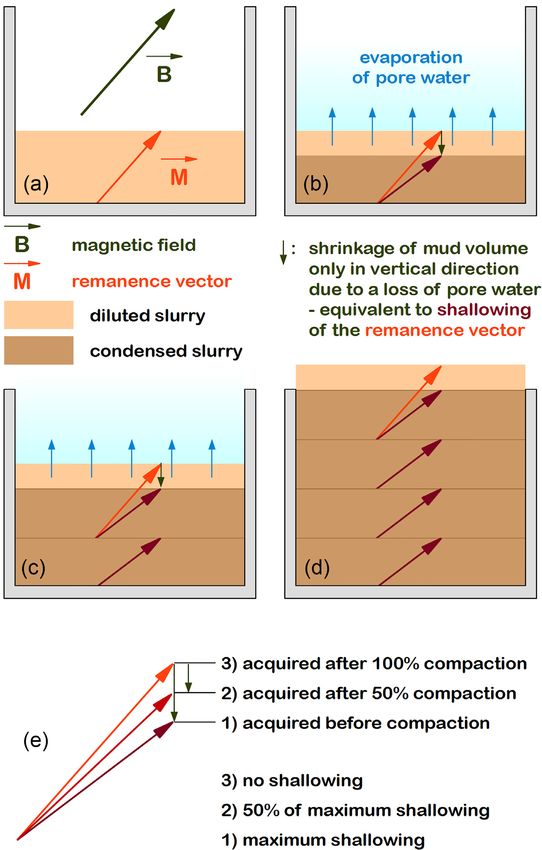
274       N.R. Nowaczyk

                                                                                                                                                                        Downloaded from https://academic.oup.com/gji/article/224/1/271/5911579 by guest on 12 November 2020
Figure 2. Sketch of the experimental setup for this study (for further details see Section 2.3; Figs S3–S7): A pair of vertically elongated rectangular coils, with
their planes oriented magnetically EW, control the horizontal (NS) component, whereas a pair of square coils control the vertical component of the magnetic
field. A stabilized current supply (C), connected to an uninterruptible power supply (UPS–U), is providing the current to the coil pairs via a potentiometer (P),
splitting up the current, thus allowing some variations in field direction. A tri-axial fluxgate probe (F) of a magnetometer (M) is used to check the field intensity
in three directions (NS, EW, vertical) when setting a field configuration with the power supply and the potentiometer. Prior to the DRM acquisition experiment
the fluxgate probe is removed. A wooden platform in the coil system’s centre is held in position by strings which in turn are connected to the coils’ frame
by springs, allowing the platform to vibrate. Vibration is excited by an old ventilator (V) hanging below the platform, with an imbalance glued off-axis to its
rotating part. It is also connected to the UPS. A wooden frame placed onto the platform is holding seven plastic boxes (see Fig. 3) for taking up diluted slurry.

a spacing of 41.0 cm, and 80 windings per coil (vertical compensa-                    of the compensation system using a single high-precision stabi-
tion) were built. The coil system yields a (theoretical) compensation                 lized power supply (TTi QL355P, precision 1 mA) and a 10 Ohm
volume with a height of about 30 cm and a diameter of about 15 cm                     (60 W) wire-potentiometer to split up the current for the two
with a compensation better than 1 per cent (Figs S4 and S5). The                      coils.
whole coil system was oriented magnetically EW so that only a sin-                       A wooden platform of about 15 × 18 cm was constructed to take
gle pair of coils for compensation of the horizontal field component                  up the sample boxes for sedimentation. It is centred inside the coil
H was needed. Thus, only two pairs of coils were necessary to be                      system by 1-mm-thick Aramid (Kevlar) strings which in turn are
able to (under-/over-)compensate the ambient magnetic field vector                    held by eight springs mounted to the edges of the coil frame (Figs 2
completely. The obtained geometry factors (resistances) are 178 μT                    and S7). Thus, the sample platform can be put at variable heights
A–1 (10.2 Ohm) for the vertical (Z) compensation and 82.3 μT A–1                      and it is able to vibrate, if excited. It was assumed that keeping
(8.31 Ohm) for the horizontal (H) compensation. Prior to construc-                    the injected slurry under vibration might promote its compaction
tion, field values of Z = 45.2 μT and H = 18.3 μT were measured in                    by expelling water out of the pore spaces, and/or might promote an
the laboratory. Thus, almost equal compensation currents of 0.255                     easier alignment of the magnetic particles within the slurry. In order
A for the vertical (Z) and 0.222 A for the horizontal (Z) com-                        to excite vibration a small ventilator was hang below the platform
ponent are required (Fig. S6). This led to a further simplification                   (Fig. 2). Its nominal rotation frequency is in the range of 2500 rpm,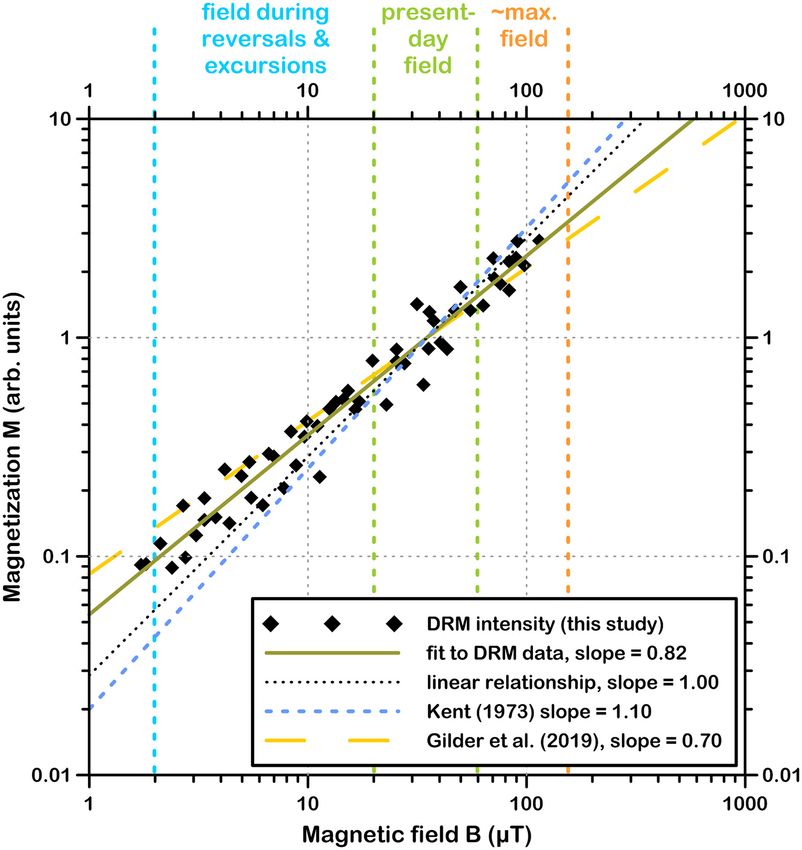
DRM experiments with Black Sea mud                 275

or about 42 Hz. An imbalance by gluing a small peace of metal              sample preparation the sample boxes were placed on the wooden
onto the ventilator off axis forced a vibration that was transmitted       platform in the centre of the field-controlling coils.
to the sedimentation platform via the strings that were used to               For injection of the slurry into the sample boxes 5 cm3 syringes
hang the ventilator below the platform. A small wooden holder was          were used. The sediment was picked up by sucking it into a syringe
constructed to take up seven sample boxes closely packed in order to       out of the upper portion of the slurry kept inside the about 12 cm
expose them to similar field conditions in the coils’ centre. During       high 800 cm3 reservoir beaker. Thus, it could be avoided to pick
the deposition experiments the sample boxes’ X-axes were always            up eventually present little stones (IRD), assuming they have col-
oriented towards NW (Fig. 3).                                              lect at the beaker’s bottom. Before each injection, the slurry was
                                                                           again virulently stirred for homogenization for about 30 s using
                                                                           the household mixer. For the first sets of samples with vibrating
2.4 Field settings                                                         platform, over one week, amounts of 1.5–2.5 cm3 were injected
In order to have well defined conditions, clearly different from the       into the seven boxes each morning and/or late afternoon. After each
ambient field, the coils’ fields were mostly oriented anti-parallel to     injection of the slurry, the boxes were shortly and carefully shaken
the magnetic field in the laboratory. This overcompensation required       by hand to completely equalize the slurry’s surfaces. Between the
a total current (power) of up to 1.0 A (10 W), splitted into 0.5 A per     injections the samples were left open in order to evaporate a certain

                                                                                                                                                     Downloaded from https://academic.oup.com/gji/article/224/1/271/5911579 by guest on 12 November 2020
coil pair by the potentiometer (Figs 2 and S6). Due to the coils’ and      amount of pore water for condensing the slurry. In the first phase
power supply’s specifications, respectively, no higher currents could      of this kind of experiments, the boxes were covered by one large
be used this way, yielding a field of about 70 μT opposite to the          plastic box (further details are listed in Table 1) in order to sup-
ambient field. For higher field settings only the vertical component       press evaporation. By this procedure, after a total settling time tS of
connected directly to the power supply was used providing fields of        168 hr (7 d) a total amount of ∼11.5 cm3 of slurry could be in-
up to −114.21 μT (vertically up).                                          jected into the 6 cm3 sample boxes. In the second phase of these
   The field in the coils’ centre was adjusted prior to each deposition    experiments, the settling time tS was reduced to 96 hr (4 d) with
experiment using an Applied Physics Systems (APS) 520A tri-axial           slightly larger portions of slurry being injected into the boxes. Fur-
fluxgate magnetometer. Further on, it was assumed that the field is        thermore, the sample boxes were kept completely open to achieve a
sufficiently kept at a constant value by the stabilized power supply.      faster compaction by evaporation (details listed in Table 2). In both
In order to be prepared for short power failures, potentially spoiling     preparation schemes the slurry inside the boxes lost about 5.5 cm3
the results from the long-term deposition experiments, power supply        of water. It was then still wet with a pasty consistency but already
and ventilator both were secured by an uninterruptible power supply.       stiff enough for performing the various measurements, partly need-
At the end of one (the beginning of a new) deposition experiment,          ing to turn the samples upside down (see Section 2.7). At the end
the field setting was checked again. In general, the field was the         of each deposition experiment, the weights of the samples, with the
same in the range of ±0.05 μT.                                             boxes now closed by their lids, were measured. The density of the
                                                                           condensed sediment was determined by subtracting the weight of
                                                                           closed empty boxes (2.8 g) and then dividing by its internal vol-
2.5 Estimation of evaporation rate                                         ume (6 cm3 ). In general, after measurement of all parameters, the
                                                                           slurry was removed from the boxes and put back into the 800 cm3
In order to check how fast the prepared slurry looses pore wa-             reservoir. The loss of water in the recycled slurry was compensated
ter a few evaporation tests were performed in advance. Palaeo-             by adding the amount of water that was lost by evaporation during
magnetic boxes were filled completely with diluted slurry (density         the experiments. The empty boxes were disposed since they might
∼1.35 g cm−3 ) and then placed on a precision balance (OHAUS AN-           have taken up a remanence during magnetization acquisition exper-
ALYTICAL Plus, Type AP 110 S), capable of measuring weights                iments (Section 2.7). These types of experiments yielding 42 sets
of up to 100 g with a precision of 0.1 mg. One test sample was             of seven samples each were performed over a total time interval of
weighed every minute in the first phase, but normally, weight de-          20 months.
termination was performed over 4–5 d, with 2–3 readings per day               In a third experimental phase, for another collection of sample
(morning, noon and afternoon) only. Between the readings the test          sets, an even shorter scheme was used according to the details given
sample was left on a table covered with a plastic beaker placed            in Table 3. The major difference to phases 1 (7-d experiments)
upside-down above the test sample but held up by other four empty          and 2 (4-d experiments) was that the platform was not vibrating
sample boxes around to enable some ventilation. Some other sam-            during settlement of the slurry. The major goal was to check the
ples were stored without cover between the measurements, moni-             (un-)importance of vibration during settlement/condensing of the
toring the maximum evaporation possible under normal laboratory            slurry. Only after injection of the slurry, like in experimental phases
conditions.                                                                1 and 2, the boxes were shortly shaken by hand to equalize the
                                                                           slurry’s surfaces. The injection of a total of 10 cm3 of slurry was
                                                                           accomplished after 48 hr (2 d), allowing the production of two
2.6 Sample preparation for remanence acquisition
                                                                           sample sets at different fields per week. During these experiments
For the main experiments, mixed Black Sea sediment (details see            the slurry inside the boxes lost about 4 cm3 of water per sample.
Section 2.1) was diluted by distilled water and stirred with a house-      Production of the thirteen sets of samples produced this way was
hold mixer for homogenization. It was kept in a reservoir of about         accomplished in 2 months.
800 cm3 , covered with plastic foil. It was also kept at a more or less       For testing the speed of lock-in, a single set of seven samples was
constant density of 1.30 (±0.02) g cm−3 by checking its density in         treated in a special way. Only the vertical component was changed
regular intervals (three to four times a week), and adding distilled       to Z = −81.12 μT (up). In the morning, with the vibration of the
water when needed. The slurry was fairly liquid, that is, it was able      platform turn on, the boxes were completely filled with 6.5 cm3 of
to flow and to form a (fairly) flat surface, but thick enough to prevent   slurry. Thus, the slurry inside the boxes was domed up a little bit.
separation of coarser from finer material even under vibration. For        After 5 hr and 25 min of condensing by evaporation, the boxes were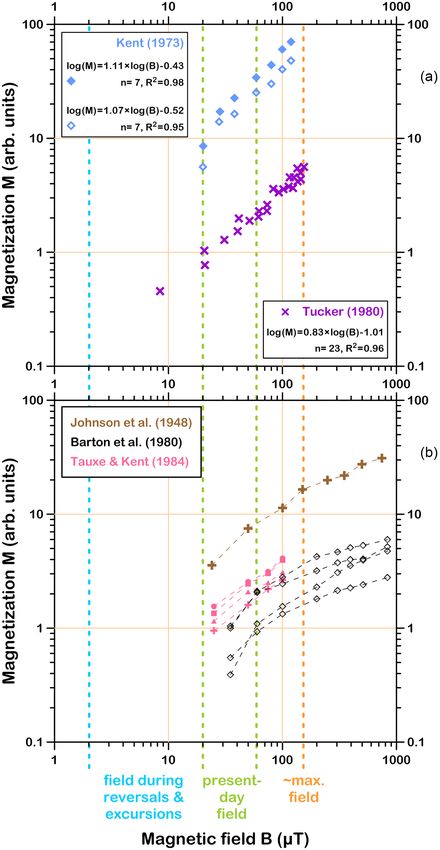
276       N.R. Nowaczyk

                                                                                                                                                                     Downloaded from https://academic.oup.com/gji/article/224/1/271/5911579 by guest on 12 November 2020
Figure 3. Sketch of the seven plastic boxes (a) placed in the centre of the coil system (Figs 2 and S7). The samples’ coordinate system (b) is rotated by 45◦
with respect to the geographic coordinate system (c). All seven samples are sited within a radius of less than 5 cm around the coils’ centres where by theoretical
calculations the field set by the current supply is varying by not more than 1 per cent. In general, for the DRM acquisition experiments the field was oriented
upward and Southward (red arrows in c).

Table 1. Initial preparation scheme of a data set with a settling time of 168       Table 3: Fast preparation scheme of a data set with a settling time of 48 hr
hr and vibrating platform, yielding one set of seven samples per week. The          and still platform, yielding two sets of seven samples per week. The total
total amount of injected slurry calculates to 10.5–11.5 cm3 . From morning          amount of injected slurry calculates to 10.0 cm3 . The samples were not
to late afternoon the samples were loosely covered by a large plastic box.          covered enabling maximum evaporation.
Overnight and during the weekends the samples were tightly covered by a
                                                                                    Day of the week                   Morning                 Late afternoon
large plastic box.
                                                                                    Monday                           2.5 cm3                     3.0 cm3
Day of the week                   Morning                Late afternoon
                                                                                    Tuesday                          2.5 cm3                     2.0 cm3
Monday                           2.0 cm3                    2.0 cm3                 Wednesday                      Measurements
Tuesday                          2.0 cm3                  1.5–2.0 cm3               Wednesday                        2.5 cm3                     3.0 cm3
Wednesday                           —                       1.0 cm3                 Thursday                         2.5 cm3                     2.0 cm3
Thursday                       1.0–1.5 cm3                     —                    Friday                         Measurements
Friday                         1.0–1.5 cm3                     —
Saturday                            —                          —
Sunday                              —                          —                    amplitudes, shorter time interval under ambient field conditions)
Monday                        Measurements                                          were also performed.

Table 2. Optimized preparation scheme of major data set with a settling
time of 96 hr and vibrating platform, yielding one set of seven samples             2.7 Palaeo- and mineral magnetic measurements
per week. The total amount of injected slurry calculates to 11.5 cm3 . The
samples were not covered enabling maximum evaporation.                              The artificial samples for this study were treated in a similar man-
                                                                                    ner as the natural samples from Black Sea sediment cores (e.g.
Day of the week                   Morning                Late afternoon
                                                                                    Nowaczyk et al. 2012; Liu et al. 2018). First, the anisotropy of mag-
Monday                          2.0   cm3                    2.5 cm3                netic susceptibility (AMS) was determined with an AGICO Multi-
Tuesday                         2.0 cm3                      2.0 cm3                Function Kappabridge MFK-1S, applying a field of 200 mAm−1 at
Wednesday                          —                         1.5 cm3                a frequency of 976 Hz. These measurements also provided the low
Thursday                           —                         1.5 cm3                field volume susceptibility (κ LF ). Obtained orientations and magni-
Friday                        Measurements
                                                                                    tudes of the main axes of the AMS ellipsoid (Kmax , Kint , Kmin ) were
                                                                                    used to evaluate the magnetic fabric of the artificially produced
closed with their lids to stop the evaporation process and also the                 samples.
current in the coil was turned off. The samples then were kept on the                  The acquired detrital/depositional remanent magnetization
vibrating platform being exposed to the ambient field (H = +18.3                    (DRM) of the artificial samples was measured and demagnetized
μT, North; Z = +45.2 μT, down) for further 116 hr (almost 5 d)                      using 2G Enterprises superconducting long-core rock magnetome-
before the samples were taken out for remanence measurements. A                     ters, a 2G755SRM (replaced by a 2G755–4K in summer 2019) with
few similar experiments with other field settings (lower initial field              in-line tri-axial alternating field (AF) demagnetizer and automatic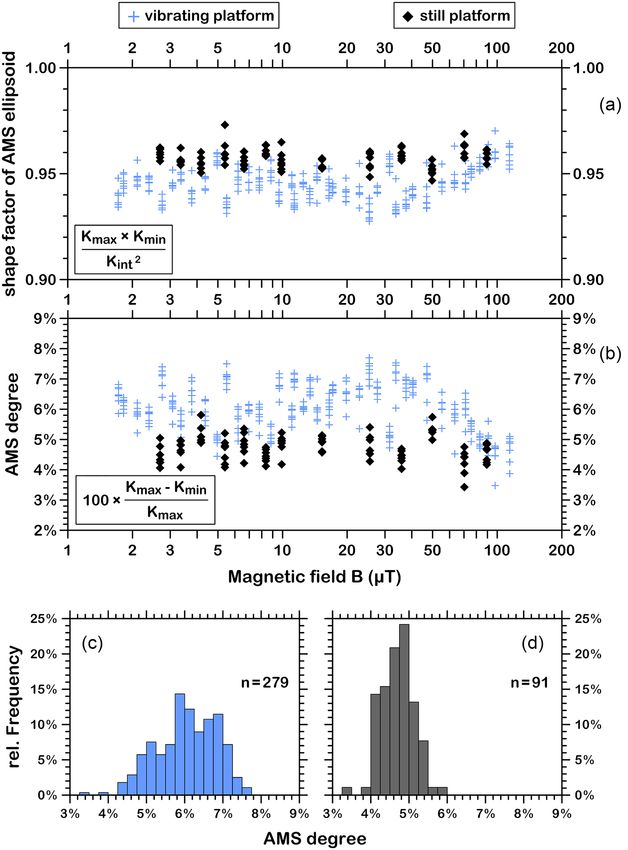
DRM experiments with Black Sea mud                277

sample handler for 8 (9) discrete samples. A 2G600 single-axis          from analytical procedures as applied normally to natural samples
demagnetizer with an in-line coil for a static field was used to im-    are discussed in the following sections.
part anhysteretic remanent magnetizations (ARM) with 100 mT
AF amplitude superimposed by static fields of 50 μT (default) and
150 μT (high-field experiments), respectively. The latter were im-      3.1 Evaporation rates
parted only on samples produced with vibrating platform and are
termed in the following text as strong ARM (sARM). All DRMs             At the beginning of the experiments, over seven to 10 d, the de-
and (s)ARMs were demagnetized in fields of 5, 10, 15, 20, 30, 40,       crease in water content by evaporation was tested by determining
50, 65, 80 and 100 mT AF peak amplitude. DRM demagnetization            the weight of 6 cm3 sample boxes completely filled with diluted
results were subjected to principal component analysis (Kirschvink      slurry. Samples completely uncovered lost about 1 g of water dur-
1980) in order to determine the characteristic remanent magnetiza-      ing the first 24 hr through the open side of the boxes of 4 cm2 , and
tion (ChRM). The slope of DRM intensity versus ARM intensity            about 0.5 g per day after five d (Fig. S8). Taking a split sediment
of common demagnetization steps was determined as a proxy for           core of 100 cm length and a diameter of 10 cm (area = 1000 cm2 )
the relative ‘palaeointensity’, as it was done for the natural sedi-    and an evaporation rate of 0.5 g d−1 through 4 cm2 , a total loss of
ment samples (e.g. Nowaczyk et al. 2013). Thus, results from this       125 g of water can be estimated if the core is kept uncovered for

                                                                                                                                                 Downloaded from https://academic.oup.com/gji/article/224/1/271/5911579 by guest on 12 November 2020
common approximation could be linked directly to the amplitude of       24 hr. A general aspect that should be kept in mind when sampling
the measured field applied during the deposition/condensing exper-      sediment cores. Of course, evaporation depends on porosity and
iments. The magneto-mineralogical homogeneity of the sediment           permeability which are different for the different types of sediment.
material used in the deposition experiments was controlled by mon-      A more or less constant loss of water in the range of 0.5 g d−1
itoring standard rock magnetic parameters and their ratios. The         was determined for samples that were kept under a large plastic
anhysteretic susceptibility κ(ARM), defined as the ARM intensity        box allowing some ventilation from the side (Fig. S8). These results
normalized by the static field used to impart the ARM, further nor-     provided the experimental framework conditions of the redeposition
malized by the low-field magnetic susceptibility κ LF (κ(ARM)/κ LF )    experiments.
is indicative for magnetic grain size, with higher values indicating
smaller grain sizes. The saturated isothermal remanent magneti-
zation (SIRM) was determined after subjecting the samples to a          3.2 Magneto-mineralogy and imaging by SEM
pulsed field of 1.5 T, and the S-ratio, by further applying a re-       The determination of standard rock magnetic parameters deter-
versed field of 0.2 T to the acquired SIRM. The S-ratio is defined      mined for all investigated samples proved that the used slurry
as:                                                                     did not change significantly in composition or magnetic grain size
S = 0.5 × (1 − [IRM−0.2T /SIRM1.5T ]) , with 0 ≤ S ≤ 1.          (3)    throughout the duration of the experiments. The overall variation
                                                                        of grain-size indicative parameter ratios (k(ARM)/kLF , ARM/SIRM,
   The S-ratio is close to 0 (1) for high-coercivity (low-coercivity)   SIRM/kLF ) is very small (Fig. S9). A mean S-ratio of 0.946 (±0.003)
minerals such as hematite (magnetite, greigite). The ARM/SIRM           points towards some hematite present in the slurry.
ratio, like the κ(ARM)/κ LF ratio, can be used in mono-mineralic           Two images of a magnetic extract taken from the slurry used
assemblages (preferably magnetites) as a proxy for relative grain       for the experiments are shown in Fig. 4. Nearly all (bright) grains
size changes since the ARM activates mostly finer particles whereas     visible in the images are low-Ti magnetites. The smallest ones are
the SIRM is acquired by particles of all grain sizes. For the studied   in the range of 1 μm while the biggest ones are in the range of about
natural Black Sea sediments the consultation of the SIRM/κ LF ratio     30 μm. However, the majority of grains is in the range of 2–5 μm,
turned out to be helpful to distinguish greigite- from magnetite-       with a preference for an octahedral shape.
bearing samples (Nowaczyk et al. 2012, 2013). Magnetite-bearing
sediments yielded SIRM/κ LF ratios of about 10 kAm−1 , or lower,
whereas increasing greigite contents increased this ratio up to about   3.3 Anisotropy of magnetic susceptibility
100 kAm−1 (then mostly dominated by greigite).
   In order to directly check the grain size of magnetic particles in   Results from AMS determinations are shown in Figs 5 and 6. All
the slurry used for the experiments a magnetic extract according to     samples are characterized by an oblate AMS ellipsoid (shape fac-
the methods described in Nowaczyk (2011) was inspected in a Carl        tor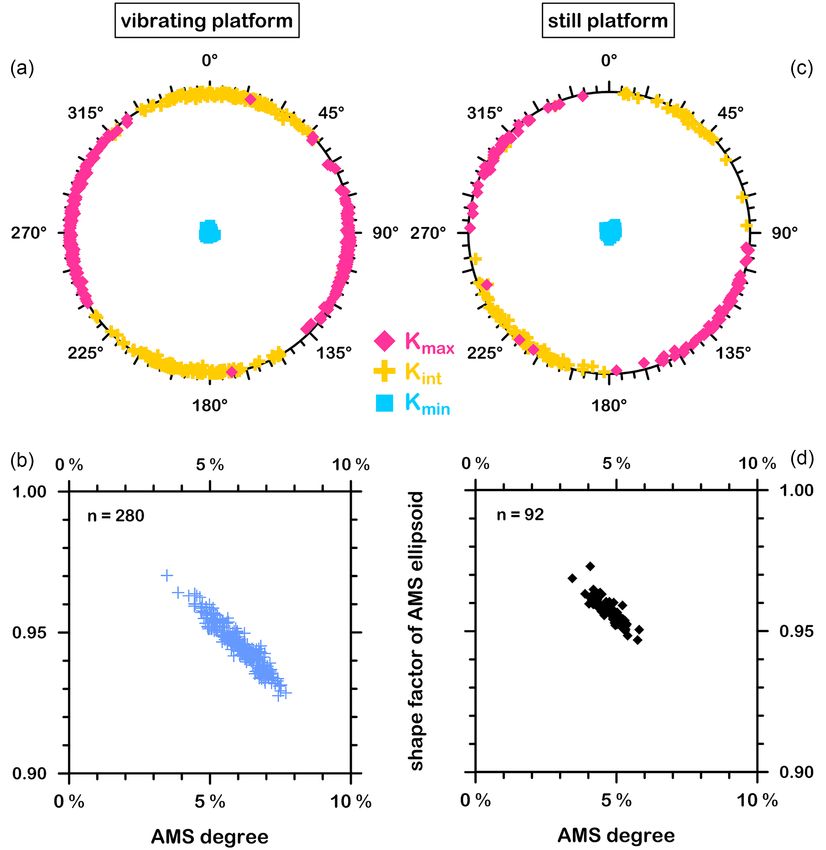
278      N.R. Nowaczyk

                                                                           by the subsequent compaction due to pore water evaporation in ver-
                                                                           tical direction only, such as observed by Blow & Hamilton (1978).
                                                                           The associated mean volume reduction in the vertical direction,
                                                                           estimated from the amount of injected material of 11.5 cm3 (10.0
                                                                           cm3 ) and the volume of the final sample of 6 cm3 , is in the range of
                                                                           48 per cent (40 per cent) for samples deposited on vibrating (still)
                                                                           platform.
                                                                               Fig. 8 shows the simplified concept for the interpretation of the
                                                                           AF demagnetization results. For reasons of clarity only four injec-
                                                                           tions are discussed. With the first injection the box gets filled by
                                                                           about one third and the slurry quickly acquires a magnetization
                                                                           parallel to the test field (Fig. 8a). Since compaction caused by evap-
                                                                           oration of pore water can occur only in vertical direction only the
                                                                           vertical component of the remanence vector shrinks according to the
                                                                           compaction. This introduces the inclination shallowing, illustrated

                                                                                                                                                       Downloaded from https://academic.oup.com/gji/article/224/1/271/5911579 by guest on 12 November 2020
                                                                           by the light and dark red arrows in Fig. 8(b). After some time, for
                                                                           example half a day, the slurry is condensed enough and fills only one
                                                                           quarter of the box (Fig. 8b). Then the second layer gets injected and
                                                                           it also acquires quickly a magnetization parallel to the test field and
                                                                           starts to shrink due to evaporation (Fig. 8c). It also inhibits evapora-
                                                                           tion from the layer below, injected before. The same happens when
                                                                           the third and fourth layer, respectively, have been injected (Fig. 8d).
                                                                           Thus, when the magnetization is acquired quickly after injection
                                                                           (case 1 in Fig. 8e) the inclination shallowing is proportional to the
                                                                           degree of compaction (downward directed arrows in Fig. 8e). The
                                                                           final direction is then parallel to the dark red arrow in Fig. 8e. If the
                                                                           magnetization is acquired after 50 per cent of achieved compaction
                                                                           (case 2 in Fig. 8e), the inclination shallowing is only half of the
                                                                           maximum shallowing (mid-red arrow). If the magnetization would
                                                                           be acquired only after the full degree of compaction is achieved no
                                                                           inclination shallowing would be observed (case 3 in Fig. 8e). In this
                                                                           case the magnetization (light red arrow) is parallel to the magnetic
Figure 4. Scanning electron microscope (SEM) images of a magnetic ex-
                                                                           field B (black arrow in Fig. 8a). Since most of the produced samples
tract from the slurry used for the DRM experiments. Generally, (titano-)
                                                                           show a significant shallowing it can be assumed that the magneti-
magnetites in the range of 2–30 μm, with a preference for smaller grain
sizes, could be observed. Images were taken in backscatter mode.           zation was acquired in the very first phase of compaction forced by
                                                                           evaporation.
                                                                               In order to further check the idea of a fast lock-in separate ex-
   Besides the small difference in the AMS degree (Fig. 5; Figs 6b
                                                                           periments with deviating conditions were performed (Figs 7d–f). In
and d), both sample sets exhibit similar magnetic fabrics which is
                                                                           an upward directed field of B = 83.14 μT (I = −77.35◦ , D = 45◦ ),
fairly comparable to natural undistorted sediment samples. Due to
                                                                           6.5 cm3 of slurry was injected into the plastic boxes placed on vi-
compaction in the vertical direction the short principle axis Kmin is
                                                                           brating platform. After condensing for 5 hr and 25 min the boxes
oriented strictly upward with inclinations of I(Kmin ) ≤ 90◦ (Figs 6a
                                                                           were closed in order to stop further evaporation. To check whether a
and c), showing only little scatter. This provides evidence that an
                                                                           viscous component can develop, the samples were kept on vibrating
appropriate method for producing artificial DRM samples similar
                                                                           platform for almost 5 d, but with the coils’ field turned off (Fig. 7f)
to natural samples was applied.
                                                                           so that the ambient field (B = 48.76 μT, I = +67.96◦ , D = 45◦ ; in
                                                                           sample coordinates) could theoretically affect the samples further
                                                                           on. It was expected that this would realign at least a certain fraction
3.4 Alternating field (AF) demagnetization
                                                                           of the magnetic grains parallel to the magnetic field now oriented
Vector endpoint diagrams of AF demagnetization results from se-            downward but with same declination. However, only the initial field
lected samples deposited in different field amplitudes (1.72–114.21        configuration with a steeply upward oriented vector can be seen in
μT) are shown in Fig. 7. All plots are in sample coordinates. Results      the AF demagnetization results (Fig. 7e). This finding also indicates
are shown separately for variations in the horizontal (XY) plane (dec-     that the magnetization was locked in completely soon after injection,
lination) and in a vertical (HZ) plane (inclination), with red (blue)      but latest until the point when the coils’ field was turned off (after
arrows marking the declination (inclination) of the magnetic field         5 hr), since no contribution of the subsequently applied down-
applied during deposition relative to the samples’ coordinate axes.        ward directed field can be seen in the vector endpoint diagrams.
It is obvious that all samples deposited under standard conditions         Two further experiments with initially upward-directed fields (I
(Figs 7a, b, c, g, h and i) show a significant inclination shallowing,     = −59.04◦ and −65.03◦ ) at lower intensities (B = 35.57 and
with the effect being somewhat larger at lower fields. An obser-           43.35 μT) applied for about one day and subsequent exposure
vation also done by King (1955) when performing redeposition               to the ambient field for about 2 d with vibrating platform were
experiments with homogenized varved silts from Sweden. Inclina-            performed (results not shown). The analyses of their AF de-
tion shallowing actually is an indication that the magnetization is        magnetization data also did not show any evidence for a sec-
acquired fairly quickly after deposition with the direction shallowed      ondary vector component acquired parallel to the ambient field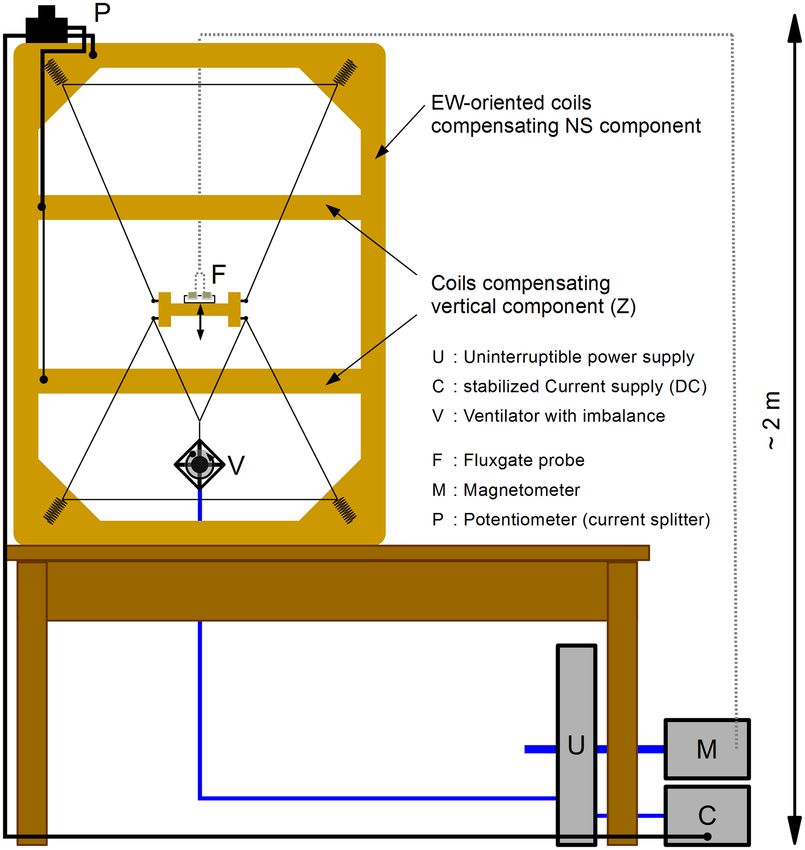
DRM experiments with Black Sea mud                   279

                                                                                                                                                               Downloaded from https://academic.oup.com/gji/article/224/1/271/5911579 by guest on 12 November 2020
Figure 5. Results from magnetic fabric analyses by determinations of the anisotropy of magnetic susceptibility (AMS). The AMS shape factor (oblate < 1,
prolate > 1) is shown in a) and the AMS degree is shown in b). Formulas for calculation of these parameters are given in the insets. The results are shown
separately for samples produced with (without) vibration of the platform (Fig. 2) by blue crosses (black diamonds). Kmax , Kint , Kmin —normalized principle
axes of the AMS ellipsoid.

in the laboratory. These results actually led to the idea to pro-                3.5 Intensity of the acquired depositional remanent
duce a larger sample set completely without vibration of the sam-                magnetization (DRM)
ple platform. In general, their AF demagnetization results are
                                                                                 Magnetization intensities acquired on vibrating and still platform,
undistinguishable from samples produced with vibrating platform
                                                                                 respectively, are shown separately in Fig. 9, both in linear and
(see Fig. 7).
                                                                                 double-log diagrams. Intensities of individual samples are plotted
   The small experimental setup in a fairly busy palaeomagnetic
                                                                                 with green open diamonds whereas mean values from seven samples
laboratory had some limitations. Though the homogeneity of the
                                                                                 deposited at the same field value are marked by black closed dia-
compensated volume inside the coils was (theoretically) sufficient,
                                                                                 monds. The intensity values in the double-log diagram, with some
magnetic field ‘anomalies’ produced by technical installations in
                                                                                 scatter, plot along a straight line. Nonetheless, this result does not
the laboratory did not allow to set the magnetic field to values much
                                                                                 represent a linear behaviour of acquired DRM intensity versus mag-
lower than the minimum applied value of 1.72 μT without larger
                                                                                 netic field, since the slope of a linear function fitted to the data is not
gradients in intensity and/or direction across the space where the
                                                                                 equal 1.00. Instead, the slope is 0.83 (0.79) for samples deposited
sample boxes were placed.
280 N.R. Nowaczyk
Downloaded from https://academic.oup.com/gji/article/224/1/271/5911579 by guest on 12 November 2020
Figure 6. Results from AMS determinations (comp. Fig. 5): Orientation of the principle AMS axes Kmax , Kint , Kmin shown in polar plots (top panel), and
shape factor of the AMS ellipsoid versus AMS degree (bottom panel). In the left (right), results are shown obtained from samples produced with (without)
vibration of the platform (Fig. 2).
on vibrating (still) platform (Fig. 9). This indicates a non-linear demagnetization are shown in Fig. 10. As recognized in data from
relationship (M ∼ B0.83 /B0.79 ), though not very much expressed. natural Black Sea sediments samples (e.g. Nowaczyk et al. 2018;
Since there are much less results from samples deposited on still Fig. 6) a curved section, interpreted as the influence from viscous
platform their slightly more expressed non-linearity value is not components of the remanence, can be seen at AF amplitudes, which
interpreted as the effect of a (probably) slightly less efficient DRM turns into a straight segment at higher fields from about 40 mT
acquisition. AF amplitude on (marked in black in Fig. 10). Estimates of rela-
tive palaeointensity were calculated from these straight segments
by linear regression. Although the data cover almost two orders of
3.6 Estimation of ‘relative palaeointensity’ (rPI) magnitude in magnetic field intensity during deposition no signifi-
Although the magnetic field during deposition of the samples is cant difference in the shape of the curves can be seen in the diagrams
known by direction and intensity, typical palaeointensity estimates of Fig. 10, maybe except for the one from the experiment with the
as applied to natural samples were determined as well. Bi-plots lowest test field applied during deposition.
of DRM intensity versus intensity of the anhysteretic remanent Summarized results from ARM-normalized rPI estimates to-
magnetization (ARM; 50 μT static, 100 mT AF) throughout AF gether with DRM intensities normalized by low-field susceptibilityDRM experiments with Black Sea mud 281
Downloaded from https://academic.oup.com/gji/article/224/1/271/5911579 by guest on 12 November 2020
Figure 7. Results from alternating field (AF) demagnetization (0–100 mT in 11 steps, details see Section 2.7) of acquired DRMs for low (a, g), intermediate
(b, h) and high magnetic fields (c, i) during remanence acquisition, shown as vector endpoint diagrams. The respective test field amplitudes are given in μT.
The Zero-field AF step is marked by an open diamond and axis scaling of the diagrams is in mAm−1 . Left (right): samples produced with vibrating (still)
platform. For fields higher than ∼70 μT, only the vertical component could be inverted, yielding declinations (red arrows in XY plots) in sample coordinates
(see Fig. 3) of ∼45◦ , whereas for lower fields the horizontal component was also inverted, yielding declinations of 225◦ . Inclinations of the fields set during
the experiments are given by blue arrows in the HZ plots. H = sqrt(X2 + Y2 ). In all results, inclinations of the acquired DRMs are clearly shallower than
the inclinations measured with fluxgate probe at the beginning of each experiment. Demagnetization results from two samples (d, e) from a special magnetic
viscosity experiment (f) are shown in the bottom (for more details see Section 2.5).282 N.R. Nowaczyk
Downloaded from https://academic.oup.com/gji/article/224/1/271/5911579 by guest on 12 November 2020
Figure 8. Simple concept for inclination shallowing during the experiments. (a) Injection of slurry and immediate alignment of magnetic particles parallel to
the ambient magnetic field B, forming the magnetization vector M (light red arrow). (b) Due to evaporation (blue upward directed arrows) the diluted slurry
(light brown) gets condensed in vertical direction (dark brown), shallowing the locked-in magnetization vector (dark red arrow). (c) Injection of a second
layer with subsequent evaporation and shallowing the magnetization direction like in layer one. (d) Final situation after injection of four layers. (e) Theoretical
magnetization vector with (1) remanence acquisition before compaction and maximum shallowing, (2) remanence acquisition after 50 per cent compaction
and 50 per cent of maximum shallowing, and (3) remanence acquisition after compaction without inclination shallowing.
(κ LF ) and intensity of saturation magnetization (SIRM) are shown intensities of 2.8 μT during the Laschamps excursion and 60 μT
in Fig. 11 (vibrating platform) and Fig. 12 (still platform). Slopes at ∼50 ka, respectively (red dashed lines in Figs 11c, d and 12c).
of linear fits to ARM-normalized data are similar, with 0.83 both Thus, the laboratory acquired magnetization is about five times
for normalization with ARM (50 μT static, 100 mT AF; Fig. 11c) more efficient than the NRM of studied Black Sea sediments. A
and sARM (150 μT static, 100 mT AF; Fig. 11d) from samples similar observation was also done by King (1955) who found that
deposited on vibrating platform, and 0.82 from samples on still redeposited sediments from Sweden carried a magnetization 3–4.5
platform (Fig. 12c). Thus, there is no difference in the results from times higher than the original NRM. The most plausible explana-
both methods (ARM and sARM). However, it is interesting that the tion is, that the extremely calm conditions in the laboratory are
slope (DRM/ARM) at 50 μT is around 3. This indicates that the more favourite for a good alignment of the magnetic particles than
DRM acquired in a field of 50 μT is three times higher than the natural conditions with, for example moving bottom water King
ARM acquired in a static field of 50 μT and 100 mT AF amplitude. (1955).
This points towards a high efficiency in DRM acquisition with the All ARM-normalized data, like the absolute DRM intensities
chosen material and experimental conditions. A similar relation- (Fig. 10), point to a slight non-linear behaviour in DRM acquisi-
ship is valid for the sARM acquired with a static field of 150 μT, tion. Slopes of linear fits to estimates of rPI based on normalization
when extrapolating data (Fig. 11d). Actually, according to Liu et al. by κ LF (0.83) and SIRM intensity (0.82) confirm the ARM-based re-
(2020), NRM/ARM slopes from natural Black Sea sediments are sults, at least for samples deposited on vibrating platform (Fig. 11).
only in the range from 0.03 to 0.73 according to estimated field Slopes for κ LF -normalized (0.79) and SIRM-normalized (0.78) rPIDRM experiments with Black Sea mud 283
Downloaded from https://academic.oup.com/gji/article/224/1/271/5911579 by guest on 12 November 2020
Figure 9. Acquired DRM intensities of all investigated samples versus magnetic field during deposition of the sediments. Open green diamonds mark individual
samples whereas black closed diamonds represent the mean values of seven samples deposited at the same field intensity. Left (right) DRMs acquired on
a vibrating (still) platform. In the linear (logarithmic) plots scatter is larger for samples deposited at higher (lower) fields. A statistical analysis of the field
dependence of the mean DRM values is given in the insets. Since variable amounts of slurry (see Tables 1–3) were injected into the sample boxes, DRM
intensities were normalized to a common volume of 11 cm3 .
estimates from samples deposited on still platform (Figs 12a and a better alternative, keeping the sediments untouched after depo-
b) point towards a slightly more non-linear behaviour when using sition. When you come to think of it, the air pressure of 1 bar is
these parameter ratios, though the differences are not large. equal to 1 kg cm−2 . Since the sample boxes’ open sides are 4 cm2 ,
the atmosphere was pressing with a weight of 4 kg permanently on
the slurry. Obtained condensed samples with a density of 1.45–1.55
4 DISCUSSION were still humid and had a pasty consistency and a magnetic fab-
One major aspect of this study was to find a simple way to produce ric similar to natural samples from the Black Sea with a degree of
a large number of mechanically stable and measurable samples de- anisotropy between 4 and 8 per cent (Fig. 6). This is an indication
posited in a wide range of field settings in an appropriate amount that the produced samples have a magnetic fabric similar to the
of time. Dewatering diluted slurries by mechanical compaction ap- natural samples.
peared to be too impractical needing a much more complicated The most astonishing result of the performed experiments is that
experimental setup and much more working steps. Theoretically, it the vibration, intended to force compaction of the bulk sediment
also bears the danger of distorting the samples’ fabric when squeez- and/or promote the alignment of magnetic particles inside the ini-
ing is performed too fast. Compaction by simply letting a sufficient tially 1.3 g cm−3 dense slurry, did not have any clear influence.
amount of pore water slowly evaporate, therefore, appeared to be Obviously, already the initial manual shaking of the sample holder,284 N.R. Nowaczyk
Downloaded from https://academic.oup.com/gji/article/224/1/271/5911579 by guest on 12 November 2020
Figure 10. Plots of DRM intensity versus ARM intensity in the course of AF demagnetization for the determination of relative palaeointensity as also
performed for natural samples from the Black Sea. Left (right): samples produced with vibrating (still) platform. For determination of the slope only the steps
marked in black, representing the most linear part of the track, were taken into account.
applied in order to equalize the slurry’s surface after injection, ei- a clear inclination shallowing was observed. The latter is interpreted
ther with vibrating or with still platform, was sufficient enough to to be due to the strong compaction in vertical direction of 40 per
activate the magnetic particles and fix them again sufficiently and cent and more, occurring during the relatively fast compaction of
with a degree of alignment that is proportional to the magnetic field the slurry by evaporation, compared to a much slower compaction
set by the surrounding coils. In this context it might be interesting under natural conditions. Nevertheless, this indicates that the mag-
to note that the slurry in the reservoir beaker came to a sudden stop netization was acquired almost instantaneously, with a subsequent
after being stirred instead of swirling around, when the mixer was flattening in inclination by subsequent compaction in vertical direc-
turned off. This probably indicates an immediate development of a tion (Fig. 8).
sedimentary/magnetic fabric able to resist against magnetic fields Since rPI estimates by normalization with ARM, κ LF , and SIRM
as applied in this study. yielded the same relationship with the test field, with a slope of 0.83
Though the relationship is not really linear (Figs 9, 11 and 12), (rPI ∼ B0.83 ), DRM intensities (Fig. 9) are used for the following
even at the lowest fields of down to 1.72 μT a magnetization in- discussion. The DRM intensities of all investigated samples, both
tensity according to the experimental field was acquired. However, with vibrating and still platform, are summarized in Fig. 13 (black
towards lower fields the intensities (and directions) became more diamonds). The line fitted to the data (olive straight line), with
scattered, likely due to the limited size of the experimental setup a slope of 0.82 (M ∼ B0.82 ), is plotted together with theoretical
within an inhomogeneous ambient magnetic field. And, in all cases fits. A slope of 1.10 (blue, short dashes) refers to the results ofDRM experiments with Black Sea mud 285
Downloaded from https://academic.oup.com/gji/article/224/1/271/5911579 by guest on 12 November 2020
Figure 11. Common methods used to estimate the relative palaeointensity (rPI) from natural samples applied to the artificial samples of this study, produced
with vibrating platform. DRM intensity normalized by (a) low-field volume susceptibility κ LF and (b) saturation magnetization SIRM, acquired in a pulsed
field of 1.5 T, slope of DRM intensity normalized by ARM intensity during alternating field (AF) demagnetization (comp. Fig. 9). Two different approximations
were performed using (c) 50 μT and (d) 150 μT static field superimposed on an AF field of 100 mT. Coloured crosses mark individual samples whereas black
closed diamonds represent the mean values of seven samples deposited at the same field intensity. A statistical analysis of the field dependence of the mean
rPI values is given in the insets. In (c) and (d) the dotted red line marks the range of slope (NRM/ARM) versus estimated field intensity from natural samples
(after Nowaczyk et al. 2013; Liu et al. 2020). The ARM of these samples were produced with 100 mT AF and 50 μT static field.
Kent (1973; comp. Fig. 1), a slope of 1.00 represents a strict linear (cubic) relationship, and a slope of 0.5 represents a square-root
relationship (dotted black line), and a slope of 0.70 (light orange, relationship.
long dashes) was used by Gilder et al. (2019) to fit their experimental The majority of data obtained from redeposited Black Sea sed-
results from lacustrine sediment samples. However, they produced iments originate from samples produced at field intensities lower
samples in fields between 300 μT and 70 mT, thus not really fitting than the minimum field values of the present-day field (about 23 μT,
to the topic of this study. All data/fits are rescaled in a way that they South Atlantic Anomaly, US/UK World Magnetic Model—Epoch
intersect each other at a magnetization level of 1 (arb. unit) related 2020.0). The whole range of low field intensities estimated for the
to a field level of 35 μT (global mid-range present-day field level). transitional field during the Laschamps excursion in the Black Sea
Although it should be clear from a mathematical point of view, it is area (down to 2.8 μT; after Liu et al. 2020) could be evenly cov-
pointed out here again that slopes of straight lines in a double-log ered with experimental data. Due to the chosen combination of
plot different from 1 (see formulas 1 and 2) represent a non-linear power supply and coil design (compensation efficiency), a technical
behaviour. For example, a slope of 2 (3) represents a quadratic setup especially designed for the precise performance of low-field286 N.R. Nowaczyk
experiments, test fields above 115 μT could not be realized. Thus,
an expected flattening of the slope of acquired DRM versus high(er)
magnetic fields, such as observed in the classical studies of, for ex-
ample Johnson et al. (1948) and Barton et al. (1980), could not be
checked for the investigated Black Sea sediments. Anyway, this was
not a major goal of this study and obtained data are sufficient for
interpretation. The limited homogeneity of the magnetic environ-
ment also did not allow to safely set fields lower than 1.7 μT. Thus
it could not be checked whether there is a threshold level (minimum
field intensity) under which no magnetization is acquired. Never-
theless, DRM acquisition across almost two orders of magnitude
in field strength could be investigated, requiring a net time period
of about 2 yr. The scatter observed in the obtained DRM distribu-
tion is interpreted as being due to the experimental conditions with
a fairly dense slurry of 1.30–1.55 g cm−3 and the relatively short
Downloaded from https://academic.oup.com/gji/article/224/1/271/5911579 by guest on 12 November 2020
compaction time of 4–7 d (if at all relevant) achieved by a fairly fast
condensing in order to sufficiently increase the rigidity of the slurry.
This was necessary so that the samples could be rotated inside the
Kappabridge for AMS determination, or the spinner magnetometer
for SIRM acquisition experiments, without distorting the integrity
of the samples.
One aspect of this study was to possibly find a direct calibration of
the natural depositional remanent magnetization of Black Sea sedi-
ments by the performed redeposition experiments under controlled
field conditions. But, obviously, concerning the acquired magneti-
zation intensity, the chosen laboratory conditions were too ideal,
as the measured intensities were systematically stronger than in the
natural samples when normalized by ARM. At least the offset be-
tween the estimates of relative palaeointensity (slope (NRM/ARM))
from the natural samples (red dashed lines in Figs 11c and 12c) and
the same type of estimates from the redeposited material is quite
constant. The constant offset in the double-log plots of Figs 11c
and 12c means that there is a constant factor of about five between
magnetization intensities acquired in this study and estimated field
intensities from natural samples. The latter were obtained by com-
parison of the Black Sea relative palaeointensity distribution to
absolute palaeointensity data from the past 50 ka (Nowaczyk et al
2013; Liu et al. 2020), assuming a linear relationship. A magneti-
zation stronger than in natural samples was not expected. Since a
fairly thick slurry was used, it was more expected, that towards lower
fields the acquisition of magnetizations might be less effective, due
to friction on the scale of pore space, or even inhibit an alignment
at all. But, when compared to the results from natural samples with
an assumed linear relationship between magnetization and mag-
netic field (red dashes lines in Figs 11c and 12c) the acquisition
of magnetization seems to be relatively a bit more effective than at
higher fields, though more scattered. Probably this scatter is due to
interstitial friction, being more relevant for larger particles with a
less fortunate ratio of magnetic moment to volume, due to the pres-
ence of more than one domain in the largest particles. Nevertheless,
Figure 12. Common methods used to estimate the relative palaeointensity the almost constant offset (factor) between NRM/ARM of natural
(rPI) from natural samples applied to the artificial samples of this study, samples and artificial samples versus magnetic field during depo-
produced with still platform. DRM intensity normalized by (a) volume sus-
sition indicates that (at least) one controlling factor counteracting
ceptibility κ LF , (b) saturation magnetization SIRM, acquired in a pulsed field
the alignment of magnetic particles, which is independent of the
of 1.5 T and (c) slope of DRM intensity normalized by ARM intensity (50
μT static field, 100 mT AF) during alternating field (AF) demagnetization magnetic field, was not encountered during the redeposition exper-
(comp. Fig. 9). Coloured crosses mark individual samples whereas black iments. Natural glacial sediments in the SE Black Sea were built up
closed diamonds represent the mean values of seven samples deposited at with a deposition rate between 20 and 40 cm ka−1 (Liu et al. 2020),
the same field intensity. A statistical analysis of the field dependence of the or 0.2 to 0.4 m ma–1 , while during the experiments the slurry was
mean rPI values is given in the insets. In (c) the dotted red line marks the deposited at a rate of about 800 m ma–1 (15 mm per week), that is,
range of slope (NRM/ARM) versus estimated field intensity from natural two thousand times faster. Under natural conditions there is a tran-
samples (after Nowaczyk et al. 2013; Liu et al. 2020). The ARM of these sition from water, via loose sediment into sediments rigid enough
samples were produced with 100 mT AF and 50 μT static field.You can also read