If You Give a Judge a Risk Score: Evidence from Kentucky Bail Decisions* - ecineq
←
→
Page content transcription
If your browser does not render page correctly, please read the page content below
If You Give a Judge a Risk Score: Evidence
       from Kentucky Bail Decisions*
                                        Alex Albright†
                            (Click here for most recent version)
                                            May 29, 2019

                                                 Abstract

          High-stakes decisions are increasingly informed by predictive tools. Many assume
      that these tools should reduce disparities across groups by limiting human discretion,
      but empirical evidence on this is lacking. In this paper, I outline how interactions be-
      tween prediction tool recommendations and human discretion can actually exacerbate
      disparities across groups. In particular, I discuss a policy change in Kentucky that
      set a recommended default for judge bail decisions based on risk scores. Counter to
      expectations, the policy caused an increase in raw racial disparities in initial bond, first
      illustrated by Stevenson (2017). Using case-level data, I show that this increase was not
      simply a consequence of different risk scores by race. Rather, the recommended default
      was also more likely to be overridden (in favor of harsher bond conditions) for black
      defendants than similar white defendants. I discuss two forces behind this result. First,
      judges varied in their policy responsiveness; judges in whiter counties responded more
      to the new default than judges in blacker counties. Second, even within judge and
      time, judges were more likely to override the recommended default for moderate risk
      black defendants than similar moderate risk white defendants. This result suggests
      that interaction with the same predictive score may lead to different predictions by
      race.
     * I am grateful to Mandy Pallais, Crystal Yang, Ed Glaeser, Larry Katz, Roland Fryer, Alma Cohen, Louis
Kaplow, Emma Harrington, Hannah Shaffer, Jon Roth, Megan Stevenson, Nathan Nunn, Scott Kominers,
Alberto Alesina, Ashesh Rambachan, Michael Thaler, Moya Chin, Jennifer Doleac, Philip Marx, Michael
Norton, Karen Shen, Natalia Emanuel, Liz Engle, Namrata Narain, Brian Wheaton, LJ Ristovska, Tianwang
Liu, Kadeem Noray, Sarah Armitage, John Tebes, Jack Feng, Frank Pinter, Tanaya Devi, and Mattie Toma
for their comments and suggestions. Thanks to participants in the Harvard Graduate Student Workshop
in Labor Economics, the Harvard Inequality and Social Policy Proseminar, and the Harvard Graduate
Student Workshop in Political Economy for insightful feedback. I thank Daniel Sturtevant and the Kentucky
Administrative Office of the Courts for providing me with the data used in this paper as well as Tara
Blair and Christy May for answering institutional questions about Kentucky pretrial services. Thanks to
Kathy Schiflett, Brenda Piquet, Carolina Harvey, and Alicia McGovern for helping me navigate institutional
processes. I deeply appreciate the R community for developing the many open source packages used in
this work. This research has been supported by a James M. and Cathleen D. Stone PhD Scholar fellowship
from the Multidisciplinary Program in Inequality & Social Policy at Harvard University as well as a Terence
M. Considine Fellowship in Law and Economics from the John M. Olin Center for Law, Economics, and
Business at Harvard Law School.
    † Economics Department, Harvard University, Cambridge, MA 02138. apalbright@g.harvard.edu.

                                                     1
1     Introduction

High-stakes decisions are increasingly informed by data-driven prediction tools. Loan offi-
cers use credit scores to help make lending decisions, managers use predictions in making
hiring decisions, and judges use risk assessments to set bail (Miller 2015; Einav, Jenkins,
and Levin 2013; Mamalian 2011). Despite their prevalence, usage of such predictive tools
is controversial.1 Advocates argue that their embrace could weaken the role human biases
play in high-stakes decision-making (Harris and Paul 2017). Meanwhile, opponents are
concerned that the tools themselves are biased against disadvantaged groups.2 While
many are focused on the predictions and biases of predictive tools in isolation,3 these tools
are usually introduced into systems chock-full of human judgments. Human discretion
means that there is not necessarily a one-to-one mapping from the predictive tool to the
final outcome. Despite the empirical importance of discretion, there is little evidence on
how adherence to predictive tool recommendations may interact with demographic dispar-
ities.4 Of particular policy interest is the following question: are predictive recommendations
followed similarly across racial groups?
To address this question, I focus on an example from the criminal justice system – the usage
of risk assessment recommendations in judge bail decisions. Risk assessments, generated
based on individual-level characteristics, are used in bail, pretrial, or sentencing hearings
in 49 of 50 US states (Traughber 2018).5 Bail decisions determine conditions for release from
jail before trial.6 Conditions can include supervision or specific caveats such as no drinking,
however, the most well-known conditions are monetary. Receiving financial bond means
that a defendant needs to provide some amount of money in order to be released from jail,
while non-financial bond means that the defendant does not. Empirically, in my setting,
non-financial bond corresponds to a 96% chance of immediate release; financial bond
corresponds to 20% chance of immediate release. My decision to focus on bail decisions
is due to both policy relevance as well as methodological advantages. Pretrial detainees
“account for two-thirds of jail inmates and 95% of the growth in the jail population over
the last 20 years” (Stevenson and Mayson 2018), meaning they comprise a meaningful part
    1 One salient and timely example: the American Civil Liberties Union (ACLU) of California, which
originally sponsored Senate Bill 10, which was passed to get rid of money bail in California, eventually
came out in opposition partially due to concerns about how racial justice interacts with risk assessment tools
(ACLU of California 2018).
   2 In particular, risk assessments in criminal justice have received much public criticism on this front. See

Angwin and Kirchner (2016), which motivated much of the current academic work on this topic. Michelle
Alexander, author of The New Jim Crow, has even called risk assessment scores the “Newest Jim Crow”
(Alexander 2018).
   3 Concerned with bias, fairness, and predictive accuracy, current academic work on risk scores in criminal

justice overwhelmingly focuses on the technical validation and generation of risk scores (Kleinberg et al.
2018, 2017; Corbett-Davies et al. 2017).
   4 Kleinberg et al. (2017) presents evidence that algorithmic prediction could reduce racial disparities in

New York City. However, that finding assumes automating judges away.
   5 Furthermore, risk assessments are used in pretrial in dozens of jurisdictions and at least six entire states.

They are also used in sentencing in at least twenty-eight entire states (Doleac and Stevenson 2018).
   6 For context, about 90-95% of cases are estimated to resolve in plea bargaining (rather than trial) (Devers

2011).

                                                        2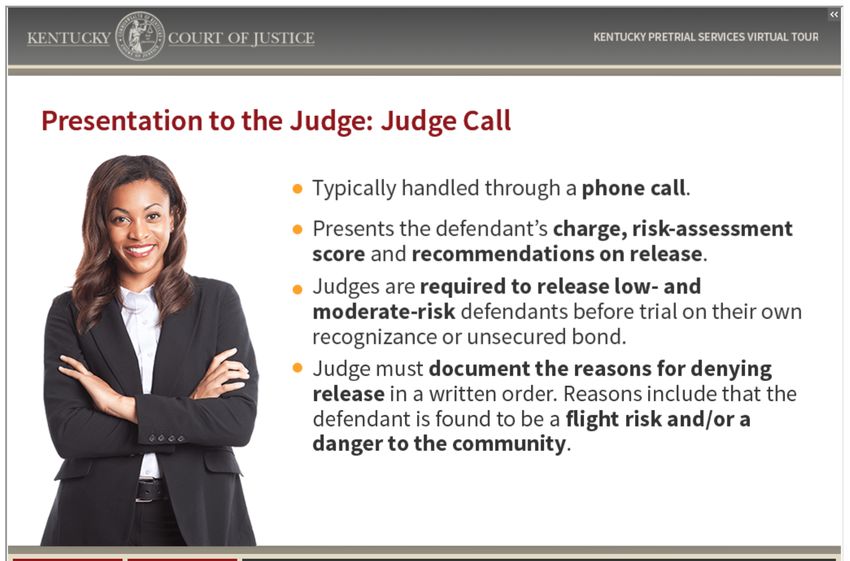
of the current social policy conversation on mass incarceration. Moreover, bail decisions
during pretrial can have large downstream effects on future outcomes such as likelihood of
conviction.7 Methodologically, bail is a promising environment for study since, as Arnold,
Dobbie, and Yang (2018) explain, bail decisions are made quickly and the legal objective is
clear.8
My paper focuses on a policy change, House Bill 463 (HB463), in Kentucky that set bail
recommendations based on defendant risk scores. During my time period of interest
(2009-2013) in Kentucky, judges made initial decisions about defendants within 24 hours
of the defendant’s booking.9 Before HB463, judicial consideration of a defendant’s risk
assessment score level, as calculated by the Kentucky Pretrial Risk Assessment (KPRA),
of low, moderate, or high was optional in initial bond decisions (meaning many judges
did not know the defendants’ risk levels). However, when House Bill 463 (HB463) was
enacted on June 8, 2011, judges became required to consider the risk score level (again, of
low, moderate, or high) in their initial decision. More powerfully, judges were required to
set non-financial bond for low and moderate risk defendants unless they give a reason for
deviating from this “presumptive default” (Stevenson 2017).
In conceptualizing HB463 as an upward shock to the weight on risk levels in a judge’s bail
decision, it would be natural to think this would mechanically shrink racial disparities for
low and moderate risk defendants. However, using case-level data from the Kentucky
Administrative Office of the Courts, I show empirical evidence to the opposite effect. I
first replicate Stevenson (2017)‘s striking finding that rates of non-financial bond jump up
discontinuously at the date of policy implementation, with white defendants experiencing
larger gains. Given that black and white defendants differ in their underlying risk level
distributions (black defendants are more likely to be scored at higher risk levels than
white defendants), this could just be a mechanical consequence of judges’ following the
recommendations at equal rates for white and black defendants. Breaking out the picture
by risk level, I show that differential trends remain when honing in on low and moderate
risk defendants. Therefore, the presumptive default (of non-financial bond for low and
moderate risk defendants) is more likely to be overridden for black defendants than for
white defendants.
In other words, racial disparities for low and moderate risk defendants jumped up after HB463 even
though the policy recommended the same treatment (non-financial bond) for both groups with those
risk levels. This could be due to differences across populations in the underlying charge or
defendant characteristics observed by judges. However, adjusting for charge and risk score
component characteristics does not explain the differential policy effect on initial decisions
    7 For empirical evidence on the effects of pretrial detention, see Dobbie, Goldin, and Yang (2018) and

Cowgill (2018).
    8 In their words, the objective is “to set bail conditions that allow most defendants to be released while

minimizing the risk of pre-trial misconduct”(Arnold, Dobbie, and Yang 2018).
    9 There is more information about this decision in the later sections. The decision usually takes the form

of a phone call between a pretrial officer and a judge, in which the pretrial officer relays relevant information
about the defendant (age, name) and charges (description, class, level). Judges took such calls 1-4 times
per day depending on the size of the county they work in. Ability to pay is not mandated to be in the call.
Judges can ask questions and calls may differ by judge-pretrial officer pair.

                                                       3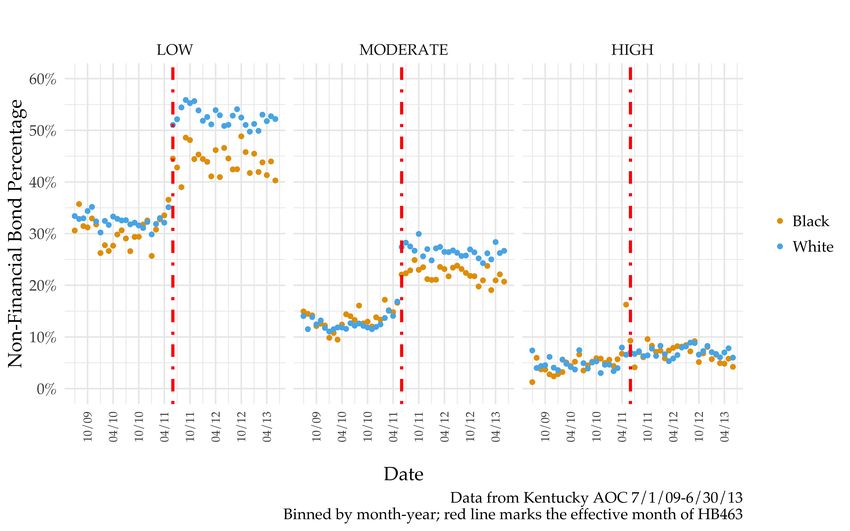
across racial groups. Instead, part of the explanation is different responses by judge.
Recall that while HB463 was a state-wide policy change, judges had discretion in when
they deviated from the presumptive default. Extreme spatial variation in percentages of
black defendants across counties meant that different policy responses had large effects on
aggregate racial disparities.10 In fact, allowing for heterogeneous policy responses by judge
explains the vast majority of disparities observed among low risk defendants.11 This finding
highlights the potential for geographic variation in policy responsiveness to generate seemingly
counterintuitive gaps in treatment for those facing the same recommendation. I discuss a few
theories for why variation in policy response may correlate with defendant demographics;
future work will investigate this empirically.
Even within judge and time, black moderate risk defendants are treated more harshly than
similar white moderate risk defendants after but not before HB463. Judges are 10% more likely
to deviate from the non-financial bond recommendation for moderate black rather than
similar moderate white defendants. (The same is not true for low risk defendants.) This is
suggestive evidence that judges interpret risk score levels differently based on defendant
race.12 In terms of mechanism, if judges want to be more cautious than the policy default,
they may shift away from non-financial bond for moderate risk defendants since they are
more ambiguous than low risk defendants. If judges have some sense of the underlying
continuous risk score distribution and assume that moderate risk black men are still higher
risk than moderate risk white men, this could explain the results. This result suggests
that interaction with the same predictive score may lead to different predictions by race,
which is consistent with the theory of disparate interactions, introduced by Green and
Chen (2019). Further work is required to better pin down this result.
On the whole, this paper demonstrates how interactions between human discretion and
prediction tool recommendations (both across and within decision-makers) can mean
unequal policy effects across racial groups. This work contributes to a slim but growing
literature on risk assessment policies and risk assessment adherence (Sloan, Naufal, and
Caspers 2018; Stevenson 2017; Doleac and Stevenson 2018; Main 2016; Garrett and Mona-
han 2018; DeMichele et al. 2018). Most related to my paper is Stevenson (2017), which also
focuses on HB463. In her thorough investigation, Stevenson uses graphical time-trends to
show that while HB463 had effects on bail setting behavior, the effects on pretrial detention
were minimal in comparison. She also addresses racial disparities and explains that HB463
had no effects on racial disparities in release after 3 days of booking. The object of interest
in my paper differs in two ways. Recall I am interested in whether judges’ initial bond deci-
sions deviated from the non-financial bond recommendation. This approach (1) focuses on
the initial judge decisions themselves rather detention consequences13 and (2) takes into
  10 Stevenson   (2017) hypothesized this mechanism when discussing racial disparities in release within 3
days of booking.
  11 This finding is highly reminiscent of Goncalves and Mello (2017)’s recent work which finds that a large

share of the disparity in treatment of minority drivers by police officers “is due to the fact that minorities
drive in areas where officers are less lenient to all motorists.”
  12 The result is also consistent with Cowgill (2018)‘s findings that black defendants’ outcomes are more

sensitive to risk thresholds.
  13 Detention consequences are a function of the initial (and followup) judge decisions as well as ability to

                                                      4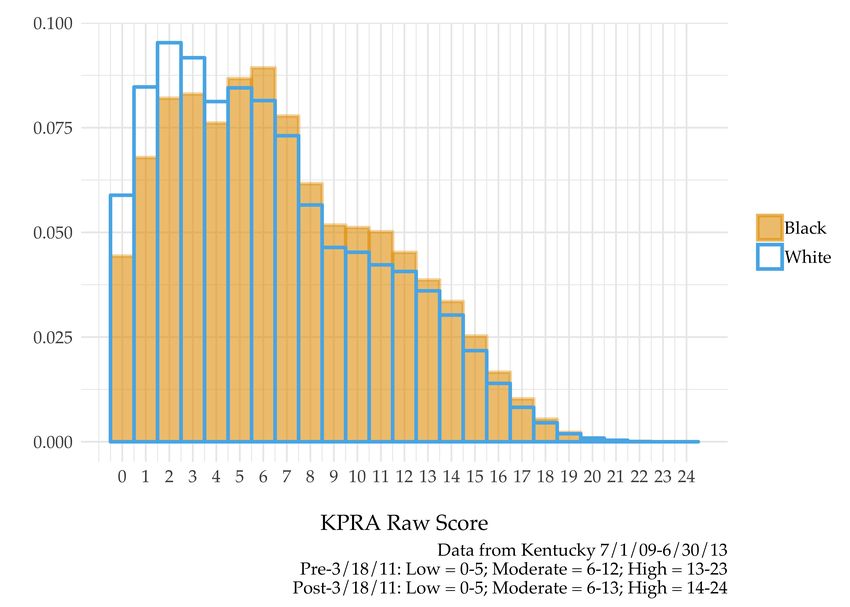
account the associated risk score levels, which allows me to investigate heterogeneity in
responses over risk levels (low, moderate, high). On a methodological level, I use case-level
data to decompose the aggregate increase in non-financial bond racial disparities.
My paper also contributes to the literature on the demographics and judicial decision-
making (Arnold, Dobbie, and Yang 2018; Abrams, Bertrand, and Mullainathan 2012; Cohen
and Yang 2019). A few recent studies even investigate the role of demographics when
it comes to how humans use risk assessments. Green and Chen (2019) uses an Amazon
Mechanical Turk experiment (rather than observational data on judge decisions) to investi-
gate human interactions with risk scores. They find “risk assessments led to higher risk
predictions about black defendants and lower risk predictions about white defendants.”14
Running an experiment with real judges, Skeem, Scurich, and Monahan (2019) finds that
the same risk assessment information produces different judicial decisions based on so-
cioeconomic class of the defendant. Using data from Broward county, Cowgill (2018) find
that outcomes for black defendants are more sensitive to risk score thresholds than are
outcomes for white defendants.15 On the theoretical side, Kleinberg and Mullainathan
(2019) shows that simplified prediction functions (e.g., risk assessments) create incentives
for decision-makers to consider group membership information.
This article generally relates to the role of discretion in decision-making, relevant to
many environments beyond criminal justice. Sarsons (2017) discusses how decision-
makers (physicians) interpret the same signal (a patient outcome) differently based on
demographics (the performing surgeon’s gender). Very similar to my setting, Hoffman,
Kahn, and Li (2017) look at how decision-makers overrule a score-based recommendation;
they focus on managers making hiring decisions in the labor market. Deviation from a
presumptive default is a binary decision of interest for understanding the implications
of providing experts (e.g., managers, judges) with prediction-based recommendations. I
build on Hoffman, Kahn, and Li (2017) by considering the importance of demographics in
those deviations from a recommendation.16
On a broader note, discussions of racial disparities are inherently intertwined with so-
ciological and economics literatures on discrimination. Related papers span intentional
experimental studies (e.g., Pager, Bonikowski, and Western 2009) as well as natural ex-
periments (e.g., Goldin and Rouse 2000). Any context (such as Kentucky judge calls) that
reveals names17 is reminiscent of the well-known Bertrand and Mullainathan (2004) audit
pay. See Appendix A for more on marrying bond decision and detention trends in Kentucky. Note that the
first-stage decision is quick and economically meaningful for predicting immediate release – non-financial
bond corresponds with 95.6% chance of immediate release while financial bond corresponds with a 20.4%
chance of immediate release.
   14 This is conceptually related to the “shifting standards” model outlined by Biernat and Manis (1994).
   15 Cowgill (2018)’s outcome data corresponds to length of jail stay rather than judge decision. Length of

stay is a downstream consequence from the judicial decision-making itself. See Appendix A for more on that
distinction.
   16 They are unable to investigate results by demographics due to data limitations.
   17 Kentucky judges are provided with defendant names, meaning they could infer information about race

regardless of if it is explicitly provided. Race and ethnicity were on judge forms about cases during my
studied time period of interest, meaning they could be explicitly observed when judges used said forms in

                                                     5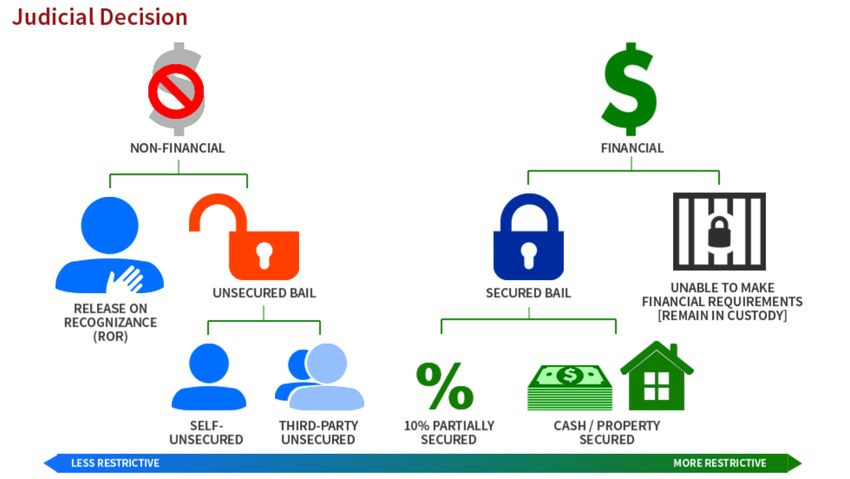
study. Bertrand and Mullainathan (2004) randomly assigned resumes to black or white
names and then observed call back rates, providing evidence that call-back rates were
higher for the hypothetical applicants with white names despite identical credentials. The
recent Bartoš et al. (2013) study provides a possible mechanism for these results; they
provide evidence of “attention discrimination,” meaning a minority-sounding name could
lead possible employers to pay less attention to the candidate as a prospective employee.
Usually, names are used in the discrimination literature as features to be manipulated for
the sake of field experiments, but variation in racial signaling from names can also be used
in observational studies. For instance, Broockman and Soltas (2017) look into how name
variation reveals taste-based discrimination in voting behaviors.
The remainder of the paper proceeds as follows. Section 2 provides a conceptual framework
for understanding how discretion complicates the effects of risk score recommendations.
Section 3 introduces the Kentucky pretrial environment. Section 4 describes the data. Sec-
tion 5 presents the main results by empirically exploring disparities in deviation behavior.
Section 6 discusses mechanisms behind variation in judge responsiveness and the lingering
racial disparity for moderate risk defendants. Section 6 concludes and discusses avenues
for future work.

2     Conceptual Framework

In order to discuss how discretion and predictive tools interact, I consider the salient
example of risk scores in bail decisions that maps onto my empirical environment. In
such contexts, risk scores do not mechanically determine final outcomes. Rather, they
are decision-making aids that are provided to final human decision-makers – judges.18
I describe two types of deviations from risk score recommendations can create larger or
smaller racial disparities than mechanical adherence.
In this set-up, judges can set either financial or non-financial bond. Financial bond is more
restrictive so judges will want to set it for defendants who are more likely to commit pretrial
misconduct.19 Consider a risk score policy that recommends 85% of black defendants
receive non-financial bond and 90% of white defendants receive non-financial bond. (The
risk score policy has been constructed to help increase non-financial bond rates, meaning
before the policy judges set non-financial bond at low rates.) Mechanically, this would
mean a racial disparity (in favor of whites) of 5 percentage points.20 The true observed
disparity will likely be complicated by one or both of the following two types of deviations.
Deviation by Judge: Judges need not respond to policy recommendations identically since
they retain individual discretion. Judges serve different populations of defendants, often
their decision-making. However, these details have since been removed from judge forms.
  18 Note that pretrial decisions can also be made by other criminal justice system actors such as magistrates.
  19 Assume they do not have information about defendants’ abilities to pay.
  20 Whether this is an improvement or exacerbation of the status quo depends on the specific policy context.

For instance, Kleinberg et al. (2017) presents evidence that algorithmic prediction could reduce racial
disparities in New York City pretrial decisions.

                                                      6
based on geography. Assume each judge deviates similarly by race, meaning deviation
from the risk score policy recommendation is independent of race. If variation in response
across judges is uncorrelated with defendant characteristics then the observed racial
disparities should approximate those generated by mechanical adherence. If judges who
respond more (increasing non-financial bond rates) serve a defendant population that is
a relatively higher percentage black, then racial disparities (in favor of whites) will be
smaller than that generated by mechanical adherence. If judges who response more serve
a defendant population that is relatively lower percentage black, the opposite is true.21 In
short, differences in deviations across judges even if they are agnostic to race of the defendant
can affect aggregate racial disparities.
Deviation by Defendant Race: While the above deviation was across judges, the second
sort of deviation is within judges. Judges may interpret risk score recommendations differ-
ently based on defendant race. In a decision-making system with simplified predictive
scores, Kleinberg and Mullainathan (2019) explains there are additional incentives for
decision-makers to consider group traits such as race. If judges believe black defendants
are more risky than white defendants with identical risk scores, this could lead to larger
racial disparities (in favor of whites) than generated by mechanical adherence.22 If the
opposite is true (as judges could, for instance, take into account the increased likelihood of
low level arrests and subsequent convictions for black people23 ), then this could lead to
smaller racial disparities than generated by mechanical adherence.
In theory, these two behavioral deviations (race-invariant deviations across judges or
race-correlated deviations within judge) could go in either direction and thus mean either
larger or smaller racial disparities than those generated by mechanical adherence. In this
paper, I specifically discuss the Kentucky pretrial system and show how both of these two
forces pushed in the direction of larger racial disparities in favor of whites.
3 Empirical Environment
In response to large increases in the incarcerated population between 2000 and 201024 ,
Kentucky House Bill 463 (HB463) went into effect on June 8, 2011. The law made pretrial
risk assessment a mandatory part of bail decision-making and set the default decision for
low or moderate risk defendants to be non-financial bond.25 If judges wanted to defect
from this recommendation, they had to provide a reason.26 As such, HB463 mandated the
21 Thisis related to Goncalves and Mello (2017)’s finding that minorities drive in areas where officers are
less lenient overall.
22 This would be in line with both Skeem, Scurich, and Monahan (2019) and Green and Chen (2019).
23 Risk scores do not currently attempt to take into account possible biases generated by criminal history
data though this has been proposed by AI (2019).
24 According to Stevenson (2017), between “2000 and 2010, Kentucky’s incarcerated population – both jail
and prison – grew by 45%, more than three times the U.S. average.”
25 See bullet 3 in Figure 1.
26 In practice, this could be as simple as saying a few words (e.g. “flight risk”) to the pretrial officer.
7use of risk levels and set a recommended default based on those levels.
3.1 Kentucky Pretrial Overview
Kentucky is well-known for its pretrial services for a few reasons. For one, it was the first
state to ban commercial bail bonds in 1976.27 Kentucky boasts one unified pretrial services
that serves all 120 counties in the state, meaning that data management and collection is
unified and well-organized. Unlike in other states, Kentucky Pretrial Services is part of the
judicial branch; it is a state entity that works for the courts (and is state-funded).28 While
pretrial employees are housed in individual counties, they do not work for the individual
counties.29 Kentucky Pretrial Services even has a virtual tour of their pretrial services
system online for other jurisdictions to use in ongoing bail reform efforts. Kentucky was
also the first jurisdiction to pilot the Public Safety Assessment (PSA) risk assessment.
During 2009-2013 in Kentucky, after defendants were booked into jail, pretrial services
officers in that county conducted risk assessments using the Kentucky Pretrial Risk As-
sessment framework (discussed in the next subsection). Within 24 hours of booking, these
officers presented information about the defendant and incident in bail hearings with a
judge.30 The bail hearing usually takes place via a phone call (see Figure 1) between a
pretrial officer and a judge.31
After receiving information about the defendant and case from the pretrial officer,32 the
judge decides on bond type and amount (if financial) as well as supervision and other
conditions of release. In this paper, I focus on whether that initial bond decision was
non-financial or financial since HB463 specifically suggested judges set non-financial bond
27 It was one of four states with this ban as of 2018.
28 Much of the information in the following paragraphs is from an interview with the Executive Officer of
Kentucky Pretrial Services, Tara Blair.
29 As of January 2019, there were about 251 employees in Pretrial Services in Kentucky. Approximately 202
employees are pretrial officers and/or supervisors and 49 are risk assessment specialists and/or coordinators.
30 Appendix B for more information on judges.
31 This is abnormal in the US as most jurisdictions use in-person bail hearings. If pretrial officers and
judges are in the same place, this could be an in-person meeting instead. The data does not specify whether
initial bond decisions are via judge calls or not, so it is unclear to me how many initial bond decisions I
observe are via phone calls. Kentucky has been using calls for pretrial services since 1976 – this is especially
efficient in areas of the state where people are very spread out and there would be significant time costs for
in-person bail hearings.
32 The eight example judge calls that available online on the Kentucky pretrial website include the following
information: name, age, risk score information, list of charges, and incident description. The incident
description quotes information from the police report. In Kentucky, police have full authority to charge;
there is no prosecutorial review before the judge call. Note that while demographic information on race or
gender can be missing explicitly in the call, these details are implicitly included. Gender is revealed through
usage of pronouns (e.g. “he” and “she”) when the pretrial officer discusses the defendant. Meanwhile,
names (especially in combination with the county) can signal information about race. Moreover, race and
ethnicity were on judge forms about cases during my studied time period of interest, meaning they could be
explicitly observed when judges used said forms in their decision-making. (However, these details have
since been removed from judge forms.)
8Figure 1: Judge Call Information
for low and moderate risk defendants.33 While there are many smaller bail outcomes, the
key overarching decision is whether to set financial conditions or not, as illustrated by
Figure 2.34
3.2 Kentucky Pretrial Risk Assessment
Kentucky has used a few different risk assessment tools over the years. At first, Kentucky
used a six-question tool developed by the Vera Institute.35 In 2006, Kentucky moved to its
own Kentucky Pretrial Risk Assessment (KPRA) tool36 – this is the tool used during my
33 In the data, non-financial and financial bond correspond to a 95.6% or 20.4% chance of initial release
(release on that bond), respectively. If the defendant has not posted bail within 24 hours of the initial decision,
the pretrial officer informs the court and the judge can change the bond to increase the chance that they can
be released pretrial. If the defendant remains detained pretrial, the next time bond could be reconsidered is
usually first appearance (Stevenson 2017).
34 Note that there is no non-refundable piece to bond (as there is in many states), so bond is fully returned
to defendants at the disposition of the case regardless of outcome. All offenses are bailable except capital
offenses in Kentucky, meaning judges can rarely simply detain defendants as they can in Washington DC or
New Jersey (12-15% are denied bail in Washington D.C.) (Santo 2015).
35 Information on the history of risk assessment in Kentucky is via communication with Executive Officer
of Pretrial Tara Blair.
36 The tool was created in-house, fitting a regression model to predict pretrial misconduct using the existing
Kentucky data at the time.
9Figure 2: Bond Types
time period of interest. In June 2013, Kentucky began to use the Public Safety Assessment
(PSA), which was developed by the Laura John Arnold Foundation.37
The KPRA tool was not a complex black-box machine learning tool.38 Rather, it was a
check-list tool that added up points based on Yes/No answers to a series of questions. It
was modified slightly on March 18, 2011. Figure 3 documents the weights that various
components are given in both the 7/1/09-3/17/11 and 3/18/11-6/30/13 version of the
scores (Austin, Ocker, and Bhati 2010).
The factors in the KPRA are mostly criminal history elements (e.g., prior failure to appear,
pending case) but there is also information about the current charge (e.g., whether the
charge is a felony of class A, B, or C) and defendant personal history (e.g., verified local
address, means of support). To calculate a risk score level, the weights shown in Figure 3
are added up and then mapped to a low, moderate, or high score level. Before 3/18/11,
totals of 0-5, 6-12, and 13-23 correspond to low, moderate, and high levels, respectively.
As of 3/18/11, totals of 0-5, 6-13, and 14-24 correspond to low, moderate, and high levels,
respectively. During the time period of interest (around the HB463 policy change), judges
were informed of risk score levels rather than total number of points. Recall the 2011 law
37 The PSA is used exclusively in the pretrial stage of the criminal justice system; its formula is open and
meant to be shared publicly (Schuppe 2017). It was initially developed in 2013 (and altered slightly in 2014)
by investigating 746,525 cases in which defendants had been released pretrial (over 300 jurisdictions) to
determine which defendant characteristics were most predictive of new crime, new violent crime, and failure
to appear pretrial (Laura & John Arnold Foundation 2013). As of late 2018, “over 40 jurisdictions have either
adopted the PSA or is engaged in implementation with LJAF technical assistance” (John Arnold Foundation
2018).
38 The Angwin and Kirchner (2016) article that generated lots of press about risk assessment scores was
about a black-box machine learning tool called COMPAS.
10Figure 3: Weighting Rules for Kentucky Pretrial Risk Assessment
11did not introduce the KPRA levels for the first time; rather, it mandated their consideration
in bail decisions.
4 Data and Descriptive Statistics
I use data from the Kentucky Administrative Office of the Courts (KY AOC) on initial
bond decisions for misdemeanors and felonies.39 I consider all initial bond decisions about
male defendants from July 1, 2009 to June 30, 2013 (the time period that featured the KPRA
tool).40 The final dataset consists of 383,080 initial bond decisions, which cover decisions
for 192,758 distinct defendants by 563 distinct judges.4142
4.1 Charges
An important part of the initial decision is the set of charges brought against a defendant.
Recall that I am focusing on misdemeanors and felonies.43 In terms of charge severity, I
plot the most severe (highest level and charge combination) charge for each initial decision
in Figure 4. This illustrates that 79.5% top-charges are class A or class B misdemeanors,
and 20.5% are class D felonies. Only 8.5% of initial decisions include a top-charge that
is a class A, B, or C felony. In terms of specific charge characteristics, 1.2% of initial
decisions involved weapon-related charges, 4.9% of initial decisions involved violence-
related charges, and 8.3% of initial decisions involved drug-related (excluding alcohol)
charges.44
39 On a technical note, I use R Markdown for my data cleaning and analysis. The R packages I use are:
Wickham, Chang, et al. (2018), Wickham (2018), Hlavac (2015), Dowle and Srinivasan (2018), Firke (2018),
Wickham (2017), and Wickham, François, et al. (2018).
40 Recall that Kentucky switched its risk score system to the PSA on July 1, 2013.
41 I first consider all 1.56 million initial bond decisions for 7/1/09-12/30/17 and then subset to misde-
meanor and felonies (with a known class) within the 7/1/09-6/30/13 time period with known age, gender,
judge, race, risk level, and risk level components – this leads to a sample of 524,229 initial bond decisions.
After subsetting to those decisions about male defendants, I have 383,080 initial bond decisions; this is 73%
of the sample that includes both genders.
42 For more on judge types see Appendix B.
43 Most violation offenses, which are lower level, do not result in a bond hearing. In fact, they are so
rarely associated with a bond hearing that if I don’t mechanically exclude violation and other offenses, they
comprise only 2% of the sample.
44 I define weapon-related charges as those with descriptions including the words “gun”, “firearm”, or
“weapon”. I define violence-related charges as those with descriptions including the words “violence”,
“assault”, “rape”, or “murder”. I define drug-related charges as those with descriptions including the words
“cocaine”, “heroin”, “marijuana”, “drug”, or “meth”, but excluding charges that include “under/infl” since
those are agnostic to alcohol/drugs.
12Figure 4: Top Charges by Level and Class
4.2 Bond Types
Bond comprises conditions for release from jail. While there are a range of possible
conditions, the most salient conditions are monetary. Recall from Figure 2 that the initial
bond decision by the judge can be financial or non-financial. Financial bond means there are
financial conditions that must be met before release; there are no such financial conditions
for non-financial bond. As such, non-financial bonds are less financially restrictive for
defendants. Figure 5 shows the frequency of the specific types of initial bond outcomes.
Bond can be refused only for capital crimes (e.g. murder) for Kentucky, so “no bond” is
observed in only around 3.9% of observations. Bond is financial in 68.3% of the initial
bond hearings and is mostly cash bond.45 In 27.8% of initial bond hearings, the bond type
is non-financial, which is pretty evenly split across release on recognizance, self-unsecured,
and third-party unsecured bonds (“surety”).4647
45 Cash bond means the entire amount of the bail must be posted in cash. A 10% bond means that only
10% of the amount must be posted.
46 Unsecured bond means that the defendant would owe some amount of money if the defendant fails to
appear.
47 This is consistent with Stevenson (2017)’s finding (using Kentucky data from a different time range) that
“[i]f judges followed the recommendations associated with the risk assessment, 90% of defendants would be
granted immediate non-financial release” but “[i]n practice, only 29% are released on non-monetary bond at
the first bail-setting.”
13Figure 5: Bond Outcomes by Group and Type
4.3 Race
I am limiting my discussion to male defendants. In terms of race, defendants are white in
79.1% of these initial bond hearings and black in 20.6% of them.48 For context, the 2017
Kentucky state population was 87.8% white and 8.4% black.4950
Racial composition varies spatially over the state of Kentucky. Figure 6 shows that while
a handful of counties have over 30% black defendants, most counties have less than 5%
black defendants. This variation is due to preexisting spatial racial segregation in the state.
The choropleth in Figure 6 illustrates the variation across the state by coloring counties
based on their percentages of black defendants. Christian, Jefferson, and Fayette counties
are the counties with the highest percentages of black defendants in my data.51 Meanwhile,
most counties in the east are dark purple, meaning their percentages of black defendants
are near zero.
48 Defendants are Asian in 0.24% of initial bond hearings.
49 This is from the Census QuickFacts data.
50 In terms of ethnicity, defendants are recorded as Hispanic in only 2% of these initial bond hearings. In
70% of initial decisions, defendants are recorded as non-Hispanic and in 27.9% of initial decisions, ethnicity
is recorded as unknown. Due to the small sample size, I will not be discussing disparities by ethnicity.
51 For context, the largest cities in Kentucky are Louisville, located in Jefferson county, and Lexington,
located in Fayette county.
14Figure 6: County-Level Fractions of Black Defendants
15Figure 7: Risk Level Density by Race
4.3.1 Risk Scores and Race
Risk assessment score distributions may differ across racial groups. This is the primary
mechanism through which the current literature discusses how risk scores may impact
racial disparities. In Angwin and Kirchner (2016)’s piece about the COMPAS algorithm, the
score distributions by race are strikingly different – white defendants are notably skewed
towards lower-risk categories (1 out of 10, in particular), while black defendants scores are
evenly distributed across the full 1-10 range. Figure 7 compares the risk score densities
for black and white defendants for KPRA risk assessment levels. The distributions are
substantially more similar across races than in the case of COMPAS. However, Figure 7
does show that white defendants are more heavily skewed towards the lower-risk levels,
while black defendants are more heavily skewed towards the higher-risk levels.
The three levels (low, moderate, and high) are what is communicated to judges during the
time period of interest. However, as mentioned before, there are more specific raw scores
calculated for each defendant, which are then converted into these coarse (low, moderate,
high) categories. See Figure 8 for a more detailed comparison of score distributions.52
52 Forthe time period up until 3/17/11, the scores ranged from 0-23. After 3/18/11, the scores ranged
from 0-24.
16Figure 8: Raw Risk Score Density by Race
5 Disparities in Deviations
In this paper, I am focused on how judges respond to risk score recommendations. Specif-
ically, I focus on the decision to set non-financial bond since HB463 made non-financial
bond the presumptive default for low and moderate risk defendants.53 Judges had to give
pretrial officers a reason for defecting from this recommendation, as seen in Figure 1.54
HB463 had a clear and immediate effect. Figure 9 shows the simplified effect of HB463 on
non-financial bond outcomes across all defendants, black and white. The percentage of
male defendants receiving non-financial bond jumped in a clearly discontinuous manner
at the effective date of HB463, increading from a pre-HB463 mean of 22.5% to a post-HB463
mean of 36.5%. However, all defendants did not equally benefit. Following Stevenson
(2017), Figure 10 breaks the picture out by race to show that rates of non-financial bond
jump up discontinuously at the date of policy implementation but white defendants
experience larger gains. Both groups are more likely to receive non-financial bond after
HB463, however, the gap between the two increases from 3 percentage points (in the
pre-period) to around 8.8 percentage points (in the post-period).
53 Appendix A speaks to the realm of financial bond decisions as well as how these combine with non-
financial bond decisions to explain trends in pretrial release on initial bond. That appendix builds on
Stevenson (2017)’s prior findings, marrying non-financial bond findings and pretrial detention trends after
HB463.
54 However, the reason could be as simple as saying “flight risk,” meaning the cost to deviation was not
very high for judges.
17Figure 9: Bond Outcomes Before and After HB463
Figure 10: Bond Outcomes Before and After HB463 by Race
18Figure 11: Bond Outcomes Before and After HB463 by Race and Risk Level
Given that black and white defendants differ in their underlying risk level distributions
(Figure 7 showed black defendants are more likely to be at higher risk levels than white
defendants), this could be a natural consequence of judges’ following the score recom-
mendations (setting non-financial bond for low and moderate defendants) at equal rates
for white and black defendants. In other words, it is possible that the judicial deviations
look the same across racial groups but different risk level distributions cause the disparity
increase visible in Figure 10. To address this possibility, I break the picture out by risk level
in Figure 11. There are differential shifts in non-financial bond rates by race within the low
and moderate risk levels. Therefore, the aggregated picture is not simply a consequence of
black defendants’ higher risk levels – rather, there are racial disparities in deviation from the
recommendation.
The following sections aim to investigate the underlying reasons for the disparities in
deviations, which are of policy importance as researchers and policy-makers evaluate the
growing field of risk score policies across the country.
5.1 Theoretical Framework and Empirical Methodology
Figure 11 demonstrates that the gaps in racial disparities in non-financial bond rates widen
after HB463 for low and moderate risk defendants. While the risk levels themselves cannot
be driving these results, the results could be driven by a myriad of other factors that are
19important to judges in bail decisions.55 To motivate my empirical approach to identifying
why there are these disparities in deviations, I provide a theoretical framework of judge
bail decision-making and illustrate the equivalent empirical specifications.
5.1.1 Homogeneity in Policy Response
Assume judge j makes the binary decision to set non-financial bond (bictj = 1) or not
(bictj = 0) for defendant i with charges c at time t. Since the probability of release without
financial conditions is 95.6%, while probability of release drops meaningfully to 20.4% once
any financial conditions are imposed,56 I assume the judge interprets this binary decision
as equivalent to the decision between releasing or detaining the defendant.57 Following
Arnold, Dobbie, and Yang (2018)’s framework, the judge will set non-financial bond for
the defendant if and only if the expected cost of release is less than benefit. The cost can be
conceptualized as the expected probability of pretrial misconduct, as perceived by judge
j – that is, Ej [ pic ].58 I assume the benefit before HB463 is some fixed threshold ζ.59 After
HB463, there is a small cost to deviating from the presumptive default of non-financial
bond for low and moderate risk defendants, η. By setting non-financial bond for low and
moderate defendants, judges avoid this cost.
Given information about present charges κc , defendant characteristics δi (e.g., age, criminal
history, etc.), defendant risk level KPRAi , and defendant race racei ,60 a judge will set
non-financial bond if and only if:
Ejt [ pic |κc , KPRAi , δi , racei ] < ζ + η × I [t ≥ 6/8/11] × I [KPRAi ∈ { Low, Moderate}]
In this set-up, judges’ unique decision thresholds all move to the same extent after HB463.
That is, there is no variance in policy responsiveness across judges. This maps empirically
onto estimating the following specification (I present results by each of the three KPRAi
risk levels):
bijct = α + φ1 HB463t + φ2 Black i + φ3 ( Black i × HB463t ) + β 1 κc + β 2 δi + ω j + xt + eijct (1)
55 In bail decisions in Kentucky, attorneys are not a part of the equation, so attorney quality is not a concern,
as it would be for evaluating disparities in sentencing.
56 Financial conditions often mean detention due to inability to pay.
57 Other papers often focus on the release outcome rather than the bond decision. Doleac and Stevenson
(2018) looks into release rates over the entire pretrial period while Dobbie, Goldin, and Yang (2018) focus on
whether defendants were released within 3 days.
58 Pretrial misconduct in this discussion contains both probability of new crime and failure to appear.
59 In other words, I do not assume benefit to vary by case. However, it would be natural to extend this
assumption, as Arnold, Dobbie, and Yang (2018) do.
60 Race could be observed indirectly through names in calls or directly through forms or in-person meetings.
20In this framework, bijct is a dummy variable that takes the value 1 if judge j set non-
financial bond for defendant i with charges c during time t. HB463t is an indicator for if
the decision takes place before or after the effective date of HB463. Black i is an indicator
for if the defendant is black, and δi is a vector of defendant characteristics (age, criminal
history variables, including dummies for prior FTAs, prior convictions, and pending cases).
The vector of charge variables κc includes: (i) dummies for all combinations of charge
levels (misdemeanor, felony, violation, other) and charge letter classes and (ii) dummies for
if the charge description is related to drugs, weapons, or violence.6162 Given that judges
are known to be heterogeneous in their decision-rules,63 it is crucial to consider judge
fixed-effects ω j .64 I also include month-year fixed effects xt .
After attempting to approximate for the judge’s information set, the coefficient of interest
is φ3 since this speaks to the change in the racial gap in non-financial bond that occurs
after HB463.65
5.1.2 Heterogeneity in Policy Response
Judges were not regulated in their response to HB463 in Kentucky. As such, it would be
more realistic to assume they varied in their costs of deviation η j . Allowing for variation
in policy responsiveness, the decision rule is subtly changed to the following:
Ejt [ pic |κc , KPRAi , δi , racei ] < ζ + η j × I [t ≥ 6/8/11] × I [KPRAi ∈ { Low, Moderate}]
This then maps onto the following empirical specification:
61 The weapon dummy is 1 when descriptions include the word “gun”, “firearm”, or “weapon”. The
violence dummy is 1 when descriptions include the word “violence”, “assault”, “rape”, or “murder”. The
drug dummy is 1 when descriptions include the word “cocaine”, “heroin”, “marijuana”, “drug”, or “meth”,
but excluding charges that include “under/infl” since those are agnostic to alcohol/drugs.
62 The reason for including these charge description dummies is that gun, violence, or drug-related offenses
could be treated differently even if they share an offense level and class with a property crime offense.
Without these variables, differences in charge specifics within charge severity bins by race for low risk
defendants could drive observed disparities even after controlling for charge level and class.
63 Thus the ability of researchers to exploit such variation with “judge designs” for causal inference.
64 Moreover, recall the spatial variation in black defendants observed in Figure 6. Without fixed effects, I
might be concerned that if judges in more populous counties, such as Christian and Fayette, are both harsher
to everyone and working in counties where most black defendants are booked, then estimates of racial
disparities will be biased upwards. For that reason, it is important to adjust for judge fixed-effects so that I
compare bail decisions within given judges since I do not want differences that are stable within judges to
drive results.
65 In focusing on the interaction between race and time (HB463 ), the analysis relies on the assumption that
t
any differences in important variables to the initial bond decision before and after HB463 are not statistically
different by defendant race. (I.e., case characteristics before and after HB463 are not unbalanced by race.)
My approach does not require that there are no differences in important variables by race across all time;
this is similar to the assumptions required by Cohen and Yang (2018). While it seems unlikely that case
characteristics discontinuously changed by race at the point of HB463, I should still prove this is the case
empirically in future drafts.
21bijct = α + φ1 HB463t + φ2 Black i + φ3 ( Black i × HB463t ) + β 1 κc + β 2 δi + ω jt + eijct (2)
The single difference between equations 1 and 2 is that the latter includes time-varying
(defined as month-year) judge fixed-effects, ω jt . The comparison between the estimates of
φ3 in the two equations highlights the power of heterogeneous responses across judges to
HB463 in driving changes in racial disparities.66 Judge-specific responses are important to
consider given the notable spatial variation in percentage of black defendants across the
state. In other words, if judge responses are correlated with judge populations (fraction
of black defendants), this could drive φ3 in Equation 1 to be notably higher than φ3 in
Equation 2.
5.2 Empirical Results
I now estimate the specifications discussed above in order to see how much of φ3 observed
in raw Figure 11 is explained by differences in (i) judge information sets, (ii) variation
in policy response across judges. Table 1 presents estimates for low risk defendants in
columns 1 and 2, moderate risk defendants in columns 3 and 4, and high risk defendants
in columns 5 and 6. The odd columns present results without any covariates, thus showing
the regression equivalent of the visual trends in Figure 11. The even columns present
results from specification 1.
Table 1 shows that after adjusting for judge information sets,67 there are not observable
racial disparities favoring white defendants in the pre-HB463 period. (The negative
coefficient in the low specification in column (1) disappears once conditioning on the
information set.) If anything, as seen in column 4, moderate risk black defendants are
more likely (2.2 percentage points more) to receive non-financial bond than similar white
defendants. However, in the post-period white defendants appear to be significantly
advantaged after adjusting for the judge’s information set. Low and moderate risk black
defendants experienced 30% and 62% less of the short-term gains in non-financial bond
setting than similar white defendants, respectively.68
Different responses by judge are important to consider given that judges work within
specific counties and there is notable spatial variation in percentage of black defendants
across the state (see Figure 6). With Table 2, I test for whether the results on φ3 from Table 1
66 Given Stevenson (2017)’s hypothesis of differential judge behavioral response, this is important to further
investigate.
67 Specifically, in line with the prior subsection, I approximate judge information sets with the following
covariates: defendant age, number of charges, top charge severity (level and class), characteristics (whether
it is related to weapons, drugs, or violence), risk level components (see Figure 3 for full list), and separate
fixed effects for judge and month-year.
68 For low risk defendants, in column 2, the Black × Post coefficient is 4.8 percentage points and the Post
coefficient is 15 percentage points. (4.8/15 ≈ .30.) For moderate risk defendants, in column 4, the Black × Post
coefficient is 4.9 percentage points and the Post coefficient is 7.9 percentage points. (4.9/7.9 ≈ .62.)
22Table 1: Disparities in Non-Financial Bond Deviations before/after HB463
Dependent Variable = Non-Financial Bond
Low Moderate High
(1) (2) (3) (4) (5) (6)
Black −0.022∗∗∗ 0.004 0.007∗∗ 0.022∗∗∗ 0.002 0.005
(0.004) (0.006) (0.003) (0.005) (0.004) (0.005)
Post 0.201∗∗∗ 0.150∗∗∗ 0.138∗∗∗ 0.079∗∗∗ 0.021∗∗∗ 0.039∗
(0.003) (0.020) (0.002) (0.020) (0.003) (0.020)
Black x Post −0.065∗∗∗ −0.048∗∗∗ −0.051∗∗∗ −0.049∗∗∗ −0.004 −0.007
(0.006) (0.011) (0.005) (0.008) (0.005) (0.007)
Covariates? No Yes No Yes No Yes
Pre-White Mean 0.326 0.326 0.128 0.128 0.050 0.050
Cluster SE? NA Judge NA Judge NA Judge
N 178,238 178,238 163,479 163,479 41,363 41,363
R2 0.039 0.220 0.027 0.144 0.002 0.068
Adjusted R2 0.039 0.217 0.027 0.141 0.002 0.058
OLS estimates. *** pTable 2: Disparities in Non-Financial Bond Deviations before/after HB463
Dependent Variable = Non-Financial Bond
Low Moderate High
(1) (2) (3) (4) (5) (6) (7) (8) (9)
Black −0.022∗∗∗ 0.004 −0.011∗∗ 0.007∗∗ 0.022∗∗∗ 0.006∗ 0.002 0.005 0.006
(0.004) (0.006) (0.005) (0.003) (0.005) (0.003) (0.004) (0.005) (0.005)
Post 0.201∗∗∗ 0.150∗∗∗ 0.145∗∗∗ 0.138∗∗∗ 0.079∗∗∗ 0.081∗∗∗ 0.021∗∗∗ 0.039∗ 0.042
(0.003) (0.020) (0.021) (0.002) (0.020) (0.025) (0.003) (0.020) (0.027)
Black x Post −0.065∗∗∗ −0.048∗∗∗ −0.012 −0.051∗∗∗ −0.049∗∗∗ −0.020∗∗∗ −0.004 −0.007 −0.007
(0.006) (0.011) (0.008) (0.005) (0.008) (0.006) (0.005) (0.007) (0.007)
Covariates? No Yes Yes No Yes Yes No Yes Yes
Judge-Time FEs? No No Yes No No Yes No No Yes
Pre-White Mean 0.326 0.326 0.326 0.128 0.128 0.128 0.050 0.050 0.050
Cluster SE? NA Judge Judge NA Judge Judge NA Judge Judge
N 178,238 178,238 178,238 163,479 163,479 163,479 41,363 41,363 41,363
R2 0.039 0.220 0.294 0.027 0.144 0.231 0.002 0.068 0.299
Adjusted R2 0.039 0.217 0.242 0.027 0.141 0.166 0.002 0.058 0.091
OLS estimates. *** pFigure 12: Judge Non-Financial Bond Rates Before and After HB463
(fraction of decisions made about black defendants). The purple line displays a clear
negative relationship between the two.
6.1.2 Explaining Why Judge Responsiveness Correlates with Defendant Population
While there is a large body of empirical work examining differential treatment within place-
time, there is limited work on explaining why policy response might be correlated with
population demographics. Given the growing set of bail reform policies, it is important to
understand why and how uneven take-up of policies occurs.
There are two main hypotheses for why judges may respond differently to policy reforms.
For one, judges with more experience might be less likely to respond to policy changes.
If judges who work in counties with higher fraction of black counties are more experi-
enced (perhaps because these are larger counties and thus more competitive elections for
judgeships) this could generate the observed relationship.72 Second, we suspect judges
who have made decisions that are associated with higher pretrial misconduct than others
would respond less since they face a higher expected cost of release in changing their
threshold. If judges who experience higher failure to appear or new criminal activity in
their bail decisions work in the counties with more black defendants, this could generate
the observed effect.
72 The experience explanation would tie into a model with different costs across judges η j where costs are
larger for more experienced judges.
25You can also read