Risk-Intolerant but Risk-Taking-Towards a Better Understanding of Inconsistent Survey Responses of the Euro Area Households - MDPI
←
→
Page content transcription
If your browser does not render page correctly, please read the page content below
sustainability
Article
Risk-Intolerant but Risk-Taking—Towards a Better
Understanding of Inconsistent Survey Responses of
the Euro Area Households
Katarzyna Kochaniak 1, * and Paweł Ulman 2
1 Department of Finance and Financial Policy, Cracow University of Economics, 31-510 Cracow, Poland
2 Department of Statistics, Cracow University of Economics, 31-510 Cracow, Poland;
pawel.ulman@uek.krakow.pl
* Correspondence: katarzyna.kochaniak@uek.krakow.pl
Received: 30 June 2020; Accepted: 16 August 2020; Published: 25 August 2020
Abstract: The sustainable development of the EU internal market for retail financial services is
based on the rules of ‘suitability’, ‘know your client’, and ‘know your product’. The rules ensure
that financial institutions (including banks) offer retail clients only products and services that are
adequate to their purposes and preferences, including risk tolerance. Our study, however, concerns
households for which the above rules are not valid, since they declare risk aversion and possess risky
assets. According to the European Union Markets in Financial Instruments Directive and Regulation
(MiFID II and MiFIR), the inconsistent information they provide within survey questions should
classify them to more compound suitability assessment procedures. In the study, we use nationally
representative data for 16 euro area countries from the second wave of the Eurosystem Household
Finance and Consumption Survey. Using logit regression, we identify sets of socio-demographic and
socio-economic characteristics conducive to the possession of risky assets by risk-averse households
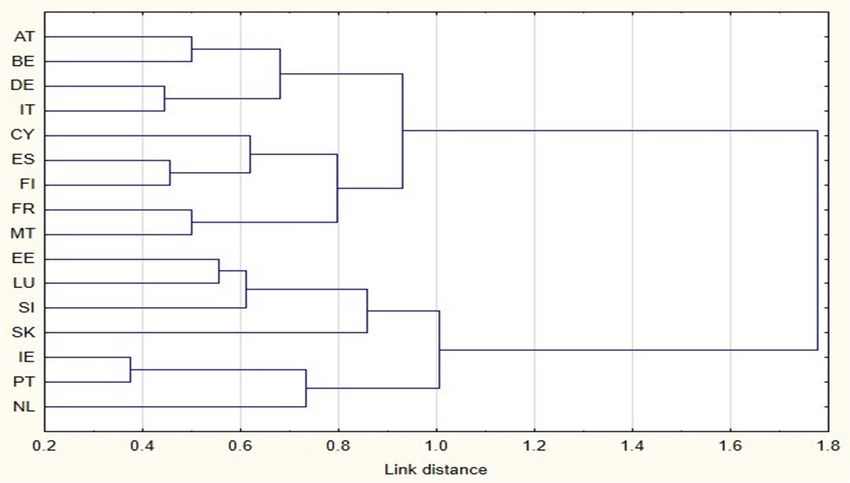
in individual countries. To assess their similarity, we use the hierarchical taxonomic method with
Ward’s formula. The results of the study showed that risky assets were primarily possessed by
risk-averse households that were characterised by high income, including from self-employment,
and reference persons having a university degree and at least 55 years of age. The significance of
their other characteristics was mainly shaped at the national level. The clear similarity of sets of the
characteristics was confirmed only for a few pairs of countries. The information inconsistency that
may result from erroneous self-assessments of being risk-averse was recognised in all countries and
most often concerned high-income households with reference persons being males with a university
degree. In 11 countries, the reason for this inconsistency could also be the inadequacy of assets held,
also among senior households. The results provide insights for practitioners and policy. Identification
of households providing inconsistent information to financial institutions, with the recognition of
its reasons based on easily verifiable characteristics, may prove helpful in suitability assessments.
The results confirming the similarity of household profiles requiring special attention between
countries may be useful for entities operating cross-border. Due to the collection of information
on risk aversion based on the single question self-classification method, conclusions regarding the
restrictions of its use should also be considered relevant. In turn, policy implications may relate
to consumer protection, since significant fractions of risk-averse households indeed participate in
risky assets. Moreover, in selected countries, the risk-averse senior households were recognised as
susceptible to making wrong investment decisions.
Keywords: risk tolerance; risk aversion; risk-taking; MiFID II; MiFIR; suitability assessment;
households; risky financial assets; financial institutions; financial advisory; portfolio management
Sustainability 2020, 12, 6912; doi:10.3390/su12176912 www.mdpi.com/journal/sustainabilitySustainability 2020, 12, 6912 2 of 26
1. Introduction
Risk tolerance influences a wide range of households’ financial decisions. Its significance for
portfolio choices has been emphasised in Article 25 of Directive 2014/65/EU (MiFID II) and Articles
54 and 55 of Commission Delegated Regulation 2017/565 (MiFIR), which promote the ‘suitability’,
‘know your client’ and ‘know your product’ rules within the EU [1,2]. The rules emphasise the need
for an in-depth assessment of retail clients’ risk tolerance and ensure that they are provided only with
products meeting their investment objectives and preferences. Risk tolerance and portfolio choices
are the focus of interest of practitioners and researchers. In financial institutions, including personal
advisory and portfolio management entities, they relate to individual cases [3–5], while in research
studies they relate to entire populations [6,7] or specified subsets of individuals or households [8,9].
In all cases, information about self-assessed risk attitudes and asset participation is often collected
within survey instruments, which are expected to provide up-to-date, accurate, and complete data.
Aiming at the uniform and consistent application of the MiFID II in the EU member countries,
the European Securities and Markets Authority (ESMA) draws attention to the limited reliability of
information derived from survey questions and the need for its re-examination [10]. It recognises
the constraints of self-assessed risk tolerance, if not counterbalanced by objective criteria, as well as
questions in batteries regarding portfolio components. Moreover, the ESMA signalises the inconsistency
of survey information provided by particular types of respondents, e.g., those who are unwilling to
take any risk but have ambitious investment objectives. This may occur if a self-assessed risk attitude
is untrue or asset selection incorrect due to the respondent’s narrowed understanding of characteristics
and risks related to financial products and a shortage of investment experience. According to the
ESMA guidelines, knowledge of the socio-economic and socio-demographic features of retail clients,
such as, for instance, their marital status, family situation, age, employment situation, or liquidity
needs may help recognise information inconsistency under the suitability assessment.
A single question self-classification is one of the methods of estimating individuals’ and households’
risk attitudes. It is based on the following question with four possible answer variants: ‘Which of
the following statements comes closest to describing the amount of financial risk that you (and your
husband/wife/partner) are willing to take when you save or make investments?
1. Take substantial financial risks expecting to earn substantial returns,
2. Take above average financial risks expecting to earn above average returns,
3. Take average financial risks expecting to earn average returns,
4. Not willing to take any financial risk.
The question has been widely applied in nationally representative surveys, which allow concluding
about general or particular subjective risk attitudes within a specific population, with outcomes
discussed in the literature related to consumer finance. This method has been used by both researchers
and practitioners [11–17].
Our study is devoted to particular households residing in 16 euro area countries that assess
themselves as unwilling to take any risk (risk-averse) but hold risky financial assets in their portfolios.
The inconsistent information they provide within survey questions should classify them to more
compound suitability assessment procedures under MiFID II and MiFIR. Our study aims to profile these
households according to their socio-demographics and socio-economics, i.e., to describe the primary
providers of information for the purposes of re-examination in individual countries. The problem we
analyse can be referred as to a gap between a subjective and objective risk attitude of a household, since
the response to the single question is based on self-assessment, and risky asset participation discloses
existing risk exposure [12,18–20]. We are particularly interested in recognising the possible causes
of the information inaccuracy, which can be declaring untrue risk aversion or holding inadequate
financial assets, as well as in the profiles of households to which they can be assigned. As the single
question self-classification was commonly used, this study also aims to recognise its limitations when
applied to specified types of respondents. The paper seeks to answer the following research questions:Sustainability 2020, 12, 6912 3 of 26
• Due to the focus of our study on a specified subgroup of households declaring risk aversion, first,
a question should be asked about which socio-demographics and socio-economics determine the
likelihood of declaring risk aversion by households in the euro area countries?
• Regarding the discussed information inconsistency, which of the socio-demographics and
socio-economics determine the likelihood of possession of risky financial assets by households
that declare risk aversion? In other words, which household characteristics can be considered as
favouring the occurrence of the considered inconsistency of information in the countries analysed?
• Due to the adoption of the common regulatory frames and guidelines related to MiFID II and
MiFIR, to what extent are the profiles of households affected by the information inconsistency
similar among the euro area countries?
• Since there are two possible causes for information inconsistency, can we conclude at the country
level for which households the incorrect self-assessment of risk aversion is the most probable
cause, and for whom it is the participation in inadequate (risky) assets?
• The single question self-classification is a simplified method of estimating households’ risk
attitudes. Regarding this, for which households may the usefulness of this method be limited?
The discussed information inconsistency can be identified in most of the euro area countries.
According to the second wave data of the Eurosystem Household Finance and Consumption Survey
(HFCS), in domestic populations, up to 35% of households which declare unwillingness to take any
financial risk hold risky financial assets.
Our study extends the existing research line of inquiry regarding risk tolerance and risk behaviour,
particularly their incoherence, including its causes and consequences. In contrast to previous studies
which examine the gap between the subjective risk tolerance and objective risk tolerance within their
whole ranges, we focus solely on the risk-averse households holding risky financial assets in portfolios,
for which the consequences of the aforementioned gap might be the most severe. It should be noted
that current knowledge about the causes and consequences of the gap is modest. The same can be
concluded about the socio-demographic and socio-economic profiles of households which undervalue
their own risk tolerance and overexpose to financial risk. Moreover, few studies relate to the EU
populations, but if they do so, they rely on data for specific groups of retail investors, like the clients
of selected financial institutions [12,18]. The data we use are nationally representative, thus giving
an insight into the euro area populations, and allowing to draw conclusions about their similarities
and dissimilarities regarding the issues analysed. Such an approach is currently desired due to the
re-regulation of the markets for retail financial services, not only in the EU but globally.
The results of our study have implications for practice and policy. The knowledge about
households which provide inconsistent information and should be treated with utmost caution may aid
professionals to remain compliant with MiFID II and MiFIR. Since the new regulatory environment has
been implemented, they are obliged to recognise the constraints of retail clients prior to offering them
financial products and services. Our findings seem to be useful for entities operating internationally
since we identify the countries regarding which a suitability assessment can be based on similar
procedures. The policy implications refer to the issues of consumer protection as a significant part of
households are self-reliant, i.e., they make financial decisions on their own and are excluded from the
suitability assessment [21]. The prevalence of such households which are overexposed to financial risk
(risk-averse but prone to making wrong choices) may lead to social problems under financial market
stress. Thus, it is essential to know if the self-classification approach offers, in fact, an accurate gauge
of risk-taking propensities that helps in decision making.
The remainder of the paper is organised as follows: Section 2 contains an overview of the theory
and literature related to households’ financial risk tolerance and behaviour. Section 3 presents the
methodology. Section 4 describes the HFCS data applied in the study. Section 5 contains the results of
empirical analysis and discussion. Section 6 contains conclusions.Sustainability 2020, 12, 6912 4 of 26
2. Theoretical Background and Literature Review
2.1. Theory
Financial risk tolerance can be defined as the maximum amount of uncertainty that someone
is willing to accept when making a financial decision [22] or the willingness to engage in a financial
behavior in which the outcomes are uncertain with a possible identifiable loss [23]. It is the inverse
of an economic term of risk aversion derived from household preferences [24–26]. Risk aversion
refers to a hesitancy to accept a choice that has an uncertain payoff when an alternative choice with a
more certain outcome is available [26]. The concept of risk aversion was developed by Pratt [27] and
Arrow [28] with the use of normative models of rational choice describing how people ought to make
decisions under uncertainty.
The first economic theory which we should recall is the expected utility theory which relates
to links between risk aversion and risk behaviour. It assumes in its basic form that consumers are
rational, and their risk preferences remain constant under uncertainty [29]. For this reason, consumers
are expected to make the same choices regardless of the situation or event which has occurred [30,31].
Optimal behaviour under uncertainty is possible only under the assumption that risk-averse individuals
should maximise expected utility, which is a function of outcomes related to the wealth or income
levels [32]. Pratt [27] and Arrow [28], providing the measures of risk aversion with the coefficients of
absolute and relative risk aversion. The first one can be used for global comparisons of risk aversion,
e.g., among individuals, with the assumption that a person with higher absolute risk aversion for every
prospect may be assessed as more risk-averse. This measure may also be considered as local under
the assumption that an individual with a higher absolute risk aversion will always have a higher risk
premium for small bets. A relative risk aversion is, in some sense, independent of wealth levels, since
the coefficient measures the willingness to accept bets being a proportion of the current wealth [32].
The expected utility theory was extended within the modern portfolio theory [33], which relates
to the optimality of portfolios consisted solely of risky assets. This approach of mean-variance assumes
that risk-averse investors with diversified portfolios maximise their satisfaction (referred to as utility)
by maximising their portfolios’ returns for a given risk level. Thus, they should take the additional risk
only if returns associated with the risk are high. With the increasing significance of liquidity needs,
theorists began to draw attention to portfolios consisting of both risky and risk-free assets. Tobin [34]
identified an investor’s risk attitude as a determinant of the optimal portfolio choice from the set
of efficient portfolios consisting of both asset categories. Thus, self-assessed risk attitudes became
essential for proper allocational decisions between risk-free and risky assets. In this approach, greater
risk tolerance results in the choice of higher volatility, which is compensated for by a higher expected
return [35]. This paradigm can be, in some sense, visible in MiFID II and MiFIR, as the recognition of
clients’ risk attitudes conditions further financial asset recommendations.
However, as an increasing number of studies were signalling the incompatibility between what
consumers should do and what they actually do, the rationality of investors’ choices was being questioned,
as well as the ability of normative models to explain actual investment choices [29,36–43].
The new approach to risk attitudes was enhanced with behavioural finance and psychosocial
aspects. The descriptive prospect theory incorporated risk-seeking in the domain of losses in the
analyses. According to Kahneman and Tversky [41], the carriers of value or utility were changes of
wealth, rather than final asset positions that included current wealth. Within this theory, the utility
function was defined over gains and losses separately, and a probability weighting function converted
the underlying probabilities of the lottery into subjective probabilities [44]. The significance of perceptions
and judgments for decision making became expressed in the assumption of the dependence of a person’s
risk tolerance on how a situation or event is framed. Della Vigna [45] found that consumers demonstrate
risk aversion when they are asked to make a choice in which the outcome is framed as a gain,
and risk-seeking when the choice is framed as a loss. More orientation toward behavioural finance,
psychology and sociology can be recognised in theory assuming the significance of feelings triggeredSustainability 2020, 12, 6912 5 of 26
by the situation and risky choice for the decision-making process. In Loewenstein, Weber, Hsee and
Welch’s risk-as-feelings hypothesis, emotional reactions to risky situations often differ from reasoned
assessments and directly influence investment behavior [46,47].
As we have presented, knowledge about the links between financial risk tolerance and financial
risk behaviour has a broad theoretical framework, related not only to the economy and finance, bus also
psychology and sociology. Regarding our study, the significance of prospect theory with its subjective
input may be recognised, however, only when considered jointly with a sociological theory of family
development. The similarity of the concepts of a household and a family should be noted here [48].
Two aspects of the theory of family development make the prospect theory useful for understanding how
the family (household) and demographic variables affect risk tolerance. The first aspect is the assumption
that all choices are considered in relation to one’s accumulated wealth position, with wealth increasing
risk tolerance. The other is the premise of the variation of losses and gains and the perception of losses
to be more important than gains in individual decision-making regarding risk-taking behaviour. Both
theories relate to the probabilities of events which are useful for explaining individuals’ propensity for
financial risk. The theory of family development does it through the adoption of socio-demographics
and socio-economics for the purposes of family profiling [49]. It recognises the changes in role
expectations in the family over time which are a function of changes in a family membership, individual
developmental needs, and direct societal expectations [49]. According to this theory, families form their
expectations and behaviours on the basis of their stage requirements confirmed in their characteristics.
Moreover, family stages have stochastic qualities that introduce life uncertainties that may influence
current and future behaviour and decisions [50]. Features like gender, age, marital status, having
dependents, and income level may thus alter the context for assessing potential gains and losses in an
investment situation. The measures of subjective and objective risk tolerance we apply in the study
can also be referred to the theory; however, to a limited extent. The single question self-classification
has its roots in the economic theory, but households’ perceptions of own risk attitude may remain
under the influence of the current situation or insufficient information [30]. The same dependence may
occur regarding the measure of financial risk behaviour, which in our study is a simplified behavioural
measure and refers to the occurrence of risky assets in portfolios [51].
2.2. Literature
We based our research on existing literature related to both subjective financial risk tolerance and
financial risk behaviour. Regarding the aim of the study, particularly essential for us were findings
related to:
• risk tolerance measures, including their limitations, if applied in research studies,
• the role of socio-demographics and socio-economics for the formation of households’ perceptions
and behaviours related to the financial products and services,
• inconsistencies between the subjective and objective risk tolerance, and household characteristics
that determine their occurrence.
Risk tolerance estimations may be based on respondents’ self-assessments of risk attitudes
(subjective measure) or investment behaviours reflected in portfolio composition (objective measure).
The reliability of risk tolerance measures depends on how free they are from measurement error and
consistent from one use to another [16,52]. Regarding the single question, opinions are ambiguous.
Grable and Lytton [16] indicate its limitation resulting from incomplete coverage of the spectrum
of financial risk tolerance. Despite it, they find this method closely linked to investment choices and
sufficient in explanatory studies, as long as researchers are aware of its limitation. Kimbal, Sahm and
Shapiro [53] emphasise the problem of subjective wording of the single question, like ‘substantial’, ‘above
average’, and ‘average’, which may be differently interpreted by respondents. Schooley and Worden [17]
recognise the additional weakness, which is the lack of possible declaration of ‘the willingness
to take less-than-average financial risk’, which, in their opinion, makes respondents choose riskSustainability 2020, 12, 6912 6 of 26
aversion. Grable and Schumm [54] describe the reasons for the popularity of the single question among
researchers, such as a common belief in its high degree of face validity and similar reliability to longer
risk scales, lack of alternative risk-tolerance questions in national surveys, or only a few alternatives to
national finance databases. Regarding objective measures, their advantage is intrinsic validity, as the
risk attitudes are evidenced in the natural environment [55]. Still, their weak side is limited control
over contextual variables, such as liquidity needs, financial constraints, or market expectations, which
influence behaviour beyond risk tolerance [56]. Moreover, Hanna, Gutter, and Fan [30] indicate an
obvious limitation of the assessment of risk tolerance based on portfolio composition, which is the fact
that not all households hold financial assets.
Vast studies are dedicated to socio-demographics and socio-economics determining financial risk
tolerance in both approaches. These characteristics stand out from others, like latent psychological and
behavioural biases, by their availability in nationally representative databases, and easy recognisability
and verifiability at household level. The age of a respondent is one of the commonly recognised
socio-demographic determinants. Generally, risk tolerance is concluded to decrease with age, but
this relationship may not be linear [7,57–59]. Younger investors are more tolerant, since they have
time to recover from losses. Yao, Sharpe, and Wang [6] and Bakshi and Chen [60] find risk tolerance
declining along with the investment horizon, leading to shifting wealth holdings toward less risky
assets. Opposed to general findings, Grable [61] concludes that there is a positive relationship between
the age and risk tolerance of investors. Several studies recognise the inconsistencies between age
and risk tolerance, and age and actual risk-taking. Finke and Huston [62] and Chang, DeVaney and
Chiremba [15] find that older investors declare lower risk tolerance but tend to invest more aggressively
than the young ones. Gender differences are also well documented in the literature and lead to an
assumption that males are more risk-tolerant and take more risks than females do [15,25,61,63–65].
However, Roszkowski and Grable [16] argue that women may underestimate their risk tolerance, while
men tend to overestimate it. Despite these findings, Bucciol and Miniaci [7] do not identify gender
as a significant characteristic. Investors’ level of education is recognised as a determinant positively
influencing respondents’ self-assessed risk tolerance and risk-taking, since more formal education
makes it easier to assess the risk-return trade-offs [15,61,66]. Wealth and income are two related factors
that are hypothesised to positively influence risk tolerance [7,15,22,61,67–69]. Regarding wealth,
its significance indeed may not be so evident. On the one hand, wealthy individuals may afford to
incur losses on risky investments, and their accumulated wealth may reflect high risk tolerance. On the
other hand, however, the impoverished may perceive risky investments as a lottery and be more
willing to bear the risk associated with a given payoff. Vissing-Jorgensen [70] argues that wealthy
households own more risky assets because they can overcome market requirements, such as entry
costs (advising fees) and a minimum value of an investment. Similar conclusions refer to income
levels [70,71]. It should be noted that the status on the labour market matters for the risk tolerance as well.
The self-employed distinguish themselves by higher declared risk tolerance [72] and greater risky asset
allocation [73]. However, private business risk may crowd out participation in risky financial assets [74].
Many studies discuss the significance of the marital status of an investor; however, it should be noted
that the estimated risk tolerance of a couple may reflect combined preferences [9]. Previous results find
singles generally more risk-tolerant than married people [69,75], but select studies identify an opposite
effect [61] or do not identify significant differences at all [68]. The results of a study by Jianakoplos
and Bernasek [65] extend the above and find that single women are less risk-tolerant than single men.
Less attention is paid to the household size, measured by the number of adult members and dependent
children. Large households are found to be more conservative in their risk attitudes, since their size
negatively influences the wealth per capita and positively the committed expenditure-to-wealth ratio.
Furthermore, they are more exposed to the risk of the random needs of family members [74,76]. Credit
constraints may also influence households’ portfolio choices, not favouring the possession of risky
assets [77,78].Sustainability 2020, 12, 6912 7 of 26
The existing literature also discusses the relationship between subjective and objective financial
risk tolerance; however, relatively little attention is paid to the EU populations in this regard. In most
studies, this issue is examined in a similar manner, by adopting a model with an objective (subjective)
risk tolerance measure as the dependent variable and a set of independent variables consisting of a
subjective (objective) risk tolerance measure and at least one socio-demographic or socio-economic
feature. It should be emphasised that still little is known about the factors commonly favouring
the inconsistency of subjective and objective risk tolerance. Some researchers, like Chang, DeVaney,
and Chiremba [15], Finke and Huston [62], and Schooley and Worden [17], agree that people who declare
a willingness to take financial risk are more involved in risky assets than those who are risk-averse.
Hallahan, Faff, and McKenzie [69] analyse the gap in a more sophisticated way. They explain the
relations between investors’ subjective and objective risk tolerance in conjunction with their portfolio
choices. However, they define objective risk tolerance as a feature based on responses to detailed
questions. They find it broadly consistent with the subjective (self-declared) risk tolerance within
the single question. The results also allow to draw conclusions about the rationality of individuals’
investment choices due to their compliance with both risk attitudes. The consistency of subjective risk
tolerance and risk-taking is also examined by Gutter, Fox, and Montalto [79], who recognise it among
66% of households. However, select studies confirm an evident gap between what respondents say
about their risk tolerance and what they have in portfolios. A study by Jianakoplos [80] recognises a
significant fraction of respondents who self-assess as less risk-tolerant but hold considerable portions
of risky assets. Even larger incoherence is presented in the study of Kannadhasan [81], described
by the regression coefficient at the level of 0.107. The heterogeneity of results obtained so far for
different countries encouraged us to conduct the study for an almost entire euro area. Although
the countries we consider became similar due to their membership in the EU and adoption of the
single currency, they still remain different in many dimensions, including cultural, institutional,
structural, and macroeconomic, which affect not only households’ wealth, but also their perceptions
and behaviours.
Despite the noticeable discussion about the discrepancies between the declared risk tolerance
and portfolio composition, little is known about their causes—whether they result from wrong
self-assessments or unsuitable asset holdings. Both reasons should be taken into account since, as we
explained earlier, the measures of subjective and objective risk tolerance have specific shortcomings.
Based on data concerning German consumers, Ehm, Kaufmann, and Weber [18] find the phenomenon
of enlarged commitment in risky assets of less risk-tolerant individuals, caused by inadequate portfolio
choices rather than an inability to assess own risk attitude. In turn, the findings of Martin [19] for
the US population and Moreschi [20] for clients of select financial institutions lead to conclusions
about individuals’ inability to assess risk attitude being a primary reason. Marinelli, Mazzoli and
Palmucci [12] recognise two types of gaps on the basis of data for the clients of an Italian bank, i.e.,
arising from wrong self-assessments (related to over- and undervaluation) and incoherent portfolio
composition (related to over- and underexposure to risk). However, this is the only research we have
found which provides the results referred to socio-demographics and socio-economics of individuals
affected by the gap resulting from a particular cause. Marinelli, Mazzoli and Palmucci [12] recognise
male investors, homeowners, and heavy savers as being characterised by a lower self-assessment gap,
in contrast to married people. On the other hand, wealthy individuals with a shorter investment
horizon and less debt show a smaller portfolio composition gap. Generally, people who display
cautious economic behaviour, such as homeowners, savers, and those not indebted, are recognised as
more consistent in their financial risk-tolerance expressions.
3. Methodology
In the study, we applied a logit regression model. In general, regression modelling allows to
determine what factors, and in what way, influence the studied phenomenon expressed as numbers in
a dependent variable. If this variable is the so-called ‘latent’ variable, but ultimately expressed in aSustainability 2020, 12, 6912 8 of 26
dichotomous way (dummy), then probability models including the logit model are suitable regression
models [82]. Therefore, using various household characteristics, we modelled specific ‘propensities’
of households considered to be important for the purposes of the study. This model can take the
following form:
Pi Xk
log = β0 + β j xij , (1)
1 − Pi j=1
where Pi = P( yi = 1), and xij represents the value of the j-th independent variable for the i-th household.
The study was conducted for each of the countries in three stages. Since it concerns households
self-assessed as risk-averse, the first stage covered all surveyed households and provided an answer to
the following question: which socio-demographics and socio-economics determine the likelihood of declaring
risk aversion by households in the euro area countries? We used the model (1) with the dichotomous
dependent variable R_averse. We assigned the value of 1 to households declaring aversion to risk, and 0
to the others. Therefore, among statistically significant independent variables, one could distinguish:
1. Stimulants of the studied phenomenon referring to those socio-economic characteristics that
favoured declaring a lack of risk appetite. In households distinguished by such characteristics,
the declared aversion to risk should be considered relatively frequent;
2. Destimulants of the studied phenomenon referring to the characteristics limiting the likelihood of
declaring risk aversion. Therefore, among households displaying these characteristics, the belief
in risk intolerance should be considered relatively rare.
The detailed results obtained in this stage were used in the further part of the study to identify
the causes of the gap between subjective and objective risk tolerance of households, i.e., the ranges of
survey responses for targeted re-examination.
In the second stage of the study, we focused only on households that declared no willingness
to take any financial risk in each country. The following research question was posed: which of the
socio-demographics and socio-economics determine the likelihood of possession of risky financial assets by
households that declare risk aversion? In other words, which household characteristics can be considered as
favouring the occurrence of the considered inconsistency of information in the countries analysed? In this part
of the study, we used the model (1) for the dichotomous dependent variable R_assets that identifies
households which simultaneously declared risk aversion and possessed at least one type of risky asset.
A value of 1 was assigned to such households, while the others (being risk-averse and risk-free) were
assigned 0. At this stage, the profiles of households whose inconsistent information should be subject
to re-examination were determined.
The results from the second stage also allowed us to identify similarities and differences in the
profiles of households (specified for individual countries) whose survey responses would be classified
for re-examination. Thus, we asked the question: to what extent are the profiles of households affected by the
information inconsistency similar among the euro area countries? Based on the characteristics favouring
the occurrence of inconsistent information and the confirmed strengthening influence of incomes,
and the education and age of the responding person along with their ranges, we classified the countries
according to the similarities of the profiles of risk-averse but risk-taking respondents. For this purpose,
the hierarchical taxonomic method with Ward’s formula was used with the input dataset consisting of
dummies identifying the profile for each country based on the parameter estimates of logit regression.
Therefore, if a statistically significant parameter characterised a given variable in this regression, then 1
was assigned to a given country; otherwise it was 0. Based on this set of dummies, a Jaccard distance
matrix was determined [83].
In the third stage of the study, we combined the results obtained in the two previous stages,
relating to the statistical significance and directions of the impact of individual independent variables
on the probability of occurrence of the phenomena explained. The goal of this stage was to provide
answers to the following questions: can we conclude on the causes of information inconsistency in each
country? If so, then for which households is the incorrect self-assessment of risk aversion the most probable causeSustainability 2020, 12, 6912 9 of 26
and for which is it the participation in inadequate (risky) assets? This part of the study allowed, therefore,
to recognise the causes of the analysed information inconsistency in households of specified profiles.
They were indicated by the characteristics that played the role of:
Sustainability 2020, 12, x FOR PEER REVIEW 9 of 26
1. Destimulants of the declared risk aversion (in stage 1) and stimulants of holding risky assets by
aversion when
households holding
unwilling to risky assets.
take the risk In
(intheir
stagecase, re-examination
2). The widespread should therefore
risk tolerance first serve to
of households
identify
with such the real attitude
characteristics towards incorrect
suggested risk. self-classification of those who declared risk aversion
2. when
Stimulants
holding of risky
both assets.
the declared risk
In their aversion
case, (in stage 1)
re-examination and the
should possession
therefore of risky
first serve assets by
to identify
households
the unwilling
real attitude towardstorisk.
take the risk (in stage 2). The widespread risk aversion of households
2. displayingof
Stimulants such
bothcharacteristics
the declared indicated that decisions
risk aversion (in stage 1)about
and participation
the possession in of
risky assets
risky should
assets by
be seen as potentially erroneous. Therefore, in the case of such households,
households unwilling to take the risk (in stage 2). The widespread risk aversion of households re-examination
should be such
displaying first of all focused on
characteristics the adequacy
indicated of holding
that decisions risky
about assets, including
participation in riskythe testing
assets of the
should
household’s
be knowledge
seen as potentially of the main
erroneous. characteristics
Therefore, and of
in the case risks
suchrelated to thesere-examination
households, assets and their
investment
should experience.
be first of all focused on the adequacy of holding risky assets, including the testing of
the household’s
In the above cases, knowledge of the main characteristics
the re-examination might therefore and
berisks related
carried to these
out with assets
a focus onand their
a specific
areainvestment
of informationexperience.
obtained from households, which, based on the results of the study, was indicated
In the
as the above
most cases, the
probable re-examination
cause might therefore
of inconsistency. It shouldbebecarried
noted,outhowever,
with a focus
thatonthea specific
need forareare-
ofexamination
information alsoobtained from households, which, based on the results of the study, was indicated
applies to households with characteristics of which statistical significance was not as the
most probable
confirmed cause
at the of inconsistency.
adopted It should regarding
level of significance be noted, however, thatrisk
the declared theaversion
need for(in re-examination
stage 1), but it
also
wasapplies to households
confirmed regardingwith the characteristics
possession of of which
risky statistical
assets significance
(in stage wascase,
2). In their not confirmed
one can onlyat
the adoptedthat
conclude level of significance
there regarding
is an increased the declared
tendency to provide risk aversion (in
inconsistent stage 1), butwithout
information, it was confirmed
suggesting
regarding
its cause.the possession of risky assets (in stage 2). In their case, one can only conclude that there is
an increased
It shouldtendency
be noted to that
provide inconsistentofinformation,
the recognition the declaredwithout suggesting
risk aversion as oneitsofcause.
the reasons for the
It should inconsistency
information be noted that the andrecognition
the need for ofits
there-examination
declared risk aversion
indicatesasthe
onelimitations
of the reasons forsingle
of the the
information inconsistency
question method. In this and
case,the
theneed for its question
following re-examination
shouldindicates
be raised:theforlimitations of the single
which households may the
question
usefulnessmethod. In this
of the single case, the
question following question should be raised: for which households may the
be limited?
usefulness
Theofoverall
the single questionapplied
procedure be limited?
in the study is presented in Figure 1.
The overall procedure applied in the study is presented in Figure 1.
Figure 1. Graphical description of the study. Source: Created by the authors.
Figure 1. Graphical description of the study. Source: Created by the authors.
4. Data
4. Data
Our study is based on the second wave data of the Eurosystem HFCS [84], which is a unique
sourceOur study is based
of information abouton the
the second wave
distribution data of the Eurosystem
of socio-demographic HFCS [84], which
and socio-economic is awithin
features unique
source of information about the distribution of socio-demographic and socio-economic features
within the populations of the EU countries, including the self-assessed financial risk tolerance and
the classes of financial assets held. The data are confidential and made available on request for
research purposes.
In the euro area, information inconsistency was related to diverse domestic fractions of risk-Sustainability 2020, 12, 6912 10 of 26
the populations of the EU countries, including the self-assessed financial risk tolerance and the classes
of financial assets held. The data are confidential and made available on request for research purposes.
In the euro
Sustainability area,
2020, 12, information
x FOR PEER REVIEW inconsistency was related to diverse domestic fractions of risk-averse
10 of 26
household (Figure 2). On the basis of the adopted threshold at 5%, we selected 16 out of 18 countries
countries for
surveyed surveyed
the study,for the study, in
in which which
from from
5.2% 5.2% toof35.3%
to 35.3% of households
households with subjective
with subjective risk
risk aversion
aversion held risky assets in their portfolios. These were Austria (AT), Belgium
held risky assets in their portfolios. These were Austria (AT), Belgium (BE), Cyprus (CY), Estonia (BE), Cyprus (CY),
Estonia
(EE), (EE),(FI),
Finland Finland
France(FI),(FR),
France (FR), Germany
Germany (DE),(IE),
(DE), Ireland Ireland
Italy(IE),
(IT),Italy (IT), Luxembourg
Luxembourg (LU),
(LU), Malta (MT),
Malta (MT), the Netherlands (NL), Portugal (PT), Slovakia (SK), Slovenia SI),
the Netherlands (NL), Portugal (PT), Slovakia (SK), Slovenia SI), and Spain (ES). We omitted Greece and Spain (ES). We
omitted Greece (GR) and Latvia (LV) since the fractions in question were much below the threshold
(GR) and Latvia (LV) since the fractions in question were much below the threshold there—0.7% and
there—0.7% and 1.6%, respectively. Taking into account that risk aversion was the most popular
1.6%, respectively. Taking into account that risk aversion was the most popular attitude in these two
attitude in these two countries (declared by about 80% of Greeks and Latvians), one may conclude
countries (declared by about 80% of Greeks and Latvians), one may conclude that subjective risk
that subjective risk intolerance of households residing there was generally reflected in their
intolerance of households residing there was generally reflected in their portfolios. This consistency
portfolios. This consistency could result from the significantly worse living standards when
could result from the significantly worse living standards when compared with the remaining euro
compared with the remaining euro area countries, as evidenced by the Eurostat for 2014 (the
area countries,
reference year asforevidenced by the The
both countries). Eurostat for 2014
data reveal low(the referencefrom
satisfaction year own
for both countries).
financial Theofdata
situation
reveal low satisfaction from own financial situation of more than half of
more than half of each population and annual median equivalised net incomes of both countries each population and annual
median equivalised
classified to the lowest.net incomes of both countries classified to the lowest.
100%
80%
60%
40%
20%
0%
AT BE CY DE EE ES FI FR GR IE IT LU LV MT NL PT SI SK
Declaring risk aversion (% of total HHs surveyed) Holding risky assets (% of HHs declaring risk aversion)
Figure2.2.Households
Figure Households declaring
declaring riskrisk aversion
aversion and fractions
and their their fractions responsible
responsible for information
for information inconsistency
in the population of individual countries. Source: Created by the authors and based onand
inconsistency in the population of individual countries. Source: Created by the authors thebased on
Eurosystem
the Eurosystem
HFCS data. HFCS data.
Thetotal
The totalnumber
number of households
householdscoveredcoveredby byour
ourstudy
study was
was70,730,
70,730,while
whilein individual
in individualcountries
countries
it ranged from 999 (in Malta) to 12,035 (in France). In most countries, including
it ranged from 999 (in Malta) to 12,035 (in France). In most countries, including Austria, Belgium, Austria, Belgium,
Cyprus,France,
Cyprus, France,Germany,
Germany,Luxembourg,
Luxembourg,Italy, Italy,Slovakia,
Slovakia, and
and Slovenia,
Slovenia, 2014
2014 waswas the
the reference
reference year,
year, but
butEstonia,
for for Estonia, Finland,
Finland, Ireland,
Ireland, Malta, Malta, the Netherlands,
the Netherlands, and and Portugal,
Portugal, it wasit was
2013.2013.
ThisThis difference
difference should
should not be perceived as relevant for our study, since we did not use data
not be perceived as relevant for our study, since we did not use data in monetary units, subject to in monetary units, subject
to decline
decline underunder
thethe European
European sovereign
sovereign debt
debt crisis.
crisis.
In the HFCS database, the information on the attitudes of households towards financial risk was
In the HFCS database, the information on the attitudes of households towards financial risk was
obtained only by the single question self-classification method. We were interested in respondents
obtained only by the single question self-classification method. We were interested in respondents
declaring the attitude ‘Not willing to take any financial risk’, distinguished by the unequivocal self-
declaring the attitude ‘Not willing to take any financial risk’, distinguished by the unequivocal
assessment (risk aversion), and thus excluding the possibility of interest in any risky assets. In the
self-assessment (risk aversion), and thus excluding the possibility of interest in any risky assets. In the
study, it was described by the dummy variable R_averse.
study,As it was described
concerns by the dummy
the information variable
on financial R_averse.
asset classes held by households, we focused solely on
As concerns the information on
the assets with capital-loss risk, no matter whetherfinancial asset classes
they were held by households,
perceived we focused
as risky or fairly risky. Wesolely
on the assets
included intowith capital-loss
this group publicly risk, no matter
traded shares,whether they were
other equities relatedperceived as risky or fairly
to non-self-employment, risky.
not
We included into this group publicly traded shares, other equities related
publicly traded businesses, mutual fund units, bonds except state or other general government, and to non-self-employment,
not
sumspublicly tradedaccounts.
on managed businesses,Based mutual fund
on them, units,
the dummy bonds except
variable state or
R_assets wasother general
created that government,
identifies
and
the sums on managed
participation accounts.
of a household Based
in at least ononethem,
type ofthe dummy
these assets.variable
It should R_assets was created
be explained that thethat
identifies
decision the participation
to use the dummyofresulted
a householdfrom in theatshortage
least oneoftype
dataofabout
thesetheassets.
values It should
of riskybe explained
assets in
households’
that the decision portfolios
to use for
theselected
dummycountries.
resulted from the shortage of data about the values of risky assets
For the purposes
in households’ portfoliosof statistical
for selected analysis, we used a set of independent variables related to socio-
countries.
demographics and socio-economics.
For the purposes A household’s
of statistical analysis, we used members
a set of typically
independent own variables
financial assets
related jointly
to socio-
and declare a common attitude towards financial risk, but many of its attributes
demographics and socio-economics. A household’s members typically own financial assets jointly are personal-specific.
In the HFCS, the most knowledgeable member regarding the situation of a household and a primary
decision-maker is the responding person, thus we also controlled for his or her attributes. The set was
composed of the following:Sustainability 2020, 12, 6912 11 of 26
and declare a common attitude towards financial risk, but many of its attributes are personal-specific.
In the HFCS, the most knowledgeable member regarding the situation of a household and a primary
decision-maker is the responding person, thus we also controlled for his or her attributes. The set was
composed of the following:
1. Quintile class of total gross income of a household, at a country level (dummies): TGI_1Q—the first
quantile (reference variable); TGI_2Q—the second quantile; TGI_3Q—the third quantile;
TGI_4Q—the fourth quantile; TGI_5Q—the fifth quantile;
2. Type of income of a household (dummies): I_Empl—employee income; I_SEmpl—self-employment
income; I_Pens—income from pensions; I_STrans—regular social transfers (except pensions);
3. Number of adult members of a household (discrete variable): N_Adult;
4. Number of dependent children in a household (discrete variable): N_Child;
5. Education level of a responding persons (dummies): E_1L—primary and lower (reference
variable); E_2L1S—lower secondary; E_2L2S—upper secondary; E_3L—tertiary.
6. Marital status of a responding person (dummies): MS_S (reference variable)—single (never
married); MS_M&CU—married and in a consensual union on a legal basis; MS_Wid—widowed;
MS_Div—divorced;
7. Age of a responding person (dummies): A < 25 (reference variable); A_25–39; A_40–54; A_55+;
age ranges correspond to those adopted in the European Commission study on financial assets
and liabilities of European citizens (EC, 2012);
8. Gender of a responding person (a dummy): Gender—1 if male.
It should be added that we also took into account other variables related to the type of household,
such as being credit constrained or receiving intergeneration transfers (gifts and inheritances), as well
as a responding person’s labour status. Due to their statistical insignificance or lack of data for selected
countries, these variables were finally omitted in the multidimensional statistical analysis. Summary
statistics of the independent variables which were used in the model (1) are presented in Tables A1
and A2. They were computed using sampling weights according to the HFCS guidelines [85].
The sampling weights were also applied to gather in-depth information for each country regarding
the distribution of:
• the risk aversion among households characterised by a particular socio-demographic or
socio-economic feature,
• the occurrence of risky assets among risk-averse households with a given socio-demographic or
socio-economic characteristic.
The information allowed us to supplement the findings from the regression modelling in stages 1
and 2 of the study.
5. Results and Discussion
5.1. Risk-Averse Households but Participating in Risky Assets
Since the providers of inconsistent information were selected from households declaring risk
aversion, in the first stage of the study we profiled the latter for each country. The results of regression
modelling are presented in Table A3. Some of the distinguishing characteristics of these households
turned out to be statistically significant in larger groups of countries, showing supranational significance.
They referred to the following:Sustainability 2020, 12, 6912 12 of 26
1. The household, taking into account:
• its income level, primarily the lowest within the first quintile group in the country of
residence (in 16 countries). Risk aversion was declared by the majority of such households,
representing from 72% (in Italy) up to 98% (in Portugal) of domestic populations;
• its sources of income, in particular pensions and regular social transfers (in 8 and 6 countries
respectively). Within these subsets of countries, risk aversion was declared from 65% (in Italy)
up to 96% (in Portugal) of retired households, and from 57% (in Austria) up to 86% (in France)
of living from social transfers;
• its size, expressed by a large number of adult members (in 13 countries). Among the
households of at least three adult members, risk aversion was declared by from 66%
(in Malta) up to 93% (in Cyprus).
2. The responding person, taking into account his or her:
• level of education, most of all primary and lower (in 15 countries). Risk aversion was declared
by from 75% (in Italy) up to 97% (in Portugal) of households distinguished by this feature;
• gender, as risk aversion was more common among women (in 14 countries);
• age, primarily not below 55 (in 11 countries). Taking into account the structure of households
from the highest age range regarding risk attitude, between 71% (in Austria) and 95% (in Portugal)
of them declared risk aversion;
• marital status; risk aversion was declared mainly by the widowed and the divorced (in 10
and 9 countries, respectively). Among widowed responding persons, the share of risk-averse
ranged from 74% (in Italy) up to (94% in Estonia), while among divorced persons from 75%
(in Germany) up to 90% (in France).
In turn, earning income from self-employment was the most often destimulant of declaring risk
aversion (in 10 countries). Our results are therefore in line with the results dominating in the literature,
regarding the significance of the characteristics and the directions of their impact. Detailed results
from this part of the study were used in its third stage.
Profiling of the providers of inconsistent survey information (subject to re-examination) was
performed in the second stage of the study, based on the same set of socio-demographics and socio-
economics. Detailed modelling results are contained in Table A4. It should be noted that characteristics
such as the level of household income, education, and age of respondents were described by more
than one independent variable. When considering these characteristics, we primarily focused on
the variables that had the greatest positive impact on the probability of having risky assets by those
declaring aversion to risk. Table 1 lists for each country the characteristics that favoured the occurrence
of inconsistencies in survey information, and therefore can be treated as helpful in profiling respondents
whose answers burdened with the greatest risk of inconsistency. As can be seen, these households
were not homogeneous in 16 countries.
Despite the visible differences in household profiles, some similarities could be seen within specific
groups of countries. The statistical significance of the level of income classified as the highest in the country
was confirmed particularly often (in all countries except the Netherlands and Slovakia), ceteris paribus.
Its importance as a determinant of the gap between subjective and objective risk attitude of an investor
was confirmed by a study by Marinelli, Mazzoli and Palmucci [12] and Moreschi [20] who found
that the inclination to provide inconsistent information increases along with increasing income. They
explain this positive relationship with the smaller significance of potential losses for wealthy people,
and thus by their lower precision in assessing their risk attitude and selecting financial assets. In our
study, we also confirm the increase in the probability of information inconsistency with the rise in the
level of income starting from the first quintile group in Austria, Belgium, Cyprus, Finland, France,
Germany, Italy, Malta, and Spain, while in other countries within its higher ranges, ceteris paribus.
The significance of the incomes from the highest range was evidenced in the structure of domesticYou can also read