Distinct mutations in importin β family nucleocytoplasmic transport receptors transportin SR and importin 13 affect specific cargo binding
←
→
Page content transcription
If your browser does not render page correctly, please read the page content below
www.nature.com/scientificreports
OPEN Distinct mutations in importin‑β
family nucleocytoplasmic
transport receptors transportin‑SR
and importin‑13 affect specific
cargo binding
Makoto Kimura1,5*, Kenichiro Imai2,3,5*, Yuriko Morinaka1, Yoshiko Hosono‑Sakuma1,
Paul Horton4 & Naoko Imamoto1*
Importin-(Imp)β family nucleocytoplasmic transport receptors (NTRs) are supposed to bind to their
cargoes through interaction between a confined interface on an NTR and a nuclear localization or
export signal (NLS/NES) on a cargo. Although consensus NLS/NES sequence motifs have been defined
for cargoes of some NTRs, many experimentally identified cargoes of those NTRs lack those motifs,
and consensus NLSs/NESs have been reported for only a few NTRs. Crystal structures of NTR–cargo
complexes have exemplified 3D structure-dependent binding of cargoes lacking a consensus NLS/
NES to different sites on an NTR. Since only a limited number of NTR–cargo interactions have been
studied, whether most cargoes lacking a consensus NLS/NES bind to the same confined interface
or to various sites on an NTR is still unclear. Addressing this issue, we generated four mutants of
transportin-(Trn)SR, of which many cargoes lack a consensus NLS, and eight mutants of Imp13, where
no consensus NLS has been defined, and we analyzed their binding to as many as 40 cargo candidates
that we previously identified by a nuclear import reaction-based method. The cargoes bind differently
to the NTR mutants, suggesting that positions on an NTR contribute differently to the binding of
respective cargoes.
Human cells have approximately 20 species of Impβ family NTRs, which share the task of transporting approxi-
mately 35% of expressed proteins. Each of the NTRs has been reported to transport a specific group of cargo
proteins or RNAs into or out of the nuclei through the nuclear pores1,2, and recent comprehensive analyses further
indicated that predominant protein groups in the cargo cohorts are unique to the respective N TRs3,4. Thus, the
specific NTR–cargo interaction is expected to be attributed to contact between a confined site on the NTR and
an NLS/NES on the cargo. Several NTR-specific NLSs/NESs have been described as short regions with consensus
sequences. The most well-studied NLS is the classical N LS5,6 that binds to Impα, which is a cargo-binding adap-
7–11
tor exclusively for Impβ . Sequences similar to the Impβ binding (IBB)-domain in Impα act as NLSs that bind
directly to Impβ12–14. Other known NLSs/NESs that bind directly to Impβ family NTRs are the PY-NLS for Trn1
and Trn215–17, the Leu-rich NES for C
RM118–20, the SR-domain for TrnSR21, the IK-NLS for yeast K ap121p22,23,
and the indefinite β-like importin binding (BIB)-domain, which binds to several NTRs24. In addition, the RG/
RGG-rich segment for Trn1 and the RSY-rich segment for TrnSR were reported recently25. Crystallographic
studies revealed the binding structures of these NLSs/NESs and the Impβ family NTRs: IBB-domain/Impβ26–28,
PY-NLS/Trn115,29–33, NES/CRM134–39, SR-domain/TrnSR40,41, and IK-NLS/Kap121p22,23,42. In these structures,
the NTRs interact with the NLSs/NESs by a confined interface located on a distinct part of each NTR. Some of
these structures include only a short peptide containing the NLS/NES, but other structures involve wider cargo
1
Cellular Dynamics Laboratory, RIKEN Cluster for Pioneering Research, Wako, Saitama, Japan. 2Cellular and
Molecular Biotechnology Research Institute, National Institute of Advanced Industrial Science and Technology
(AIST), Tokyo, Japan. 3Molecular Profiling Research Center for Drug Discovery, National Institute of Advanced
Industrial Science and Technology (AIST), Tokyo, Japan. 4Department of Computer Science and Information
Engineering, National Cheng Kung University, Tainan City, Taiwan. 5These authors contributed equally: Makoto
Kimura and Kenichiro Imai. *email: makimura@riken.jp; kenichiro.imai@aist.go.jp; nimamoto@riken.jp
Scientific Reports | (2021) 11:15649 | https://doi.org/10.1038/s41598-021-94948-1 1
Vol.:(0123456789)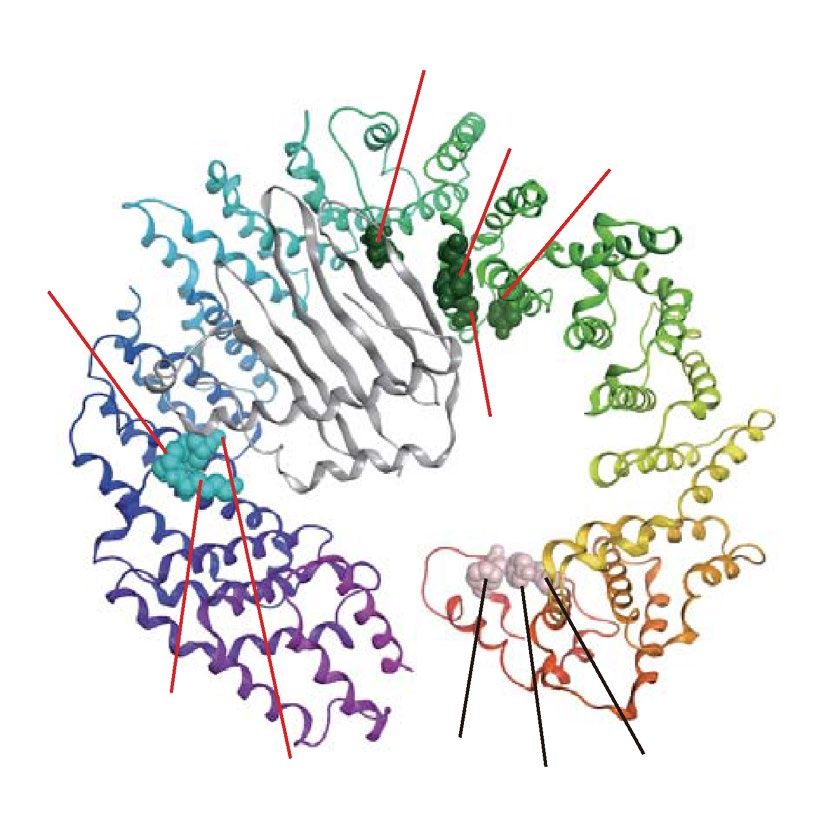
www.nature.com/scientificreports/
domains in addition to the NLS/NES, and in such structures, cargo regions apart from the canonical NLS/NES
also interact with the NTR34,39,41.
Even if a consensus NLS/NES sequence for an NTR is evident, many cargoes of the same NTR may not
have the consensus sequence, and notably, for many NTRs, no consensus NLS/NES sequences have been
reported. Recent extensive cargo or binding partner identifications failed to uncover novel consensus NLS/NES
sequences3,4,43–46. Crystal structures of NTRs complexed with cargoes lacking the canonical NLS/NES have also
been determined: Impβ47–49, Imp950, Imp1351–53, Kap122p54, CSE155, exportin-(Xpo)456, Xpo557, and Xpot58. In
these structures, the NTRs interact with not just a short sequence of the cargo, but rather with multiple sites
or a surface arranged conformationally, and respective cargoes bind to different positions on the NTRs. Impβ
import cargoes, Snail, PTHrP, and SREBP-2 contact Impβ at multiple distinctive sites, which also differ from
the IBB-interface47–49. Imp13 alternatively binds to import cargoes, UBE2I (UBC9) and MAGOH (Mago), by
its N- and C-terminal region, respectively51,52, and an export cargo, EIF1A, by a middle region adjacent to the
MAGOH-binding region53. In the complex of the Impβ/Imp7 heterodimer and histone H1, fuzzy and nonspecific
interactions by disordered regions of the cargo also support complex f ormation59. Thus, it can be postulated
that NTRs recognize cargoes lacking a canonical NLS/NES using different contact sites, as required by various
three-dimensional cargo structures. Likewise, cargoes containing an NLS/NES may also contact varying NTR
sites by regions other than the NLS/NES. Therefore, to understand the specificity determinant of the NTR–cargo
interaction, the binding of NTRs to a number of varying proteins or domains lacking a canonical NLS/NES must
be characterized.
A substantial number of cargoes or binding partners of NTRs have been identified in recent large-scale
studies3,4,43–46, but we cannot expect immediate structure determination of so many NTR–cargo complexes.
Biochemical protein–protein binding assays using mutant proteins can infer amino acid residues involved in the
binding. If mutations located at distinct positions of an NTR affect the binding of different cargoes, that suggests
that the cargoes bind to the NTR in different configurations.
Based on extrapolation from reported crystal structures, we hypothesized that cargoes lacking a consensus
NLS/NES bind differently to the same NTR. To test this hypothesis, we generated a series of mutants of two
human NTRs, TrnSR, of which many identified cargoes lack the SR-domain, which is regarded as its canoni-
cal NLS, and Imp13, for which no consensus NLS has been defined, and analyzed the binding to the previ-
ously identified cargoes by bead halo assay (BHA). For that purpose, we used NTR mutants already reported
to be deleterious to cargo binding and made new mutants, considering the crystal structures and functional
differentiation60,61, as TrnSR and Imp13 are one of the close paralogous pairs within the Impβ family. To examine
TrnSR and Imp13 cargoes, we prepared approximately 40 candidate cargoes each that we identified previously by
SILAC-Tp—a combination of stable isotope labeling by amino acid in cell culture (SILAC), an in vitro transport
system that imports proteins from nuclear extract into the nuclei of permeabilized cells, and LC–MS/MS3. The
cargoes showed widely varying spectra of mutant NTR binding, suggesting that the configurations of NTR–cargo
interactions are more widely diversified than expected.
Results
TrnSR, Imp13, and their cargoes. Previously, we identified candidate cargoes of the 12 import NTRs by
the SILAC-Tp method3. In those experiments, the plasma membranes of cells labeled with stable isotopes were
permeabilized, and unlabeled proteins in a nuclear extract were imported into the nuclei of the permeabilized
cells by an NTR of interest. After a pair of import reactions with (+) and without (−) the NTR, the nuclear
proteins were extracted and analyzed by LC–MS/MS to derive the unlabeled/labeled (imported/endogenous)
quantitation ratio of each protein. From these data, the proteins were ranked in order of the Z-score (standard
deviation value) of the log [(unlabeled/labeled)+NTR/(unlabeled/labeled)-NTR] ratio. The experiments were trip-
licated for each NTR. Proteins ranked in the top 4% (49–66 proteins) by the lowest (3rd) Z-score in triplicate
(3rd-Z-4% cargoes) were assessed as reliable candidate cargoes, whereas the top 15% (245–309 proteins) by the
2nd Z-score were assessed as possible candidate cargoes (2nd-Z-15% cargoes). Contrary to expectation, we were
unable to discern any novel consensus sequence within the identified cargoes, raising the question of how these
proteins bind to the NTRs. Thus, we analyzed the binding of the identified cargoes. We focused on TrnSR and
Imp13 because (1) some cargo-binding crystal structures are available, (2) many of the identified TrnSR cargoes
lack the canonical NLS, SR-domain, and no consensus NLS has been defined for Imp13 cargoes, suggesting that
these NTRs provide interfaces structurally distinct from those for canonical NLS interactions, and (3) TrnSR and
Imp13 are one of the closely homologous pairs in the Impβ family, but they share few cargoes3 and therefore are
a convenient pair for the prediction of specific cargo-binding sites acquired after evolutionary divergence (see
the next section). For cargo specimens, we employed 3rd-Z-4% cargoes. Of the 65 and 66 TrnSR and Imp13 3rd-
Z-4% cargoes, 41 and 40 cargoes, respectively, were successfully prepared as a GFP-fusion protein in a bacterial
extract and quantified by triplicate Western blotting with an anti-GFP antibody (Supplementary Fig. S1). Here,
we refer to the cargoes by their gene names and 3rd-Z-rank order in our previous p aper3.
Selection of sites to mutate in TrnSR and Imp13. To analyze the effects of NTR mutations on the
binding of various cargoes, we needed to design NTR mutants that are highly likely to be defective in binding
to some cargoes. We expected that analyses focusing on a couple of distinct regions on the NTRs would yield
sufficient information to illustrate the similarity or variety of the binding configurations and considered that
the effects of mutations in close proximity should also be compared by introducing a few mutations into a small
region. Thus, we selected the residues to substitute in such a way as to form a couple of separated clusters on
the NTR; with priority order: (1) residues in contact with cargoes in crystal structures and whose mutations
were defective in cargo binding in pull-down assay, (2) residues in contact with cargoes but not assayed by
Scientific Reports | (2021) 11:15649 | https://doi.org/10.1038/s41598-021-94948-1 2
Vol:.(1234567890)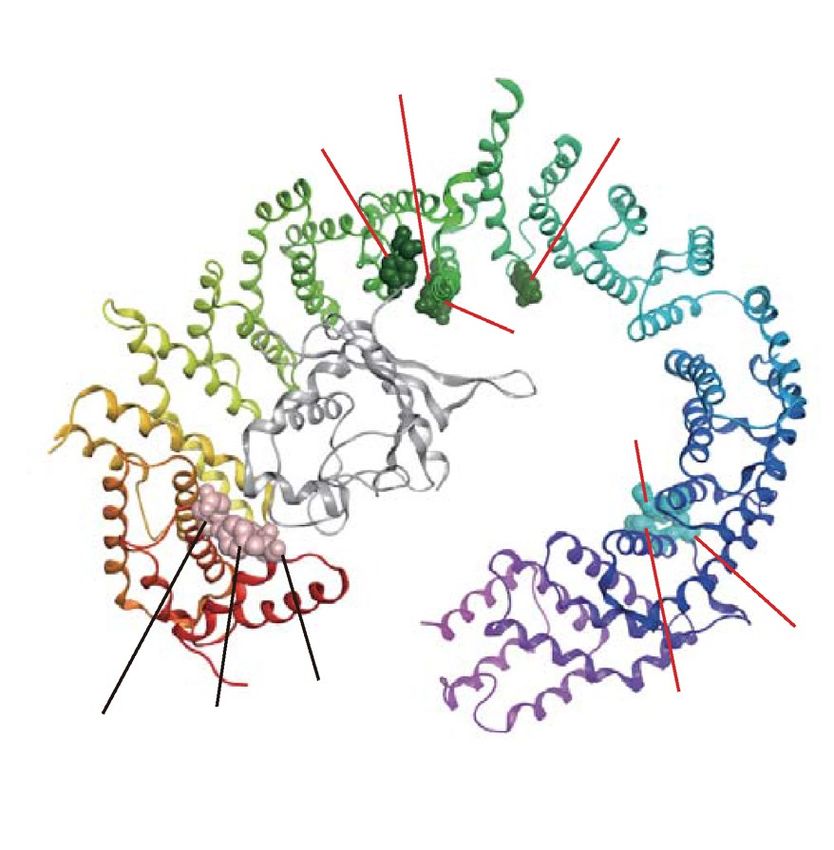
www.nature.com/scientificreports/
Site n
a b
TrnSR Human ....EAVLFIMAAIA-SVDPENNPTLV....
Mouse ....EAVLFIMAAIA-SVDPENNPTLV....
Frog ....EAVLFIMAAIA-SIDPENNPTLV.... p
Zebrafish ....EAVLFIMASIA-NVDPENNPTLM....
Fly ....EAALFIMQNVA-NILPDENEVIP....
C.elegans ....ESALFVMSAVVQNLLPESDTNMP....
Imp13 Human ....EALLYGFQSIA-TIDVNYSDVVP....
Site on Mouse ....EALLYGFQSIA-TIDVNYSDVVP....
concave Frog ....EALLYGFQSIA-TIDVNYSDVVP.... q
surfaces Zebrafish ....EALLYGFQSIA-TIDVNYSDVIP....
with high Fly ....EACIYSFQSVA-HFGGEEKRQIP....
KL-value C.elegans ....ESCIFQWECVA-YLGETDYTAIL....
( ) ( )
KLsite n= ( ) log + ( ) log
( ) ( )
p(i): estimated probability of amino acid i at site n of TrnSR
Mutagenesis q(i): estimated probability of amino acid i at site n of Imp13
Evolutionary trace
c Cargo GFP
d
NTR
WT 1
mCherry
2
mt 1
GST
3
mt 2 4
5
mt 3
6 Cargo clustering
by mutant NTR-binding specificity
7
Bead halo binding assay
Figure 1. Research workflow. (a) In addition to amino acid residues that contact cargoes in reported crystal
structures, residues exposed on the concave surface facing the cavity of the TrnSR or Imp13 structure were
considered candidate sites for mutational analysis. (b) Residues conserved across species within either TrnSR
or Imp13 orthologs but not between them were identified via an ETA of 78 and 73 metazoan TrnSR and Imp13
sequences, respectively. The sequences were aligned, and the obtained amino acid frequencies of each column
were used to estimate probabilities for use in computing the symmetric Kullback–Leibler divergence (KL value)
for each aligned position (site n). (c) WT and mutagenized (mt) TrnSR and Imp13 (NTR) and their cargoes
were prepared as bacterially expressed GST-mCherry-NTR fusion and GFP-cargo fusion proteins, respectively.
Binding between the GST-mCherry-NTRs and the GFP-cargo was analyzed in all combinations by BHA. GST-
mCherry-NTR was fixed on GSH-Sepharose beads and mixed with a bacterial extract containing the GFP-cargo
protein. The beads were then observed with a confocal microscope, and the binding intensity was quantified
from the fluorescence of mCherry and GFP in the images. (d) The cargoes were clustered based on their NTR
mutant-binding specificity.
pull-down, and (3) residues facing towards cargoes in crystal structures and predicted as evolutionarily differ-
entiated cargo-binding sites by high symmetric Kullback–Leibler information values (KL values) in a modified
evolutionary trace analysis60 (ETA, see the next paragraph) (Fig. 1a, b). The selected regions differed between
TrnSR and Imp13 because more cargo-contact sites were found, and more mutants were reported for Imp13 than
TrnSR. We substituted charged residues with oppositely charged residues because residues were replaced simi-
larly in previously characterized mutants defective in cargo b inding41,51,52 (e.g., TrnSR-R671E, -D750R/D751R
and Imp13-K802E/R803E).
ETA aims to correlate sequence variations with differentiated protein functions60,61. Impβ family NTRs share
primary structures, although the amino acid identities between quite a few NTRs are less than 30%, and any pair
within the 12 import NTRs shares a certain number of the identified cargoes. In general, homologous NTRs
share many cargoes3. However, TrnSR and Imp13, which are so similar as to form one of the closest pairs in the
phylogenetic analysis of 12 Impβ family import NTRs, are functionally differentiated to share few cargoes3. This
Scientific Reports | (2021) 11:15649 | https://doi.org/10.1038/s41598-021-94948-1 3
Vol.:(0123456789)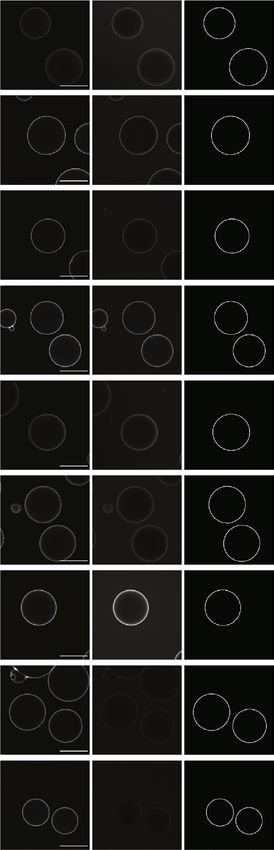
www.nature.com/scientificreports/
is a distinctive feature of this pair, and we expected that cargo-binding sites evolutionarily differentiated between
TrnSR and Imp13 could be predicted by ETA. ETA focuses on amino acid positions conserved in each paralog but
not across the paralogs, e.g., positions consistently occupied by one amino acid in TrnSR sequences and another
amino acid in Imp13 sequences. Such positions are presumably responsible for the functional differentiation
between the paralogs in general60,61 and, in particular, the differential cargo recognition of TrnSR and Imp13.
TrnSR and Imp13 are close homologs but do differ consistently in a few positions. To systematically identify
such positions, we performed a modified ETA using a symmetric KL value60 (Fig. 1b and see Methods). The KL
value and the estimated amino acid probability of each position of human TrnSR and Imp13 are presented in
Supplementary Table S1. We considered positions with a high (within the top 10%) KL value as the candidate
sites for mutagenesis.
According to these considerations, we generated four TrnSR substitution mutants: TrnSR-E398R, -D409R,
-R671E, and -D750R/D751R double mutant (Fig. 2a and Table 1). R671 and D750/D751 are located near each
other in the crystal structure, and interact with the SR-domains of cargoes SRSF1 (ASF/SF2) and C PSF640,41.
TrnSR-R671E and -D750R/D751R were characterized by pull-down assay41. As expected, the alignment sites of
R671 and D751 have high KL values (Table 1 and Supplementary Table S1). We selected E398 and D409, located
near each other, because they are exposed toward a cargo, SRSF1, and their alignment sites have high KL values.
The small region in the TrnSR structure that includes E398 and D409 and another region that includes R671 and
D750/D751 are opposed to each other across the cavity (Fig. 2a).
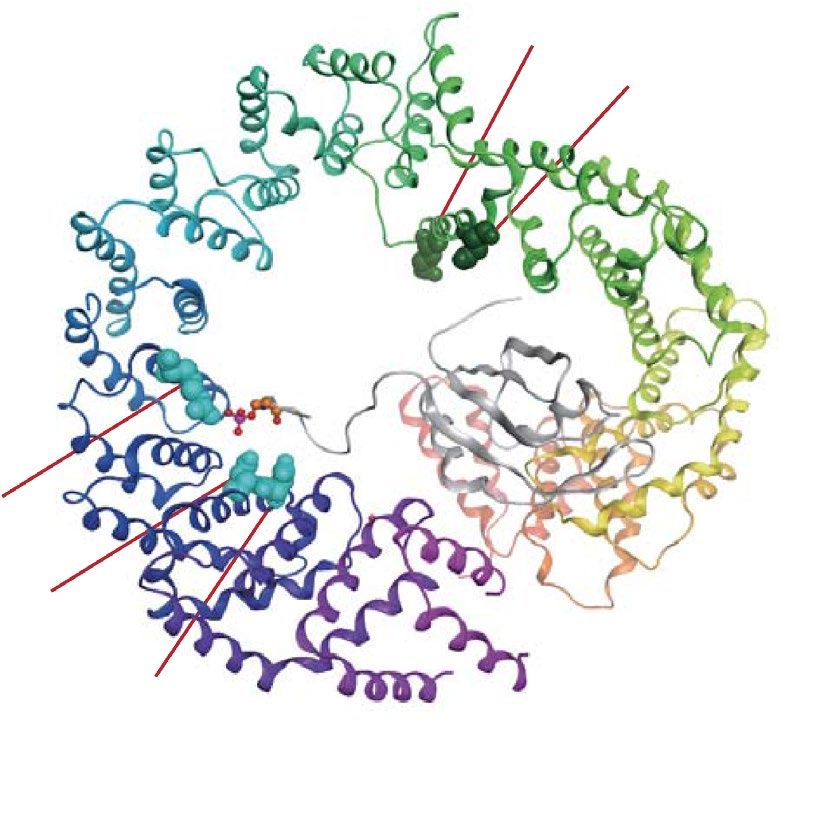
We also generated eight Imp13 mutants: Imp13-Y34R/Y35R, -E73R, -Y350R, -D426R, -Y433R, -E478R,
-R748E, and -K802E/R803E (Fig. 2b and Table 1). Y433, E478, and K802/R803 correspond to Y447, E493,
and K814/K815, respectively, in Drosophila Imp13. Y34/Y35 and E73 are located near each other in the crystal
structure. Imp13-Y34R/Y35R was characterized by pull-down assay, and Y34/Y35 and E73 interact with a cargo,
UBE2I, in the s tructure52. However, their KL values were unexpectedly low (Table 1 and Supplementary Table S1).
Imp13-D426R and -Y433R were characterized by pull-down assay51,52. D426 contacts UBE2I52, and Y433 and
E478 contact a cargo, MAGOH51. Y433 has a high KL value, while the KL values of D426 and E478 are somewhat
lower than the top 10% KL value. However, in the D426 and E478 positions, residues charged oppositely between
TrnSR and Imp13 are conserved through species (Fig. 2b). Y350 was selected in consideration of its structural
position and high KL value. Y350, D426, Y433, and E478 locate nearby one another. Imp13-K802E/R803E was
characterized by pull-down assay, and K802/R803 interacts with MAGOH51. R748 was selected because of its
structural position near K802/R803 and its high KL value. These residues form three clusters on the concave
surface of Imp13: N-terminal cluster, Y34/Y35 and E73; middle, Y350, D426, Y433, and E478; and C-terminal,
R748 and K802/R803 (Fig. 2b).
Bead halo assay. We analyzed the binding of the 3rd-Z-4% cargoes to TrnSR and Imp13 by BHA62 (Figs. 1c,
3). The TrnSR and Imp13 proteins were expressed in bacteria and purified as GST-mCherry-TrnSR and GST-
mCherry-Imp13 red fluorescent fusion proteins, respectively. The GST-mCherry-TrnSR or -Imp13 protein was
fixed on glutathione (GSH)-Sepharose beads and mixed with an extract containing one of the GFP-cargo fusion
proteins. The beads were observed with a confocal laser scanning microscope, and the fluorescent intensities of
mCherry and GFP along the rims of the beads were measured from the confocal images (Fig. 3). In the images,
only beads around which regions of interest (ROIs) and background (BG) regions can be set as unbroken circles
were selected for measurement (Supplementary Fig. S2), yielding one or two beads as the ROIs for most images.
We employed the BG-subtracted GFP/mCherry fluorescent ratio as the index for the binding.
We fused mCherry into GST-NTR proteins and used the GFP/mCherry fluorescent ratios as the index to
improve quantitation accuracy. Initially, we assessed the deviation of the measured values using GST-mCherry-
TrnSR and GFP-SRSF1 as an example (Fig. 4a–d) to evaluate our experimental system. In all BHAs, we selected
beads 80–150 µm in diameter for quantitation. In this range, intensities of neither mCherry nor GFP fluorescence
correlated with the diameter, although both fluctuated independently of the diameter (Fig. 4a, b). However,
mCherry and GFP intensities correlated with each other (R = 0.70, Fig. 4c), representing that GFP-cargo binds
to a bead in proportion to the amount of GST-mCherry-NTR on the bead. As seen in some images in this report
(e.g., Fig. 3), some ROIs contain uneven fluorescence, but in most cases, mCherry and GFP show similar uneven
fluorescence patterns, indicating proportional binding of GFP-cargo to GST-mCherry-NTR at any place on a
bead. Accordingly, the coefficient of variation (C.V. = S.D./mean), which was 0.22 for GFP (Fig. 4b), was reduced
to 0.17 for GFP/mCherry (Fig. 4d). All the GFP/mCherry values in Fig. 4d are within the mean ± 36% range, and
a significant reduction (e.g., > 40% reduction) in GFP/mCherry values in the following assays of NTR mutants
assuredly indicates reduced binding, albeit not precisely quantitative. Note that in the final assays (Supplemen-
tary Table S2a and b), the GFP/mCherry ratios of three images were averaged and used to calculate the normal-
ized GFP/mCherry values, and therefore, the measurement errors were reduced. In the negative control assay,
intact GFP bound to TrnSR weakly, though not to Imp13 (Supplementary Fig. S3a and e). We applied different
thresholds for negative binding to TrnSR (GFP/mCherry without normalization, 0.1) and Imp13 (0.05) to avoid
unreliable quantification at a low range (Supplementary Fig. S3b–d).
Next, we assessed the dose–response of the system using two TrnSR- and four Imp13-specific cargoes
(Fig. 4e–j). The amount of extract containing GFP-cargo was varied from zero up to that used in the final assays
of NTR mutants. In some cases, the BG-subtracted GFP/mCherry ratio responded to the GFP-cargo dose almost
linearly (Fig. 4e, g, i), and reduced binding to NTR mutants would be detected sensitively. In other cases, the
BG-subtracted GFP/mCherry ratio approached saturation (Fig. 4f, h, j), and a slight reduction in binding would
be challenging to detect. Thus, our assays should reliably detect reductions in binding affinity but perhaps with
imperfect sensitivity in some cases. In the final assays of NTR mutants below, GFP-cargoes of equal amount were
used when possible (see the legend of Supplementary Table S2).
Scientific Reports | (2021) 11:15649 | https://doi.org/10.1038/s41598-021-94948-1 4
Vol:.(1234567890)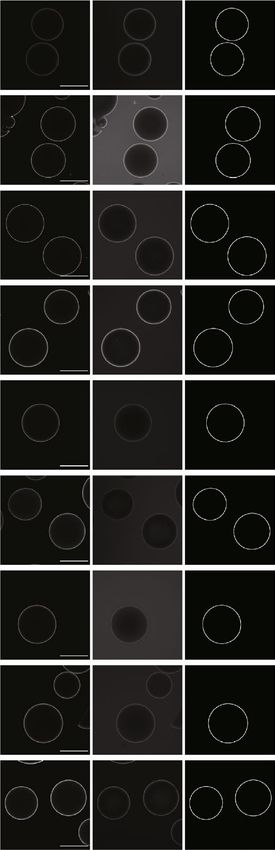
www.nature.com/scientificreports/
a D409
E398
TrnSR
TrnSR top3 Imp13 top3
Residue conserved residues conserved residues
E398 D(0.550), E(0.368), G(0.035) C(0.441), I(0.198), Y(0.076)
SRSF1 D409 D(0.903), S(0.047), A(0.008) Y(0.757), S(0.109), D(0.087)
R671 R(0.991), K(0.002), G(0.001) S(0.195), T(0.185), K(0.169)
D750 D(0.873), E(0.085), N(0.008) E(0.525), D(0.242), H(0.055)
R671
D751 D(0.989), E(0.002), G(0.001) S(0.284), A(0.225), G(0.108)
D751
D750
b D426 E478
Y350 E478
Y433 Y350
Imp13
R803
Y433
R748 D426
UBE2I
MAGOH
R803
Y34 K802 K802
E73 Y35 Y34
R748 Y35 E73
Imp13 top3 TrnSR top3 Imp13 top3 TrnSR top3
Residue conserved residues conserved residues Residue conserved residues conserved residues
Y34 Y(0.985), F(0.005), L(0.001) Y(0.802), F(0.116), S(0.054) Y433 Y(0.757), S(0.109), D(0.087) D(0.903), S(0.047), A(0.008)
Y35 R(0.178), Y(0.128), S(0.125) N(0.215), H(0.207), Q(0.113) E478 E(0.614), D(0.214), Q(0.066) K(0.435), R(0.108), Q(0.091)
E73 E(0.805) ,N(0.062), P(0.046) E(0.314), N(0.111), T(0.069) R748 K(0.492), R(0.206), Q(0.102) S(0.916), A(0.050), T(0.007)
Y350 Y(0.922), F(0.054), L(0.004) H(0.353), Y(0.107), G(0.095) K802 K(0.705), R(0.207), D(0.041) Q(0.583), E(0.096), D(0.066)
D426 D(0.828), E(0.053), T(0.051) R(0.323), K(0.281), D(0.100) R803 K(0.560), R(0.251), S(0.048) R(0.581), K(0.171), C(0.111)
Figure 2. Substituted amino acid residues. (a) Positions of the five residues substituted in TrnSR are indicated
on the structure of TrnSR binding to SRSF1 (ASF/SF2, gray). The three most conserved amino acids in those
positions in the 78 metazoan TrnSR orthologs are shown on the right, with probabilities estimated from their
amino acid frequencies. The residues were substituted with oppositely charged amino acids. The D750/D751
dipeptide was substituted in one construct following a previous w ork41. E398 and D409 are proximal, and R671
and D750/D751 are also proximal. See also Table 1. (b) The ten residues substituted in Imp13 are indicated on
the structures of Imp13 binding to UBE2I (UBC9, gray) (left) or MAGOH (Mago, gray) (right). The three most
conserved amino acids in those positions in the 73 metazoan Imp13 orthologs are shown with probabilities
estimated from their amino acid frequencies. These residues were also substituted with oppositely charged
amino acids. Two constructs have dipeptide substitutions at Y34/Y35 and K802/R803 following a previous
work52. These residues reside in three separated regions: N-terminal region, Y34/Y35 and E73; middle, Y350,
D426, Y433, and E478; and C-terminal, R748 and K802/R803. See also Table 1.
Scientific Reports | (2021) 11:15649 | https://doi.org/10.1038/s41598-021-94948-1 5
Vol.:(0123456789)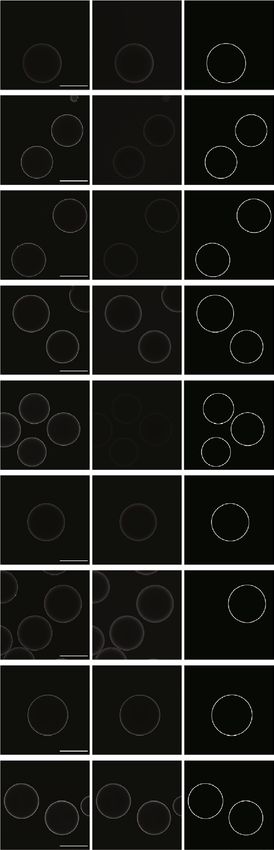
www.nature.com/scientificreports/
Cargo binding analyzed by pull- Cargo contact in crystal
NTR Amino acid substitution KL value (top 10% > 7.5) down assay structure
E398R 13.966
D409R 10.496
TrnSR
R671E 8.310 SRSF1, CPSF641 SRSF141, CPSF640
41
D750R/D751R 2.980/13.051 SRSF1, CPSF6 SRSF141, CPSF640
52
Y34R/Y35R 0.957/3.615 UBE2I UBE2I52
E73R 2.626 UBE2I52
Y350R 7.590
D426R 6.809 UBE2I52 UBE2I52
Drosophila Mago-Y1451 (Dros- Drosophila Mago51 (Drosophila
Y433R 10.496
Imp13 ophila Imp13-Y447) Imp13-Y447)
Drosophila Mago51 (Drosophila
E478R 7.014
Imp13-E493)
R748E 12.836
MAGOH-RBM8A (Mago-Y14)52
Drosophila Mago51 (Drosophila
K802E/R803E 8.877/2.293 Drosophila Mago-Y1451 (Dros-
Imp13-K814/K815)
ophila Imp13-K814/K815)
Table 1. TrnSR and Imp13 mutants used.
a GST-mCherry-NTR
b DIC c mCherry d GFP
GSH
Bead
GSH
GFP-cargo
100 µm
e f DIC g mCherry h GFP
GSH
Bead
GSH
i j ROI k BG
ROIGFP–BGGFP
GFP/mCherry=
ROImCherry–BGmCherry
Figure 3. Bead halo assay. (a–d) An example of an NTR–cargo pair that does not bind. (e–h) An example of an
NTR–cargo pair that does bind. (a) A GST-mCherry-NTR is fixed on GSH-Sepharose beads. If GFP-cargo does
not bind to the NTR, it remains in the buffer around the beads. (e) If cargo binds to the NTR, it is concentrated
on the bead surface. (b, f) Differential interference contrast (DIC) microscopic images of the beads. (c, g)
Confocal microscopic images of mCherry fluorescence. The yellow square in (g) indicates the magnified region
in (j, k). (d, h) Confocal images of GFP fluorescence. (i) After background subtraction, the GFP/mCherry
fluorescence ratio around the beads was used as the index for the binding intensity. ROI and BG were defined as
in (j, k). The region mean intensities in 12-bit images were used for the calculation. (j) The ROI was set on the
mCherry fluorescent image as ring-shaped regions with a 5 pixel width along the inside of the outlines of beads
(yellow double line). The same ROI was applied to the corresponding GFP fluorescent image. (k) The BG was
established as larger ring-shaped regions with a 5 pixel width and 5 pixels away outside the ROI. Images in (j,
k) are magnifications of the square region in (g). In the actual quantitation, ROIs and BGs were set on original
images with dimensions of 1024 × 1024 pixels, of which the field size (317 × 317 µm) was the same as that of the
images (b–d and f–h). Scale bar: 100 µm. For more examples of the ROI setting, see Supplementary Fig. S2.
Scientific Reports | (2021) 11:15649 | https://doi.org/10.1038/s41598-021-94948-1 6
Vol:.(1234567890)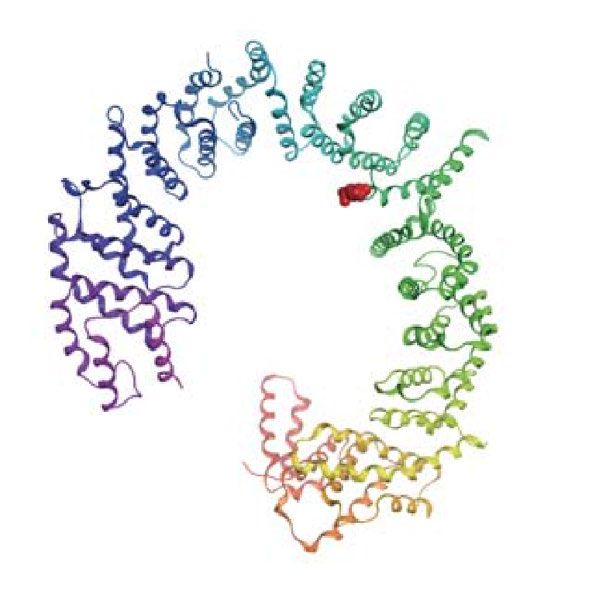
www.nature.com/scientificreports/
a mCherry b GFP c GFP vs mCherry d GFP/mCherry
600 0.7
1000 500
0.6
mCherry intensity
500
GFP/mCherry
GFP intensity
800 400 0.5
400
GFP
600 300 0.4
300
0.3
400 200
200
0.2
200 100 100 0.1
C.V.=0.18 R=0.29 C.V.=0.22 R=0.39 R=0.70 C.V.=0.17 R=0.28
0 0 0 0
70 90 110 130 150 70 90 110 130 150 0 200 400 600 800 1000 70 90 110 130 150
Diameter (µm) Diameter (µm) mCherry Diameter (µm)
e TrnSR + 46. PQBP1
f TrnSR + 56. RTF2
g Imp13 + 4. MAGOH
GFP/mCherry intensity
GFP/mCherry intensity
GFP/mCherry intensity
GFP-PQBP1 units GFP-RTF2 units GFP-MAGOH units
h Imp13 + 6. CHRAC1
i Imp13 + 54. PPIE
j Imp13 + 58. UBE2I
GFP/mCherry intensity
GFP/mCherry intensity
GFP/mCherry intensity
GFP-CHRAC units GFP-PPIE units GFP-UBE2I units
Figure 4. Evaluation of the bead halo assay system. (a–d) The fluorescence intensity of GST-mCherry-
TrnSR and GFP-SRSF1 as measured for 27 single beads is shown to evaluate the deviation of assay values. (a)
BG-subtracted mCherry, (b) BG-subtracted GFP, and (d) BG-subtracted GFP/mCherry values are plotted
against the bead diameters. (c) BG-subtracted GFP intensities are plotted against the BG-subtracted mCherry
intensities of the same beads. C.V., coefficient of variation of the fluorescent values; R, correlation coefficient
between the fluorescent values and the bead diameters (a, b, d) or between the mCherry and GFP intensities
(c). (e–j) The dosage of bacterial extract containing GFP-cargo was varied from zero to that used in the final
assay to evaluate the dose–response. (e) GST-mCherry-TrnSR and GFP-PQBP1, (f) GST-mCherry-TrnSR and
GFP-RTF2, (g) GST-mCherry-Imp13 and GFP-MAGOH, (h) GST-mCherry-Imp13 and GFP-CHRAC1, (i)
GST-mCherry-Imp13 and GFP-PPIE, and (j) GST-mCherry-Imp13 and GFP-UBE2I were analyzed by BHA.
Numbers are the 3rd-Z-ranks of the cargoes. Three images for one GFP-cargo dosage were quantified, and the
mean intensities of the GFP without BG subtraction (light green), BG of GFP (black), and BG-subtracted GFP
(green) divided by the mean BG-subtracted mCherry intensity are plotted with the S.D. indicated by the error
bar. Note that the BG of mCherry is low because the beads were used after washing out the unbound GST-
mCherry-NTR, while the BG of GFP rises with the dose of GFP-cargo because it includes the fluorescence of
free GFP-cargo that is in equilibrium with bead-bound GFP-cargo. All the NTR used are WT. The fitted curves
were drawn by Microsoft Excel.
Then, we checked the reproducibility of the quantitation (Supplementary Fig. S4a–f left panels), with particu-
lar attention to Imp13 since the Imp13 BHA results were more varied and involved more mutants than those of
TrnSR. The binding of two TrnSR- and four Imp13-specific cargoes to the WT and mutant NTRs were analyzed
three times. The three mean GFP/mCherry values of most triplicates agreed reasonably well with one another.
Although the GFP-cargoes used in this reproducibility analysis were prepared independently of those used in
the final assays (see Methods), the GFP/mCherry values of mutant NTRs normalized to that of WT were roughly
Scientific Reports | (2021) 11:15649 | https://doi.org/10.1038/s41598-021-94948-1 7
Vol.:(0123456789)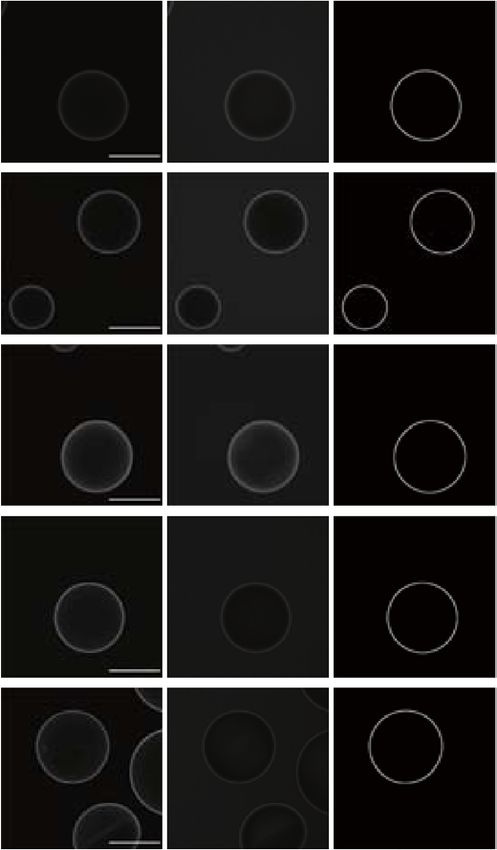
www.nature.com/scientificreports/
consistent with those in the final assay (Supplementary Fig. S4a–f right panels). Notably, a significant reduction
in cargo binding of an NTR mutant could consistently be observed in the repeated experiments.
We compared the binding of WT and mutant NTRs to the same cargo by localized surface plasmon reso-
nance (LSPR) to estimate the physical significance of the major binding reduction observed for NTR mutants
(Supplementary Fig. S5). Further, we prepared NTR and cargo proteins without GFP- and mCherry-fusion to
avoid optical interference. A H is6-tagged cargo protein was fixed on a Ni2+-charged nitrilotriacetic acid (NTA)
sensor chip, and the kinetic association and dissociation of a GST-NTR on the sensor were analyzed. Although
we tried several NTR–cargo combinations, we could only set up adequate experimental conditions for the
TrnSR–DNAJB1 interaction. In our LSPR experiment, TrnSR-WT bound strongly to DNAJB1 with K D ~ 7.4 nM
(Supplementary Fig. S5a), comparable to the highest level of NTR–cargo affinity reported for export NTRs in
the presence of RanGTP; CRM1–SNUPN ( KD ~ 10 nM)63, Xpot–tRNA ( KD ~ 2 nM)64, and Xpo4–hypusinated
EIF5A (KD ~ 2 nM)65. Strong cargo binding may be an intrinsic feature of TrnSR because TrnSR-WT generally
exhibited much higher unnormalized GFP/mCherry ratios than Imp13-WT (Supplementary Table S2a and b).
In the LSPR, TrnSR-D750R/D751R bound to DNAJB1 with KD ~ 28 nM (Supplementary Fig. S5b), indicating an
~ 3.8-fold affinity reduction from the WT. In the BHAs, the BG-subtracted GFP/mCherry ratios of TrnSR-D750R/
D751R were as low as 3–25% of the WT in the reproducibility analysis and the final assay (Supplementary Fig.
S5c and d, left panels), and the reductions in the GFP/mCherry ratios seem to be more than can be expected
from the K D shift in LSPR. However, the GFP/mCherry ratios of TrnSR-D750R/D751R without BG subtraction
were 14–52% of WT (Supplementary Fig. S5c and d, right panels), which was more consistent with the affinity
reduction in the LSPR. We set BG regions outside beads to highlight the difference in the GFP/mCherry ratios of
the ROIs, but the BG regions contain free GFP-cargoes yielding higher signals than the ROIs without GFP-cargo
binding (see Supplementary Fig. S3b) because free GFP-cargoes do not penetrate beads. Since TrnSR-D750R/
D751R showed significantly reduced cargo binding in our BHA, we conclude that our system can detect binding
reductions of less than one order of magnitude.
Binding of the cargoes to the WT NTRs. Imp13 is a bidirectional NTR66, but the candidate cargoes
are most likely to be import cargoes because they were identified by the import reaction-based method SILAC-
Tp (see the section, TrnSR, Imp13, and their cargoes). As described in the previous p aper3, an export cargo of
Imp13, EIF1AX66, ranked relatively high (164th in 1671 proteins) by the 3rd-Z-score. The unintended export
of endogenous EIF1AX by Imp13 must have raised the imported/endogenous (unlabeled/labeled) ratio in the
experiment. Judging by the absolute levels of imported (unlabeled) and endogenous (labeled) proteins in the
LC–MS/MS, EIF1AX, abundant in the nuclei, seemed to be the only export cargo ranked h igh3.
NTR–cargo complexes pass through the nuclear pores by diffusion, and the transport direction is regulated
at the steps of association and dissociation of the complexes in the nuclei and cytoplasm67. RanGTP, which is
rich in the nuclei and converted into RanGDP in the cytoplasm, promotes the association and dissociation of
export and import NTR–cargo complexes, respectively. We analyzed the binding of all the prepared cargoes in the
presence or absence of a GTP-fixed mutant of Ran, Q69L-RanGTP, by BHA (Supplementary Fig. S6). Most of the
candidate cargoes that we could analyze bound to their respective NTRs, (35 out of 41 TrnSR cargoes and 27 out
of 40 Imp13 cargos), and in most cases except the Imp13 export cargo EIF1AX, the addition of Q69L-RanGTP
decreased the GFP/mCherry values (Supplementary Fig. S6, 3rd-Z-rank of EIF1AX is 164 of Imp13), supporting
the functionality of the binding. This result attests to the reliability of the SILAC-Tp method, especially when
considering that BHAs can detect only the direct binding of a protein to an NTR, but the SILAC-Tp method
can also identify indirect cargoes that bind to an NTR by forming complexes with direct cargoes. Piggybacking
nuclear import is prevalent in human cells68, and in the STRING database69, quite a few 3rd-Z-4% cargoes of
which direct NTR binding was not detected are expected to interact with other 3rd-Z-4% cargoes that bound
directly to the NTR (Supplementary Table S2c). Since many unidentified cargoes may also connect the NTRs
and indirect cargoes, the possibility of piggybacking may be high for the NTR-unbound cargoes. However, we
should note that binding inhibition in BHA by the GFP-fusion to cargoes is possible. Inhibition of binding by
the N-terminal fusion of GST-mCherry to the NTR is improbable, albeit not impossible, because UBE2I and
RanGTP interact with the N-terminal region of the NTR41,51,52 and GST-mCherry-NTR. In any case, the candi-
date cargoes that do not bind to the NTRs in BHA could still be authentic.
Cargoes bind to the TrnSR and Imp13 mutants with varying affinities. We comprehensively ana-
lyzed the binding of 3rd-Z-4% cargoes to the TrnSR and Imp13 mutants by BHA. Examples of the images and
GFP/mCherry ratios are shown in Figs. 5 and 6. The GFP/mCherry ratios of the NTR mutants were normalized
by the WT NTR ratio for the same cargo to evaluate the mutational effects on the binding of respective cargoes
(Supplementary Table S2a and b). Considering the estimated accuracy of the BHA (Fig. 4), we discretized the
normalized GFP/mCherry values into three ranks: not reduced (> 0.60), reduced (≤ 0.60 and > 0.20), and much
reduced (≤ 0.20).
Most of the TrnSR cargoes that bound to TrnSR-WT showed markedly reduced binding to TrnSR-D750R/
D751R. D750/D751 was reported to interact with the SR-domains as referred above, but only a few of the TrnSR
cargoes have an apparent SR-domain, including the recently proposed RSY-rich segment25 (Supplementary
Table S2a). Thus, D750/D751 should also be involved in the interaction with cargoes lacking an SR-domain.
The other mutants, TrnSR-E396R, -D409R, and -R671E, showed diverse effects depending on the combination
of the particular mutation and cargo, mostly reducing binding but in a few cases increasing binding (e.g., PPIL1
binding to TrnSR-D409R). Since respective cargoes are affected by different mutations to varying degrees, the
cargoes most likely bind to TrnSR in diverse configurations. Likewise, all of the Imp13 cargoes that bound to
Imp13-WT exhibited varying affinities to the eight Imp13 mutants, and thus, the cargoes probably differ in how
Scientific Reports | (2021) 11:15649 | https://doi.org/10.1038/s41598-021-94948-1 8
Vol:.(1234567890)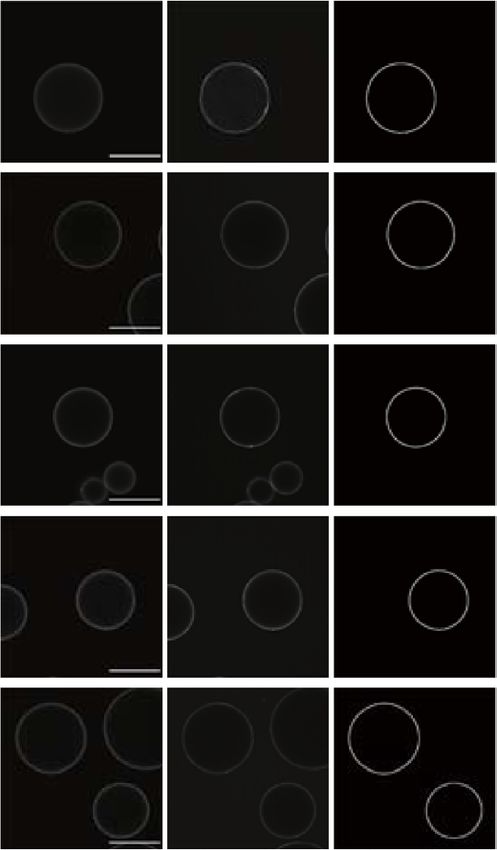
www.nature.com/scientificreports/
2. TRAP1 9. SRSF7 18. SRSF1
ROI ROI ROI
TrnSR mCherry GFP GFP/mCherry mCherry GFP GFP/mCherry mCherry GFP GFP/mCherry
WT
100 µm
2.55 1.02 1.09
E398R
1.11 0.94 0.56
D409R
1.35 0.67 0.58
R671E
1.16 0.26 0.77
D750R
D751R
0.49 0.25 0.19
25. NELF 43. RPS6KA3 249. CPSF6
ROI ROI ROI
TrnSR mCherry GFP GFP/mCherry mCherry GFP GFP/mCherry mCherry GFP GFP/mCherry
WT
100 µm
1
3.84 0.35 0.66
E398R
1.14 0.09 0.15
D409R
2.89 0.13 0.46
R671E
0.50 0.37 0.15
D750R
D751R
0.28 0.12 0.02
Enhanced Enhanced
Figure 5. Bead halo assay of TrnSR mutants. Examples of the GFP and mCherry fluorescent images used to
quantify the binding of six GFP-cargoes (number: 3rd-Z-rank) to the WT and four mutants of GST-mCherry-
TrnSR are shown. ROIs used for the quantitation are indicated by white circles. BG-subtracted GFP/mCherry
ratios calculated from these image values are also designated in the ROI images. Note that these GFP/mCherry
ratios are not normalized by the WT ratio and that they slightly differ from those in Supplementary Tale S2a,
which are the means of three images. The GFP images of RPS6KA3 and CPSF6 are enhanced equivalently. Scale
bar: 100 µm.
they bind. Examples in Fig. 6 clearly illustrate that respective cargoes are affected by different mutations. Two
mutants that reduced the binding most among the eight mutants were Imp13-R741E and -K802E/R803E for
MAGOH binding, -Y34R/Y35R and -D426R for UBE2I binding, and -Y433R and -E478R for EIF1AX binding.
The involvement of the C-terminal, N-terminal, and middle regions of Imp13 in the binding of MAGOH, UBE2I,
and EIF1AX, respectively, agrees with the crystal structures51–53. Although EIF1AX is an export cargo of Imp13,
they form a complex without RanGTP in the cytoplasm and, RanGTP enhances b inding66 (Supplementary Fig.
S6). Thus, we believe that BHA reflects cytoplasmic complex formation.
Effects of the NTR mutations do not relate to structural similarity of the cargoes. The cargoes
may be classified according to the mutant NTR-binding profiles of the cargoes. We clustered the cargoes using
Scientific Reports | (2021) 11:15649 | https://doi.org/10.1038/s41598-021-94948-1 9
Vol.:(0123456789)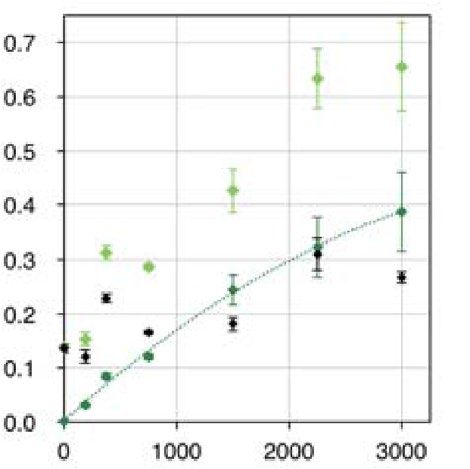
www.nature.com/scientificreports/
4. MAGOH 58. UBE2I 164. EIF1AX
ROI ROI ROI
Imp13 mCherry GFP GFP/mCherry mCherry GFP GFP/mCherry mCherry GFP GFP/mCherry
WT
100 µm
1.01 0.87 1.05
Y34R
Y35R
0.46 0.19 0.45
E73R
0.35 0.26 0.49
Y350R
0.62 0.47 0.71
D426R
0.72 0.10 0.26
Y433R
0.36 0.62 0.13
E478R
1.05 0.75 0.09
R748E
0.15 0.79 0.23
K802E
R803E
0.10 0.68 0.32
Figure 6. Bead halo assay of Imp13 mutants. Examples of the GFP and mCherry fluorescent images used
to quantify the binding of three GFP-cargoes (number: 3rd-Z-rank) to the WT and eight mutants of GST-
mCherry-Imp13 are shown. ROIs used for the quantitation are specified by white circles. BG-subtracted GFP/
mCherry ratios calculated from these image values are also indicated in the ROI images. Note that the GFP/
mCherry ratios are not normalized by the WT ratio and that they slightly differ from those in Supplementary
Tale S2b, which are the mean of three images. Scale bar: 100 µm.
Ward’s method to explore this possibility (Figs. 1d and 7). We assigned discrete values to the three ranks of the
normalized GFP/mCherry values described in the previous section (Supplementary Table S2a and b) as fol-
lows: 1 for > 0.6 (not reduced), 0.5 for ≤ 0.60 and > 0.20 (reduced), and 0 for ≤ 0.20 (much reduced), and used
the Euclidean distances of these values as the metric. Both the TrnSR and Imp13 cargoes can be classified into a
reasonable number of groups. For example, they can be divided into five (Fig. 7a) or six (b) clusters by setting an
arbitrary breakpoint. However, the clusters are not separated discretely; the mutant NTR-binding profiles change
gradually through the clusters.
We examined the sequence and structural similarities of the cargoes to relate the mutant NTR-binding spe-
cificities and the primary and tertiary structures of the cargoes. From both determined structures and homology
modeled structures (Supplementary Table S3a), we calculated structural similarities using MICAN and template
modeling scores (TM-scores) of MICAN70 for the structure assigned regions of all possible pairs of cargoes.
MICAN is a structural alignment algorithm for identifying the best structural alignment between a protein pair
by disregarding the connectivity between secondary structure elements, and thus, it can find similar secondary
structure packing arrangements with different topologies. Some TrnSR cargoes share a structural similarity,
but they are separated in cargo clustering by mutant TrnSR-binding intensities (Fig. 7a); for example, SRSF7,
SRSF6, CPSF6, SRSF1, NELFE, and RBM12 have similar RNA recognition motif domains, but these proteins
are distributed in the dendrogram based on mutant-binding specificity. Fewer Imp13 cargoes share structural
similarity, and they have also clustered apart (Fig. 7b); high structural similarity is detected only among α-helical
substructures of KRT8, KRT17, and PRC1. The sequence similarity search results (Fig. 7) and Pfam71 domain
Scientific Reports | (2021) 11:15649 | https://doi.org/10.1038/s41598-021-94948-1 10
Vol:.(1234567890)www.nature.com/scientificreports/
a TrnSR
2.0
Distance
1.5
1.0
0.5
0.0
Binding relative E398R
to WT D409R
>0.6 R671E
0.2~0.6 D750R/D751R
≤0.2
Disordered region
Sequence similarity
Disordered Structural similarity
region
Q9Y6G9_DYNC1LI1
Q69YN2_CWF19L1
0.6~0.8
P51812_RPS6KA3
Q9UDY4_DNAJB4
Q9H4H8_FAM83D
Q9GZL7_WDR12
Q9NZ63_C9orf78
P62136_PPP1CA
P25685_DNAJB1
Q9Y305_ACOT9
P61006_RAB8A
P14635_CCNB1
Q9NTZ6_RBM12
Q16629_SRSF7
O60828_PQBP1
Q96ES7_SGF29
O60568_PLOD3
Q9Y3C6_PPIL1
Q13247_SRSF6
Q16630_CPSF6
Q12931_TRAP1
Q07955_SRSF1
Q9UJU6_DBNL
0.4~0.6
P18615_NELFE
Q05048_CSTF1
Q01081_U2AF1
O00422_SAP18
Q8IWS0_PHF6
Q8N7H5_PAF1
Q86U70_LDB1
Q9BY42_RTF2
P24941_CDK2
P17844_DDX5
P29372_MPG
P33981_TTK
0.2~0.4
O00170_AIP
0.6 E73R
0.2~0.6 Y350R
≤0.2 D426R
Y433R
Disordered E478R
region
0.6~0.8 R748E
0.4~0.6 K802E/K803E
0.2~0.4
0.2 and ≤ 0.6 into 0.5, and > 0.6 into 1, as indicated by the magenta scale (Supplementary
Table S2a). Ward’s method was used among the cargoes with the Euclidean distances calculated from these discrete values. The
hierarchical clustering was performed using R version 3.5.1. The dashed line on the dendrogram is an arbitrary boundary to separate
the cargoes into five groups. The blue scale signifies the content rates of disordered regions, where ten or more consecutive residues are
predicted to be disordered. Sequence similarity was analyzed by SSEARCH, and homologous proteins (E-value 0.6) are designated by the same solid colors, and those
with similarity (0.6 > TM-score > 0.5) are represented by the same frame colors. Red asterisks indicate proteins annotated to have an
SR-domain (Arg/Ser-rich domain) in UniProt (https://www.uniprot.org), and blue asterisks indicate an RSY-rich s egment25 other than
the SR-domain. The proximal mutants of TrnSR are specified by the same color. (b) The Imp13 cargoes were clustered by the binding
intensities to the Imp13 mutants. Illustrated similarly to (a). The dashed line arbitrarily separates the cargoes into six groups.
Scientific Reports | (2021) 11:15649 | https://doi.org/10.1038/s41598-021-94948-1 11
Vol.:(0123456789)www.nature.com/scientificreports/
annotations (Supplementary Table S3a) overlapped with those of the structural similarity search. The fraction of
predicted disordered residues of the cargoes also appears irrelevant to the clustering (Fig. 7). Thus, the specific-
ity determination of the NTR–cargo interaction must result from more complicated or fortuitous mechanisms
than we expected.
Discussion
In this work, we analyzed the effects of NTR mutations on cargo binding. Biochemical studies with mutant
proteins may involve the risk of distant effects of overall structural collapse. However, most binding reductions
observed here are plausibly due to local effects of the mutations because, for each mutation, a certain number of
cargoes are unaffected, and the unaffected cargoes differ between mutations, even those which are proximal to
each other (Fig. 7 and Supplementary Table S2). Furthermore, in the verifiable cases, the mutant NTR-binding
cargo profiles agree with the reported structures (Fig. 6). In our mutagenesis, we preferentially selected residues
that contact cargoes in crystal structures regardless of their KL values, and then selected the other residues
located near cargoes and exhibiting high KL values, i.e., E398 and D409 of TrnSR and Y350 and R748 of Imp13.
As the four mutants are defective in binding to some cargoes, the combination of structural and evolutionary
considerations seems useful to predict amino acid positions significant for ortholog function. However, ETA by
itself is not sufficient to identify all cargo binding-related residues, because mutations at positions with lower KL
values (e.g., Y34/Y35 and E73 of Imp13) also affected cargo binding. Further analysis of more mutants should
help further delineate the utility and limitations of ETA in this setting. To analyze NTR–cargo binding, we applied
BHA, which is advantageous to analyze many samples but less quantitative than other methods such as isothermal
titration calorimetry or SPR. We reduced measurement deviation using the red fluorescent GST-mCherry-NTR
proteins and utilizing the GFP/mCherry ratios (Fig. 4). Based on this deviation, we set the threshold for a sig-
nificant reduction in NTR mutant assays as > 40% reduction from the WT value. Adjusting the concentrations
of all the cargoes within their linear ranges of NTR binding is difficult, and some of the cargoes were assayed at
near saturation levels (Fig. 4f, h, j). In those cases, a significant reduction in the GFP/mCherry value sufficiently
demonstrates reduced affinity to the NTR mutants, but values equal to that of WT do not necessarily indicate
a WT level of binding affinity. In the final assays, at least one NTR mutant reduced the GFP/mCherry value for
most of the respective cargoes (Fig. 7 and Supplementary Table S2a and b), indicating that the assay condition
was sufficient to specify the mutation that most impacted the binding to each cargo. Since the reduced-binding
NTR mutants and the degree of the binding reduction differed among the cargoes (Fig. 7 and Supplementary
Table S2a and b), respective cargoes are affected differently by a set of NTR mutations, presumably reflecting
NTR–cargo binding configuration diversity.
Another potential concern about our BHA is that we used bacterially expressed proteins devoid of eukary-
otic posttranslational modifications (PTMs). Many PTMs on both cargoes and NTRs affect binding s pecificity2;
for example, hypusinated EIF5A purified from HeLa cells binds to Xpo4–RanGTP complexes ~ 35 times more
strongly than unmodified recombinant E IF5A65. Thus, our assay may not precisely mirror the binding specificity
in vivo, but our results should still reflect the NTR–cargo binding configuration diversity. Degradation products
of GFP-cargo proteins in some bacterial extracts used (Supplementary Fig. S1) should also be noted. If degraded
cargo fragments have altered affinities to the NTR, the quantitation values in BHA may be deflected. However,
the value order of the NTR mutants in binding to a particular cargo can be assumed not to change, because this
kind of fragments can usually be regarded to affect uniformly on the values.
Most TrnSR cargoes have neither an SR-domain nor an RSY-rich segment expected to act as an NLS, and
no Imp13-specific NLS is known. Therefore, our results suggest that cargoes without a canonical NLS must
interact with varying contact sites on an NTR; at least, each position on an NTR contributes to the binding of
different cargo sets, and the degree of contribution also differs widely. Thus, the NTRs presumably accommodate
the diverse structures of NLS-less cargoes, differentially using multiple contact sites. Although our mutants do
not cover all possible cargo contact sites, they sufficiently elucidate the basic mechanism of cargo recognition.
Assuming that an NTR uses multiple contact sites in various combinations to interact with structurally diverse
cargoes, correlations among the cargo-binding profiles of NTR mutants may reflect the formation of an inter-
face common to some cargoes. The GFP/mCherry values of Imp13-Y34R/Y35R, -E73R, -Y350R, and -Y433R
have high correlation coefficients (Supplementary Table S2d), and the N-terminal region containing these sites
may form an interface that interacts with the cargoes at partially common and partially distinct contact sites.
The binding of UBE2I may be a good example that uses this interface. The cargoes affected by these mutations
are clustered proximally in the analysis in Fig. 7b, but we could not find the structural similarity among them.
A more advanced type of analysis may be needed to extract protein features useful to predict specific cargoes.
Not enough mutants were analyzed from TrnSR or other regions of Imp13 to discuss them in similar detail.
Nevertheless, our results support the idea extrapolated from a limited number of crystal structures that NTRs
bind to diverse cargoes differently.
TrnSR and Imp13 form one of the closest pairs in the Impβ family phylogram but share fewer cargoes3.
Although a high KL value in ETA is not essential for a cargo contact site, the selected positions with high KL
values appeared significant for the binding of the specific cargoes. Therefore, TrnSR and Imp13 might have
diverged evolutionarily from a common ancestral NTR to adapt to bind specific cargoes. In our phylogenetic
profiles of TrnSR and Imp13, TrnSR orthologs are widely conserved in eukaryotic species except for excavates,
whereas Imp13 orthologs are found only in unikonts (Supplementary Fig. S7). Thus, the functional divergence of
TrnSR and Imp13 is likely to have emerged after the divergence to unikonts. However, many Imp13 cargo genes
are found in unikonts and widely conserved in eukaryotic species. Moreover, we could not find any relevance
between the phylogenetic profiles of the cargoes and the clustering results based on the mutant NTR-binding
specificity. It might be possible that cargoes acquired after the divergence to unikonts were assigned to either
Scientific Reports | (2021) 11:15649 | https://doi.org/10.1038/s41598-021-94948-1 12
Vol:.(1234567890)www.nature.com/scientificreports/
TrnSR or Imp13 and also some of the cargoes already present before the divergence to unikonts were reassigned
to Imp13. For this type of reassignment, both cargoes and NTRs changed gradually and coevolutionarily during
the functional divergence. Consequently, some cargoes and NTRs may settle down to similar binding configura-
tions. There were a few mixed pairs of TrnSR and Imp13 cargoes sharing sequence similarities (p valuewww.nature.com/scientificreports/
outlines were fixed as ROIs, and larger ring-shaped regions with the same width but 5 pixels away outside the
outlines were established as BG regions (Fig. 3 and Supplementary Fig. S2). The same ROIs and BG regions were
applied to the corresponding GFP images. In the final assay, ~ 55%, ~ 40%, ~ 4.6%, and ~ 0.15% of the images
included one, two, three, and four beads as the ROIs, respectively. The mean intensities of these regions in an
image were quantified, and the value of GFP/mCherry = (ROIGFP-BGGFP)/(ROImCherry-BGmCherry) was used as the
index for NTR–cargo binding. Three images for one NTR–cargo pair were quantified and averaged, and then
the GFP/mCherry values of NTR mutants were normalized by dividing by that value of WT NTR binding to the
same cargo.
Statistical analysis of the results of bead halo assay. The Mann–Whitney U test was employed
to determine the statistical significance of the differences in GFP/mCherry values between WT and each mutant
NTR. In the reproducibility analysis (Supplementary Fig. S4a–f, left panels), all the GFP/mCherry values in trip-
licate were pooled and tested. In the final assay (Supplementary Table S2a and b), three values of each WT and
mutant NTR were tested, and the possible minimum p value was 0.05.
Localized surface plasmon resonance. LSPR experiments were performed on an OpenSPR instrument
(Nicoya) using NTA sensor tips (SEN AU NTA). TB containing 0.05% Tween-20 and excluding EGTA flowed at
20 µL/min as the running buffer, and proteins were injected for 217 s at 600-s intervals into the flow cell. After
the sensor was charged with N i2+ ions, 50 µg/mL His6-DNAJB1 was injected into channel 2, H is6-CBX1, which
does not bind to TrnSR (Supplementary Table S2a), was injected into channel 1 as a reference, and then varying
concentrations of GST-TrnSR (see Supplementary Fig. S5a and b) were injected into channels 1 and 2 to observe
the association. Dissociation in the buffer flow was observed continuously. The sensor tip was regenerated by
200 mM imidazole and 10 mM glycine–HCl (pH 1.5) and reused no more than three times. The resonance
intensity of channel 2 was corrected by subtracting that of channel 1, and the kinetic curves were fitted to the
one-to-one model using TraceDrawer 1.8 (Ridgeview Instruments) to derive k on, koff, and K
D.
Hierarchical clustering of the cargoes based on the difference in binding to the NTR
mutants. The cargoes were hierarchically clustered using Ward’s method as implemented in the software R
(version 3.5.1)78. Based on the experimentally estimated deviation of the BHA values (Fig. 4a–d), the normalized
GFP/mCherry ratios (Supplementary Table S2a and b) were converted into three discrete values: GFP/mCherry
ratios ≤ 0.2 into 0, > 0.2 and ≤ 0.6 into 0.5, and > 0.6 into 1. The Euclidean distances between the cargoes calcu-
lated from these discrete values were used as the metric.
Sequence and structural similarity search and disorder prediction. Sequence similarities among
the cargo proteins were computed using SSEARCH 36.3.8d79, and sequences with an E-value 0.6 were judged as highly similar and > 0.5 as similar. For protein regions whose structures are unknown,
templates for structural modeling were selected based on H Hpred81 alignment, and the structures were modeled
using Homology Model application in Molecular Operating Environment (MOE 2016.08; Chemical Computing
Group ULC, 1010 Sherbooke St. West, Suite #910, Montreal, QC, Canada, H3A 2R7).
Evolutionary profiles of TrnSR, Imp13, and their cargoes. Orthologous sequences of TrnSR and
Imp13 were searched using HMMER-2.2.0 for glocal a lignment82. For the glocal profile, an HMM was gen-
erated from a multiple sequence alignment produced using MAFFT73 with manually curated orthologous
sequences. Sequence search-based ortholog identification of the cargo proteins was conducted automatically
using OrthoMCL 2.0.983 with our proteome data sets in a previous study84.
RSY‑rich segment search. The sequences of TrnSR cargoes were scanned with sliding windows of 15–30
amino acids in length, and then the composition of R, S, and Y ( RSYcomp), dipeptide composition of RS, SR, SY,
and YS ( dipepRSYcomp), and SY and YS ( dipepSYcomp) were calculated to search for RSY-rich s egments25. Frag-
ments with RSYcomp > 0.3, dipepRSYcomp > 0.2, and dipepSYcomp > 0 were defined as RSY-rich segments.
Received: 11 August 2020; Accepted: 20 July 2021
References
1. Chook, Y. M. & Suel, K. E. Nuclear import by karyopherin-betas: recognition and inhibition. Biochim. Biophys. Acta 1593–1606,
2011. https://doi.org/10.1016/j.bbamcr.2010.10.014 (1813).
2. Kimura, M. & Imamoto, N. Biological significance of the importin-beta family-dependent nucleocytoplasmic transport pathways.
Traffic 15, 727–748. https://doi.org/10.1111/tra.12174 (2014).
3. Kimura, M. et al. Extensive cargo identification reveals distinct biological roles of the 12 importin pathways. Elife https://doi.org/
10.7554/eLife.21184 (2017).
4. Mackmull, M. T. et al. Landscape of nuclear transport receptor cargo specificity. Mol. Syst. Biol. 13, 962. https://doi.org/10.15252/
msb.20177608 (2017).
5. Dingwall, C. & Laskey, R. A. Nuclear targeting sequences–a consensus?. Trends Biochem. Sci. 16, 478–481 (1991).
Scientific Reports | (2021) 11:15649 | https://doi.org/10.1038/s41598-021-94948-1 14
Vol:.(1234567890)You can also read