Measurement report: In situ observations of deep convection without lightning during the tropical cyclone Florence 2018
←
→
Page content transcription
If your browser does not render page correctly, please read the page content below
Atmos. Chem. Phys., 21, 7933–7945, 2021
https://doi.org/10.5194/acp-21-7933-2021
© Author(s) 2021. This work is distributed under
the Creative Commons Attribution 4.0 License.

Measurement report: In situ observations of deep convection
without lightning during the tropical cyclone Florence 2018
Clara M. Nussbaumer1 , Ivan Tadic1 , Dirk Dienhart1 , Nijing Wang1 , Achim Edtbauer1 , Lisa Ernle1 ,
Jonathan Williams1,2 , Florian Obersteiner3 , Isidoro Gutiérrez-Álvarez4 , Hartwig Harder1 , Jos Lelieveld1,2 , and
Horst Fischer1
1 Department   of Atmospheric Chemistry, Max Planck Institute for Chemistry, Mainz, Germany
2 Climate   and Atmosphere Research Center, The Cyprus Institute, Nicosia, Cyprus
3 Institute of Meteorology and Climate Research – Atmospheric Trace Gases and Remote Sensing (IMK-ASF),

Karlsruhe Institute of Technology, Karlsruhe, Germany
4 Department of Integrated Sciences, Center for Natural Resources, Health and Environment (RENSMA),

University of Huelva, Huelva, Spain

Correspondence: Clara M. Nussbaumer (clara.nussbaumer@mpic.de)

Received: 28 January 2021 – Discussion started: 8 February 2021
Revised: 14 April 2021 – Accepted: 22 April 2021 – Published: 25 May 2021

Abstract. Hurricane Florence was the sixth named storm             ical Convergence Zone (ITCZ) (Frank and Roundy, 2006;
in the Atlantic hurricane season 2018. It caused dozens of         Deutscher Wetterdienst, 2020). The ITCZ is a global band
deaths and major economic damage. In this study, we present        of convection where southeasterly and northeasterly trade
in situ observations of trace gases within tropical storm Flo-     winds converge. It is characterized by rapidly changing
rence on 2 September 2018, after it had developed a rotating       weather events. Air heated by the sun near the Equator rises,
nature, and of a tropical wave observed close to the African       creating low pressures near the surface, which initiates flows
continent on 29 August 2018 as part of the research campaign       from adjacent areas (Waliser and Gautier, 1993; Wang and
CAFE Africa (Chemistry of the Atmosphere: Field Experi-            Magnusdottir, 2006; Deutscher Wetterdienst, 2020). In this
ment in Africa) with HALO (High Altitude and LOng Range            region of high ocean temperature and intense solar radi-
Research Aircraft). We show the impact of deep convection          ation, humid air can rise deeply into the troposphere up
on atmospheric composition by measurements of the trace            to 15 km and higher (Collier and Hughes, 2011; Deutscher
gases nitric oxide (NO), ozone (O3 ), carbon monoxide (CO),        Wetterdienst, 2020). This is associated with the formation
hydrogen peroxide (H2 O2 ), dimethyl sulfide (DMS) and             of deep, convective cumulonimbus clouds accompanied by
methyl iodide (CH3 I) and by the help of color-enhanced in-        heavy rainfall and thunderstorm activity (Zipser, 1994; Xu
frared satellite imagery taken by GOES-16. While both sys-         and Zipser, 2012). In the early stages, these systems are re-
tems, i.e., the tropical wave and the tropical storm, are deeply   ferred to as tropical waves or disturbances which together
convective, we only find evidence for lightning in the tropi-      with low wind shear and high ocean temperature of 26.5 ◦ C
cal wave using both in situ NO measurements and data from          or higher can form tropical cyclones (Frank and Roundy,
the World Wide Lightning Location Network (WWLLN).                 2006; Shapiro and Goldenberg, 1998; National Ocean Ser-
                                                                   vice, 2020b). Wu and Takahashi (2018) suggested that si-
                                                                   multaneous occurrence of convection and vorticity in dis-
                                                                   turbances favors tropical cyclone formation. However, the
1   Introduction                                                   exact formation mechanism of tropical cyclones from trop-
                                                                   ical waves is not fully understood today (Wu and Takahashi,
Tropical cyclones are low-pressure systems evolving over           2018; Frank and Roundy, 2006). Tropical cyclones are char-
warm tropical waters usually close to the Equator ( ± 20◦          acterized by their rotating nature around a center originating
latitude) – an area which includes the so-called Intertrop-

Published by Copernicus Publications on behalf of the European Geosciences Union.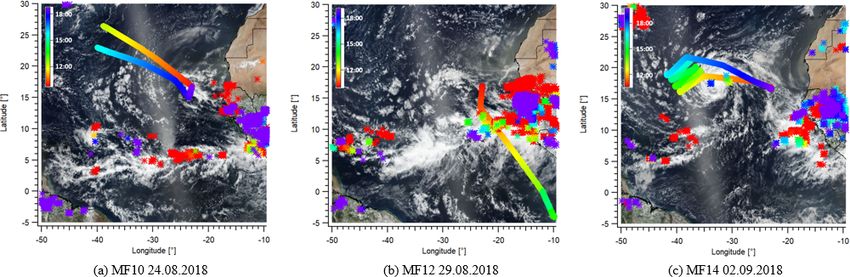
7934                                                       C. M. Nussbaumer et al.: In situ observations of deep convection

from Coriolis forces and the balance of the pressure gradi-       density with increasing storm strength. DeMaria et al. (2012)
ent (Smith et al., 2005; Gray, 1975). Consequently, tropical      additionally found greater lightning activity in intensifying
cyclones in the Northern Hemisphere spin counterclockwise         compared to weakening storms, which was also reported by
and in the Southern Hemisphere clockwise, while rotating          Zhang et al. (2015).
systems do not develop within about 5◦ latitude of the Equa-         Measurements of nitric oxide (NO) in the upper tropo-
tor (National Ocean Service, 2020a; Gray, 1975). Tropical         sphere can provide indirect evidence on the recent occur-
cyclones are categorized and named according to the max-          rence of lightning. The heat developed in lightning flashes
imum sustained wind speed and their geographic origin. A          allows the abundant N2 and O2 to atomize and then recom-
tropical cyclone formed over the Atlantic Ocean – most of-        bine to form NO (Murray, 2016; Huntrieser et al., 2011). In
ten west of the African continent – with a maximum wind           the upper troposphere, lightning is the main source of NO by
speed of 64 knots (118 km/h) and higher is defined as a hur-      around 80 %, whereas it only contributes about 10 % to the
ricane according to the Beaufort scale. Lower wind speeds         overall global NO budget (Schumann and Huntrieser, 2007;
of up to 34 knots (63 km/h) characterize a tropical depres-       Murray, 2016). Over the ocean, the only significant NO emis-
sion. Tropical cyclones with intermediate wind speed (34 to       sions are from lightning, ships and aircraft (Bond et al., 2002;
63 knots) are referred to as tropical storms (DeMaria et al.,     Masiol and Harrison, 2014). NO sources over land are more
2012; National Weather Service, 2020).                            versatile including anthropogenic emissions from industry,
   Deep convection can affect trace gas concentrations in the     vehicles and biomass burning (partly natural) as well as nat-
upper troposphere which was, for example, shown by Dick-          ural sources from lightning and soil, with the natural sources
erson et al. (1987), who reported increased concentrations        dominating over West Africa (Pacifico et al., 2019; Knippertz
of NO, CO, O3 and other reactive species in a thunderstorm        et al., 2015). One lightning flash produces approximately (2–
outflow over the Midwestern United Stated in 1985, and            40) × 1025 molecules of NO, which together with NO2 as
Barth et al. (2015), with the latter based on observations dur-   NOx have a lifetime of several days near the Equator (Pol-
ing the DC3 (Deep Convective Clouds and Chemistry) field          lack et al., 2016; Schumann and Huntrieser, 2007; Levy et al.,
campaign. Similar observations were made by Bucci et al.          1999).
(2020), who reported convective uplift in the upper tropo-           Other trace gases can be used to detect convective injection
sphere/lower stratosphere based on the StratoClim aircraft        from the marine boundary layer into the upper troposphere.
campaign over Nepal in 2017. It is usually observed along         These include near-surface emissions of carbon monoxide
with lightning. Collision of light ice particles moving up-       (CO) from the photolysis of dissolved organic matter (DOM)
wards in cumulonimbus clouds and graupel particles mov-           (Stubbins et al., 2006) and methyl iodide (CH3 I), which is
ing downwards due to gravity in the presence of supercooled       produced by algae and phytoplankton as well as aqueous
water induces electric charge separation which accumulates        photochemical processes and is released from the ocean with
and discharges spontaneously as a lightning flash (Lal et al.,    an atmospheric lifetime of 4–7 d (Tegtmeier et al., 2013; Bell
2014; Liu et al., 2012). Lightning events are frequent over       et al., 2002). Another possible source could be dust orig-
tropical continental areas such as South America or Africa        inated from the African continent which enters the sea or
where cloud-to-cloud lightning contributes to around 90 %         comes in contact with sea water vapor and produces methyl
(Williams and Sátori, 2004; Price and Rind, 1993). While          iodide as described by Williams et al. (2007). One possible
lightning events over the ocean are less frequent, they are       explanation for the formation of CH3 I is a substitution re-
subject to extensive research with regards to the occurrence      action of methoxy-group-containing species and iodide from
in tropical cyclones. Zipser (1994) reported significantly re-    seawater under the presence of iron ions from dust. How-
duced lightning activity over tropical oceans despite heavy       ever, the mechanism is not yet fully understood (Williams
rainfall from convective clouds in comparison to tropical         et al., 2007). Furthermore, phytoplankton forms dimethylsul-
continental and coastal areas with similar rainfall based on      foniopropionate (DMSP) in seawater, which is degraded to
shipborne observations during the GARP Atlantic Tropical          dimethyl sulfide (DMS) and emitted from the ocean’s surface
Experiment (GATE, where GARP represents the Global At-            (Simó and Dachs, 2002; Gondwe et al., 2003). Its lifetime
mospheric Research Program) in 1974. Lal et al. (2014) ob-        ranges from 1–2 d and depends on the atmospheric abun-
served higher lightning activity over continental compared        dance of OH and NO3 which oxidize DMS (Breider et al.,
to oceanic areas based on satellite data from 2000 to 2011.       2010). OH concentrations in turn are controlled by nitrogen
These results are in line with other published work, e.g., Ce-    oxides (NOx = NO + NO2 ) and ozone. The latter is formed
cil et al. (2014), Xu and Zipser (2012) and Xu et al. (2010).     by photolysis of NO2 with O2 and depends on ambient NO
Regarding tropical cyclones, DeMaria et al. (2012) reported       and hydrocarbons (Nussbaumer and Cohen, 2020). Photol-
more intense lightning activity in tropical storms compared       ysis of O3 and reaction with water vapor yield OH (Levy,
to hurricanes based on lightning data from the World Wide         1971; Lelieveld and Dentener, 2000; Tegtmeier et al., 2013).
Lightning Location Network (WWLLN) and satellite data on          NOx from lightning plays a key role in OH formation in the
tropical cyclones which is in agreement with findings from        free troposphere (Lelieveld et al., 2018; Brune et al., 2018).
Abarca et al. (2011), who reported a decrease in lightning        On the other hand, in NOx -poor conditions, e.g., in the ma-

Atmos. Chem. Phys., 21, 7933–7945, 2021                                             https://doi.org/10.5194/acp-21-7933-2021
C. M. Nussbaumer et al.: In situ observations of deep convection                                                            7935

rine boundary layer close to the surface, the concentrations      2   Observations
of peroxyradicals can build up, leading to O3 destruction and
high levels of H2 O2 (Ayers et al., 1992). Due to a strong sur-   The research campaign CAFE Africa took place from Au-
face uptake loss of H2 O2 , concentrations peak at mid-range      gust to September 2018 over West Africa and the central
altitudes (Weller and Schrems, 1993).                             eastern Atlantic. Fourteen measurement flights (MFs) were
   Hurricane Florence was the sixth named storm in the At-        performed with HALO (High Altitude and LOng Range Re-
lantic hurricane season of 2018 (AL062018) (Stewart and           search Aircraft) starting from the campaign base in Sal on
Berg, 2019). It developed from a tropical wave over West          Cabo Verde (16.75◦ N, 22.95◦ W). A detailed description of
Africa, which was first reported on 28 August by the Na-          the campaign is provided by Tadic et al. (2021).
tional Hurricane Center (NHC) Miami (FL, USA) (National              In this paper, we report observations based on three mea-
Hurricane Center, 2018c). On 31 August, a tropical depres-        surement flights – MF10, MF12 and MF14. Figure 1 shows
sion developed which was upgraded to a tropical storm by          an overview of the geographical locations of the three flights
the NHC on 1 September (National Hurricane Center, 2018a;         including satellite images obtained from NASA Worldview
Stewart and Berg, 2019). The tropical cyclone grew to hur-        on the day of observation. The images were taken by the
ricane strength on 4 September (National Hurricane Cen-           VIIRS (Visible Infrared Imaging Radiometer Suite) instru-
ter, 2018b). Hurricane Florence reached its maximum wind          ment carried by the NASA/NOAA satellite Suomi NPP (Na-
speed of 130 knots (category 4 hurricane) on 11 Septem-           tional Polar-orbiting Partnership) based on a daily resolution
ber and made landfall on 14 September in North Carolina. It       (NASA Worldview, 2020). MF10 was carried out on 24 Au-
claimed overall more than 50 deaths and caused USD 24 bil-        gust 2018 and was chosen as comparison flight as parts of it
lion worth of damage mainly from flooding in North Car-           were in close geographical proximity to MF14. We have re-
olina and South Carolina (Stewart and Berg, 2019; Paul et al.,    stricted our analysis to data from MF10 which were obtained
2019).                                                            in these parts in a similar geographical area and altitude range
   Some studies have investigated trace gas concentrations        as MF14 (as shown in Fig. 1a). MF12 was carried out on
and convective uplift in the upper troposphere through air-       29 August 2018 and passed over a tropical low-pressure sys-
craft observations. Newell et al. (1996) reported in situ ob-     tem which had recently moved off the West African coast.
servations of deep convection in Typhoon Mireille in 1991         Tropical cyclone Florence was passed over on 2 Septem-
which they found to be strongest in the wall cloud region.        ber 2018 in the scope of MF14 west of the Cabo Verde is-
They additionally detected enhanced NO concentrations in          lands after it was upgraded to a tropical storm.
the eye wall area and suggested lightning as a source based          The research aircraft carried multiple instruments for the
on observations reported by Davis et al. (1996). Roux et al.      measurement of various atmospheric trace gases including
(2020) found the convective uplift of boundary layer air as       NO, O3 , CO, H2 O2 , CH3 I and DMS. NO was measured
well as the inflow of lower stratospheric air to the upper tro-   via chemiluminescence (detector from ECO Physics CLD
posphere based on measurements of CO, O3 and H2 O during          790 SR, Dürnten, Switzerland) with a relative uncertainty of
aircraft typhoon observations over Taipei in 2016. In con-        6 % and a detection limit of 5 pptv (Tadic et al., 2020). O3
trast, studies of lightning activity within convective systems    mixing ratios were analyzed by UV absorption and chemi-
over the ocean and in tropical cyclones are predominantly         luminescence with the FAIRO instrument (chemilumines-
based on satellite data and ground-based observations from        cence data with a total uncertainty of 2.5 %; Zahn et al.,
the WWLLN (University of Washington, 2020; Abreu et al.,          2012). CO was measured via quantum cascade laser ab-
2010; Bürgesser, 2017; Hutchins et al., 2012b; Bucsela et al.,    sorption spectroscopy with an uncertainty of 4.3 % (Schiller
2019) Generally, data from in situ chemical measurements in       et al., 2008). H2 O2 mixing ratios were measured via dual-
the upper troposphere are sparse, and to our knowledge, the       enzyme detection (modified Aero-Laser AL2021, Garmisch-
in situ aircraft observation of deep convection in tropical cy-   Partenkirchen, Germany) with a total measurement uncer-
clones accompanied by and in the absence of lightning de-         tainty of 9 % and a detection limit of 15 pptv (Hottmann et al.,
pending on the stage of development has not been reported         2020). DMS was measured via proton-transfer-reaction time-
before. In this study, we present airborne in situ observations   of-flight mass spectrometry (PTR-TOF-MS-8000, Ionicon
of trace gases within a tropical wave on 29 August 2018 and       Analytik GmbH, Innsbruck, Austria) with a detection limit
of the tropical storm Florence on 2 September 2018 based          of 15 pptv (Wang et al., 2020; Edtbauer et al., 2020). CH3 I
on measurements during the aircraft campaign CAFE Africa          was measured with a custom-built fast gas-chromatography–
(Chemistry of the Atmosphere: Field Experiment in Africa).        mass-spectrometry system described by Bourtsoukidis et al.
The data are examined for evidence of the chemical impacts        (2017) with a detection limit of 0.5 pptv . Backward trajec-
of deep convection and lightning activity.                        tories were calculated using the Lagrangian particle disper-
                                                                  sion model FLEXPART 10.2 (Stohl et al., 2005; Pisso et al.,
                                                                  2019). Lightning data were obtained from the WWLLN
                                                                  (University of Washington, 2020). Satellite images were
                                                                  acquired from NASA Worldview (2020). Color-enhanced

https://doi.org/10.5194/acp-21-7933-2021                                           Atmos. Chem. Phys., 21, 7933–7945, 2021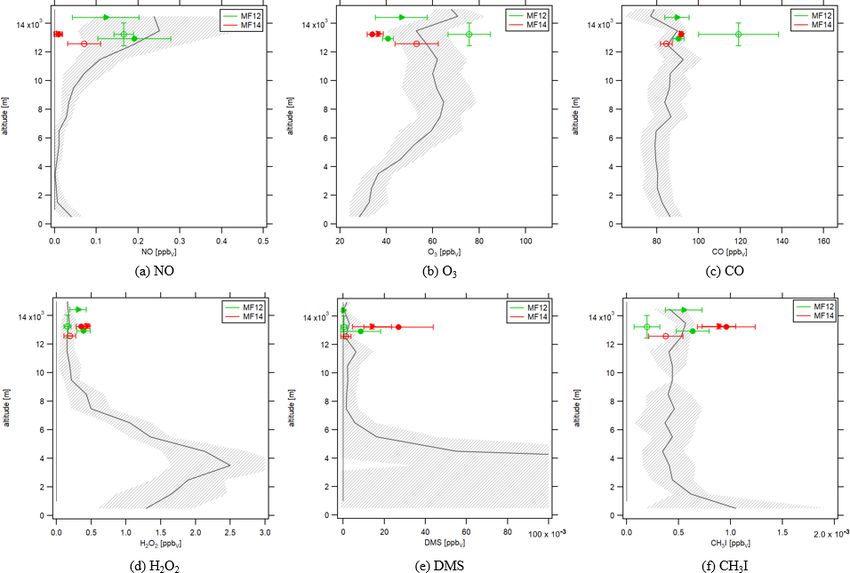
7936 C. M. Nussbaumer et al.: In situ observations of deep convection
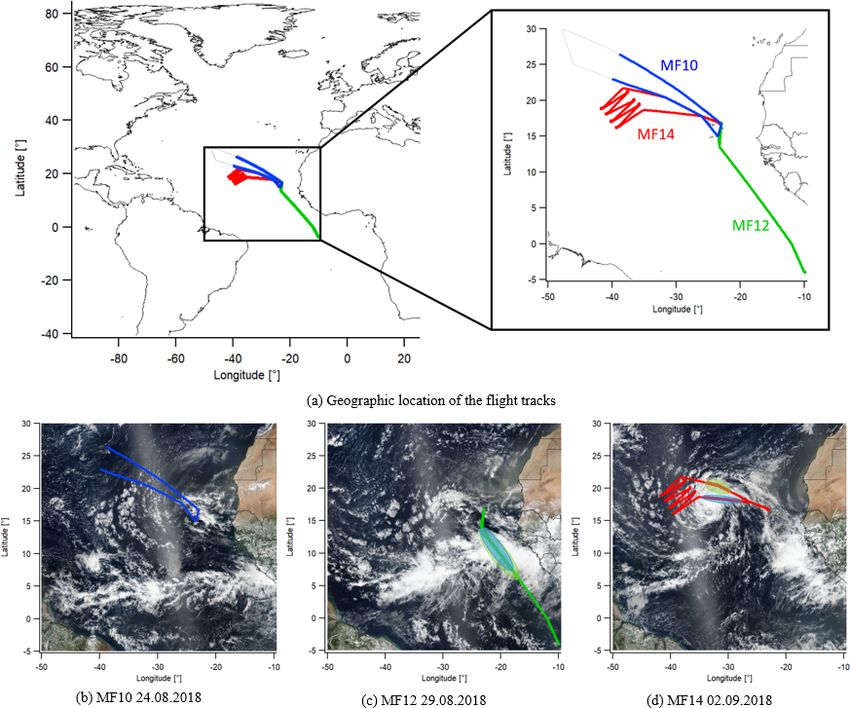
Figure 1. Overview of the flight tracks including satellite images obtained on the day of observation from the NASA Worldview application
(NASA Worldview, 2020). Blue: MF10 on 24 August as comparison flight. Green: MF12 on 29 August over the tropical wave. Red: MF14
on 2 September over tropical storm Florence. Marked areas indicate convection.
infrared imagery were obtained from the Naval Research tracks for MF12 and MF14. The satellite images are col-
Laboratory and from the Real-Time Tropical Cyclone web ored according to the temperature deduced from IR emis-
page maintained by the Cooperative Institute for Research sions of cloud tops in degrees Celsius (◦ C) as measured by
in the Atmosphere (CIRA), Colorado State University, and the satellite GOES-16 (Geostationary Operational Environ-
NOAA’s Center for Satellite Research, Fort Collins, Col- mental Satellite). The flight track is colored according to the
orado (Naval Research Laboratory, 2020; CIRA and NOAA, IR temperature scale showing the ambient temperature mea-
2018). sured on the research aircraft, which was mainly between
−50 and −60 ◦ C. The IR images give information on the oc-
currence of convective clouds. It can be assumed that the IR
3 Results and discussion temperature of a cloud top is equal to the ambient tempera-
ture at that altitude. Accordingly, lower IR temperatures rep-
3.1 Cloud top
resent clouds at higher altitudes. The flight altitude for MF12
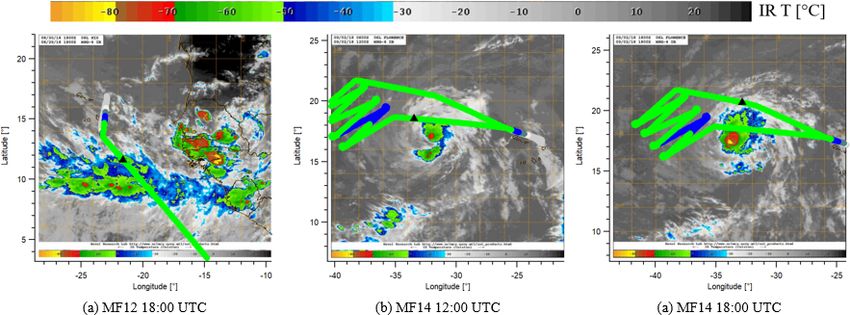
Figure 2 shows the color-enhanced infrared imagery obtained at 18:00 UTC shown in Fig. 2a was 14.4 km while passing
from the Naval Research Laboratory including the flight over an area of elevated clouds. The corresponding temper-
Atmos. Chem. Phys., 21, 7933–7945, 2021 https://doi.org/10.5194/acp-21-7933-2021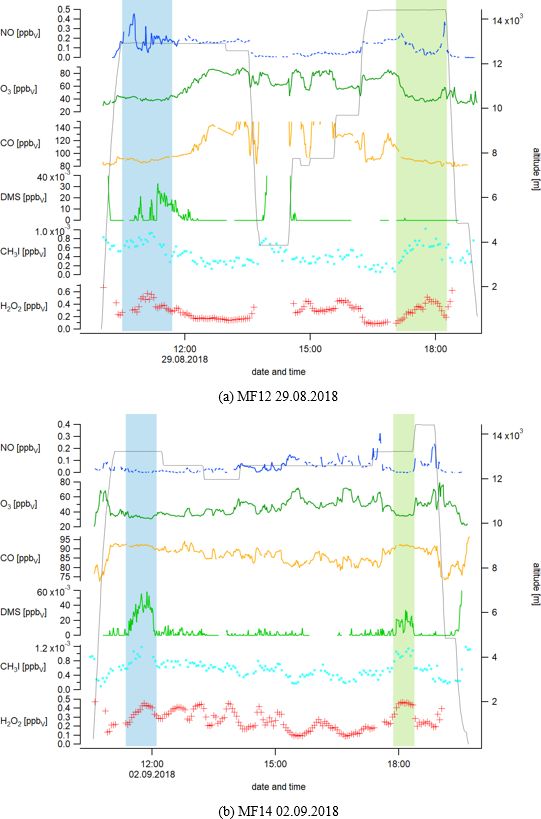
C. M. Nussbaumer et al.: In situ observations of deep convection                                                                   7937

Figure 2. Flight tracks with color-enhanced infrared imagery obtained from the Naval Research Laboratory Tropical Cyclone page (Naval
Research Laboratory, 2020) for MF12 and MF14 (no image availability before MF12 18:00 UTC). The altitude of the flight tracks is colored
according to the IR temperature legend. The temperature during most parts of the flight was between −50 and −60 ◦ C. Black triangles show
the according position of the research aircraft for the time of the background IR image.

ature was −68 ± 1 ◦ C, so the aircraft was likely above the            ing the area of enhanced cloud tops after take-off with an
cloud top. For MF12, the same area was passed in the morn-             average of 41 ± 2 ppbv (10:30–11:45 UTC). The IR satel-
ing at an altitude of 12.9 km, but no IR image is available.           lite image subsequently shows lower cloud tops, and the
The temperature was −56 ± 1 ◦ C. Assuming a similar cloud              measured O3 concentrations at the same flight altitude of
elevation in the morning, the research aircraft was at a sim-          12.9 km were on average 69 ± 15 ppbv (11:45–12:55 UTC).
ilar altitude as the cloud top. The flight altitude for MF14           The same area of high cloud tops was passed on the way
at 12:00 and at 18:00 UTC as shown in Fig. 2b and c was                back at a higher flight altitude of 14.4 km. Before entering
13.2 km, and the temperature was −58 ± 1 ◦ C. The colored              the area, O3 was on average 76 ± 5 ppbv (16:15–17:00 UTC)
IR images show an IR temperature between −40 and −50 ◦ C               and then decreased to 46 ± 11 ppbv (17:05–18:15 UTC). For
at the current aircraft position (black triangle), which indi-         MF14, the research aircraft also passed an area of elevated
cates that the research aircraft was above but close to cloud          cloud tops after take-off (11:20–12:05 UTC) and before land-
top at both occasions.                                                 ing (17:50–18:25 UTC) with O3 average concentrations of
                                                                       34 ± 2 and 36 ± 2 ppbv , respectively, at a flight altitude of
3.2   Trace gas measurements                                           13.2 km. O3 concentrations measured between these areas
                                                                       were higher by around 30 % with 48 ± 10 ppbv at an altitude
Deep convective transport generally occurs in cumulonimbus             of 12.6 ± 0.3 km. At similar altitudes, MF10 showed O3 con-
systems accompanied by high cloud tops. Figure 3 shows                 centrations of 72 ± 6 ppbv . Besides the observed convective
the temporal development of the observed trace gases dur-              influence from the O3 measurements, concentrations were
ing MF12 and MF14. An overview of MF10 can be found in                 overall larger for MF10 and MF12 compared to MF14. This
Fig. S1 of the Supplement. Blue and green shadowed plot ar-            is likely a response to NO concentrations which influence O3
eas show the time intervals when the research aircraft had             production as discussed further below.
passed areas of high cloud tops as shown in Fig. 2. The                   For MF12, DMS was significantly enhanced when pass-
respective geographical positions of the aircraft are high-            ing the area of high cloud tops in the morning with a max-
lighted in Fig. 1c and d. Indicators for deep convection               imum value of 33 pptv and varying between 0 and 18 pptv
from the marine boundary layer are enhanced concentra-                 at the same flight altitude outside this area. No DMS was
tions of CO, DMS, H2 O2 and CH3 I as well as reduced O3                detected when passing the convective area in the evening,
at the flight altitude. In the absence of lightning, we ex-            which is possibly due to the higher altitude of the research
pect decreased concentrations of NO in convective areas                aircraft compared to the morning hours. The IR cloud top
due to the vertical transport of NO-poor marine boundary               images in Fig. 2a show that the aircraft was likely above the
layer air. In contrast, we expect enhanced NO concentra-               cloud top while the convective influence is highest within
tions in the presence of lightning (Pollack et al., 2016; Ri-          the cloud. DMS concentrations during MF14 were on av-
dley et al., 2004; Lange et al., 2001; DeCaria et al., 2000;           erage 27 ± 17 and 14 ± 9 pptv passing the first and the sec-
Chameides et al., 1987). For MF12, O3 was low while pass-

https://doi.org/10.5194/acp-21-7933-2021                                                 Atmos. Chem. Phys., 21, 7933–7945, 2021
7938 C. M. Nussbaumer et al.: In situ observations of deep convection Figure 3. Overview of the temporal development of the observed trace gases NO, O3 , CO, DMS, CH3 I and H2 O2 during measurement flights MF12 and MF14. Blue and green bars show the time intervals for which the research aircraft had passed high cloud tops (compare Fig. 1c and d). The overview for MF10 can be found in Fig. S1 of the Supplement. ond high cloud top area, respectively, and below the detection parable altitudes for the whole flight. CH3 I and H2 O2 , too, limit in between, which clearly shows the effect of convec- reached maximum concentrations when passing high cloud tion from the marine boundary layer. A maximum value of top areas during MF12 and MF14 and lower values at simi- 58 pptv was reached passing the first cloud top area, which lar altitudes with lower cloud tops. NO concentrations were was higher compared to the MF12 maximum. For MF10, 169 ± 85 pptv for MF10 at 13.6 ± 0.7 km. For the identified DMS concentrations were below the detection limit at com- convective areas during MF14, NO was close to zero (0– Atmos. Chem. Phys., 21, 7933–7945, 2021 https://doi.org/10.5194/acp-21-7933-2021
C. M. Nussbaumer et al.: In situ observations of deep convection                                                                  7939

Figure 4. Vertical profiles of the background trace gas concentrations during CAFE Africa around Cabo Verde (gray) and the average trace
gas concentrations for convective (filled symbols) and non-convective (open symbols) areas during MF12 (green) and MF14 (red).

37 pptv ) and slightly enhanced in between with an average            flight data were influenced by convective processes with up-
value of 56 ± 50 pptv . These observations demonstrate the            ward transport of low NO air from the marine boundary layer.
occurrence of convection and the absence of lightning. In             Assuming dominant NOx -limited chemistry as suggested by
contrast, MF12 showed clear signs of lightning, particularly          Tadic et al. (2021), low NO background levels induce low
when passing the identified convective area in the morn-              O3 levels. In the convective areas during MF14 with par-
ing. The measured NO concentrations showed characteris-               ticularly low NO concentrations, an O3 destruction regime
tic spikes with a maximum of 459 pptv , which is by more              might have been present. In contrast, high NO background
than 1 order of magnitude higher than the detected signals            levels during MF10 and MF12 led to the observed high O3
during MF14. NO concentrations for MF12 outside the con-              background as mentioned earlier. CO background levels for
vective areas were 169 ± 21 pptv which is very similar to             MF10 were 84 ± 7 ppbv . For MF14, CO was enhanced when
NO levels during MF10. Backward trajectories for MF10                 passing high cloud tops with 92 ± 1 ppbv and lower in be-
and MF12 (outside of convection) (Fig. S2 of the Supple-              tween these areas with 86 ± 3 ppbv , which emphasizes the
ment) show that the air originated from the African conti-            updraft of CO-rich air from the earth’s surface. CO concen-
nent where lightning is frequent. Together with the absence           trations in the high cloud top areas for MF12 were compa-
of large spikes as observed for MF12 in the area of high cloud        rable to those for MF14 but significantly lower compared to
tops – an indicator for fresh lightning – the increased back-         adjacent areas with low cloud tops observed in the Southern
ground level of NO for MF10 and MF12 was likely due to                Hemisphere. From these observations, it seems that the in-
aged nitric oxide from thunderstorm activity over the ITCZ,           flow to the thunderstorms was in the Northern Hemisphere,
mainly West Africa. Possible explanations for the lower NO            while the background mixing ratios of CO were higher in the
background concentration during MF14 could be that the                Southern Hemisphere due to biomass burning.
flight path was further away from coastal Africa and that the

https://doi.org/10.5194/acp-21-7933-2021                                                Atmos. Chem. Phys., 21, 7933–7945, 2021
7940                                                          C. M. Nussbaumer et al.: In situ observations of deep convection

   Figures S3 and S4 of the Supplement show the flight tracks        Average concentrations in convective areas were reduced for
of MF12 and MF14, respectively, color-coded according to             both MF12 and MF14, while they were enhanced in non-
the measured trace gas concentrations which underlines the           convective areas. Low-altitude CO concentrations were en-
geographic allocation of the convective areas.                       hanced through ocean emissions and transport from the con-
                                                                     tinent and led to a slight increase in concentrations in con-
3.3    Deep convection                                               vective areas. As described above, the non-convective area of
                                                                     MF12 was heavily influenced by a biomass burning plume.
Figure 4 shows the vertical concentration profiles of atmo-          The H2 O2 background profile shown in Fig. 4d peaks at
spheric trace gases averaged for all CAFE Africa take-offs           around 3–4 km altitude where the NO profile is lowest. NO-
and landings on Cabo Verde in gray. Flights before sunrise           poor air induces an O3 destructive regime, enhancing the
and after sunset were excluded for NO, O3 , CO, H2 O2 and            abundance of peroxyradicals forming H2 O2 . Ground-level
DMS. Figure S5a of the Supplement shows an overview of               H2 O2 was lower due to surface uptake. Non-convective areas
all data points that were included. Generally, for take-off and      of MF12 and MF14 are well represented by the H2 O2 back-
landing the data points before reaching and after leaving a          ground profile, while concentrations in convective areas were
constant flight altitude, respectively, were considered. CH3 I       enhanced. DMS and CH3 I (Fig. 4e and f) were elevated at
data were available for MF11, MF12, MF14 and MF15. Each              low altitudes due to ocean emissions and possibly dust emis-
data point in the vertical profile is the average of all data mea-   sions and decreased with altitude. Again, concentrations of
sured at this altitude ± 500 m, providing a background profile       trace gases in convective areas showed an enhancement com-
of atmospheric trace gases around Cabo Verde. Please note            pared to non-convective areas. Figure S7 of the Supplement
that these profiles represent background conditions in the           presents the background profiles including average concen-
Northern Hemisphere. Southern Hemisphere profiles gener-             trations of MF10 and MF14. As expected, values for MF10
ally show higher mixing ratios for CO and O3 due to biomass          are well described by the background profiles. For the trace
burning over southern Africa and throughout the hemisphere           gases CO, H2 O2 and DMS, open symbols (representing non-
(Fig. S6 of the Supplement). Red colors represent MF14 and           convective average concentrations) for MF10 and MF14 are
green colors show MF12. Filled symbols represent areas with          situated very close to the background profile. Filled symbols
convection, and open symbols represent areas without con-            for MF14 are enhanced, which corroborates the effect of con-
vection according to the results from Sect. 3.2. For filled          vection. For O3 and NO, convective average concentrations
symbols, we differentiate between circles for the first pass-        were significantly reduced, while again open symbols fall
ing of a convective area and triangles for the second pass-          within the variability range of the background profile. NO
ing. An overview of the symbols representing certain flight          concentrations for MF14 were slightly lower compared to
sections can be found in Fig. S5b of the Supplement. Fig-            MF10 for non-convective areas due to the reasons discussed
ure 4a shows NO concentrations which are lowest at low alti-         above.
tudes and increase with height. Ground-level concentrations             While the discussed trace gases usually have a relatively
were slightly enhanced due to airport emissions but can be           short lifetime of the order of days, it is also possible that
assumed negligible at ground-level altitudes over the ocean          convection has occurred in a different location, and the trace
surface. The large enhancement and increased variability of          gases were transported to the point of observation through
NO at altitudes above 10 km was due to the overall effect of         advection. Backward trajectories can be used to examine this
lightning associated with the position of the ITCZ just south        hypothesis. Figures S8 and S9 of the Supplement show the
of the Cabo Verde islands (Fig. 2 of Tadic et al., 2021). Av-        color-enhanced infrared satellite images of MF14 including
erage NO concentrations for MF14 in convective areas were            the flight track and the backward trajectories for the prior
close to zero – emphasizing the vertical updraft of NO-poor          5 d. Black crosses mark the location of each calculated “air
air from the marine boundary layer – while NO in the non-            parcel” on its trajectory at the time when the satellite im-
convective area was enhanced. All data points for MF12 are           age was taken. It is shown that the backward trajectories are
within the variability range of the background profile, which        crossing the convective clouds of the developing cyclone sev-
is what we expect for non-convective areas. For the MF12             eral times. In contrast, Fig. S10 of the Supplement shows
convective areas, two opposing trends appear which are the           the analogous images for a section of the flight track further
vertical transport of NO-poor air from ground-level altitudes        west where convection was not observed. The calculated air
and the generation of fresh NO at high altitudes through             parcels on the backward trajectories were ahead of the de-
lightning. From Fig. 3a, we suggested the occurrence of fresh        veloping cyclone at all times and never passed a convective
lightning primarily for the early passing of the convective          system.
area. This is in accordance with the green circle (first pass-
ing) being situated at higher NO levels compared to the green        3.4   Lightning
triangle (second passing). O3 concentrations are shown in
Fig. 4b. Ground-level O3 was low, increasing with altitude           In Sect. 3.1, 3.2 and 3.3, we have presented evidence on the
up to 8 km, and reaching a concentration of 61 ± 6 ppbv aloft.       occurrence of deep convection during MF12 and MF14. We

Atmos. Chem. Phys., 21, 7933–7945, 2021                                                https://doi.org/10.5194/acp-21-7933-2021
C. M. Nussbaumer et al.: In situ observations of deep convection 7941
Figure 5. Lightning flashes shown as asterisks detected by the WWLLN on 24 and 29 August and 2 September 2018. Flashes and flight
tracks are color-coded according to the time of day (Red shows morning hours and blue shows evening hours.) Background satellite images
were obtained from the NASA Worldview application (NASA Worldview, 2020).
have hypothesized from the observed NO concentrations in 4 Conclusions
the convective areas that the low-pressure system observed
during MF12 included lightning, while the tropical storm ob- In this study, we have presented in situ observations of a
served during MF14 did not show any lightning activity. Fig- tropical cyclone which developed into hurricane Florence
ure 5 shows the lightning strokes as asterisks and the flight during the Atlantic hurricane season 2018. A nascent low-
tracks as lines for MF10 (Fig. 5a), MF12 (Fig. 5b) and MF14 pressure system was observed during a measurement flight
(Fig. 5c) color-coded according to the time of day obtained with HALO on 29 August and after a tropical storm had de-
from the WWLLN. The WWLLN provides real-time light- veloped on 2 September. We observed deep convection for
ning data covering almost the entire globe including oceans both the tropical wave and the tropical storm, based on in
and remote locations. This is accompanied by a lower de- situ observations, supported by color-enhanced infrared im-
tection efficiency compared to local networks. Several stud- agery taken by the satellite GOES-16. Measured NO concen-
ies have investigated this topic suggesting a WWLLN global trations suggest significant occurrence of lightning only in
detection efficiency of around 10 % with constant improve- the tropical wave but not in the tropical storm. This hypoth-
ments through an increasing number of stations (Holzworth esis is confirmed by the lightning strokes detected through
et al., 2019; Bürgesser, 2017; Virts et al., 2013; Abarca et al., the WWLLN. Our result is consistent with previous studies,
2010). Allen et al. (2019) calculated a detection efficiency e.g., DeMaria et al. (2012), Zhang et al. (2015) and Abarca
of around 12 % for tropical Africa (long. −30 to 90◦ , lat. et al. (2011), who found decreasing lightning activities with
−30 to 30◦ ) and of around 30 % for tropical America (long. increasing cyclone strength. While these studies are based on
−150 to −30◦ , lat. −30 to 30◦ ) for 2011. At the same time, satellite and ground-based observations, we present the first
the WWLLN is capable of detecting almost any storm with in situ observations in support of this hypothesis demonstrat-
lightning (Hutchins et al., 2012a; Jacobson et al., 2006). As ing that convective injection of marine boundary layer air can
expected, no lightning strokes were observed during MF10. occur without NO production from lightning. In future, more
For MF12, many lightning strokes were detected in the area in situ observations of deep convection and lightning activ-
with deep convection – many of which occurred in spatial ity in tropical cyclones with varying strength should be per-
and temporal proximity to the research aircraft. Figure 5b formed and reported in order to consolidate and expand the
only shows the outbound flight part of MF12 as the inbound present knowledge of lightning in deep convective systems
flight was stacked and much of the lightning occurred be- and its role in atmospheric chemistry.
tween take-off and noon. Finally, for MF14, very few light-
ning strokes were detected by the WWLLN in the area of the
tropical storm, which is in accordance with the low observed Data availability. Data measured during the flight campaign CAFE
NO concentrations. Africa are available to all scientists agreeing to the CAFE Africa
data protocol. Lightning data are available upon request from the
World Wide Lightning Location Network.
https://doi.org/10.5194/acp-21-7933-2021 Atmos. Chem. Phys., 21, 7933–7945, 20217942 C. M. Nussbaumer et al.: In situ observations of deep convection
Supplement. The supplement related to this article is available on- in tropical cyclones, Mon. Weather Rev., 139, 175–191,
line at: https://doi.org/10.5194/acp-21-7933-2021-supplement. https://doi.org/10.1175/2010MWR3383.1, 2011.
Abreu, D., Chandan, D., Holzworth, R., and Strong, K.: A perfor-
mance assessment of the World Wide Lightning Location Net-
Author contributions. HF had the idea. CMN and HF designed the work (WWLLN) via comparison with the Canadian Lightning
study. CMN analyzed the data and wrote the article. IT measured Detection Network (CLDN), Atmos. Meas. Tech., 3, 1143–1153,
and provided the NO and CO data. DD measured and provided the https://doi.org/10.5194/amt-3-1143-2010, 2010.
H2 O2 data. JW, AE, NW and LE measured and provided the DMS Allen, D. J., Pickering, K. E., Bucsela, E., Krotkov, N.,
and CH3 I data. O3 data were received from FO. HH and IGA cal- and Holzworth, R.: Lightning NOx production in the trop-
culated the backward trajectories. HF, JL, HH and JW significantly ics as determined using OMI NO2 retrievals and WWLLN
contributed to planning and operating the research campaign. stroke data, J. Geophys. Res.-Atmos., 124, 13498–13518,
https://doi.org/10.1029/2018JD029824, 2019.
Ayers, G., Penkett, S., Gillett, R., Bandy, B., Galbally, I., Meyer, C.,
Competing interests. The authors declare that they have no conflict Elsworth, C., Bentley, S., and Forgan, B.: Evidence for photo-
of interest. chemical control of ozone concentrations in unpolluted marine
air, Nature, 360, 446–449, https://doi.org/10.1038/360446a0,
1992.
Barth, M. C., Cantrell, C. A., Brune, W. H., Rutledge, S. A., Craw-
Acknowledgements. We would like to thank Uwe Parchatka for his
ford, J. H., Huntrieser, H., Carey, L. D., MacGorman, D., Weis-
assistance with the measurement of NO, Bettina Hottmann for her
man, M., Pickering, K. E., Bruning, E., Anderson, B., Apel,
support of the measurement of H2 O2 and Efstratios Bourtsoukidis
E., Biggerstaff, M., Campos, T., Campuzano-Jost, P., Cohen,
for his assistance with the measurement of methyl iodide during
R., Crounse, J., Day, D. A., Diskin, G., Flocke, F., Fried, A.,
CAFE Africa. We acknowledge the collaboration with the DLR
Garland, C., Heikes, B., Honomichl, S., Hornbrook, R., Huey,
(German Aerospace Center) during CAFE Africa. We acknowledge
L. G., Jimenez, J. L., Lang, T., Lichtenstern, M., Mikoviny,
the Cooperative Institute for Research in the Atmosphere, Colorado
T., Nault, B., O’Sullivan, D., Pan, L. L., Peischl, J., Pollack,
State University, and NOAA’s Center for Satellite Research, Fort
I., Richter, D., Riemer, D., Ryerson, T., Schlager, H., Clair,
Collins, Colorado, for using imagery from the Real-Time Tropical
J. S., Walega, J., Weibring, P., Weinheimer, A., Wennberg, P.,
Cyclone web page. We acknowledge the Naval Research Labora-
Wisthaler, A., Wooldridge, P. J., and Ziegler, C.: The deep con-
tory for providing IR satellite images on the NRL Tropical Cyclone
vective clouds and chemistry (DC3) field campaign, Bull. Am.
Page. The authors wish to thank the World Wide Lightning Loca-
Meteorol. Soc., 96, 1281–1309, https://doi.org/10.1175/BAMS-
tion Network (http://wwlln.net, last access: 18 December 2020),
D-13-00290.1, 2015.
which is a collaboration among over 50 universities and institu-
Bell, N., Hsu, L., Jacob, D. J., Schultz, M., Blake, D., But-
tions, for providing the lightning location data used in this paper.
ler, J., King, D., Lobert, J., and Maier-Reimer, E.: Methyl io-
We acknowledge the use of imagery from the NASA Worldview
dide: Atmospheric budget and use as a tracer of marine con-
application (https://worldview.earthdata.nasa.gov, last access: 7 De-
vection in global models, J. Geophys. Res.-Atmos., 107, D17,
cember 2020), which is part of the NASA Earth Observing System
https://doi.org/10.1029/2001JD001151, 2002.
Data and Information System (EOSDIS). This work was supported
Bond, D. W., Steiger, S., Zhang, R., Tie, X., and Orville, R. E.:
by the Max Planck Graduate Center (MPGC) with the Johannes
The importance of NOx production by lightning in the tropics,
Gutenberg-Universität Mainz.
Atmos. Environ., 36, 1509–1519, https://doi.org/10.1016/S1352-
2310(01)00553-2, 2002.
Bourtsoukidis, E., Helleis, F., Tomsche, L., Fischer, H., Hof-
Financial support. The article processing charges for this open- mann, R., Lelieveld, J., and Williams, J.: An aircraft gas
access publication were covered by the Max Planck Society. chromatograph–mass spectrometer System for Organic Fast
Identification Analysis (SOFIA): design, performance and
a case study of Asian monsoon pollution outflow, Atmos.
Review statement. This paper was edited by Christopher Cantrell Meas. Tech., 10, 5089–5105, https://doi.org/10.5194/amt-10-
and reviewed by two anonymous referees. 5089-2017, 2017.
Breider, T., Chipperfield, M., Richards, N., Carslaw, K., Mann, G.,
and Spracklen, D.: Impact of BrO on dimethylsulfide in the re-
mote marine boundary layer, Geophys. Res. Lett., 37, L02807,
https://doi.org/10.1029/2009GL040868, 2010.
References Brune, W. H., Ren, X., Zhang, L., Mao, J., Miller, D. O., Ander-
son, B. E., Blake, D. R., Cohen, R. C., Diskin, G. S., Hall, S.
Abarca, S. F., Corbosiero, K. L., and Galarneau Jr., T. J.: R., Hanisco, T. F., Huey, L. G., Nault, B. A., Peischl, J., Pol-
An evaluation of the worldwide lightning location network lack, I., Ryerson, T. B., Shingler, T., Sorooshian, A., Ullmann,
(WWLLN) using the national lightning detection network K., Wisthaler, A., and Wooldridge, P. J.: Atmospheric oxidation
(NLDN) as ground truth, J. Geophys. Res.-Atmos., 115, D18206, in the presence of clouds during the Deep Convective Clouds and
https://doi.org/10.1029/2009JD013411, 2010. Chemistry (DC3) study, Atmos. Chem. Phys., 18, 14493–14510,
Abarca, S. F., Corbosiero, K. L., and Vollaro, D.: The World https://doi.org/10.5194/acp-18-14493-2018, 2018.
Wide Lightning Location Network and convective activity
Atmos. Chem. Phys., 21, 7933–7945, 2021 https://doi.org/10.5194/acp-21-7933-2021C. M. Nussbaumer et al.: In situ observations of deep convection 7943
Bucci, S., Legras, B., Sellitto, P., D’Amato, F., Viciani, S., Montori, tant mechanism in the transport of air pollutants, Science, 235,
A., Chiarugi, A., Ravegnani, F., Ulanovsky, A., Cairo, F., and 460–465, https://doi.org/10.1126/science.235.4787.460, 1987.
Stroh, F.: Deep-convective influence on the upper troposphere– Edtbauer, A., Stönner, C., Pfannerstill, E. Y., Berasategui, M.,
lower stratosphere composition in the Asian monsoon anticy- Walter, D., Crowley, J. N., Lelieveld, J., and Williams, J.: A
clone region: 2017 StratoClim campaign results, Atmos. Chem. new marine biogenic emission: methane sulfonamide (MSAM),
Phys., 20, 12193–12210, https://doi.org/10.5194/acp-20-12193- dimethyl sulfide (DMS), and dimethyl sulfone (DMSO2) mea-
2020, 2020. sured in air over the Arabian Sea, Atmos. Chem. Phys., 20, 6081–
Bucsela, E. J., Pickering, K. E., Allen, D. J., Holzworth, R. H., and 6094, https://doi.org/10.5194/acp-20-6081-2020, 2020.
Krotkov, N. A.: Midlatitude lightning NOx production efficiency Frank, W. M. and Roundy, P. E.: The role of tropical waves
inferred from OMI and WWLLN data, J. Geophys. Res.-Atmos., in tropical cyclogenesis, Mon. Weather Rev., 134, 2397–2417,
124, 13475–13497, https://doi.org/10.1029/2018JD029824, https://doi.org/10.1175/MWR3204.1, 2006.
2019. Gondwe, M., Krol, M., Gieskes, W., Klaassen, W., and
Bürgesser, R. E.: Assessment of the world wide lightning location De Baar, H.: The contribution of ocean-leaving DMS
network (WWLLN) detection efficiency by comparison to the to the global atmospheric burdens of DMS, MSA, SO2 ,
lightning imaging sensor (LIS), Q. J. Roy. Meteorol. Soc., 143, and NSS SO= 4 , Global Biogeochem. Cy., 17, 1056,
2809–2817, https://doi.org/10.1002/qj.3129, 2017. https://doi.org/10.1029/2002GB001937, 2003.
Cecil, D. J., Buechler, D. E., and Blakeslee, R. J.: Gray, W. M.: Tropical cyclone genesis, Atmos. Sci. Paper, PhD the-
Gridded lightning climatology from TRMM-LIS and sis, 234, chap. 4, p. 37, 1975.
OTD: Dataset description, Atmos. Res., 135, 404–414, Holzworth, R., McCarthy, M., Brundell, J., Jacobson,
https://doi.org/10.1016/j.atmosres.2012.06.028, 2014. A., and Rodger, C.: Global distribution of super-
Chameides, W., Davis, D., Bradshaw, J., Rodgers, M., Sandholm, bolts, J. Geophys. Res.-Atmos., 124, 9996–10005,
S., and Bai, D.: An estimate of the NOx production rate in electri- https://doi.org/10.1029/2019JD030975, 2019.
fied clouds based on NO observations from the GTE/CITE 1 fall Hottmann, B., Hafermann, S., Tomsche, L., Marno, D., Mar-
1983 field operation, J. Geophys. Res.-Atmos., 92, 2153–2156, tinez, M., Harder, H., Pozzer, A., Neumaier, M., Zahn, A.,
https://doi.org/10.1029/JD092iD02p02153, 1987. Bohn, B., Stratmann, G., Ziereis, H., Lelieveld, J., and Fis-
CIRA and NOAA: AL062018 – Major Hurricane FLORENCE, cher, H.: Impact of the South Asian monsoon outflow on atmo-
available at: https://rammb-data.cira.colostate.edu/tc_realtime/ spheric hydroperoxides in the upper troposphere, Atmos. Chem.
storm.asp?storm_identifier=al062018 (last access: 17 Decem- Phys., 20, 12655–12673, https://doi.org/10.5194/acp-20-12655-
ber 2020), 2018. 2020, 2020.
Collier, A. B. and Hughes, A. R.: Lightning and the Huntrieser, H., Schlager, H., Lichtenstern, M., Stock, P., Ham-
African ITCZ, J. Atmos. Sol.-Terr. Phys., 73, 2392–2398, burger, T., Höller, H., Schmidt, K., Betz, H.-D., Ulanovsky,
https://doi.org/10.1016/j.jastp.2011.08.010, 2011. A., and Ravegnani, F.: Mesoscale convective systems observed
Davis, D., Crawford, J., Chen, G., Chameides, W., Liu, S., Brad- during AMMA and their impact on the NOx and O3 bud-
shaw, J., Sandholm, S., Sachse, G., Gregory, G., Anderson, B., get over West Africa, Atmos. Chem. Phys., 11, 2503–2536,
Barrick, J., Bachmeier, A., Collins, J., Browell, E., Blake, D., https://doi.org/10.5194/acp-11-2503-2011, 2011.
Rowland, S., Kondo, Y., Singh, H., Talbot, R., Heikes, B., Mer- Hutchins, M., Holzworth, R., Brundell, J., and Rodger,
rill, J., Rodriguez, J., and Newell R. E.: Assessment of ozone C.: Relative detection efficiency of the world wide
photochemistry in the western North Pacific as inferred from lightning location network, Radio Sci., 47, RS6005,
PEM-West A observations during the fall 1991, J. Geophys. Res.- https://doi.org/10.1029/2012RS005049, 2012a.
Atmos., 101, 2111–2134, https://doi.org/10.1029/95JD02755, Hutchins, M. L., Holzworth, R. H., Rodger, C. J., and Brundell,
1996. J. B.: Far-field power of lightning strokes as measured by the
DeCaria, A. J., Pickering, K. E., Stenchikov, G. L., Scala, J. R., World Wide Lightning Location Network, J. Atmos. Ocean.
Stith, J. L., Dye, J. E., Ridley, B. A., and Laroche, P.: A cloud- Technol., 29, 1102–1110, https://doi.org/10.1175/JTECH-D-11-
scale model study of lightning-generated NOx in an individual 00174.1, 2012b.
thunderstorm during STERAO-A, J. Geophys. Res.-Atmos., 105, Jacobson, A. R., Holzworth, R., Harlin, J., Dowden, R., and Lay,
11601–11616, https://doi.org/10.1029/2000JD900033, 2000. E.: Performance assessment of the world wide lightning location
DeMaria, M., DeMaria, R. T., Knaff, J. A., and Molenar, D.: network (WWLLN), using the Los Alamos sferic array (LASA)
Tropical cyclone lightning and rapid intensity change, Mon. as ground truth, J. Atmos. Ocean. Technol., 23, 1082–1092,
Weather Rev., 140, 1828–1842, https://doi.org/10.1175/MWR- https://doi.org/10.1175/JTECH1902.1, 2006.
D-11-00236.1, 2012. Knippertz, P., Evans, M. J., Field, P. R., Fink, A. H., Liousse, C.,
Deutscher Wetterdienst: Wetterlexikon – Intertropische Konver- and Marsham, J. H.: The possible role of local air pollution in
genzzone, available at: https://www.dwd.de/DE/service/lexikon/ climate change in West Africa, Nat. Clim. Change, 5, 815–822,
Functions/glossar.html?lv2=101224&lv3=101278, last access: https://doi.org/10.1038/NCLIMATE2727, 2015.
18 December 2020. Lal, D. M., Ghude, S. D., Singh, J., and Tiwari, S.: Relationship be-
Dickerson, R. R., Huffman, G., Luke, W., Nunnermacker, L., Pick- tween size of cloud ice and lightning in the tropics, Adv. Meteo-
ering, K., Leslie, A., Lindsey, C., Slinn, W., Kelly, T., Daum, rol., 2014, 471864, https://doi.org/10.1155/2014/471864, 2014.
P., Delany, A. C., Greenberg, J. P., Zimmerman, P. R., Boatman, Lange, L., Hoor, P., Helas, G., Fischer, H., Brunner, D., Scheeren,
J. F., Ray, J. D., and Stedman, D. H.: Thunderstorms: An impor- B., Williams, J., Wong, S., Wohlfrom, K.-H., Arnold, F., Ström,
J., Krejci, R., Lelieveld, J., and Andreae, M. O.: Detection of
https://doi.org/10.5194/acp-21-7933-2021 Atmos. Chem. Phys., 21, 7933–7945, 20217944 C. M. Nussbaumer et al.: In situ observations of deep convection lightning-produced NO in the midlatitude upper troposphere A. S., Bandy, A. R., Thornton, D. C., Blake, D. R., Rowland, F. during STREAM 1998, J. Geophys. Res.-Atmos., 106, 27777– S., Bradshaw, J. D., Crawford, J. H., Davis, D. D., Sandholm, 27785, https://doi.org/10.1029/2001JD900210, 2001. S. T., Brockett, W., DeGreef, L., Lewis, D., McCormick, D., Lelieveld, J. and Dentener, F. J.: What controls tropo- Monitz, E., Collins Jr., J. E., Heikes, B. G., Merrill, J. T., Kelly, spheric ozone?, J. Geophys. Res.-Atmos., 105, 3531–3551, K. K., Liu, S. C., Kondo, Y., Koike, M., Liu, C.-M., Sakamaki, https://doi.org/10.1029/1999JD901011, 2000. F., Singh, H. B., Dibb, J. E., and Talbot, R. W.: Atmospheric Lelieveld, J., Bourtsoukidis, E., Brühl, C., Fischer, H., Fuchs, H., sampling of Supertyphoon Mireille with NASA DC-8 aircraft Harder, H., Hofzumahaus, A., Holland, F., Marno, D., Neumaier, on September 27, 1991, during PEM-West A, J. Geophys. Res.- M., Pozzer, A., Schlager, H., Williams, J., Zahn, A., and Ziereis, Atmos., 101, 1853–1871, https://doi.org/10.1029/95JD01374, H.: The South Asian monsoon–pollution pump and purifier, 1996. Science, 361, 270–273, https://doi.org/10.1126/science.aar2501, Nussbaumer, C. M. and Cohen, R. C.: The Role of Tem- 2018. perature and NOx in Ozone Trends in the Los Ange- Levy, H.: Normal atmosphere: Large radical and formalde- les Basin, Environ. Sci. Technol., 54, 15652–15659, hyde concentrations predicted, Science, 173, 141–143, https://doi.org/10.1021/acs.est.0c04910, 2020. https://doi.org/10.1126/science.173.3992.141, 1971. Pacifico, F., Delon, C., Jambert, C., Durand, P., Morris, E., Evans, Levy, H., Moxim, W., Klonecki, A., and Kasibhatla, P.: Simulated M. J., Lohou, F., Derrien, S., Donnou, V. H. E., Houeto, A. V., tropospheric NOx : Its evaluation, global distribution and individ- Reinares Martínez, I., and Brilouet, P.-E.: Measurements of nitric ual source contributions, J. Geophys. Res.-Atmos., 104, 26279– oxide and ammonia soil fluxes from a wet savanna ecosystem 26306, https://doi.org/10.1029/1999JD900442, 1999. site in West Africa during the DACCIWA field campaign, At- Liu, C., Cecil, D. J., Zipser, E. J., Kronfeld, K., and Robert- mos. Chem. Phys., 19, 2299–2325, https://doi.org/10.5194/acp- son, R.: Relationships between lightning flash rates and radar 19-2299-2019, 2019. reflectivity vertical structures in thunderstorms over the trop- Paul, S., Ghebreyesus, D., and Sharif, H. O.: Brief commu- ics and subtropics, J. Geophys. Res.-Atmos., 117, D06212, nication: Analysis of the fatalities and socio-economic im- https://doi.org/10.1029/2011JD017123, 2012. pacts caused by Hurricane Florence, Geosciences, 9, 58, Masiol, M. and Harrison, R. M.: Aircraft engine exhaust https://doi.org/10.3390/geosciences9020058, 2019. emissions and other airport-related contributions to ambi- Pisso, I., Sollum, E., Grythe, H., Kristiansen, N. I., Cas- ent air pollution: A review, Atmos. Environ., 95, 409–455, siani, M., Eckhardt, S., Arnold, D., Morton, D., Thomp- https://doi.org/10.1016/j.atmosenv.2014.05.070, 2014. son, R. L., Groot Zwaaftink, C. D., Evangeliou, N., Sode- Murray, L. T.: Lightning NOx and impacts on air quality, Curr. mann, H., Haimberger, L., Henne, S., Brunner, D., Burkhart, Pollut. Reports, 2, 115–133, https://doi.org/10.1007/s40726-016- J. F., Fouilloux, A., Brioude, J., Philipp, A., Seibert, P., and 0031-7, 2016. Stohl, A.: The Lagrangian particle dispersion model FLEX- NASA Worldview: NASA Worldview, available at: https:// PART version 10.4, Geosci. Model Dev., 12, 4955–4997, worldview.earthdata.nasa.gov/, last access: 7 December 2020. https://doi.org/10.5194/gmd-12-4955-2019, 2019. National Hurricane Center: Tropical Weather Outlook 800AM Pollack, I., Homeyer, C., Ryerson, T., Aikin, K., Peischl, J., Apel, EDT Sat Sep 1 2018, available at: https://www.nhc.noaa.gov/ E., Campos, T., Flocke, F., Hornbrook, R., Knapp, D., Montzka, archive/text/TWOAT/2018/TWOAT.201809011153.txt (last ac- D., Weinheimer, A., Riemer, Diskin, D., Sachse, G., Mikoviny, cess: 21 December 2020), 2018a. T., Wisthaler, A Bruning, E., MacGorman, D., Cummings, K., National Hurricane Center: Tropical Weather Outlook 200PM Pickering, K., Huntrieser, H., Lichtenstern, M., Schlager, H., and EDT Tue Sep 4 2018, available at: https://www.nhc.noaa.gov/ Barth, M.: Airborne quantification of upper tropospheric NOx archive/text/TWOAT/2018/TWOAT.201809041734.txt (last ac- production from lightning in deep convective storms over the cess: 21 December 2020), 2018b. United States Great Plains, J. Geophys. Res.-Atmos., 121, 2002– National Hurricane Center: Tropical Weather Outlook 200AM 2028, https://doi.org/10.1002/2015JD023941, 2016. EDT Tue Aug 28 2018, available at: https://www.nhc.noaa.gov/ Price, C. and Rind, D.: What determines the cloud-to-ground light- archive/text/TWOAT/2018/TWOAT.201808280536.txt (last ac- ning fraction in thunderstorms?, Geophys. Res. Lett., 20, 463– cess: 21 December 2020), 2018c. 466, https://doi.org/10.1029/93GL00226, 1993. National Ocean Service: What is the difference between a hurricane Ridley, B., Ott, L., Pickering, K., Emmons, L., Montzka, D., and a typhoon?, available at: https://oceanservice.noaa.gov/facts/ Weinheimer, A., Knapp, D., Grahek, F., Li, L., Heymsfield, cyclone.html (last access: 18 December 2020), 2020a. G., McGill, M., Kucera, P., Mahoney, M. J., Baumgardner, D., National Ocean Service: How do hurricanes form?, available at: Schultz, M., and Brasseur, G.: Florida thunderstorms: A faucet https://oceanservice.noaa.gov/facts/how-hurricanes-form.html of reactive nitrogen to the upper troposphere, J. Geophys. Res.- (last access: 18 December 2020), 2020b. Atmos., 109, D17305, https://doi.org/10.1029/2004JD004769, National Weather Service: Tropical Definitions, available at: https: 2004. //www.weather.gov/mob/tropical_definitions, last access: 18 De- Roux, F., Clark, H., Wang, K.-Y., Rohs, S., Sauvage, B., and cember 2020. Nédélec, P.: The influence of typhoons on atmospheric com- Naval Research Laboratory: NRL Tropical Cyclone Page, avail- position deduced from IAGOS measurements over Taipei, At- able at: https://www.nrlmry.navy.mil/tc-bin/tc_home2.cgi, last mos. Chem. Phys., 20, 3945–3963, https://doi.org/10.5194/acp- access: 21 December 2020. 20-3945-2020, 2020. Newell, R., Hu, W., Wu, Z.-X., Zhu, Y., Akimoto, H., Anderson, B., Schiller, C., Bozem, H., Gurk, C., Parchatka, U., Königstedt, Browell, E., Gregory, G., Sachse, G., Shipham, M., Bachmeier, R., Harris, G., Lelieveld, J., and Fischer, H.: Applications of Atmos. Chem. Phys., 21, 7933–7945, 2021 https://doi.org/10.5194/acp-21-7933-2021
C. M. Nussbaumer et al.: In situ observations of deep convection                                                                            7945

   quantum cascade lasers for sensitive trace gas measurements             Waliser, D. E. and Gautier, C.: A satellite-derived climatology of
   of CO, CH4 , N2 O and HCHO, Appl. Phys. B, 92, 419–430,                   the ITCZ, J. Clim., 6, 2162–2174, https://doi.org/10.1175/1520-
   https://doi.org/10.1007/s00340-008-3125-0, 2008.                          0442(1993)0062.0.CO;2, 1993.
Schumann, U. and Huntrieser, H.: The global lightning-induced              Wang, C.-C. and Magnusdottir, G.: The ITCZ in the central and
   nitrogen oxides source, Atmos. Chem. Phys., 7, 3823–3907,                 eastern Pacific on synoptic time scales, Mon. Weather Rev., 134,
   https://doi.org/10.5194/acp-7-3823-2007, 2007.                            1405–1421, https://doi.org/10.1175/MWR3130.1, 2006.
Shapiro, L. J. and Goldenberg, S. B.: Atlantic sea sur-                    Wang, N., Edtbauer, A., Stönner, C., Pozzer, A., Bourtsoukidis,
   face temperatures and tropical cyclone formation,                         E., Ernle, L., Dienhart, D., Hottmann, B., Fischer, H., Schu-
   J. Clim., 11, 578–590, https://doi.org/10.1175/1520-                      laden, J., Crowley, J. N., Paris, J.-D., Lelieveld, J., and Williams,
   0442(1998)0112.0.CO;2, 1998.                                 J.: Measurements of carbonyl compounds around the Arabian
Simó, R. and Dachs, J.: Global ocean emission of dimethylsulfide             Peninsula: overview and model comparison, Atmos. Chem.
   predicted from biogeophysical data, Global Biogeochem. Cy.,               Phys., 20, 10807–10829, https://doi.org/10.5194/acp-20-10807-
   16, 26–1, https://doi.org/10.1029/2001GB001829, 2002.                     2020, 2020.
Smith, R. K., Montgomery, M. T., and Zhu, H.: Buoy-                        Weller, R. and Schrems, O.: H2 O2 in the marine troposphere and
   ancy in tropical cyclones and other rapidly rotating at-                  seawater of the Atlantic Ocean (48◦ N–63◦ S), Geophys. Res.
   mospheric vortices, Dynam. Atmos. Ocean., 40, 189–208,                    Lett., 20, 125–128, https://doi.org/10.1029/93GL00065, 1993.
   https://doi.org/10.1016/j.dynatmoce.2005.03.003, 2005.                  Williams, E. and Sátori, G.: Lightning, thermodynamic and
Stewart, S. and Berg, R.: National Hurricane Center Tropical Cy-             hydrological comparison of the two tropical continen-
   clone Report Hurricane Florence, available at: https://www.nhc.           tal chimneys, J. Atmos. Sol.-Terr. Phys., 66, 1213–1231,
   noaa.gov/data/tcr/AL062018_Florence.pdf (last access: 18 De-              https://doi.org/10.1016/j.jastp.2004.05.015, 2004.
   cember 2020), 2019.                                                     Williams, J., Gros, V., Atlas, E., Maciejczyk, K., Batsaikhan, A.,
Stohl, A., Forster, C., Frank, A., Seibert, P., and Wotawa, G.:              Schöler, H., Forster, C., Quack, B., Yassaa, N., Sander, R., and
   Technical note: The Lagrangian particle dispersion model                  Van Dingenen, R.: Possible evidence for a connection between
   FLEXPART version 6.2, Atmos. Chem. Phys., 5, 2461–2474,                   methyl iodide emissions and Saharan dust, J. Geophys. Res.-
   https://doi.org/10.5194/acp-5-2461-2005, 2005.                            Atmos., 112, D07302, https://doi.org/10.1029/2005JD006702,
Stubbins, A., Uher, G., Law, C. S., Mopper, K., Robinson,                    2007.
   C., and Upstill-Goddard, R. C.: Open-ocean carbon monox-                Wu, L. and Takahashi, M.: Contributions of tropical waves to trop-
   ide photoproduction, Deep-Sea Res. Pt. II, 53, 1695–1705,                 ical cyclone genesis over the western North Pacific, Clim. Dy-
   https://doi.org/10.1016/j.dsr2.2006.05.011, 2006.                         nam., 50, 4635–4649, https://doi.org/10.1007/s00382-017-3895-
Tadic, I., Crowley, J. N., Dienhart, D., Eger, P., Harder, H.,               3, 2018.
   Hottmann, B., Martinez, M., Parchatka, U., Paris, J.-D., Pozzer,        Xu, W. and Zipser, E. J.: Properties of deep convection in tropi-
   A., Rohloff, R., Schuladen, J., Shenolikar, J., Tauer, S., Lelieveld,     cal continental, monsoon, and oceanic rainfall regimes, Geophys.
   J., and Fischer, H.: Net ozone production and its relation-               Res. Lett., 39, L07802, https://doi.org/10.1029/2012GL051242,
   ship to nitrogen oxides and volatile organic compounds in the             2012.
   marine boundary layer around the Arabian Peninsula, Atmos.              Xu, W., Zipser, E. J., Liu, C., and Jiang, H.: On the relation-
   Chem. Phys., 20, 6769–6787, https://doi.org/10.5194/acp-20-               ships between lightning frequency and thundercloud parameters
   6769-2020, 2020.                                                          of regional precipitation systems, J. Geophys. Res.-Atmos., 115,
Tadic, I., Nussbaumer, C., Bohn, B., Harder, H., Marno, D., Mar-             D12203, https://doi.org/10.1029/2009JD013385, 2010.
   tinez, M., Obersteiner, F., Parchatka, U., Pozzer, A., Rohloff, R.,     Zahn, A., Weppner, J., Widmann, H., Schlote-Holubek, K., Burger,
   Lelieveld, J., and Fischer, H.: The role of nitric oxide in net ozone     B., Kühner, T., and Franke, H.: A fast and precise chemilumi-
   production in the upper tropical troposphere above the Atlantic           nescence ozone detector for eddy flux and airborne application,
   Ocean and West Africa, Atmospheric Chemistry and Physics                  Atmos. Meas. Tech., 5, 363–375, https://doi.org/10.5194/amt-5-
   Discussions [preprint], https://doi.org/10.5194/acp-2021-52, in           363-2012, 2012.
   review, 2021.                                                           Zhang, W., Zhang, Y., Zheng, D., Wang, F., and Xu, L.: Relationship
Tegtmeier, S., Krüger, K., Quack, B., Atlas, E., Blake, D., Boenisch,        between lightning activity and tropical cyclone intensity over
   H., Engel, A., Hepach, H., Hossaini, R., Navarro, M., Raimund,            the northwest Pacific, J. Geophys. Res.-Atmos., 120, 4072–4089,
   S., Sala, S., Shi, Q., and Ziska, F.: The contribution of oceanic         https://doi.org/10.1002/2014JD022334, 2015.
   methyl iodide to stratospheric iodine, Atmos. Chem. Phys.,              Zipser, E. J.: Deep cumulonimbus cloud systems in the
   13, 11869–11886, https://doi.org/10.5194/acp-13-11869-2013,               tropics with and without lightning, Mon. Weather
   2013.                                                                     Rev.,      122,     1837–1851,        https://doi.org/10.1175/1520-
University of Washington: WWLLN World Wide Lightning Loca-                   0493(1994)1222.0.CO;2, 1994.
   tion Network, available at: http://wwlln.net/, last access: 18 De-
   cember 2020.
Virts, K. S., Wallace, J. M., Hutchins, M. L., and Holzworth,
   R. H.: Highlights of a new ground-based, hourly global light-
   ning climatology, Bull. Am. Meteorol. Soc., 94, 1381–1391,
   https://doi.org/10.1175/BAMS-D-12-00082.1, 2013.

https://doi.org/10.5194/acp-21-7933-2021                                                      Atmos. Chem. Phys., 21, 7933–7945, 2021
You can also read