Experimental Hypomagnesemia Induces Neurogenic Inflammation and Cardiac Dysfunction - MDPI
←
→
Page content transcription
If your browser does not render page correctly, please read the page content below
Article
Experimental Hypomagnesemia Induces Neurogenic
Inflammation and Cardiac Dysfunction
Jay H. Kramer 1, *, I. Tong Mak 1, *, Joanna J. Chmielinska 1 , Christopher F. Spurney 2 ,
Terry M. Phillips 3 and William B. Weglicki 1
 1   Department of Biochemistry & Molecular Medicine, The George Washington University,
     Washington, DC 20037, USA; phyjch@gwu.edu (J.J.C.); wweg@gwu.edu (W.B.W.)
 2   Division of Cardiology, Children’s National Medical Center, Washington, DC 20010, USA;
     cspurney@cnmc.org
 3   Affiliate Professor of Pharmaceutics, Virginia Commonwealth University, Richmond, VA 23284, USA;
     tmphil46@yahoo.com
 *   Correspondence: phyjhk@gwu.edu (J.H.K.); itmak@gwu.edu (I.T.M.); Tel.: +1-202-994-0502 (J.H.K.);
     Tel.: +1-202-994-2865 (I.T.M.)

 Received: 23 July 2020; Accepted: 2 September 2020; Published: 5 September 2020

 Abstract: Hypomagnesemia occurs clinically as a result of restricted dietary intake, Mg-wasting
 drug therapies, chronic disease status and may be a risk factor in patients with cardiovascular
 disorders. Dietary restriction of magnesium (Mg deficiency) in animal models produced
 a pro-inflammatory/pro-oxidant condition, involving hematopoietic, neuronal, cardiovascular, renal
 and other systems. In Mg-deficient rodents, early elevations in circulating levels of the neuropeptide,
 substance P (SP) may trigger subsequent deleterious inflammatory/oxidative/nitrosative stress events.
 Evidence also suggests that activity of neutral endopeptidase (NEP, neprilysin), the major SP-degrading
 enzyme, may be impaired during later stages of Mg deficiency, and this may sustain the neurogenic
 inflammatory response. In this article, experimental findings using substance P receptor blockade,
 NEP inhibition, and N-methyl-D-aspartate (NMDA) receptor blockade demonstrated the connection
 between hypomagnesemia, neurogenic inflammation, oxidative stress and enhanced cardiac
 dysfunction. Proof of concept concerning neurogenic inflammation is provided using an isolated
 perfused rat heart model exposed to acute reductions in perfusate magnesium concentrations.

 Keywords: magnesium deficiency; substance P and substance P receptor blockade; neutral endopeptidase
 inhibition; NMDA receptor blockade; inflammatory cytokines; oxidative/nitrosative stress; neutrophil
 superoxide generation; RBC glutathione; cardiac dysfunction; perfused rat heart model

1. Introduction
     Hypomagnesemia is frequently associated with clinical disorders such as diabetes, metabolic
syndrome, alcoholism, HIV-1 infection, cancer, and cardiovascular diseases, or as a consequence of
low dietary magnesium (Mg) intake, GI/renal malabsorption, or Mg-wasting drug therapies [1–3].
Since hypomagnesemia can occur in patients with restricted dietary magnesium intake
and magnesium-wasting drugs, clinically significant hypomagnesemia can be a problem, especially in
patients with heart disease. In one report [4], 10~20% of hospitalized patients had hypomagnesemia,
and this was most common in critically ill patients, and in those with heart failure. Hypomagnesemia
has been linked to cardiac arrhythmias and vasospasm and may be a risk factor for patients with
cardiovascular disease [3,5,6]. Using animal models of hypomagnesemia, progressive development of
cardiovascular lesion formation [7,8] as well as enhanced myocardial vulnerability to toxic agents [3]
and secondary stresses [7,9] including ischemia/reperfusion [10–13], have been reported. When

Hearts 2020, 1, 99–116; doi:10.3390/hearts1020011                                  www.mdpi.com/journal/hearts
Hearts 2020, 1 100
antioxidants were administered in vivo to rodents with hypomagnesemia, the severity of cardiac
inflammation [8] and reperfusion injury [12] were reduced, suggesting a pro-oxidant mechanism.
Indeed, a clinical study supports the notion that magnesium deficiency potentiated free radical
production associated with myocardial infarction [14]. Animal models of hypomagnesemia are
also characterized by increased levels of inflammatory mediators and decreased endogenous
antioxidants [13,15,16]. The discovery that these changes were preceded by heightened circulating
levels of substance P (SP) [15,17,18] led to the hypothesis [19] that this neuropeptide initiates a cascade
of oxidative/nitrosative events in this model. In this article, we provide key experimental findings
linking chronic hypomagnesemia to SP-mediated inflammation, oxidative/nitrosative stress, enhanced
cardiac dysfunction, and reduced tolerance to postischemic stress. Moreover, we also demonstrated
the sensitive relation between acute reductions in extracellular magnesium content and the triggering
of neurogenic inflammation, inflammatory cytokine release and associated loss of mechanical function
in an ex vivo perfused working rat heart model.
2. Results and Discussion
2.1. Substance P Elevations and Oxidative Stress During Experimental Mg Deficiency
Using both rat and mouse models [17,18,20], heightened levels of circulating substance P (SP)
during severe diet-induced Mg deficiency (9% of recommended daily allowance [RDA] for Mg)
occurred, with the earliest significant increase detected by dietary day 3, and peaking by day 7.
This preceded the elevations in circulating inflammatory cytokines (IL-1, IL-6, and TNF α) which began
after dietary day 12. A second rise in circulating SP began after two weeks (days 17–21) of Mg deficiency,
coinciding with inactivation of neutral endopeptidase (NEP), the primary SP-degrading protease [21,22].
Proportionally smaller elevations in SP occurred in rats fed moderate Mg-deficient diets (20 and 40%
of RDA) for 3 weeks [23]; circulating total SP levels for moderately deficient (40% RDA) rats were
approximately half of the severely deficient animals, suggesting that the magnitude of the SP elevation
was influenced by dietary Mg-intake. Proportional changes in associated oxidative stress markers,
red blood cell (RBC) glutathione (GSH) and plasma malondialdehyde, were also displayed in 3 week
moderate and severe Mg-deficient rats [23]: plasma malondialdehyde formation was elevated by
60 and 148% in moderate and severe Mg-deficient rats, and RBC glutathione levels fell by 29% in
moderate and by 50% in severe Mg-deficient rats.
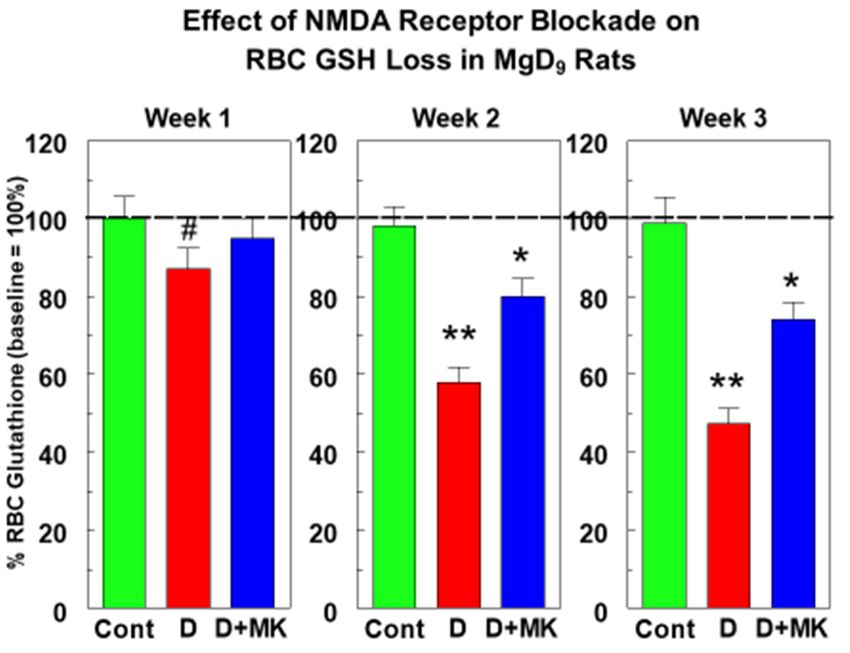
After the initial transient rise in circulating SP during week 1 of severe Mg deficiency, greater
subsequent elevations were observed at week 3 (7.2-fold higher than control) and this continued to
week 5 (6.5-fold) (Figure 1) [24]. Plasma isoprostane levels were elevated 80% at week 3 and 210% at
week 5 (Figure 2), suggesting progressive lipid peroxidation during the later phase of Mg deficiency.
RBC glutathione levels remained approximately 50% lower than control in 5 week severe Mg-deficient
rats (Figure 2). Indeed, circulating PMNs from 5 week Mg-deficient rats exhibited a 4- to 5-fold
higher basal superoxide (O2 − )-generating activity (Figure 2); with phorbol myristate acetate (PMA)
stimulation, these PMNs displayed greater than 2-fold higher activity. These findings indicated that
the superoxide production by PMNs of Mg-deficient rats was substantially augmented with prolonged
Mg deficiency.
2.2. Substance P (Neurokinin-1 or NK-1) Receptor during Mg Deficiency
The status of the SP (neurokinin-1 or NK-1) receptor is also altered during Mg deficiency,
and antagonists which target the SP receptor render protection by inhibiting SP bioactivity.
The tachykinin NK-1 receptor is a member of the rhodopsin-like family of G protein-coupled
receptors [25–27], and is found in neurons, vascular endothelial cells, muscle, gastrointestinal tracts,
pulmonary tissue, thyroid gland and in different types of immune cells [25,27–29]. SP acts through
its receptor on inflammatory cells [30] and can elicit multiple responses including: the promotion ofHearts 2020, 1 101
leukocyte adhesion [31], the activation of macrophages [32]; induction of endothelial cells to generate
NO•
Hearts [33]; and priming of PMNs for superoxide production [34].
2020, 1, 3
Plasma [SP] at 1 Week Intervals
700
MgS *
Plasma SP [pg/ml/wk] 600
//
MgD **
500
400 *
300 #
200
100 //
0 //
0 1 2 3 5
Dietary Week
Figure
Figure 1.1. Effect
Effect ofof extending
extending severe
severe dietary
dietary Mg
Mg deficiency
deficiency (MgD)
(MgD) exposure
exposure toto 55 weeks
weeks onon rat
rat plasma
plasma
substance p
substance p levels (1 week intervals). SP levels were determined with a commercial colorimetric 96
levels (1 week intervals). SP levels were determined with a commercial colorimetric 96
well
well ELISA
ELISAkit kitfrom
fromR&D
R&DSystems
Systems(Minneapolis, MN).
(Minneapolis, After
MN). normalizing
After to baseline,
normalizing time-course
to baseline, data
time-course
# p < 0.02, **
were
data integrated over the
were integrated specified
over 7 day periods,
the specified and values
7 day periods, and are
values are±means
means SE from five
± SE rats.five
from rats. # p <
< 0.01,
Heartsp0.02,
2020, 1, * p < 0.001 vs. Mg sufficient (MgS).
** p < 0.01, * p < 0.001 vs. Mg sufficient (MgS). 4
2.2. Substance P (Neurokinin-1 orSP Receptor
NK-1) Blockade
Receptor onDeficiency
during Mg Circulating
Oxidative Stress Parameters during Mg-Deficiency
The status of the SP (neurokinin-1 or NK-1) receptor is also altered during Mg deficiency, and
antagonists which target the SP receptor MgD render protection MgD+SPRB by inhibiting SP bioactivity. The
500
tachykinin NK-1 receptor is a member of the rhodopsin-like family of G protein-coupled receptors
[25–27], and is found in neurons,450 vascular endothelial # cells, muscle, gastrointestinal tracts, pulmonary
tissue, thyroid gland and400 in different types of immune cells [25,27–29]. SP acts through its receptor
% of Control (100%)
on inflammatory cells [30] and can elicit multiple responses including: the promotion of leukocyte
350
adhesion [31], the activation of macrophages [32]; induction of endothelial cells to generate NO• [33];
and priming of PMNs for300 superoxide production [34].
*
Treatment of severe 250 Mg-deficient rats for 3 or b5 weeks with the SP #receptor pHearts 2020, 1 102
Treatment of severe Mg-deficient rats for 3 or 5 weeks with the SP receptor blocker (SPRB),
L-703,606, significantly attenuated circulating neutrophil production of ROS (Figure 2), indicating
SP-mediated activation [35]; moreover, L-703,606 treatment lowered isoprostane levels (Figure 2),
preserved RBC glutathione (Figure 2), and the 13-fold increase in plasma PGI2 was dramatically
reduced by 80%. Treatment with another SP receptor antagonist, CP-96,345, prevented most of
the decrease in RBC glutathione as well as the rise in plasma lipid peroxidation products (thiobarbituric
acid-reactive substance) [18]. Interestingly, SP receptor inhibition significantly blocked the loss of
circulating neutrophil NEP activity after 3 and 5 weeks of Mg deficiency [22]. Collectively, these
findings strongly indicated that SP initiates PMN activation, and systemic free radical stress leading to
endogenous antioxidant depletion during chronic dietary Mg deficiency.
Since our initial report of SP-mediated inflammation/oxidative stress during MgD in rodents [19],
other investigators have made similar observations of MgD associated neurogenic inflammation in
clinical disorders including osteoporosis [36], traumatic brain injury [37], and Tourette’s syndrome [38].
Moreover, a recent review [39] has focused attention on SP and its profound role in adverse cardiac
remodeling and cardiac inflammation involving release of pro-inflammatory cytokines and matrix
metalloproteases from immune and cardiac mast cells.
2.3. Substance P Receptor Blockade Attenuates Mg Deficiency-Induced Cardiac Dysfunction
The impact of chronic dietary Mg deficiency with or without SP receptor blockade on cardiac
function in rats was investigated using non-invasive transthoracic echocardiography [24]. Rats placed
on a Mg-deficient diet were treated with L-703,606 or placebo, and then echocardiography was
periodically conducted [22]. Three weeks of Mg deficiency only caused a 20% decline in the mitral
valve E/A ratio (early/late [A = atrial] ventricular filling velocity), a sign of early diastolic dysfunction
(Figure 3C). Aortic pressure maximum (Pmax) was non-significantly depressed approximately 15%
at 3 weeks (Figure 3D). LV systolic function (Figure 3A: LV ejection fraction, LVEF; and Figure 3B: %
fractional shortening, % FS) were not significantly affected at 3 weeks. By contrast, 5 weeks of Mg
deficiency led to significant (p < 0.05) depression in LV systolic function (Figure 3A: 8.9% lower LVEF;
and Figure 3B: 16.5% lower %FS), aortic pressure max (Figure 3D: Pmax) was reduced 24.4%, and LV
diastolic function (Figure 3C: E/A) was depressed 28%. Five weeks of concurrent L-703,606 treatment
(Figure 3A–D) led to improvement in all described parameters (LVEF, %FS, E/A and Pmax increased by
38, 42, 54, and 59%, respectively). This partial protection by the SP receptor blocker suggests a causal
role for SP in the development of oxidative injury and cardiac dysfunction during prolonged Mg
deficiency. Thus, Mg deficiency caused progressive cardiac systolic and diastolic dysfunction in rats
and is associated with SP-mediated stress.
2.4. Modulation of Neuronal Substance P Release
Evidence [19,23] also suggested that the early SP release during dietary week 1 relied on enhanced
calcium influx into neuronal tissue, via either voltage-dependent calcium channels or the ligand-gated
N-methyl-D-aspartate (NMDA) receptor/calcium channel complex [40–42]. The increase in intracellular
calcium is likely the priming event for the increased SP release that subsequently induced the increase
in inflammatory cytokines. Moreover, the increase in intracellular calcium activates nuclear factor
kappa beta (NFkβ), a transcription factor responsible for expression of inflammation-related genes [43].
Due to the relatively short half-life (minutes) of released SP, the peripheral C-fiber neurons
and dorsal root ganglia, rather than CNS (brain and spinal cord), are the likely sources of this
neuropeptide [44–47] during Mg deficiency. We contend that this process is primarily modulated by
the Mg-gated NMDA receptor/channel complex due to declining extracellular Mg levels [48,49].Hearts 2020, 11,
Hearts 2020, 1035
A B
C D
#
Figure 3.3. Effects
Effectsofof extending
extending thethe
dietdiet period
period to 5 weeks
to 5 weeks on echocardiographic
on echocardiographic parameters
parameters of Mg-
of Mg-deficient
deficient
(MgD) rats(MgD)
with orrats with orSPwithout
without receptorSPblockade
receptor(L:
blockade (L: 1.0
L-703,606, L-703,606, 1.0 mg/kg/day
mg/kg/day s.c. pellet). s.c. pellet).
Values are
Values ±
means areSEmeans
of five± rats.
SE ofAbsent
five rats. Absent
SEMs are SEMs
withinare withinsize.
symbol symbol
(A): size. = left
LVEF(A): LVEF = left ventricular
ventricular ejection
ejection fraction;
fraction; (B): % FS = left
(B): % FS = left ventricular
ventricular % fractional
% fractional shortening;
shortening; (C): E/A = E/A
(C): = mitral
mitral value value E/A wave
E/A wave ratio
(early/late [A = atrial]
ratio (early/late [A = atrial] ventricular
ventricular filling
filling velocity);
velocity); and Pmax
and (D): = Aortic
(D): Pmax = Aortic pressure
pressure maximum.
maximum. * pDuringcontinuous
During continuousMK-801
MK-801treatment
treatmentfor
for33weeks
weeksin inMg-deficient
Mg-deficientrats,
rats,depression
depressionininplasma
plasmaSP
SP
levelswas
levels wasobserved
observedat
atall
allexamined
examinedtime
timeintervals
intervals(Figure
(Figure4),
4),and
andarea
areaintegration
integrationof
ofthe
the33week
weektime
time
courses revealed an overall 50% reduction in total SP (Figure 4A). Interestingly, MK-801’s impact
courses revealed an overall 50% reduction in total SP (Figure 4A). Interestingly, MK-801’s impact was was
greatest during week 1 (Figure 4B: 90% lower) of Mg deficiency compared to weeks 2 (50%) and10433
greatest during
Hearts 2020, 1
week 1 (Figure 4B: 90% lower) of Mg deficiency compared to weeks 2 (50%) and
(30%).This
(30%). Thissuggests
suggeststhat
thatSP
SPelevation/release
elevation/releaseduring
duringweeks
weeks22andand33may
maynotnotentirely
entirelydependent
dependenton.
on.
A
A B
B
20
20
**
ntrol] ]
gSCCoontrol
16
16
asmaa SSPP
vsMMgS
12
12 ##
tal PPl lasm **
creasevs
Foldld- -InIncrease 88
TTootal
44
[ [Fo
00 MgD MgD+MK
+MK
MgD MgD
21day
21 daydietary
dietaryduration
duration[+-]
[+-]MK-801
MK-801
Figure4.
Figure
Figure 4.4.Effect
Effectof
Effect ofofthe
theNMDA
the NMDAreceptor/channel
NMDA receptor/channelinhibitor,
receptor/channel inhibitor,MK-801
inhibitor, MK-801(0.5
MK-801 (0.5mg/kg/day,
(0.5 mg/kg/day,s.c.
mg/kg/day, s.c.time
s.c. timerelease
time release
release
pellet),on
pellet),
pellet), onreduction
on reductionin
reduction intotal
in totalplasma
total plasmaSP
plasma SPlevels
SP levels(ELISA)
levels (ELISA)during
(ELISA) duringthe
during theinitial
the initial333week
initial weekdietary
week dietaryperiod
dietary period(A):
period (A):
(A):
left
leftpanel)
panel) and
and at
at11week
week intervals
intervals (B):
(B): right
right panel,
panel, weeks
weeks 1,
1,22 and
and 3)
3) of
ofsevere
severe
left panel) and at 1 week intervals (B): right panel, weeks 1, 2 and 3) of severe Mg deficiency (MgD).Mg
Mg deficiency
deficiency (MgD).
(MgD).
After
Afternormalizing
After normalizingto
normalizing tobaseline,
to baseline,time-course
baseline, time-coursedata
time-course datawere
data werearea
were areaintegrated
area integratedover
integrated over the
overthe specified
thespecified time
specifiedtime intervals,
timeintervals,
intervals,
and values
andvalues
and are
valuesare means
aremeans
means±±SE± SE from
SEfrom five
fromfive rats/group.
fiverats/group. Left
rats/group.Left panel:
Leftpanel: * p < 0.05
panel:**ppHearts 2020, 1 105
2.5. Mg Deficiency-Mediated Cardiac Inflammation is Reduced by NMDA Receptor Blockade
After one week of severe Mg deficiency in rats, enhanced immunostaining for cardiac tissue
SP and SP (neurokinin-1, NK-1) receptor was observed, along with a substantial increase (40%
higher) in expression of vascular endothelial growth factor (VEGF), which remained elevated
through week 3 [51]. In addition, elevated expression of endothelial adhesion molecule iCAM-1
(CD54), the monocyte/macrophage cell surface marker CD11b (α M integrin) [50] and endotoxin
receptor CD14 [52], were observed. MK-801 attenuated cardiac tissue inflammation, as evidenced by
the decreased expression of VEGF [51], iCAM-1, and CD11b during Mg deficiency [50]. This suggests
that the decreased release of SP lowered expression of these indices of tissue inflammation [18].
Severe Mg deficiency also promoted angiogenesis [53], as well as significant apoptosis in rat
hearts after 3 weeks; this was suggested by elevated caspase 3 enzyme activity (3.9-fold higher than
control) and its product, cleaved poly (ADP-ribose) polymerase (PARP cleavage: 4.6-fold higher
than control) [54]. The causal role of SP in development of apoptosis during Mg deficiency was
also addressed by assessing the effect of MK-801 on DNA fragmentation in cardiac tissue sections.
Although less than 1% of nuclei were positive for apoptosis in control heart tissue, 33% of apoptotic
nuclei were observed in Mg-deficient tissue. In vivo treatment with MK-801 significantly decreased
the number of apoptotic nuclei by 40%. Thus, Mg deficiency-induced apoptosis in rat hearts was
ameliorated by NMDA receptor blockade.
2.6. Non-NMDA Receptor Modulation of Substance P Levels
As suggested by our MK-801 treatment study (Figure 4), the neuronal-NMDA receptor/channel
release mechanism may only be partially responsible for the subsequent increases in circulating SP
observed during dietary weeks 3 and 5 (Figure 1). An alternative explanation for the heightened
circulating SP levels at these later times of hypomagnesemia may involve a contribution of new SP
synthesis from non-neuronal sources. RT-PCR analyses of inflammatory (macrophages, mast cells,
monocytes, neutrophil) and endothelial cells showed that these non-neuronal cells possess mRNA
for SP as well as for its bioactive neurokinin-1 [NK-1] receptor, implicating the potential for de novo
synthesis [55–58]. Thus, the possibility of a non-neuronal origin of circulating SP elevations during
later periods of Mg deficiency should be further considered. In view of the important role of phagocytic
cells in the inflammatory process and their contribution towards generating reactive oxygen species,
these cells promote oxidative and inflammatory stress that increases the risk for cardiovascular disease.
2.7. Neutral Endopeptidase (NEP) Modulates Substance P Levels During Mg Deficiency
An equally plausible explanation for the heightened SP levels during later periods of Mg
deficiency may involve the status of neutral endopeptidase or neprilysin (NEP: EC 3.4.24.11; CD10).
NEP is the primary proteolytic SP-degrading enzyme [59], but others may degrade SP to a lesser
extent [60]. NEP is a cell surface metalloprotease which is expressed by various cells and tissues
such as the small intestine, kidney, airway epithelium, brain, heart, vascular endothelium [61],
macrophages [62], and neutrophils [63]. NEP can also be a target of lipid peroxidation by-products
such as 4-hydroxynonenal (4-HNE), which can form covalent adducts with lysine and histidine
residues of the enzyme [64,65]. Indeed, increased levels of NEP-HNE adducts have been detected
in the brain tissue of the elderly and were higher in tissue samples from Alzheimer patients [65]. In
the hypomagnesemic rodent model, the enhanced oxidative/nitrosative events may inactivate NEP
and partly account for the heightened circulating SP levels during weeks 3 and 5 of Mg deficiency.
2.8. NEP Inhibition Modulates SP Bioavailability
Using the NEP inhibitor, phosphoramidon (PR), the influence of NEP inhibition on circulating
SP levels (ELISA) in rats was investigated [66]. During severe Mg deficiency, area integration of
the one-week time course demonstrated a 7.5-fold increase in total SP (0.473 ng/mL/wk, normalizedHearts 2020, 1, 8
HeartsUsing
2020, 1 the NEP inhibitor, phosphoramidon (PR), the influence of NEP inhibition on circulating 106
SP levels (ELISA) in rats was investigated [66]. During severe Mg deficiency, area integration of the
one-week time course demonstrated a 7.5-fold increase in total SP (0.473 ng/mL/wk, normalized to
to baseline)
baseline) [21][21]
andand
PR PR treatment
treatment caused
caused further
further significant
significant increases
increases in SPinlevels
SP levels (2.45-fold
(2.45-fold higherhigher
than
than Mg deficiency alone). This has been further documented in Figure 6, which
Mg deficiency alone). This has been further documented in Figure 6, which shows that PR treatment shows that PR
treatment
not not only substantially
only substantially elevated SPelevated SPall
levels at levels at all sampling
sampling daysdietary
days during duringweekdietary week
1 but 1 but
does does
so at an
so at an earlier onset (≤3 days) compared to Mg deficiency alone. We concluded that
earlier onset (≤3 days) compared to Mg deficiency alone. We concluded that NEP strongly influenced NEP strongly
influenced
SP SP bioavailability
bioavailability during early during early Mg deficiency.
Mg deficiency. Moreover, Moreover,
in keepinginwith
keeping with our observations
our observations in Figure
in Figure 4, NMDA receptor blockade with MK-801 caused a considerable reduction
4, NMDA receptor blockade with MK-801 caused a considerable reduction in plasma SP throughout in plasma SP
throughout the 1 week dietary period (Figure 6), supporting the notion of the neuronal
the 1 week dietary period (Figure 6), supporting the notion of the neuronal origin of SP during this origin of SP
during
early this early period.
period.
Plasma Substance P Time-Courses in
MK-801 and PR - Treated MgD9 Rats
800 MgD9
# #
MgD9 + MK801
Relative Changes in SP (b aseline 447.8 pg /ml]
MgD9 + PR
725
#
650
*
575 *
500
425
0 1 2 3 4 5 6 7
Dietary Day (Mg content = 9% RDA)
Figure 6. Plasma
Plasma substance
substance PP time
time courses
courses in Mg-deficient rats treated with a neutral endopeptidase
(NEP) inhibitor or NMDA receptor blocker for 1 week. week. Rats
Rats were placed on Mg-deficient (MgD99,,
containing 9% of control Mg) or control Mg-sufficient (MgS, containing 100% RDA Mg) diets with or
without concurrent phosphoramidon (NEP inhibitor, PR: 5 mg/kg/day, mg/kg/day, s.c. pellet) or NMDA receptor
inhibition with
withMK-801
MK-801 (0.5 mg/kg/day, s.c. pellet). Plasma
(0.5 mg/kg/day, s.c. pellet). Plasma SP levels SPwere
levels were measured
measured using a
using a colorimetric
colorimetric
ELISA kit from ELISAR&D kitSystems
from R&D andSystems
were not andbaseline
were not baseline Plasma
adjusted. adjusted.SPPlasma
baselineSPlevels
baseline =
levels
in rats
in rats±= 31
447.6 447.6 ± 31 pg/mL.
pg/mL. Values Values
are meansare means
± SE of± 4–6
SE of 4–6 *rats.
rats. pHearts 2020, 1 107
compared to either the Mg deficiency alone or Mg-sufficient control groups [66]. Collectively, these
findings suggested that enhancing plasma SP levels by inhibiting proteolytic SP degradation by NEP
can increase in vivo oxidative stress.
2.10. SP Receptor Upregulation Linked to Enhanced PMN Responsiveness During Mg Deficiency
In light of our findings of elevated circulating SP levels during the early stage of Mg deficiency
in rats, flow cytometry was used to estimate SP receptor presence in circulating white blood
cells [16]. A multi-label FACS assay simultaneously using fluorophore-tagged anti-CD11b (PMNs)
and indirectly-tagged SP receptor was developed. A significant elevation (greater than 2-fold) of SP
receptor number was seen in PMNs after 2 weeks of Mg deficiency.
2.11. SP-Induced Elevation in NO• Partially Mediates Deleterious Events During Mg Deficiency
Severe Mg deficiency in rats caused substantial increases (1.7-to 2.5-fold) in plasma NO• oxidation
products (nitrate + nitrite) during weeks 1 to 3, suggesting the progressive activation of nitric oxide
synthesis [35]. SP receptor blockade prevented 75% of this rise in plasma NO• oxidation products [67].
When 3 week Mg-deficient rats were treated with a non-specific nitric oxide synthase (NOS) inhibitor
(L-NAME), it prevented much of the loss in RBC glutathione [35]. Moreover, treatment with L-NAME
completely abolished the hemoglobin-NO signal detected by electron spin resonance (ESR) spectroscopy,
confirming the presence of elevated plasma NO• during Mg deficiency [35,68]. Dietary Mg deficiency
also significantly induced iNOS (NOS2) protein expression in rat cardiac tissue [69]. Thus, Mg
deficiency-induced neurogenic inflammation may trigger nitrosative stress that partially mediates
deleterious events in this model.
2.12. SP Receptor Blockade Protects Against Mg Deficiency-Induced Intolerance to Postischemic Stress
Mg deficiency predisposed rat hearts to ex vivo ischemia/reperfusion (I/R) stress, and in vivo
treatment with antioxidants prevented much of this enhanced injury [12,13,70]. Concurrent treatment
with vitamin E improved recovery of postischemic function, and reduced lipid peroxidation-
derived alkoxyl radical production (via ESR spectroscopy and spin trapping), tissue injury (lactate
dehydrogenase release), and tissue protein oxidation in 40 min I/R hearts from Mg-deficient rats [12].
However, oxidative stress-related injury may be secondary to the prior in vivo actions of SP during Mg
deficiency. Perfused I/R hearts from Mg-deficient rats treated with the SP receptor blocker, L-703,606,
exhibited a significant improvement in postischemic functional recovery, whereas I/R-stressed control
hearts did not significantly benefit [70]. Moreover, L-703,606 treatment of Mg-deficient rats led to
significant reductions in postischemic tissue LDH loss, lipid hydroperoxide production, and alkoxyl
radical formation [70]. Mg-deficient rat hearts produced substantially more NO• during reperfusion,
and SP receptor blockade significantly reduced this heightened NO• production [67]. This further
increase in NO• production from I/R-stressed Mg-deficient hearts is likely to involve prior SP-mediated
enhancement of iNOS (NOS2) activity during Mg deficiency. Similar treatment in vivo did not
provide additional protection to I/R-stressed control hearts with respect to the above parameters,
and L-703,606 treatment acutely administered to perfusate during I/R stress proved ineffective [70].
Thus, SP receptor blockade in vivo inhibited SP-triggered inflammatory responses during dietary Mg
deficiency and influenced the responses of the heart to subsequent postischemic stress.
2.13. Acute Reduction in Perfusate Mg Modulates Neuropeptide and Cytokine Release from Normal Rat Hearts
A link between neurogenic inflammation in vivo in the Mg-deficient rat and the subsequent
lower myocardial tolerance to imposed postischemic stress ex vivo has been established [70]. We
next examined the cardiac neuropeptide (NP) release process with respect to the acute sensitivity
of the Mg-gated NMDA receptor complex to declining extracellular Mg levels, and how this may
impact inflammatory cytokine release. Mg-normal working rat hearts were perfusion stabilized for
15 min (baseline) with oxygenated physiologic KHB (5.0 mM glucose, 1.25 mM CaCl2 and 1.2 mMHearts 2020, 1, 10
Mg-gated
Hearts 2020, 1NMDA receptor complex to declining extracellular Mg levels, and how this may impact 108
inflammatory cytokine release. Mg-normal working rat hearts were perfusion stabilized for 15 min
(baseline) with oxygenated physiologic KHB (5.0 mM glucose, 1.25 mM CaCl2 and 1.2 mM MgSO4)
MgSO4)
prior prior
to 10 mintoperfusion
10 min perfusion
intervalsintervals
with 0.8,with
0.6,0.8,
0.30.6,
or 0.3
0.0 or
mM 0.0MgSO4-containing
mM MgSO4-containing perfusate.
perfusate. The
The chosen Mg concentrations were similar to the hypomagnesemic range
chosen Mg concentrations were similar to the hypomagnesemic range experienced by rats placed experienced by rats placed
on
on the
the MgD MgDdietsdiets [23].
[23]. Progressive
Progressive decreases
decreases in in cardiac
cardiac work(CW:
work (CW:9191toto38%
38%decline)
decline)were
were associated
associated
with reductions
with reductions in in perfusate
perfusate Mg Mg (Figure
(Figure 7).
7). While
While there
there were
were modest
modest declines
declines in
in LV
LV systolic
systolic pressure
pressure
[LVSP] and coronary flow rate [CFR], most of the effect on CW (calculated as [cardiac output] x LVSP)x
[LVSP] and coronary flow rate [CFR], most of the effect on CW (calculated as [cardiac output]
LVSP) be
could could be attributed
attributed to substantial
to substantial reductions
reductions in cardiac
in cardiac output
output (aortic
(aortic output+ +CFR
output CFRininml/min),
ml/min),
especially at [Mg] below 0.6 mM. Changes in hemodynamic parameters resulting
especially at [Mg] below 0.6 mM. Changes in hemodynamic parameters resulting from 10 min perfusion from 10 min perfusion
with reduced
with reducedMg Mgwere
werereversible;
reversible;each
each recovered
recovered toward
toward baseline
baseline values
values upon
upon restoration
restoration of 1.2ofmM
1.2 Mg-
mM
Mg-containing perfusate.
containing perfusate.
Acute Reduction of Perfusate Mg Alters Hemodynamic
Properties of Normally-Perfused W orking Rat Hearts
120
100
% of Control (1.2 mM)
80
*
* *
60
* **
40 Cardiac Work
LV Systolic Press
**
20 Cardiac Output
CFR
0
1.2 0.8 0.6 0.3 0.0
Perfusate Mg Content (mM)
Figure
Figure 7. 7. Acute
Acute reduction
reduction in perfusate magnesium
in perfusate magnesium concentration
concentration alters
alters hemodynamic
hemodynamic properties
properties of
of
normally perfused working rat hearts. Hearts from 3 week magnesium normal
normally perfused working rat hearts. Hearts from 3 week magnesium normal (control or Mg-sufficient)(control or Mg-
sufficient) rats were
rats were perfused in perfused in working
working mode mode
for 15 min foroxygenated
with 15 min with oxygenated
physiologic physiologic Krebs–
Krebs–Henseleit buffer
Henseleit buffer containing 1.25 mM CaCl2, 5 mM glucose and 1.2 mM MgSO4.
containing 1.25 mM CaCl2, 5 mM glucose and 1.2 mM MgSO4. After stabilization and recording After stabilization
and recording
baseline baseline functional/hemodynamics
functional/hemodynamics indices,
indices, hearts were hearts were
immediately immediately
exposed to one ofexposed to oneMg
the reduced of
the reduced Mg (0.8, 0.6, 0.3, or 0.0 mM)-containing perfusates for
(0.8, 0.6, 0.3, or 0.0 mM)-containing perfusates for 10 min, and functional/hemodynamics parameters 10 min, and
functional/hemodynamics
were recorded during the final parameters
5 min. were
Valuesrecorded during
are means ± SEthe
of final 5 min.
3–5 rat Valuesconcentration.
hearts/Mg are means ± SE*
of
and3–5 pthe enhanced inflammatory response. These studies support the concept that mild to moderate
hypomagnesemia may invoke significant pro-inflammatory responses.
Table 1. Baseline Levels of Inflammatory Mediators Released into Effluent from Perfused Control
Hearts 2020, 1 109
(MgS) Rats Hearts.
MgS Heart Effluent Levels
Inflammatory
inflammatory response. Mediator
These studies support the concept that mild to moderate hypomagnesemia
[pg/g prot/ml] per gm Wet wt Tissue
may invoke significant pro-inflammatory responses.
IL-1 5.03 ± 0.23
IL-6 3.13 ± 0.26
Table 1. Baseline Levels of Inflammatory Mediators Released into Effluent from Perfused Control
(MgS) Rats Hearts. TNFα 6.74 ± 0.22
SP 5.09 ± 0.21
CGRPMediator MgS
4.33Heart Effluent Levels
± 0.20
Inflammatory
[pg/g prot/ml] per gm Wet wt Tissue
VIP 2.95 ± 0.22
IL-1
NY 0.52± 0.23
3.62 ±5.03
Perfused working heartIL-6 3.13 ± 0.26hearts were perfused with
model was described [12]. Cannulated
physiologic Krebs–HenseleitTNFα buffer containing 1.25 mM calcium 6.74 ± chloride,
0.22 1.2 mM magnesium
sulfate, and 5 mM glucose. After SP 15 min of stabilization, baseline effluent
5.09 ± 0.21 samples were collected for
subsequent analyses of neuropeptides
CGRP and inflammatory cytokines by HPCE/ELISA. Values are
4.33 ± 0.20
means ± SE of 4–5 rat hearts. IL-1 = interleukin-1; IL-6 = interleukin-6; TNFα = tumor necrosis factor
VIP 2.95 ± 0.22
alpha; SP = substance P; CGRP = calcitonin gene-related peptide; NY = neuropeptide Y; VIP =
NY 3.62 ± 0.52
vasoactive intestinal peptide.
Neuropeptide Release From N ormally-Perfused H earts Cytokine R elease From Normally-Perfused H earts
As A Function Of Perfusate Mg Content As A Function Of Perfusate Mg Content
175 300
SP d d
IL-1
CGRP
IL-6
Neuropeptide Release
250 d
[% of Control = 1.2 mM Mg]
d
[% of C ontrol = 1.2 mM Mg]
150
C ytokine R elease
NY d
TN Fa
VIP d d
ab 200 dd
b d
125 c
c cc
150 c c
100
100
aa a
a
75 50
1.2 0.8 0.6 0.3 0.0 1.2 0.8 0.6 0.3 0.0
A Perfusate Mg Content [mM]
B Perfusate Mg Content [mM]
Figure
Figure8. 8.Acute neuropeptide
Acute neuropeptide(A: NP)(A:
and NP)
inflammatory cytokine (B) release
and inflammatory from (B)
cytokine normally-perfused
release from
rat hearts as a functionrat
normally-perfused of perfusate
hearts as Mg concentration.
a function HeartsMg
of perfusate from MgS rats (means
concentration. Hearts± SE of 4–5)
from MgSwere
rats
exposed to 5 min perfusion intervals at the described [Mg], effluent was collected each
(means ± SE of 4–5) were exposed to 5 min perfusion intervals at the described [Mg], effluent was min, and average
NP (A) and
collected cytokine
each (B) average
min, and levels were
NPdetermined by HPCE/ELISA.
(A) and cytokine SP =determined
(B) levels were substance P;byCGRP = calcitonin
HPCE/ELISA. SP
gene-related peptide; NY = neuropeptide Y; VIP = vasoactive intestinal peptide;
= substance P; CGRP = calcitonin gene-related peptide; NY = neuropeptide Y; VIP = vasoactive IL-1 = interleukin-1;
IL-6 = interleukin-6;
intestinal and=TNFα
peptide; IL-1 = tumor IL-6
interleukin-1; necrosis factor alpha.and
= interleukin-6; a,b,c,d
TNFα= p=Hearts 2020, 1 110
3. Materials and Methods
3.1. Chemicals and Experimental Agents
Reagents and solvents were from Thermo Fisher Scientific (Washington, DC, USA) or Millipore
Sigma (St. Louis, MO, USA). Alkaline phosphatase used for antibody labeling was purchased from
Millipore Sigma. Specific antibodies directed against neuropeptides were from Chemicon International,
Inc. (Temecula, CA, USA), and lyophilized neuropeptides from Bachem Bioscience Inc. (King of
Prussia, PA, USA). Heavy metal levels in all solutions were assessed by atomic absorption using
a Shimadzu flame emission spectrophotometer and were below the limits of detection. The substance
P receptor blocker, L-703,606 ((cis)-2-(diphenylmethyl)-N-[(2-iodophenyl)methyl]-1-azabicyclo
[2.2.2]octan-3-amine, oxalate salt) was from Research Biochemicals International (Natick, MA) and was
prepared as 3 or 5 week continuous-release subcutaneous pellets (1.0 mg/kg/day, or placebo) by
Innovative Research Of America (Sarasota, Fl, USA). Phosphoramidon (PR: neutral endopeptidase
(NEP) inhibitor: 5 mg/kg/day, one-week s.c. pellet), and the N-methyl-D-aspartate (NMDA) receptor
inhibitor, dizolcipine maleate (MK-801: 0.5 mg/kg/day, 3 week s.c. pellet) were each from Millipore
Sigma and pellets were prepared by Innovative Research Of America.
3.2. Animal Assurance
Animal experiments were guided by the principles for the care and use of laboratory animals as
recommended by the US Department of Health and Human Services and approved by The George
Washington University (GWU) Animal Care and Use Committee (approved IACUC # A156; initial
approval September 2009 and extended).
3.3. Dietary Model
Age-matched male Sprague–Dawley rats (150–175 g) were purchased from Hilltop Lab Animals,
Inc. (Scottdale, PA) through the GWU Animal Research Facility (ARF). After 1 week quarantine,
rats were place on a low-magnesium diet (Mg deficient [MgD] = Mg9 = 1.8 mmol Mg/kg feed =
9% recommended daily allowance [RDA]), or on this diet supplemented with an additional 20.0
mmol Mg oxide/kg (control or Mg sufficient [MgS] = Mg100 = 100% RDA) for up to 5 weeks [22,24].
The US National Research Council’s RDA for normal rat maintenance and growth was estimated to be
500 ppm [23], and our Mg100 diet contained 509 ppm. Diet composition (Envigo-Teklad Laboratory,
Madison, WI USA) contained extracted casein as the diet base, essential vitamins and nutrients,
and was well tolerated; animal housing conditions within the ARF were described [23].
3.4. Blood Collection/Preparation
Aseptic tail blood collection (~0.5 mL) from anaesthetized rats (2% isoflurane, EZ Anesthesia
Chamber with nose cone, E-Z Systems, Palmer, PA) [71] was conducted 2–3 times per week for up to 5
weeks in sterile microtainer plasma separator tubes containing aprotinin (protease inhibitor, Millipore
Sigma, St. Louis MO, USA) and heparin to give blood concentrations of 0.016 and 10.74 units/mL,
respectively. Following centrifugation (12,000 rpm, for 2 min, RT; IDEXX StatSpin VT, Iris International,
Inc., Westwood, MA, USA), plasma samples were used for assessment of Mg and substance P levels.
At sacrifice, blood samples were collected (~8 mL in aprotinin plus heparin containing BD vacutainer
SST tubes) from anaesthetized, heparinized rats (0.35–0.45 mL 358 units/mL heparin in 0.9% NaCl, i.p.)
by cardiac puncture, and centrifuged (3500 rpm, for 10 min, RT). Sacrifice whole blood samples were
processed for neutrophil isolation and assessed for superoxide anion production, whereas sacrifice
plasma samples were assayed for 8-isoprostane levels.Hearts 2020, 1 111
3.5. Plasma Magnesium
Plasma Mg was determined by atomic absorption flame emission spectroscopy (wavelength =
285.2 nm) using an AA-6200 Shimadzu spectrophotometer (Columbia, MD, USA) [71]. Plasma were
acidified and diluted 1:50 fold in 2% nitric acid. Values were estimated from a standard curve.
3.6. Plasma Substance P
A competitive binding, 96 well colorimetric ELISA assay kit from R&D Systems (Minneapolis, MN,
USA) was used to assess plasma SP levels [1,24]. SP in plasma was diluted 1:1 (to 50 µL) and allowed
to compete with a fixed amount of horseradish peroxidase-labeled SP for murine monoclonal antibody
sites. The concentration of SP was inversely proportional to color development and absorption read at
450 nm using a VersaMax microplate reader (Molecular Devices, Sunnyvale, CA, USA) with background
subtraction at 540 nm. Mean values ± SE for each group of 5 rats were obtained and represent changes
in plasma SP levels compared to time-paired controls. After baseline subtraction, area integration
of weekly dietary time intervals allowed determination of total plasma SP levels at those intervals.
The average baseline control rat plasma SP level (n = 15) was 447.6 ± 31 pg/mL.
3.7. Perfusate Neuropeptides and Inflammatory Cytokines
After collecting baseline effluent samples (1.2 mM MgSO4-containing Krebs–Henseleit buffer),
effluent from isolated control rat hearts perfused acutely with reduced magnesium-containing perfusate
(0.8, 0.6, 0.3, 0.0 mM Mg) were collected every minute for 5 min in EDTA-containing (10 µL of 15%)
tubes place on ice, and stored at −80 ◦ C. Neuropeptide (SP, CGRP, NY, VIP) and inflammatory
cytokine (IL-1, IL-6, TNFα) concentrations were determined by CHEM-ELISA using specific alkaline
phosphatase-labeled antibodies directed against each mediator [23,70]. Assays were run on fractions
after separation using an ISCO 3140 high-performance capillary electrophoresis (HPCE) system [18].
Baseline neuropeptide and cytokine levels in perfused control rat heart effluent are shown in Table 1.
3.8. Red Blood Cell Glutathione
Total cellular glutathione (GSH + GSSG) levels were assessed in packed red blood cell samples
collected in heparinized tubes at dietary week 3 or 5 [22,68]. Hemolyzed samples were diluted 50-fold
and acidified with 5% 5-sulfosalicylic acid to preserve GSH. The “cyclic method” was used which
combines the colorimetric reaction of 5,5’-dithiobis-(2-nitrobenzoic acid) (DTNB) with the enzymatic
specificity of GSSG reductase, and the reaction was spectrometrically followed (412 nm) with (for
GSSG) or without (for GSH+GSSG) the inclusion of 2% vinyl pyridine.
3.9. Plasma 8-Isoprostane
Levels of 8-isoprostane at dietary week 5 were determined on sacrifice plasma samples diluted 5-
and 10-fold by ELISA assay buffer (kit from Cayman Chemical, Ann Arbor, MI, USA). Free 8-isoprostane
levels were estimated according to standard curves [71].
3.10. Neutrophil Basal and Stimulated Superoxide Generation
At 5 weeks, neutrophils from 3 mL whole blood sacrifice samples were obtained from each rat
using a step-gradient centrifugation method [71]. Superoxide anion production from neutrophils
(0.7−1 × 10⁶ /mL ) without (basal) or with (stimulated) phorbol myristate acetate (PMA, 100 ng/mL) was
determined in a sodium phosphate buffer (pH 7.6) containing 1 mM MgCl2, 1 mM CaCl2 , 5 mM glucose
and 75 µM cytochrome c ± 50 µg superoxide dismutase (SOD). Neutrophil superoxide-generating
activity was measured as SOD-inhibitable reduction in cytochrome c using the extinction coefficient:
E550 = 2.1 × 10⁴ M−1 cm−1 .Hearts 2020, 1 112
3.11. Non-Invasive Transthoracic Echocardiography
Anesthetized rats (2% isoflurane, EZ Anesthesia Chamber with nose cone) received
echocardiography at 3 and 5 weeks during treatment using a GE VingMed System Five Echocardiogram
System [2,22,24,71]. Both rectal temperature (35.9–37.5 ◦ C) and heart rate were monitored while rats
were placed on a warming platform with paws taped down to limit motion during imaging. A sterile
eye lubricant was applied to prevent eye drying during echocardiography. Hair over the thorax was
removed using an electric clipper, followed by a depilatory cream (Hearts 2020, 1 113
deficiency. Moderate Mg deficiency in rodents produced SP-mediated inflammation even at levels
of hypomagnesemia comparable [23] to those encountered in various clinical conditions [3,5,72].
This was further supported by findings that acute reduction in perfusate Mg content modulated
NP and inflammatory cytokine release from perfused control rat hearts. Of all the NPs examined,
myocardial SP release was the most sensitive to changes in extracellular Mg, which would be consistent
with control at the Mg-gated neuronal NMDA receptor channel complex. This is also supported by
the fact that the heart is highly innervated with C fibers [45] which are enriched with SP and other
NPs and may be a primary source of released neuropeptides. Moreover, the progressive increase
in SP release was mirrored by the release profiles for inflammatory cytokines; this suggests a direct
association between SP and the severity of inflammation/oxidative stress in hearts from Mg-normal
animals. Thus, a similar extracellular [Mg]-modulated neuronal release mechanism may be responsible
for inflammation/oxidative stress in both the acute perfused rat heart model and during the early
weeks of Mg deficiency. The persistence of elevated SP during prolonged hypomagnesemia may
be a partial consequence of non-neuronal sources and/or inhibition of enzymatic degradation of SP.
Given the fact that co-existing hypomagnesemia is prevalent in several experimental and clinical
inflammatory conditions [1–7], use of SP receptor blockers, intervention with magnesium supplements,
or ensuring proper dietary magnesium intake should lessen the potential pathology associated with
Mg deficiency.
Author Contributions: Conceptualization, J.H.K., I.T.M. and W.B.W.; data curation, J.H.K., I.T.M. and J.J.C.;
formal analysis, J.H.K., I.T.M., J.J.C. and T.M.P.; funding acquisition, J.H.K., I.T.M., J.J.C. and W.B.W.; investigation,
J.H.K., I.T.M., J.J.C. and C.F.S.; methodology, J.H.K., I.T.M., J.J.C., C.F.S. and T.M.P.; project administration, J.H.K.,
I.T.M. and W.B.W.; supervision, J.H.K. and I.T.M.; validation, J.H.K., I.T.M. and J.J.C.; visualization, J.H.K.,
I.T.M. and C.F.S.; writing—original draft, J.H.K.; writing—review and editing, J.H.K., I.T.M., J.J.C., C.F.S., T.M.P.
and W.B.W. All authors have read and agreed to the published version of the manuscript.
Funding: This study was supported by USPHS grants NIH RO1-HL-62282-09, 1R21NR012649-01
and 1R21HL108311-01.
Conflicts of Interest: The authors declare no conflict of interest. The sponsors had no role in study design,
in the collection, analyses, or interpretation of data, in the writing of the manuscript, and in the decision to
publish results.
References
1. Mak, I.T.; Kramer, J.H.; Chmielinska, J.J.; Spurney, C.F.; Weglicki, W.B. EGFR-TKI, erlotinib, causes
hypomagnesemia, oxidative stress, and cardiac dysfunction: Attenuation by NK-1 receptor blockade.
J. Cardiovasc. Pharmacol. 2015, 65, 54–61. [CrossRef] [PubMed]
2. Mak, I.T.; Chmielinska, J.J.; Spurney, C.F.; Weglicki, W.B.; Kramer, J.H. Combination ART-Induced
Oxidative/Nitrosative Stress, Neurogenic Inflammation and Cardiac Dysfunction in HIV-1 Transgenic
(Tg) Rats: Protection by Mg. Int. J. Mol. Sci. 2018, 19, 2409. [CrossRef] [PubMed]
3. Seelig, M. Cardiovascular consequences of magnesium deficiency and loss: Pathogenesis, prevalence
and manifestations—Magnesium and chloride loss in refractory potassium repletion. Am. J. Cardiol. 1989,
63, G4–G21. [CrossRef]
4. Cheungpasitporn, W.; Thongprayoon, C.; Qian, Q. Dysmagnesemia in Hospitalized Patients: Prevalence
and Prognostic Importance. Mayo Clin. Proc. 2015, 90, 1001–1010. [CrossRef] [PubMed]
5. Altura, B.M.; Altura, B.T. New perspective on the role of Mg in the pathophysiology of the cardiovascular
system. 1. Clin. Asp. Magnes 1985, 4, 226–244.
6. Severino, P.; Netti, L.; Mariani, M.V.; Maraone, A.; D’Amato, A.; Scarpati, R.; Infusino, F.; Pucci, M.; LaValle, C.;
Maestrini, V.; et al. Prevention of Cardiovascular Disease: Screening for Magnesium Deficiency. Cardiol. Res.
Pract. 2019, 2019, 4874921. [CrossRef]
7. Heggtveit, H.A.; Herman, L.; Mishra, R.K. Cardiac necrosis and calcification in experimental magnesium
deficiency. a light and electron microscopic study. Am. J. Pathol. 1964, 45, 757–782.
8. Weglicki, W.B.; Bloom, S.; Cassidy, M.M.; Freedman, A.M.; Atrakchi, A.H.; Dickens, B.F. Antioxidants and the
cardiomyopathy of Mg-deficiency. Am. J. Cardiovasc. Pathol. 1992, 4, 210–215.Hearts 2020, 1 114
9. Itokawa, Y. Tissue minerals of magnesium-deficient rats with thiamine deficiency and excess. Magnesium
1987, 6, 48–54.
10. Chang, C.; Varghese, P.J.; Downey, J.; Bloom, S. Magnesium deficiency and myocardial infarct size in the dog.
J. Am. Coll. Cardiol. 1985, 5, 280–289. [CrossRef]
11. Borchgrevink, P.C.; Jynge, P. Acquired magnesium deficiency and myocardial tolerance to ischemia. J. Am.
Coll. Nutr. 1987, 6, 355–363. [CrossRef] [PubMed]
12. Kramer, J.H.; Mišík, V.; Weglicki, W.B. Magnesium deficiency potentiates free radical production associated
with post ischemic injury to rat hearts: Vitamin E affords protection. Free Rad. Biol. Med. 1994, 16, 713–723.
[CrossRef]
13. Weglicki, W.B.; Phillips, T.M.; Mak, I.T.; Cassidy, M.M.; Dickens, B.F.; Stafford, R.; Kramer, J.H. Cytokines,
neuropeptides, and reperfusion injury during magnesium deficiency. Ann. N.Y. Acad. Sci. 1994, 723, 246–257.
[CrossRef]
14. Kharb, S.; Singh, V. Magnesium deficiency potentiates free radical production associated with myocardial
infarction. J. Assoc. Physicians India 2000, 48, 484–485. [PubMed]
15. Weglicki, W.B.; Phillips, T.M.; Cassidy, M.M.; Mak, I.T.; Dickens, B.F.; Stafford, R.E.; Kramer, J.H. Pro oxidant
stress in Mg Deficiency: Role of neuropeptides and cytokines. In The Oxygen Paradox; Davies, K.J.A., Ursini, F.,
Eds.; Cleop University Press: Padova, Italy, 1995; pp. 773–782.
16. Weglicki, W.B.; Mak, I.T.; Chmielinska, J.J.; Tejero-Taldo, M.I.; Komarov, A.M.; Kramer, J.H. The role of
magnesium deficiency in cardiovascular and intestinal inflammation. Magnes. Res. 2010, 23, S199–S206.
[CrossRef] [PubMed]
17. Weglicki, W.B.; Mak, I.T.; Stafford, R.E.; Dickens, B.F.; Cassidy, M.M.; Phillips, T.M. Neurogenic peptides
and the cardiomyopathy of magnesium-deficiency: Effects of substance P-receptor inhibition. Mol. Cell.
Biochem. 1994, 130, 103–109. [CrossRef] [PubMed]
18. Weglicki, W.B.; Mak, I.T.; Phillips, T.M. Blockade of cardiac inflammation in Mg2+ deficiency by substance P
receptor inhibition. Circ. Res. 1994, 74, 1009–1013. [CrossRef]
19. Weglicki, W.B.; Phillips, T.M. Pathobiology of magnesium deficiency: A cytokine/neurogenic inflammation
hypothesis. Am. J. Physiol. Integr. Comp. Physiol. 1992, 263, R734–R737. [CrossRef]
20. Weglicki, W.B.; Mak, I.T.; Kramer, J.H.; Dickens, B.F.; Cassidy, M.M.; Stafford, R.E.; Phillips, T.M. Role of free
radicals and substance P in magnesium deficiency. Cardiovasc. Res. 1996, 31, 677–682. [CrossRef]
21. Weglicki, W.B.; Chmielinska, J.J.; Tejero-Taldo, I.; Kramer, J.H.; Spurney, C.F.; Viswalingham, K.; Lu, B.; Mak, I.T.
Neutral endopeptidase inhibition enhances substance P mediated inflammation due to hypomagnesemia.
Magnes. Res. 2009, 22, 167S–173S. [CrossRef]
22. Mak, I.T.; Chmielinska, J.J.; Kramer, J.H.; Spurney, C.F.; Weglicki, W.B. Loss of neutral endopeptidase activity
contributes to neutrophil activation and cardiac dysfunction during chronic hypomagnesemia: Protection by
substance P receptor blockade. Exp. Clin. Cardiol. 2011, 16, 121–124. [PubMed]
23. Kramer, J.H.; Mak, I.T.; Phillips, T.M.; Weglicki, W.B. Dietary Magnesium Intake Influences Circulating
Pro-Inflammatory Neuropeptide Levels and Loss of Myocardial Tolerance to Postischemic Stress. Exp. Biol.
Med. 2003, 228, 665–673. [CrossRef] [PubMed]
24. Kramer, J.H.; Spurney, C.; Iantorno, M.; Tziros, C.; Mak, I.-T.; Tejero-Taldo, M.I.; Chmielinska, J.J.;
Komarov, A.M.; Weglicki, W.B. Neurogenic inflammation and cardiac dysfunction due to hypomagnesemia.
Am. J. Med. Sci. 2009, 338, 22–27. [CrossRef] [PubMed]
25. Satake, H.; Kawada, T. Overview of the primary structure, tissue-distribution, and functions of tachykinins
and their receptors. Curr. Drug Targets 2006, 7, 963–974. [CrossRef]
26. Ho, W.-Z.; Douglas, S.D. Substance P and neurokinin-1 receptor modulation of HIV. J. Neuroimmunol. 2004,
157, 48–55. [CrossRef]
27. Almeida, T.A.; Rojo, J.; Nieto, P.M.; Pinto, F.M.; Hernández, M.; Martin, J.D.; Candenas, M.L. Tachykinins
and Tachykinin Receptors: Structure and Activity Relationships. Curr. Med. Chem. 2004, 11, 2045–2081.
[CrossRef]
28. Datar, P.; Srivastava, S.; Coutinho, E.; Govil, G. Substance P: Structure, function, and therapeutics. Curr. Top.
Med. Chem. 2004, 4, 75–103. [CrossRef]
29. Saria, A. The tachykinin NK1 receptor in the brain: Pharmacology and putative functions. Eur. J. Pharmacol.
1999, 375, 51–60. [CrossRef]Hearts 2020, 1 115
30. Derose, V.; A Robbins, R.; Snider, R.M.; Spurzem, J.R.; Thiele, G.M.; I Rennard, S.; Rubinstein, I. Substance P
increases neutrophil adhesion to bronchial epithelial cells. J. Immunol. 1994, 152, 1339–1346.
31. Kubes, P.; Kanwar, S.; Niu, X.; Gaboury, J.P. Nitric oxide synthesis inhibition induces leukocyte adhesion via
superoxide and mast cells. FASEB J. 1993, 7, 1293–1299. [CrossRef]
32. Hartung, H.P.; Toyka, K.V. Activation of macrophages by substance P: Induction of oxidative burst
and thromboxane release. Eur. J. Pharmacol. 1983, 89, 301–305. [CrossRef]
33. Persson, M.G.; Hedqvist, P.; Gustafsson, L.E. Nerve induced tachykinin mediated vasodilation in skeletal
muscle is dependent on nitric oxide formation. Eur. J. Pharmacol 1991, 205, 295–301. [CrossRef]
34. Hafström, I.; Gyllenhammar, H.; Palmblad, J.; Ringertz, B. Substance P activates and modulates neutrophil
oxidative metabolism and aggregation. J. Rheumatol. 1989, 16, 1033–1037. [PubMed]
35. Mak, I.T.; Dickens, B.F.; Komarov, A.M.; Phillips, T.M.; Weglicki, W.B. Activation of the neutrophil and loss
of plasma glutathione during Mg-deficiency—Modulation effect by NOS inhibition. Mol. Cell Biochem. 1997,
176, 35–39. [CrossRef] [PubMed]
36. Rude, R.K.; Singer, F.R.; Gruber, H.E. Skeletal and hormonal effects of magnesium deficiency. J. Am. Coll.
Nutr. 2009, 28, 131–141. [CrossRef]
37. Vink, R.; Donkin, J.J.; Cruz, M.I.; Nimmo, A.J.; Cernak, I. A substance P antagonist increases brain intracellular
free magnesium concentration after diffuse traumatic brain injury in rats. J. Am. Coll. Nutr. 2004, 23,
538S–540S. [CrossRef]
38. Grimaldi, B.L. The central role of magnesium deficiency in Tourette’s syndrome: Causal relationships
between magnesium deficiency, altered biochemical pathways and symptoms relating to Tourette’s syndrome
and several reported comorbid conditions. Med. Hypotheses 2002, 58, 47–60. [CrossRef]
39. Feickert, M.; Burckhardt, B.B. Substance P in cardiovascular diseases-A bioanalytical review. Clin. Chim.
Acta 2019, 495, 501–506. [CrossRef]
40. Nordmann, R.; Ribière, C.; Rouach, H. Implication of free radical mechanisms in ethanol-induced cellular
injury. Free Radic. Biol. Med. 1992, 12, 219–240. [CrossRef]
41. Iversen, L.L.; Emson, P.C.; Lee, C.M.; Gilbert, R.F.; Hunt, S. Regulation of neuropeptide release. Proc. R. Soc.
London Ser. B Biol. Sci. 1980, 210, 91–111. [CrossRef]
42. Catterall, W.A. Structure and Modulation of Na+and Ca2+Channels. Ann. N.Y. Acad. Sci. 1993, 707, 1–19.
[CrossRef] [PubMed]
43. Brasier, A.R. The NF-κB Regulatory Network. Cardiovasc. Toxicol. 2006, 6, 111–130. [CrossRef]
44. Furness, J.B.; Papka, R.E.; Della, N.G.; Costa, M.; Eskay, R.L. Substance P-like immunoreactivity in nerves
associated with the vascular system of guinea-pigs. Neuroscience 1982, 7, 447–459. [CrossRef]
45. Furness, J.; Costa, M.; Papka, R.E.; Della, N.G.; Murphy, R.; Delia, N.G. Neuropeptides Contained in
Peripheral Cardiovascular Nerves. Clin. Exp. Hypertens. Part A Theory Pr. 1984, 6, 91–106. [CrossRef]
[PubMed]
46. Coggeshall, R.E.; Carlton, S.M. Ultrastructural analysis of NMDA, AMPA, and kainate receptors on
unmyelinated and myelinated axons in the periphery. J. Comp. Neurol. 1998, 391, 78–86. [CrossRef]
47. Lin, Y.J.; Bovetto, S.; Carver, J.M.; Giordano, T. Cloning of the cDNA for the human NMDA receptor NR2C
subunit and its expression in the central nervous system and periphery. Mol. Brain Res. 1996, 43, 57–64.
[CrossRef]
48. Mishina, M.; Mori, H.; Araki, K.; Kushiya, E.; Meguro, H.; Kutsuwada, T.; Kashiwabuchi, N.; Ikeda, K.;
Nagasawa, M.; Yamazaki, M.; et al. Molecular and Functional Diversity of the NMDA Receptor Channel.
Ann. N.Y. Acad. Sci. 1993, 707, 136–152. [CrossRef]
49. Masu, M.; Nakajima, Y.; Moriyoshi, K.; Ishii, T.; Akazawa, C.; Nakanashi, S. Molecular Characterization of
NMDA and Metabotropic Glutamate Receptors. Ann. N.Y. Acad. Sci. 1993, 707, 153–164. [CrossRef]
50. Tejero-Taldo, M.I.; Chmielinska, J.J.; Gonzalez, G.; Mak, I.T.; Weglicki, W.B. N-Methyl-d-aspartate Receptor
Blockade Inhibits Cardiac Inflammation in the Mg2+-Deficient Rat. J. Pharmacol. Exp. Ther. 2004, 311, 8–13.
[CrossRef]
51. Tejero-Taldo, M.I.; Chmielinska, J.J.; Weglicki, W.B. Decreased VHL results in VEGF up-regulation in
the magnesium deficient rat heart (abstract). J. Mol. Cell Cardiol. 2006, 40, 904. [CrossRef]
52. Chmielinska, J.J.; Tejero-Taldo, M.I.; Mak, I.T.; Weglicki, W.B. Intestinal and cardiac inflammatory response
shows enhanced endotoxin receptor (CD14) expression in magnesium deficiency. Mol. Cell. Biochem. 2005,
278, 53–57. [CrossRef] [PubMed]You can also read