G20 CLIMATE RISK ATLAS - Impacts, policy, economics - CMCC Foundation
←
→
Page content transcription
If your browser does not render page correctly, please read the page content below
G20 CLIMATE RISK ATLAS
Impacts, policy, economics

SOUTH KOREA                                                                                                                       With the scientific
                                                                                                                                   contribution of
                                                                                                                                   Enel Foundation

How to read the Atlas: graphs, colours and scenarios.
The maps used in this Atlas are taken from The World Bank Official Boundaries -
(accessed on May 28, 2021). For the section Energy, the maps are based on Panoply Data Viewer
Each sector of this Atlas contains data and information on various climate scenarios.
When reported in graphs, the colour black indicates data and information referring to the current state, the past or the baseline.
When the authors refer to RCP (Representative Concentration Pathways), the 3 colours used across the factsheet refer to 3 scenarios, which are 3
different development options with different levels of greenhouse gas emissions, respectively low emissions (green), medium emissions (orange), and
high emissions (red). The same colour code is used when RCPs are associated with Shared Socioeconomic Pathways (SSP).
In some cases, the authors refer to global warming scenarios. In these cases, the 3 colours used refer to a temperature rise of 1.5°C (green), 2°C (dark
green), and 4°C (red).
When the authors refer exclusively to Shared Socioeconomic Pathways - SSPs (Population affected by river floods in the section: “Water"), data related to
SSP3 - that encompasses, among other things, slow economic growth, material-intensive consumption, and persisting or worsening inequalities – are
reported in a lighter shade; SSP5 – which refers to social and economic development that is coupled with an energy-intensive lifestyle and the abundant
exploitation of fossil fuel resources – is shown using a middle shade of the colour, whereas data related to the present conditions are represented in a
dark shade.
Further details on scenarios, methodologies, and the full list of references are available at: www.g20climaterisks.org
                                                                                                                      Concept and graphic design by element6.eu
SOUTH KOREA

CLIMATE
OVERVIEW                                                                     TEMPERATURE PROJECTIONS
The climate in South Korea is temperate with generally                       Under a low emissions scenario projected temperature variations will
long and cold winter seasons and very short, hot, and                        remain contained under 2°C, both by 2050 and 2100.
                                                                             Under a high emissions scenario, with no reduction in GHG emissions,
humid summers. It is mainly regulated by the East                            much greater temperature anomalies are expected by both 2050 and
Asian Monsoon system. Other factors affecting Korea’s                        2100.
climate are the orography, latitude and ocean currents.
Due to its southern and seagirt location, Jeju Island has
warmer and milder weather than other parts of South                                                                                       +5.8°C
Korea.                                                                               TEMPERATURE                                          +2.9°C
                                                                                     ANOMALY                                              +1.9°C

TEMPERATURE                                                                                                            +2.5°C
South Korea experiences average annual temperatures of 12°C. The                                                       +2.1°C
southern part exhibits generally higher temperature especially over                                                    +2.0°C
the isle of Jeju in the south, whereas the coldest area is in the north-e-
astern part overlooking the Sea of Japan.
                                                                                                 +0.4°C

MEAN                         +9                                      16
                                                                              -0.4°C
TEMPERATURE                        Celsius degrees / Over 1991-2020

                                                                              1985               2014                  2050                  2100

                                                                             Historical Period

                                                                             EXPECTED VARIATION
                                                                             FOR TEMPERATURE AT 2050
                                                                             The indicators show variations in selected temperature characteristi-
                                                                             cs for a thirty-year period centred on 2050 (2036-2065) with respect
                                                                             to the reference period 1985-2014.

TEMPERATURE TREND                                                                        +2.5°C                  +2.5°C                     +2.9°C
Temperature anomalies over the last 60                              max
years with respect to the annual mean of                         1.6 °C                    +2.0°C                  +1.9°C                        +2.4°C
12°C in South Korea during the
1961-1990 period                                                                         +1.7°C                  +1.7°C                     +1.9°C
 1961                                                                        Annual Mean            Max Temperature           Min Temperature
                                                                             Temperature            of warmest month          of coldest month

                                                                  2020
 -0.9 °C
 min
PRECIPITATION                                                                  PRECIPITATION PROJECTIONS
Precipitation over South Korea is affected by the Asian monsoon and            Precipitation trends show a general tendency to
characterized by winters with low intensity precipitation and summers          increase for all the different scenarios considered and
with intense precipitations during the monsoon season. During the              are more pronounced under a high emissions scena-
summer and the first part of the fall season, South Korea also                  rio. However, the variability reported is quite large,              +24.3%
experiences typhoons.                                                          especially over the future periods                                   +13.1%
Annual precipitation is higher on the southern coast whereas the               and for a high emissions scenario                                   +21.9%
northernmost inland regions see the least amount of rain.                      over a long time range.

                                                                                       PRECIPITATION                             +22.8%
                                                                                       ANOMALY                                   +7.2%

MEAN                         1,028                               1,601
                                                                                                                                 +11.6%
PRECIPITATION                              mm/year / Over 1991-2020
                                                                                                       -3.4%
                                                                                -5.4%

                                                                                1985                   2014                      2050                   2100

                                                                              Historical Period

                                                                               EXPECTED VARIATION
                                                                               FOR PRECIPITATION AT 2050
                                                                               The indicators show variations in selected precipitation characteristi-
PRECIPITATION TREND                                                            cs for a thirty-year period centred on 2050 (2036-2065) with respect
Precipiation anomalies over the last 60                                        to the reference period 1985-2014.
years with respect to the annual mean of                              max
1,280 mm/year in South Korea during the                           +32%
1961-1990 period                                                                               +9.9%                          +8.8%                     +12.7%
 1961                                                                                            +8.5%                           +7.7%                   +9.8%

                                                                                               +10.1%                         +11.8%                    +12.2%
                                                                                Annual total                  Precipitation of           Precipitation of
                                                                                precipitation                  wettest month             warmest quarter

 -34%                                                            2020
 min
                                                                 +22%                           +13%                          +1,563%                   +20%

                                                                  +12%                           +9%                             +232%                      +7%
VARIATION OF SPECIFIC                                            +10%                           +8%                           +79%                      +2%
CLIMATE INDICATORS                             Agricultural drought         Hydrological drought                 Heatwave                    Runoff
                                                proportion of time           proportion of time                  duration                   increase
Climate indicators variation showing                % of time                     % of time                      % of time                  % of area
impacts of climate change on sectors such
as agriculture, health and water. Analysis                       +45%                           +9%                           +86%                      +28%
considers 3 threshold average temperatu-
re increase: +1.5°C, +2°C, +4°C.                                  +23%                           +8%                             +32%                       +10%

                                                                 +18%                           +10%                          +18%                      +5%

                                                   Agricultural                Hydrological                      Heatwave                    Runoff
                                                drought frequency            drought frequency                   frequency                  decrease
                                                   % of change                   % of change                    % of change                 % of area
SOUTH KOREA

OCEAN
OCEAN IN SOUTH KOREA                                                    FUTURE PROJECTIONS
South Korea's marine exclusive economic zone (EEZ) is                   Projected annual changes within the marine EEZ for the two most
mainly temperate with warm water temperatures and a                     significant marine indicators of climate change: sea surface water
wide ensemble of ecosystems such as seagrass beds                       temperatures and pH.
and coral reefs. The country's coastal systems are natu-                Seawater temperature changes are in line
                                                                        with the definitions of each scenario, with
rally divided into two areas: the Yellow Sea and the                    maximum values around +5°C under a high
East Sea.                                                               emissions scenario in 2100.                              +5 °C
                                                                                                                                 +3 °C
                                                                                                                               +2.3 °C
CURRENT CLIMATE CONDITIONS
Mean sea surface temperature reflects the rather homogeneous
temperate climate of the region, with sigthly colder waters in the              SEA SURFACE            +2.2 °C
northern areas.                                                                 TEMPERATURE             +2 °C
                                                                                ANOMALY
                                                                                                       +1.9 °C

                                                                                           0.3 °C

                                                                         -0.6 °C

 12                                           21          MEAN           1950                 2014         2050                   2100

SEA SURFACE TEMPERATURE
Celsius degrees / Over 1991-2020

 0                                           0.6        TREND
                                                                         0.06

                                                                                            -0.01

                                                                                                           -0.1
                                                                                SEA SURFACE
                                                                                pH ANOMALY                -0.14
                                                                                                          -0.18

                                                                        Seawater surface pH becomes more acidic in                -0.1
                                                                        all scenarios, closely reflecting rising                 -0.21
                                                                        atmospheric CO₂ concentrations, and only a
                                                                                                                                -0.43
Surface temperature trends indicate a general warming of 0.2°C per      low emissions scenario leads to a stable
decade in all marine areas, with increased gains in the northern part   condition by 2100.
of the East Sea.
ECOSYSTEM INDICATORS AT 2050
Regional changes in key marine ecosystem indicators
under projected future scenarios by mid-century
(2036-2065) with respect to present climate condi-
tions (1985-2014).                                                                         East Sea                     Yellow Sea

                                                                                                        +2.25 °C                    +2.18 °C
Temperature regulates the metabolism of marine
organisms determining which habitats remain                                                  17.30°C     +2.01 °C        16.57°C     +1.85 °C
suitable. Excessive warming will likely push ecosy-
                                                                                                        +1.95 °C                    +1.61 °C
stems beyond tolerance thresholds.

                                                                                                        -0.17                       -0.18
pH represents the acid/base status of marine waters,
where a decreasing pH reflects the acidification of                                              8.13      -0.13              8.1      -0.14
the ocean due to increased absorption of atmosphe-
                                                                                                        -0.1                        -0.11
ric CO₂.

                                                                                                        -3.09 %                     -5.36 %
Oxygen is fundamental to sustain marine life and its
reduction can have a large impact on coastal ecosy-                                          246.88
                                                                                             mmol/m3
                                                                                                         -3.26 %          261.35
                                                                                                                         mmol/m3
                                                                                                                                     -3.78 %
stem services including fisheries and aquaculture.
                                                                                                        -2.65 %                     -3.88 %

                                                                                                        -5.76 %                     +1.03 %
Chlorophyll is an indicator of the biomass available
at the base of the marine food web supporting all                                              0.35
                                                                                              mg/m3
                                                                                                         -8.65 %           0.29
                                                                                                                          mg/m3
                                                                                                                                     +1.38 %
ecosystem productivity.
                                                                                                        -12.1 %                     -1.38 %

FISH CATCH POTENTIAL                                                         ANALYSIS DETAILS
Fish catch potential is an estimate of the maximum fish catch achie-          All datasets were analysed using only data from within the
vable given the marine resources available over a sustained period. It       marine EEZ and therefore excluding overseas territories,
is linked to the concept of maximum sustainable yield, meaning the           detached islands and any disputed or joint territories with
maximum amount of fish that can be extracted from a system without            other nations. In the assessment of current climate conditions,
causing a collapse in fish populations.                                       seawater surface tempererature data was obtained using
                                                                             satellite observations distributed in the framework of ESA
It is a characteristic of the natural system, which is substantially         Climate Change Initiative.
different from realized catch, and a direct result of the fishery policy in
place.                                                                       Future projections of marine indicators are represented by the
                                                                             combined analysis of results from 15 different Earth System
                                                                             models participating in the Coupled Model Intercomparison
                                                               -2.7%         Project Phase 6 (CMIP6). These models include new and better
Fish catch                     2050                                          representations of physical and biogeochemical processes,
percentage                                                                   compared to previous IPCC assessment reports.
change                                                                       Fish catch potential data was obtained using the FAO's techni-
                                                               -0.8%         cal report and refers to the best and worst case climate scena-
                                                                             rios from the Fifth IPCC Assessment Report. These mean
                                                                             estimates are subject to substantial uncertainties as discussed
                                                                             in the original work.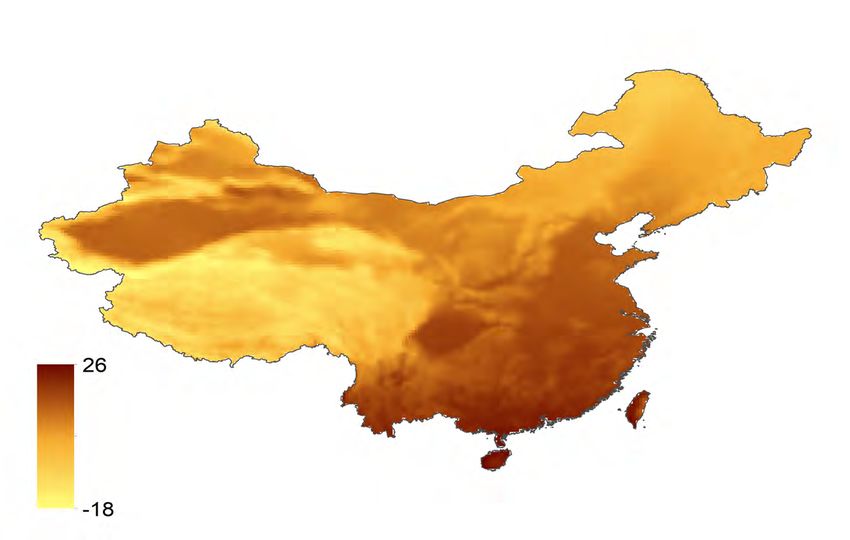
SOUTH KOREA

COASTS
OVERVIEW
Korea is a densely populated peninsula with approxi-
mately 12,000 kilometres of shoreline and more than
3,000 islands. Long stretches of tidal mud flats are                           Shoreline                          12,478 km
found along the west coast, whereas sandy and rocky                           Length
beaches are prevalent in the east. The southern coastal
waters are characterized by the presence of various
semi-enclosed bays and islands. The coastal zone
economy includes industrial centres, maritime and air                         Sandy
transport, and tourism. The biggest urban conglomera-
tes on the coast include Incheon, Busan and Ulsan.                            Coast Retreat                                           -43.3 m
                                                                              at 2050

CLIMATE CHANGE HAZARDS
Coastal hazards such as erosion, storm tide inundation and permanent         changes in the typhoons frequency, intensity and area of influence in
flooding, can have strong adverse impacts on coastal regions, with            the future. These changes can exacerbate erosion issues and drive
loss of sandy shores, damage to settlements, infrastructure and ecosy-       flooding of low lying areas on the coast, with potential widespread
stems. Climate change can exacerbate these impacts due to rising sea         economic damage. In general, flooding caused by sea level rise and
levels and increasing impacts of waves and storms. Climate change            storm surge will have more impact on the low lying and densely
impacts on the coastal zone of Korea are mainly driven by rising sea         populated areas of the west coast.
levels and possible changes in storms intensity and direction, and

SEA LEVEL RISE                                                               EXTREME SEA LEVEL
Relative sea level rise has been observed over the past century around       On average, one in 100 extreme sea level events are expected to rise
the coast of Korea, with a yearly average increase of approximately 2.4      from 2.83 metres at present day to 3.08 metres by 2050 under a
millimetres per year since the 1990s. The latest IPCC projections            medium emissions scenario.
indicate that, by 2050, global sea levels may rise between 0.18 metres,
under a low emissions scenario, and 0.23 metres, under a high
emissions scenario.

                                                               0.23 m                                                                          3.12 m
Observed and                                                                 Current and
projected sea                         2.4                                    projected extreme                 2.83 m                           3.08 m
level rise at 2050            mm/year                                        sea level at 2050
                                                               0.18 m

  OBSERVED                                                                      FUTURE
 STORMS           The Korean coast is exposed to relatively small swells
                  generated in the Yellow Sea, the South China Sea and
                                                                             STORMS           Climate change is expected to influence the wave
                                                                                              climate around the Korean coast. Projections of change
                  the Sea of Japan. Trends in the wave climate have been                      in wave height, period and direction for this century
                  analysed recently and detect a small increase in wave                       under different scenarios seem to agree on a reduction
                  heights around the Korean peninsula in recent decades.                      in wave energy. However, this may be offset by the
                  Every year, the Korean coast is influenced by the typhoon                    impact of stronger typhoons fuelled by higher sea
                  season, from May to October, which has historically                         surface temperatures. Furthermore, it appears that
                  impacted the southern part of the country with                              although there may be a reduction in the number of
                  widespread damage from wind and storm surges.                               typhoons, the intensity of these is predicted to increase.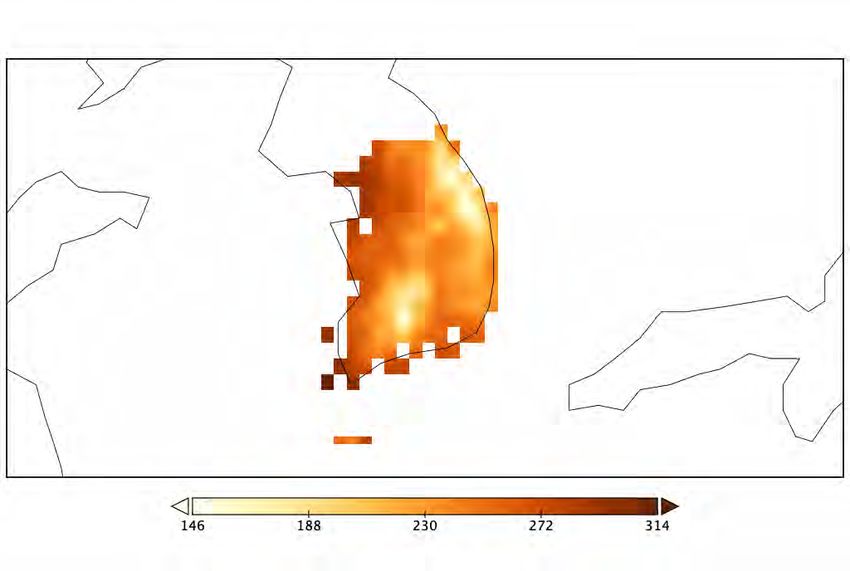
VULNERABILITY AND RISK
         Most of the coastal population of South Korea is                                                               VULNERABLE
         concentrated in the large urban areas around Incheon,                                           HISTORICAL     POPULATION
         in the north-west, and Busan and Ulsan, in the south
         east. The low lying areas, however, are concentrated in
         the western part of the country.
                                                                                                      0.25 Million
         Parts of Incheon and Busan are exposed to the impacts
         of sea level rise and increasing storm surges, which may
         lead to significant economic impacts under future sea
         level rise.                                                                                       2050
                                                                                                                                      0.42 Million

         The total damage cost of a 1 metre sea level rise in Korea is estimated                                                        0.40 Million
         at approximately 60 billion USD. Under a medium emissions scenario,
         the population exposed to the annual coastal flood level is expected to                                                       0.39 Million
         increase from 250,000 to 400,000 people by 2050.

                                                                                                                                      0.80 Million
                                                                                                           2100

                                                                                                                                        0.64 Million

                                                                                                                                      0.58 Million

                           INFLUENCE OF SEA LEVEL RISE
                           ON EXTREME SEA LEVEL                                              + Wave set up refers to the accumulation of water near
                                                                                             the shore due to the presence of breaking waves.
         Present and future sea level rise are a consequence of
         carbon induced global warming causing melting ice                                   + Storm surge is an occasional increase in sea level driven
         and ocean expansion due to heat accumulation.                                       by shoreward wind-driven water circulation and atmo-
                                                                                             spheric pressure.
         The extreme sea levels reported here are based on the 100-year storm
         surge + wave set up + sea level rise + high tide indicators. The first two           + High tide is usually the highest tide reached in a given
         parameters (storm surge + wave set up) are based on the 100-year                    location based on tide records.
         value for the event; sea level rise is its projected value at 2050; and
         high tide is the absolute value of the highest tide calculated for a
         given locality, which won’t be influenced by climate change.

                                                                                                                                                 Wave set up
                                                                                                                                                         Storm surge
         Wave set up                                                                                                                             Storm surge
Storm surge
        Storm surge
          Lowest  tide

            Mean sea level                                                  Extreme     Mean sea level
                                                                                                                                                 Sea levelSea
                                                                                                                                                           riselevel rise
Sea levelSea
          riselevel rise                                                    sea level
                                            0m elevation (AHD)                                                         0m elevation (AHD)
Hig tide Hig tide                                                                       Lowest tide                                                   Hig tide Hig tide

         Present sea levels have risen globally by approximately 20 centime-            Future sea level rise is a projection based on different global
         tres over the past century.                                                    warming scenarios, at approximately 100 centimetres by the end of
                                                                                        2100, with consequent inundation during extreme sea level events.
SOUTH KOREA

WATER
OVERVIEW
Despite abundant rainfall, South Korea's water resour-
ces are relatively scarce. Annual precipitation is 1.6                      Renewable internal                       65
times higher than the global average, whereas precipi-                      freshwater resources             billion m3
tation per capita is only about one sixth. South Korea’s
population of over 51 million people live in a relatively
small country of about 100,363 squared kilometres, of
which approximately 65% is mountainous. Most of the
rainfall is concentrated in the summer months and                           Renewable internal                   1,262
more than 60% of the annual precipitation flows into                         freshwater resources                     m3
the sea. Therefore, actual available water resources per                    per capita
capita are low.

Water use has increased fivefold: from 5.1 billion cubic                    The Han River, the Nakdong River, the Geum River and the Yeongsan
                                                                           River are the four major rivers of Korea, with a total area of 67,630
metres in 1965 to 25.1 billion cubic metres in 2014;                       square kilometres and a total length of 1,763 kilometres. As depen-
growing faster than the population which has gone                          dence on these four major rivers in Korea increases, so does the poten-
from 28.7 million in 1965 to 50.7 million in 2014.                         tial for water crisis, especially as climate change increases flood and
However, since 2003 water use has stopped increasing.                      drought impacts.

CLIMATE CHANGE HAZARDS
Climate change can affect water resources through increasing tempe-        annual precipitation has been increasing gradually. The value fluctua-
ratures, higher rates of evapotranspiration and altered rainfall           ted rapidly from 754 millimetres in 1939 to 1,756 millimetres in
patterns. This leads to changes in the water cycle, including decrease     2003, and the incidence of extreme drought and flood events is
of snow and ice coverage, alterations of surface runoff and groundwa-      increasing. Groundwater and runoff are also linked to these changes
ter storage, as well as drought and flood occurrence. Records of            in precipitation.
annual precipitation since 1905 show that the variation range of

KEY POINT RUNOFF                                                                                                                      -16.7%
Monsoon summers between June and September account for approxi-            2050
mately 60-70% of the total runoff and precipitation in many areas of                    Changes in
South Korea. Future projections show that increasing temperatures                       annual runoff
will have significant impacts on the intra-annual runoff variation, with                 % of change
the variability of runoff increasing in summer and an increased                                                                       +1.8%
likelihood of extreme future events. Simulations show that the
discharge in July tends to decrease while runoff can increase in August
and September. In addition, the mean average low flow may increase
while the average wet and normal flow may decrease under climate                                                                       +28%
change.                                                                    2050
                                                                                       Runoff increase
At a country scale, an average increase in surface runoff by approxima-                % of area
tely 2% and -17% is expected respectively under low and high
emissions scenarios for the 2045-2055 period compared to                                                                              +5%
2015-2025. If temperatures rise by 1.5°C, 2°C or 4°C, 5%, 9.6% or 28%
of the area of the country will likely experience an increase in runoff,
while 2%, 6.9% or 20% of the surface of the country will likely
experience a decrease in runoff, respectively.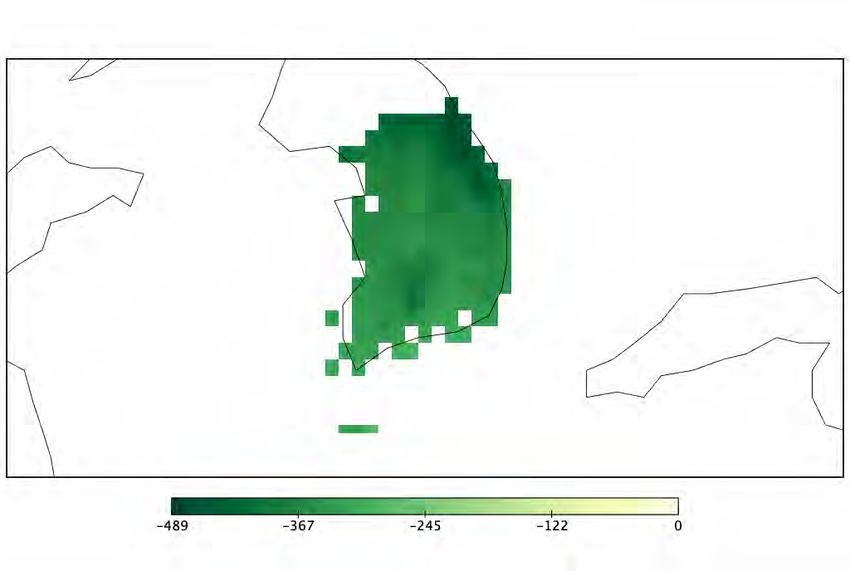
KEY POINT DROUGHTS
                                                                                                                                     +5.3%
Studies have shown that droughts on the Korean Peninsula are more
likely when the summer monsoon season is relatively short. Extreme
                                                                           2050     Severe drought
drought occurred in 2015 as precipitation that year was recorded as                 likelihood increase
being the third-lowest since meteorological observations began in                   % of change
1973. In this case, the Boryeong Dam level was the lowest on record,                                                                 +6.7%
with an approximately 200 year return period based on the dam
design.

Since 1970, South Korea has suffered from drought over a period of                                                                   +9.0%
five to seven years, and local drought is becoming an increasingly
serious concern, with increasing rainfall deviation across multiple
                                                                           2050     Hydrological
regions. In many areas of the peninsula, droughts are estimated to                  drought frequency
have become more severe especially in spring and winter.                            % of change
                                                                                                                                     +7.0%

KEY POINT GROUNDWATER
In South Korea, the amount of underground water usage is approxi-
                                                                                                                                     +9.1%
mately 4.1 billion cubic metres (2015). Although this usage has been       2050     Groundwater
increasing constantly every year, the increase has decelerated since                Recharge
2013. Due to imprudent groundwater development and inappropriate                    % of change
management, South Korea has confronted some critical groundwater
problems, including extensive water level decline and quality deterio-
                                                                                                                                     +5.9%
ration caused by petroleum hydrocarbons and chlorinated solvents.
Among 193 national groundwater deep-monitoring wells nationwide,           and a decrease in the groundwater recharge caused by climate change
62% showed decreasing water levels over the period 2004-2008.              were qualitatively estimated as the causes. At the country level, a +5%,
Based on the groundwater-level data for the last 10 years obtained         +5% and -11.4% change of the annual groundwater recharge for the
from the nationwide national groundwater monitoring network,               period 2045-2055 compared to the timeframe 2015-2025 is
approximately a 0.58 metre decrease in the groundwater level for the       expected respectively under low, medium and high emissions scena-
next 20 years has been predicted. Excessive groundwater collection         rios.

KEY POINT FLOODS                                                           POPULATION AFFECTED BY RIVER FLOODS
Large-scale flood damage in South Korea, measured in terms of
human casualties (dead and missing), has been decreasing since 1959,        TODAY                                                        99,918
while property damage has also been gradually decreasing since                                                                             people
2002. Nevertheless, excessive flooding does occur due to changing
rainfall patterns that are caused by climate change, such as increased      2050 SSP3                                                   164,228
precipitation, decreased days of precipitation and a rise in short-term,                                                                   people
localized heavy rain. The frequency of localized heavy rain with 30
millimetres per hour or more, surged by 37%: from 60 instances in the
                                                                            2050 SSP5                                                  204,694
1980s to 82 times since 2000. Between July 26th and July 28th, 2011,                                                                       people
for example, localized heavy rain in the metropolitan area (113
millimetres per hour on the morning of the 27th in Gwanakgu, Seoul;
449.5 millimetres per day in Dongducheon; and 322.5 millimetres per        localized heavy rain in the Mt. Woomyeonsan district and Gangwon
day in Moonsan) inundated the most populated downtown neigh-               Chuncheon resulted in numerous casualties, including 57 deaths and
borhoods in Seoul. Meanwhile, a large-scale landslide caused by            12 missing people.

RISK INDICATORS
The water stress index summarises current and future water related
vulnerabilities and risks at the global level. Scores are based on the
ratio of total water withdrawals, including agriculture, industrial and
human consumption, to available renewable surface and groundwa-
ter supplies.

WATER STRESS
The water stress level for South Korea is considered medium-high for
the recent past (1960-2014 average), and it is expected to remain that
way in the near future (2030-2050) based on climate change
projections.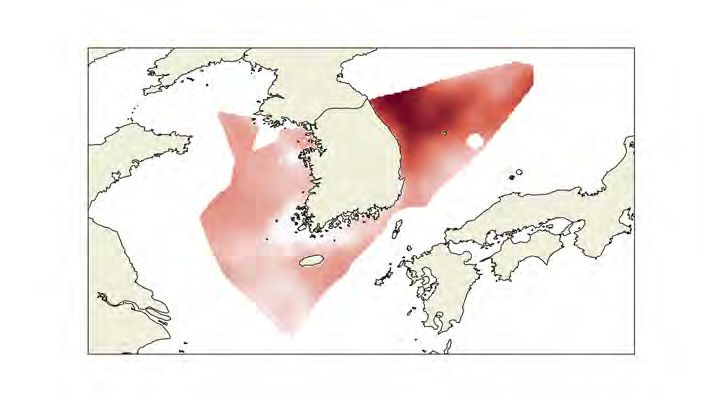
SOUTH KOREA

AGRICULTURE
OVERVIEW
Less than 25% of South Korea’s area is covered in agri-
cultural land, which is characterized by small family
farm structure. Rural population has been decreasing
steadily in recent decades, and likewise the share of
the national GDP derived from the agricultural sector.                          5.2 Mt                                   0.6 Mt
                                                                                 Rice                                     Citrus
Rice is the most important agricultural crop in South Korea, accoun-
ting for about 90% of total cereal production. Other relevant crops
produced in the country include barley, wheat, soybean and potatos,
yet these only cover a small amount of domestic needs. In addition, a
wide variety of fruits and vegetables are cultivated including tangeri-
nes, pears, apples, peaches, onions, cabbages and radishes.

Reservoirs are the main source of freshwater for irrigation in agricul-         0.2 Mt                                   0.6 Mt
ture, in particular for paddy fields.                                            Barley                                   Potato

Added Value of Agricultu-              Share of Agriculture                   Agricultural                         Area Equipped
 re, Forestry and Fishing            Value added in Total GDP                    land                               for Irrigation

                                2000                                   2000                          2000

          23,931                                  3%                             1,918                                     880
         USD Million                                                          Thousand HA                             Thousand HA

                                2018                                   2018                          2018

          28,767                                 1.8 %                           1,596                                     707
         USD Million                                                          Thousand HA                             Thousand HA

EXPECTED IMPACTS
ON AGRICULTURE PRODUCTIVITY                                                                                               Rising
                                                                                                                    temperatures
                                                                                     Changes in
Rising temperatures, reduction in average annual precipitation, and                  precipitation
intensification of extreme events such as heat waves and drought,                     patterns
affect production variability with a tendency towards yield                                                                Increased
reduction for many cultivated species, accompanied by a probable                                                    frequency of dry
decrease in food quality. Crops respond to increases in temperatures                                              spells and drought   Temperature
with changes in duration of the growing season, early appearance of                                                                      variability
phenological phases and potential shifts of cultivation areas toward                                 Increasing intensity of
higher latitudes and altitudes for better growing conditions. Howe-                                  extreme weather events
ver, impacts vary significantly depending on the geographical area
and specific crops in question.
CROP PRODUCTIVITY 7 7.8 (-1)% 2.6 3.5 (-4)%
Crop productivity refers to the harvested yield of a crop per unit of
land area. It is strongly influenced by climate and other environmental 5 (-4.4)% 7.9 (2)%
and management factors. Rice Barley
tons / ha tons / ha
Climate change is expected to have an impact on the productivity of
several major crops, although this may in part be offset by the fertili- 1.8 11 (3.1)%
zing effect of higher CO₂.
10.7 (1.3)%
Impacts are estimated using a range of model projections based on Soybeans
tons / ha
low to high emission scenarios and reported as percentage changes
between the 30-year average around the historical period and the
30-year average around 2050. Productivity change with (without) the CO₂ fertilization effect.
2050
Estimates assume sufficient water and nutrient supplies, and
do not include impacts of pests, diseases, or extreme events.
CHANGE IN RICE CHANGE IN SOYBEANS
_ = + _ = +
Rice productivity shows an overall tendency to increase, especially for associated with reduction of temperature and sunlight during the
early-maturing varieties, whereas productivity of medium to late-ma- ripening period. Due to warmer temperatures, the cultivation regions
turing varieties may decrease slightly. Most increases in rice producti- of apples, pears, peaches and grapes will move northward and/or to
vity are expected in the northern areas due to warming and more inland mountain areas, whereas some areas in the southern regions
suitable conditions for rice production, whereas a decrease may be will become unsuitable for cultivation. Rising temperatures will
expected in southwestern areas. Increasing temperatures may shorten expand regions suitable for cultivation of several tropical fruits
the ripening period, leading to production of poor-quality rice. Extre- (guava, avocado, atemoya, mango, pitaya, and papaya) in the south-co-
me events, such as typhoons, may trigger severe drops in rice yields astal regions.
ADAPTATION IN AGRICULTURE AND WATER RESOURCES
Rural regions may become more vulnerable to water deficits because demand for irrigation, which is mainly dependent upon reservoirs. An
of seasonal variations in precipitation and droughts. Meanwhile, effective operational management of reservoirs is crucial by evalua-
higher temperatures will generally require a larger agriculture water ting the combined sustainability of water demands from multiple
demand due to higher plant evapotranspiration. Future expansion of sectors and vulnerability of water supplies under climate change.
under-irrigated agricultural areas may further increase the water
CHANGE IN WATER DEMAND
_ = +
Agriculture
Water Demand +3.1%
% of change
-6.2%
2050
Resilience of water supplies will benefit from moderniza-
tion of agricultural infrastructure and development of
technology to improve the efficiency of irrigation systems.SOUTH KOREA
FORESTS
FORESTS IN SOUTH KOREA
South-Korea is characterized by warm-temperate ever- 1990
green broadleaf forests in the south, evergreen coni-
fers in the mountains, and deciduous hardwood forests
in the rest of the country.
7 Mln ha 21 Tons/ha
The current situation is strongly influenced by Million hectares Tons of Carbon per hectare
pronounced reduction in adventitious cover in the first Forested area Carbon stock
half of the 1900s during Japanese colonization and
subsequent reforestation policies. 2020
FORESTED AREA AND CARBON STORAGE
South-Korean forests cover almost one third of the country’s total land 6 Mln ha 87 Tons/ha
Million hectares Tons of Carbon per hectare
surface. According to recent studies they remove approximately 60
gigagrammes of CO₂ from the atmosphere per year with a constant Forested area Carbon stock
increasing trend. This will allow Korea to reach a total of 1 gigatonnes
of total stock by 2050. Forests are a crucial carbon sink for this country.
2050
FOREST PRODUCTIVITY Productivity anomaly
Tons of Carbon per
+0.56
Forest productivity or Net Primary Production is the net carbon captu- hectare per year
red by plants. It is the difference between the carbon gained by Gross +0.52
Primary Production - net photosynthesis measured at the ecosystem
scale - and carbon released by plants' respiration. It is expressed per
unit land area.
Increase in primary production across the entire
country
+ Fertilizing effect of increasing atmospheric CO₂, and rising
temperatures promote productivity
No areas with an expected decrease in forest primary
production
+ Increasing risk of drought stress due to modifications in the
water regime reduce productivity
KEY SPECIES
INCREASE SUITABILITY
OAKS EVERGREEN FORESTS
UNDER Decrease in the distribution of coniferous
species in favour of an increase in oak
Increasing climate suitability for warm
temperate evergreen forests
CLIMATE species
CHANGE MORTALITY
SUBALPINE CONIFEROUS
VULNERABILITY
FIR-THUJA
Mortality of the subalpine coniferous Very high vulnerability for Korean arborvitae,
species was projected to progress rapidly Khingan and Korean firFIRES IN SOUTH KOREA WHERE DO FIRES OCCUR?
Fire is a structural ecological process that provides several types of
ecosystem services and impacts on socio-ecological systems,
including human health, carbon budgets, and climate change. Changes The most affected areas are The north Gyeongsang Province
in global fire activity are influenced by multiple factors such as those dominated by temperate is the country's fire hotspot
land-cover change, policies, and climatic conditions. Fire also releases broadleaf and mixed forests in region.
large quantities of greenhouse gases into the atmosphere, contribu- the north Gyeongsang Province.
ting to a vicious cycle.
During the last two decades, the total land area affected by fire
amounts to approximately 42,850 hectares.
BURNING EMITTING
42.8 THOUSAND HECTARES 0.26 TERAGRAMMES
OF CARBON PER YEAR
FOREST FIRE EMISSIONS
CONTRIBUTED TO
COSTING
60% OF TOTAL FIRE RELATED 34.1 MILLION USD PER YEAR IN
CARBON EMISSIONS FOREST FIRE PREVENTION
VARIATION OF SPECIFIC
FUTURE BURNED AREA FIRE INDICATORS
Under a low emission scenario, models project a generalised
decrease over northern and central areas while an increase is
expected in coastal and central deciduous forests and southern % of change 2040-2069
evergreen forests. Under a medium emissions scenario, burned area Fire days in spring +31%
might decrease across central areas.
2050
Burned Area -17.9 % of change 2040-2069
km² per year
Fire days in summer +17%
-2.1
% of change 2040-2069
Fire days in autumn +21%
FUTURE FIRE EMISSIONS
Compared to present, under a low emissions scenario scientists
project a slight variation in fire emissions. However, under a
medium emissions scenario fire emissions might decrease,
particularly in north-eastern areas.
Decrease in burned areas for a low emissions scenario
2050
Increase in burned areas for a low emissions scenario Fire Carbon emission -0.15
+ A slight increase in the fire season and the frequency of fires is Teragrams of Carbon per
expected year
-0.05
+ By the end of the century there may be a stronger increase in
fire season length.SOUTH KOREA
URBAN
OVERVIEW
In 2020, more than 80% of the South Korean popula- 2020
tion lived in cities. Most cities were built in a short
period between 1960 and 1980, and the urbanization 41,934,110
rate grew from less than 30% in 1960 to almost 80% in Population in
the 1990s. In the near future, the urbanizaiton rate is Urban Areas
expected to increase to 86.6% by 2050. 2050 43,616,033
More than 60% of the South Korean urban population
lives in urban agglomerations with more than 1 milion
inhabitants, while smaller urban centres with less than
300,000 inhabitants account for 7% of the urban popu- Graphs refer to data provided by United Nations, Department of
lation. Economic and Social Affairs, Population Division (2018). World Urbani-
zation
Built up areas cover 17.8% of South Korea (7,729.88
square kilometers). 2020
81.4%
Urbanization
Rate
2050
86.4%
OVERVIEW OF KEY
CLIMATE IMPACTS IN URBAN AREAS
South Korea’s urban areas are mainly vulnerable to heat stress and the
effects of storm surges and heavy rainfall resulting from typhoons
reaching land.
HEATWAVES AND HEAT STRESS +120.4%
Frequency, intensity, and persistence of heat waves on the Korean
2050
Cooling
Degree Days +43.4%
Peninsula have increased since the 1970s. The frequency of tropical
% of change
nights has also increased, particularly in larger cities and metropolitan
areas. +26.8%
Between 1992 and 2010 approximtely 470,000 heat related deaths in
7 communities were reported. In this period, a total of more than 220 +85.5%
heatwave events of different intensities and lengths were registered, 2050
Heatwave
among these there were eight two-day events of very high intensity, frequency +31.8%
six three-day events of medium intensity, and five four-day or longer % of change
events. In larger urban areas, these events include more frequent +18.3%
tropical nights, which represent a significant health risk.
In the near future, frequency of heat waves and consequently reliance +1,563%
on air conditioning will increase, in particular under a strong warming
scenario. The length of heatwaves could increase by 1,563% and 2050 Heatwave +232%
temperatures could rise by the 5.5°C, 2°C and 4°C under high, medium duration
and low emissions scenarios, respectivley. % of time
+79%AGEING SOCIETY
The Korean population is ageing rapidly, with 37% of the entire 2017
Population exposed
population to be classified as elderly by 2050, and high concentrations 100.0%
living in urban areas. Among the elderly, those living alone are to air pollution
particularly vulnerable due to poverty and difficulties managing their
wellbeing.
High temperatures in urban areas worsen impacts of high levels of air
pollution. In 2017, the entire Korean population was exposed to levels
exceeding WHO guideline values for PM2.5.
COASTAL FLOODING 2050 0.23 m
Korea’s coastline is exposed to regular typhoons. The risk from typho-
ons is determined by storm and rainfall intensity as well as by rising
sea levels. Sea levels around the Korean peninsula have risen by
approximately 10 centimetres in the last 40 years, with an annual 0.18 m
increase of 2.9 milimetres, observed between 1989 and 2017. Projected
sea level rise
0.77 m
2100
0.38 m
FLOODING
There is an increasing trend in extreme precipitation, with increasing
maximum daily precipitation values in some regions, partly due to
natural variables. Since the late 1990s, flash floods have emerged as +28%
the most frequent natural disaster. Korea experienced severe flood 2050 Runoff
damage caused by typhoons and rainfall in 2006 when flash floods
killed 35 people and left 13 others missing.
increase +10%
% of area
Damage to property was concentrated in the north eastern province of +5%
Gangwon – amounting to approximately 935.5 million USD Annual
mean precipitations are expected to increase slightly under all scena-
rios, whereas summer precipitations are expected to increase at a
much higher rate.
SURFACE SEALING Heavy precipitation in cities is problematic due to the high level of sealed surfaces. Soil sealing
increases run off and reduces the amount of water absorbed by soil. Where there are large amoun-
AND FLOODS ts of impervious ground cover, short duration extreme rainfall events can lead to increased
flooding, even resulting in flash floods.
2010 % of urban population
RAPID LAND USE CHANGE AND URBANIZATION Population 0%
Rapid land use change under intense urban growth is increasing living in slums
runoff. When combined with more intense precipitation these factors
will be responsible for increasing flood damage in larger cities.
% of total population
Urban population
2018
living in areas 2.0%
where elevation is
below 5 metersSOUTH KOREA
HEALTH
OVERVIEW
Temperatures in South Korea have increased by 1.5°C 1°C increase in temperature, and the risk of death
in the last century. Warming, heatwaves, and erratic during a heatwave increases by 8% compared with
rainfall will increase health risks such as heat-related other periods. In addition, rising temperatures increase
mortality and vector-borne diseases such as malaria. In the risk of death in the population aged 75 years or
South Korea, the risk of death increases by 5% for every older and in chronic disease patients.
HEAT RELATED MORTALITY
Under a high emissions scenario, heatwave-related excess deaths will
increase by 274%, whereas under a medium emissions scenario the Heat-related mortality
% change with respect to 2000-2004
increase will be 171%.
In 2018, there was an 80% increase in heat-related deaths from a
2000 to 2004 baseline. 23.9% of heat-related mortality in South
Korea during 1997 to 2016 can be attributed to human-induced 2018
climate change.
+80%
IMPACTS ON LABOUR Impact on total labour
Labour is directly affected by changes in environmental conditions. % change with respect to 1986-2005 baseline
Warming affects both the number of hours worked (labour supply) and
on the productivity of workers during their working hours (labour
productivity). Both labour supply and productivity are projected to
decrease under future climate change in most parts of the world, and
particularly in tropical regions.
2050
Parts of sub-Saharan Africa, south Asia, and southeast Asia are at
highest risk under future warming scenarios. Future climate change
will reduce global total labour in the low-exposure sectors by 18
percentage points and by24.8 percentage points in the high-exposure -1.7%
sectors under a 3.0°C warming scenario
In South Korea, there was a 49.9% loss in potential hours of labour in
-3.5%
the agriculture and construction sectors in 2019, compared to the 2080
1990s baseline. Total labour in South Korea is expected to decline by
1.7% under a low emissions scenario, and by 3.5% under a medium
emissions scenario.CLIMATE CHANGE AND DENGUE
Dengue has spread throughout the tropical world over the past 60
years and now affects over half the world’s population. Globally, vecto- Dengue suitability
rial capacity for both dengue vectors (A. aegypti and A. albopictus) has % of population at risk
been rising steadily since the 1980s, with nine of the ten highest years
occurring since 2000. Climatic stressors are one important driver of the
current distribution and incidence of dengue. Climate change is likely
to expand the geographical distribution and suitability of several 89.6%
vector-borne human infectious diseases including dengue. The risk of 2050
dengue transmission is increased by warming climates, as the growth
and development of mosquitoes are significantly influenced by tempe- 88.8%
rature, precipitation, and humidity.
CLIMATE CHANGE AND ZIKA
Zika virus has spread to at least 49 countries and territories since 2013.
Climate change impacts on transmission suitability risk have increased Zika suitability
over the years and future warming over 1.3 billion additional people % of population at risk
could face suitable transmission temperatures for Zika by 2050.
89.3%
DENGUE AND ZIKA: POPULATION AT RISK 2050
The distribution range of insects that are infectious disease vectors is
expected to move northward. The domestic settlement of Aedes
81.7%
albopictus, which can spread dengue or Zika viruses, will be possible if
the average winter temperature in Korea rises to 10°C or higher in
2050.
Under a medium emissions scenario, 88.8% of the population will be
at risk of transmission-suitable mean temperature for dengue by 2050,
whereas 89.6% will be at risk under a high emissions scenario. In the
case of Zika, 89.3% of the population will be at risk by 2050 under
medium emissions, whereas 81.7% will be at risk under high
emissions.
CLIMATE CHANGE AND MALARIA
Although South Korea is no longer a malaria-endemic country, malaria
vectors are still present. By 2050, 42.7% and 44.3% of the South Malaria suitability
Korean population will be at risk of malaria under low and high % of population at risk
emissions scenarios, respectively.
44.3%
2050
42.7%
POLLUTION AND PREMATURE MORTALITY
By 2060, 1,109 deaths per year per million people will be caused by
outdoor air pollution compared to 359 in 2010.SOUTH KOREA
ENERGY
ENERGY SYSTEM IN A NUTSHELL ENERGY SUPPLY
South Korea is a highly energy-intensive economy, due South Korea's total primary energy supply energy mix shows a strong
to its industrial activity. Fossil fuels dominate the dependence on fossil fuels (83% in 2019), most of which are impor-
ted, followed by nuclear (14%), leaving only a marginal share to
energy mix, but the Korean government has committed renewables (4% including hydro, biofuels, and waste).
to a strong decarbonization pathway over the next two
decades.
This entails phasing out coal and nuclear, while increa-
sing energy efficiency in industrial production and boo-
sting renewable sources. In 2015 Korea was one of the
first Asian countries to implement an ETS scheme.
0.14 87.5%
ktoe/US$
Import
Energy intensity dependence ratio
9.2%
AC Share in
electricity
consumption
CLIMATE CHANGE TODAY
INCREASING TEMPERATURES
Residential and commercial energy demand
has risen due to faster-than-average increa-
sing temperatures (0.18°C every ten years in
the last century), heatwaves and cold spells.
HEATWAVES
The 2016 heatwave brought about 32
tropical nights, a peak electricity consump- ENERGY DEMAND
tion of 8.37 gigawatts and a rush to purchase In South Korea, energy is used mainly by industrial sectors (55% of
cooling appliances: air conditioner sales total final consumption in 2018, including non-energy uses accounting
jumped by 160% , those of dehumidifiers by for 28% of total demand, and claiming 53% of oil products), transport
245%, and those of electric fans by 92%. (19% of final demand), tertiary (12%), and residential demand (12%)
while agriculture and fishing together have a slim 1.5% share. Air
conditioning’s contribution to residential electricity demand was only
about 2.5% in 2017.FUTURE ENERGY DEMAND
Decrease in heating demand in South Korea is going to be more than
compensated by the increase in cooling needs, resulting in a net
increase in energy demand of about 1,820 PJ (505 billion Kwh) by
Net change in 2050
energy demand due to + 505.58
2050 under a medium emissions scenario.
changes in DD/CDD
Billion KWh
COOLING NEEDS COOLING DEGREE DAYS 146 314
Marked, but not extreme, increases in
heating days all over the country, more
pronounced on the west coast, where the
capital city Seoul is, and particularly in the
south-west corner of the country.
HEATING NEEDS HEATING DEGREE DAYS -489 0
An almost uniform, marked decrease in
heating needs is expected all over the
country. Slightly more pronounced decre-
ases are expected in the north-east near
the border with North Korea.
FUTURE
ENERGY SUPPLY
The future configuration of the Korean energy mix is likely to be deter- coal and nuclear and improving energy efficiency. In October 2020 a
mined by the evolution of climate mitigation policies and hence is carbon-neutrality target by 2050 was announced. This is likely to
outside the scope of this report. Korea is committed to a fast-track result in fossil fuels (and their vulnerabilities) keeping their relevance
decarbonization pathway, which foresees reaching a 20% share of for the next couple of decades, while carbon free sources and their
renewable electricity by 2030 and 30-35% by 2040, while phasing-out vulnerabilities will prevail in the second half of the century.
EXPECTED IMPACTS
-4.98% OF CLIMATE CHANGE
Change in 2050 To the best of our knowledge, there are no studies on the impacts on
Hydropower generation -2.73% South Korea’s energy infrastructure. As for other Asian Pacific
% of change countries, floods, heavy precipitation and typhoons will pose
increasing threats to such infrastructure. The planned energy
transition streamlines adaptation into new infrastructure design,
particularly for the electricity grid. A moderate drop in hydropower is
expected.SOUTH KOREA
ECONOMY
OVERVIEW
South Korea ranks 13th in terms of GDP in the G20
group. As a consequence of the COVID 19 pandemic
real GDP declined by 1% in 2020. This trend has been
reversed and in 2021 real GDP grew by 3.6%.
1.1/3.73%
2050
IMPACTS ON GDP
The available estimates for economic impact of climate change on the
whole of South Korea’s economy vary according to the emissions 0.8/1.15%
scenarios considered, the time horizon, the direct impacts covered, and
the specificities of the estimation method used.
GDP Loss
The projected overall macroeconomic impacts for South Korea range % change w.r.t baseline
from negligible GDP losses (0.3%) under a low emissions scenario in
2030, to 3.7% of GDP losses in 2050 under a high emissions scenario,
to greater than 11% GDP losses under worst case scenarios, by the end
of the century.
11.68%
2100
4.34%
SECTORAL ECONOMIC IMPACTS
IMPACTS ON INDUSTRY AND INFRASTRUCTURE
Climate-induced risks for transportation facilities and buildings are The tropicalization of the sea around South-Korean shores may result
high in coastal areas of Gangwon-do, Chungnam and Jeolla-do provin- in a drop in fish catches and/or a transition to tropical species.
ces. In the future high-risk areas for both transportation facilities and
buildings are expected to expand in the southern part of the Korean Decreases in rice yields ranging from 4% under a standard medium
Peninsula and inland areas especially under a high emissions scenario. emissions scenario by mid-century to 14% under a high emissions
scenario at the end of the century are expected. Losses for the agricul-
Over 65% of South Korean fishing ports are already vulnerable to tural sector (rice and barley) may reach 207.5 million EUR by 2050 and
sea-level rise, a percentage that rises under a high emissions scenario 409 million by the end of the century.
to 70% in 2050 and 85% by the end of the century.
IMPACTS ON AGRICULTURE IMPACTS ON FORESTRY AND FISHERY
Climate change will negatively affect future rice productivity and It is estimated that losses for forestry and ecosystems would amount
quality of food crops and positively affect the amount of barley, a to, respectively, 117 million and 206 million under a high emissions
winter crop. It is also expected that the areas more suitable to growing scenario.
fruits and vegetables will move northwards, and that the southern
islands may become suitable for the cultivation of tropical fruits.87.1
2050
SEA LEVEL RISE DAMAGES
Under the current level of coastal protection, by mid century, sea-level
rise and coastal flooding can cost the country 41.8 to 87.1 billion EUR
in terms of expected damages to assets in the low and in the high
emissions scenarios, respectively. 41.8
By the end of the century, expected losses can increase to 84.9 billion
Sea Level Rise
Expected annual damages
and 274.9 billion EUR under low and high emissions scenarios, Billion Euro
respectively.
274.9
2100
84.9
1.3
RIVER FLOODING DAMAGES 2050
River flooding can also provoke damages. By mid century total asset
losses are projected to be 1.5 to 1.3 billion EUR and in the second half
of the century 0.9 to 4.5 billion EUR under low and high emissions
scenarios, respectively. Riverine 1.5
Flooding
Expected annual damages
Billion Euro
4.5
2100
0.9
IMPACTS ON ENERGY IMPACTS ON TOURISM
As with all other economic sectors, energy supply and energy networks Korea ranked 28th as an international tourist destination in 2017,
in South Korea will undergo more intense stress from extreme with 13.36 million arrivals. Tourism is mostly a domestic activity and
weather events. its dymanics are driven more by international politics or health crises
than by climate change.
Economic impacts of shifts in household and firm energy demand (see
chapter on energy) are difficult to predict and will mostly lead to However, mountain tourism in South Korea is likely to be hit signifi-
redistribution effects. In the case of South Korea, the magnitude of the cantly by climate change, with all 17 ski resorts to be gradually driven
increase in demand for cooling is expected to exceed by far the one of out of business by the end of the century: three ski resorts will cease
the decrease in heating demand, hence a significant increase in operations by the 2030s, 12 by the 2060s and the two remaining ski
energy bills is expected. resorts during the 2090s.SOUTH KOREA
POLICY
OVERVIEW INTERNATIONAL COMMITMENTS
Although South Korea is the 12th largest emitter To achieve the Paris Agreement's target, South Korea submitted an
among G20 countries, it is also 6th in terms of emis- NDC committing to reduce its emissions by 37% in 2030, with referen-
ce to a business-as-usual scenario. Recently, South Korea updated its
sions per capita. South Korea has more than doubled NDC, committing to reduce by 24,4% in 2030 with reference to the
its emissions in recent decades and the emission trend emission level of 2017
is still growing steadily.
CLIMATE POLICY
COMMITMENTS CHRONOLOGY
244 673
MtCO2eq MtCO2eq
2002 KYOTO PROTOCOL - 1ST PERIOD
No target
2016 PARIS AGREEMENT - 1ST NDC
37% GHG reduction by 2030, with reference to a
specific business-as-usual scenario
2020 PARIS AGREEMENT - NDC UPDATE
1990 GHG EMISSIONS 2018 24.4% GHG reduction by 2030, with respect to
2017 levels
INTERNATIONAL CLIMATE The diagram shows climate-related development finance provided by South Korea in
2017-2018. The total amount is 702 million USD, mainly in the form of grants. The majority is
FINANCE ASSISTANCE directed to bilateral channels, in particular in Eastern and South-Eastern Asia.SUSTAINABLE RECOVERY POLICY ADAPTATION POLICY HIGHLIGHTS
The Global Recovery Observatory reports that South Korea spent TRANSNATIONAL INITIATIVES
685.79 billion USD in 2020. In particular, 186,84 billion USD was
devoted to the post-covid recovery. 26,7% of this was dedicated to Transboundary Diagnostic Analysis for the Yellow
Others: 4.387
sustainable recovery, in particular electric mobility, Billionenergy,
renewable USD Sea Large Marine Ecosystem
building retrofitting, and nature conservation The objective of this regional project is to achieve adaptive ecosy-
stem-based management of the Yellow Sea Large Marine Ecosystem
bordered by China, South Korea and North Korea by fostering
long-term sustainable institutional, policy and financial arrangements
NATIONAL INITIATIVES
685.79 186.84 53.97 Web-Based Supporting Tool for climate change
billion $ billion $ billion $ vulnerability assessment (VESTAP)
Total Spending Recovery Spending Green Spending The VESTAP is a tool to visualize a full database of impacts and vulne-
rability assessment. The database includes 455 impacts of future
climate data simulated with RCP 4.5 and 8.5, atmospheric environ-
ment data and other social statistics
DOMESTIC ADAPTATION POLICY Korea Adaptation Center for Climate Change (KACCC)
South Korea included adaptation in its NDC. The country adopted both KACCC aims to enhance the climate resilience in all the sectors across
a National Adaptation Strategy and a National Adaptation Plan. the country and develop science-based adaption strategies
Sub-national administrations have to develop their own adaptation
plan. SUBNATIONAL INITIATIVES
Inclusion of Adaptation in NDCs Daegu Climate Change Adaptation Strategies
The “Daegu Climate Change Adaptation Strategies” is an official plan
Domestic Integrated Adaptation & Mitigation Policy established to seek out vulnerable areas and prepare countermeasu-
Adaptation Policy res. Daegu has been establishing and implementing these strategies
Dedicated Adaptation Strategy
every five years since 2012
Dedicated Adaptation Plan Promise of Seoul
The Promise of Seoul is a comprehensive integrated strategy to both
Sectoral Adaptation Plans mitigation and adaptation. It covers all areas of climate change,
Subordinate including energy, air quality, transportation, resource recycling, water,
Adaptation Policies Subnational Adaptation Plans ecology, urban agriculture, health, safety and urban planning
Policy not in place Active policy
ENERGY TRANSITION Energy Transition Fossil Fuels
South Korea is performing well in the Electrification and in Efficiency
domains, revealing how digitalization is one of the main enablers of 58.7 45.3
the energy transition. However, much still needs to be done in terms of
increasing electricity generation from renewable energy sources. 51.0
58.4
Investing in renewables can also help improve urban air quality and
reduce CO2 and other emissions, which hinder the fight against clima- Renewables Efficiency
te change. With regards to the Fossil Fuels indicator, performance is
above average.
19.7 84.9
3.1 87.5
Only actively pursuing an energy transition based on
decarbonization and electrification – from policy and
regulation, to health and education – will enable Electrification Emissions
countries to benefit the most from future opportunities
G20 AVERAGE and fight climate change whilst ensuring an72.9equitable
70.8 72.9
distribution of wealth.
COUNTRY The Energy Transition indicators were developed by Enel
Foundation in cooperation with SACE, and provide a 80.0 70.2
retrospective analysis based on historical data.You can also read