INDONESIA G20 CLIMATE RISK ATLAS - Impacts, policy, economics - CMCC Foundation
←
→
Page content transcription
If your browser does not render page correctly, please read the page content below
G20 CLIMATE RISK ATLAS
Impacts, policy, economics

INDONESIA
                                                                                                                                      With the scientific
                                                                                                                                       contribution of
                                                                                                                                      Enel Foundation

How to read the Atlas: graphs, colours and scenarios.
The maps used in this Atlas are taken from The World Bank Official Boundaries -
(accessed on May 28, 2021). For the section Energy, the maps are based on Panoply Data Viewer
Each sector of this Atlas contains data and information on various climate scenarios.
When reported in graphs, the colour black indicates data and information referring to the current state, the past or the baseline.
When the authors refer to RCP (Representative Concentration Pathways), the 3 colours used across the factsheet refer to 3 scenarios, which are 3
different development options with different levels of greenhouse gas emissions, respectively low emissions (green), medium emissions (orange), and
high emissions (red). The same colour code is used when RCPs are associated with Shared Socioeconomic Pathways (SSP).
In some cases, the authors refer to global warming scenarios. In these cases, the 3 colours used refer to a temperature rise of 1.5°C (green), 2°C (dark
green), and 4°C (red).
When the authors refer exclusively to Shared Socioeconomic Pathways - SSPs (Population affected by river floods in the section: “Water"), data related to
SSP3 - that encompasses, among other things, slow economic growth, material-intensive consumption, and persisting or worsening inequalities – are
reported in a lighter shade; SSP5 – which refers to social and economic development that is coupled with an energy-intensive lifestyle and the abundant
exploitation of fossil fuel resources – is shown using a middle shade of the colour, whereas data related to the present conditions are represented in a
dark shade.
Further details on scenarios, methodologies, and the full list of references are available at: www.g20climaterisks.org
                                                                                                                      Concept and graphic design by element6.eu
INDONESIA

CLIMATE
OVERVIEW                                                               TEMPERATURE PROJECTIONS
Indonesia is almost entirely dominated by a tropical                   Under a low emissions scenario projected temperature variations will
climate which is largely hot and humid, with rainfall                  remain contained under +1°C, both by 2050 and 2100.
                                                                       Under a high emissions scenario, with no reduction in GHG emissions,
occurring mainly in low-lying areas and mountainous                    much greater temperature anomalies are expected by both 2050 and
regions that experience cooler temperatures. Indone-                   2100.
sia sees drier conditions during El Niño events and
wetter conditions during La Niña events. The wet
season occurs between November and April, leaving                                                                                   +3.9°C
May and October typically dry. Relative humidity varies                        TEMPERATURE                                          +1.9°C
between 70% and 90% and cooler temperatures                                    ANOMALY                                              +0.8°C
prevail at higher altitudes.
TEMPERATURE                                                                                                      +1.6°C
The temperature regime in Indonesia is mainly regulated by the                                                   +1.1°C
uniformly warm waters surrounding approximately 81% of the                                                       +1.0°C
country. Higher temperatures are found on the coastal plains and
lower ones in the mountainous areas. Seasonal variations in tempera-
ture are not so significant.                                                                +0.3°C

MEAN                         +11                               28
                                                                        -0.1°C
TEMPERATURE                        Celsius degrees / Over 1991-2020

                                                                        1985               2014                  2050                  2100

                                                                       Historical Period

                                                                       EXPECTED VARIATION
                                                                       FOR TEMPERATURE AT 2050
                                                                       The indicators show variations in selected temperature characteristi-
                                                                       cs for a thirty-year period centred on 2050 (2036-2065) with respect
                                                                       to the reference period 1985-2014.

TEMPERATURE TREND                                                                  +1.5°C                  +1.5°C                     +1.5°C
Temperature anomalies over the last 60                        max
years with respect to the annual mean of                    1.4 °C                   +1.2°C                  +1.2°C                        +1.2°C
25°C in Indonesia during the 1961-1990
period                                                                             +0.9°C                  +0.9°C                     +0.9°C
 1961                                                                  Annual Mean            Max Temperature           Min Temperature
                                                                       Temperature            of warmest month          of coldest month

                                                             2020
 -0.5 °C
 min
PRECIPITATION                                                                  PRECIPITATION PROJECTIONS
The precipitation regime in Indonesia is variable, especially during the       Precipitation trends show a very complex signal,
wet and dry seasons. The main variation in average annual precipita-           under all emissions scenarios, with a very large
tion occurs in the southern regions (although this includes increases          variability among climate models. This can be explai-
in wet season precipitation), whereas variations in precipitation in the       ned considering the complexity of the precipitation                      +6.8%
northern regions is accompanied by a decrease in dry season precipi-           regime and dynamics requiring                                            +2.9%
tation.                                                                        more detailed spatial and tempo-                                         +2.2%
In general, precipitation in lowland areas averages 1,800-3,200                ral analysis.
millimetres per year, increasing with altitude to an average of 6,100
millimetres in some mountainous areas. In the lowlands of Sumatra                       PRECIPITATION                            +3.0%
and Kalimantan, the precipitation range is 3,050-3,700 millimetres.                     ANOMALY                                  +0.1%
The amount decreases towards the south, in proximity to the desert of
                                                                                                                                 -1.8%
north-western Australia.

                                                                                                       +6.6%
MEAN                         905                                 15,200
                                                                                -1.0%
PRECIPITATION                              mm/year / Over 1991-2020

                                                                                1985                   2014                      2050                    2100

                                                                              Historical Period

                                                                               EXPECTED VARIATION
                                                                               FOR PRECIPITATION AT 2050
                                                                               The indicators show variations in selected precipitation characteristi-
PRECIPITATION TREND                                                            cs for a thirty-year period centred on 2050 (2036-2065) with respect
Precipiation anomalies over the last 60                                        to the reference period 1985-2014.
years with respect to the annual mean of                              max
2,792 mm/year in Indonesia during the                              +26%
1961-1990 period                                                                               +2.3%                          +2.9%                      +0.4%
 1961                                                                                            +2.2%                           +2.3%                    +1.9%

                                                                                               +2.1%                          +2.4%                      +0.6%
                                                                                Annual total                  Precipitation of           Precipitation of
                                                                                precipitation                  wettest month             warmest quarter

 -25%                                                               2020
 min
                                                                  +15%                          +13%                          +7,933%                    +25%

                                                                   +10%                          +8%                             +911%                      +11%
VARIATION OF SPECIFIC                                             +8%                           +8%                           +328%                      +5%
CLIMATE INDICATORS                             Agricultural drought         Hydrological drought                 Heatwave                    Runoff
                                                proportion of time           proportion of time                  duration                   increase
Climate indicators variation showing                % of time                     % of time                      % of time                  % of area
impacts of climate change on sectors such
as agriculture, health and water. Analysis                        +32%                          +9%                           +98%                       +35%
considers 3 threshold average temperatu-
re increase: +1.5°C, +2°C, +4°C.                                   +17%                          +8%                             +60%                       +18%

                                                                  +14%                          +8%                           +34%                       +9%

                                                   Agricultural                Hydrological                      Heatwave                    Runoff
                                                drought frequency            drought frequency                   frequency                  decrease
                                                   % of change                   % of change                    % of change                 % of area
INDONESIA

OCEAN
OCEAN IN INDONESIA                                                      FUTURE PROJECTIONS
Indonesia's marine exclusive economic zone (EEZ) is                     Projected annual changes within the marine EEZ for the two most
almost entirely tropical with warm water temperatures                   significant marine indicators of climate change: sea surface water
and a wide ensemble of ecosystems such as coral reefs,                  temperatures and pH.
seagrass meadows, algal beds, and mangroves. Indone-                    Seawater temperature changes are in line
sian coastal systems can be divided into three main                     with the definitions of each scenario, with
areas: the Java Sea, the Banda Arc and the southern                     maximum values above +3°C under a high                +3.3 °C
Indian region.                                                          emissions scenario in 2100.                            +2 °C
                                                                                                                              +1.3 °C
CURRENT CLIMATE CONDITIONS
Mean sea surface temperature reflects the Tropical climate of the
region, with values ranging between 27°C and 31°C.                              SEA SURFACE             +1.5 °C
                                                                                TEMPERATURE             +1.2 °C
                                                                                ANOMALY
                                                                                                        +1.1 °C

                                                                                           0.2 °C

                                                                         -0.3 °C

 27                                           31          MEAN           1950                 2014         2050                   2100

SEA SURFACE TEMPERATURE
Celsius degrees / Over 1991-2020

 0                                           0.3        TREND
                                                                         0.04

                                                                                            -0.01

                                                                                                          -0.09
                                                                                SEA SURFACE
                                                                                pH ANOMALY                 -0.11
                                                                                                          -0.14

                                                                        Seawater surface pH becomes more acidic in              -0.08
                                                                        all scenarios, closely reflecting rising                 -0.17
                                                                        atmospheric CO₂ concentrations, and only a
                                                                                                                                -0.37
Surface temperature trends indicate a general warming of 0.2°C per      low emissions scenario leads to a stable
decade in all marine areas, with increased gains in the Banda Sea and   condition by 2100.
the Indian oceanic region.
ECOSYSTEM
INDICATORS AT 2050
Regional changes in key marine ecosystem indica-
tors under projected future scenarios by mid-cen-
tury (2036-2065) with respect to present climate
conditions (1985-2014).                                                      Banda Arc                  Indian                   Java Sea

                                                                                         +1.61 °C                +1.48 °C                 +1.67 °C
Temperature regulates the metabolism of marine
organisms determining which habitats remain                                   29.30°C     +1.35 °C    29.02°C     +1.22 °C     29.17°C     +1.44 °C
suitable. Excessive warming will likely push
ecosystems beyond tolerance thresholds.                                                  +1.18 °C                +1.03 °C                 +1.31 °C

                                                                                         -0.14                   -0.14                    -0.15
pH represents the acid/base status of marine
waters, where a decreasing pH reflects the                                       8.06                    8.06                     8.06
                                                                                          -0.11                   -0.11                    -0.11
acidification of the ocean due to increased
absorption of atmospheric CO₂.                                                           -0.09                   -0.09                    -0.09

Oxygen is fundamental to sustain marine life and                                         -1.78 %                 -2.2 %                   -2.05 %
its reduction can have a large impact on coastal                               200.72     -1.37 %      201.75     -1.71 %      202.03      -1.62 %
ecosystem services including fisheries and                                     mmol/m3                 mmol/m3                  mmol/m3
aquaculture.                                                                             -0.99 %                 -1.18 %                  -1.16 %

Chlorophyll is an indicator of the biomass                                               -14.12 %                +2.96 %                  -0.76 %
available at the base of the marine food web                                    0.26      -17.56 %       0.2      +2.96 %        0.26      -5.7 %
supporting all ecosystem productivity.                                         mg/m3                   mg/m3                    mg/m3

                                                                                         -9.92 %                 +0.49 %                  -11.41 %

FISH CATCH POTENTIAL                                                              ANALYSIS DETAILS
Fish catch potential is an estimate of the maximum fish catch achie-               All datasets were analysed using only data from within the
vable given the marine resources available over a sustained period. It            marine EEZ and therefore excluding overseas territories,
is linked to the concept of maximum sustainable yield, meaning the                detached islands and any disputed or joint territories with
maximum amount of fish that can be extracted from a system without                 other nations. In the assessment of current climate conditions,
causing a collapse in fish populations.                                            seawater surface tempererature data was obtained using
                                                                                  satellite observations distributed in the framework of ESA
It is a characteristic of the natural system, which is substantially              Climate Change Initiative.
different from realized catch, and a direct result of the fishery policy in
place.                                                                            Future projections of marine indicators are represented by the
                                                                                  combined analysis of results from 15 different Earth System
                                                                                  models participating in the Coupled Model Intercomparison
                                                                                  Project Phase 6 (CMIP6). These models include new and better
                                                               -20.3%
Fish catch                     2050                                               representations of physical and biogeochemical processes,
                                                                                  compared to previous IPCC assessment reports.
percentage
change                                                                            Fish catch potential data was obtained using the FAO's techni-
                                                               -5.8%              cal report and refers to the best and worst case climate scena-
                                                                                  rios from the Fifth IPCC Assessment Report. These mean
                                                                                  estimates are subject to substantial uncertainties as discussed
                                                                                  in the original work.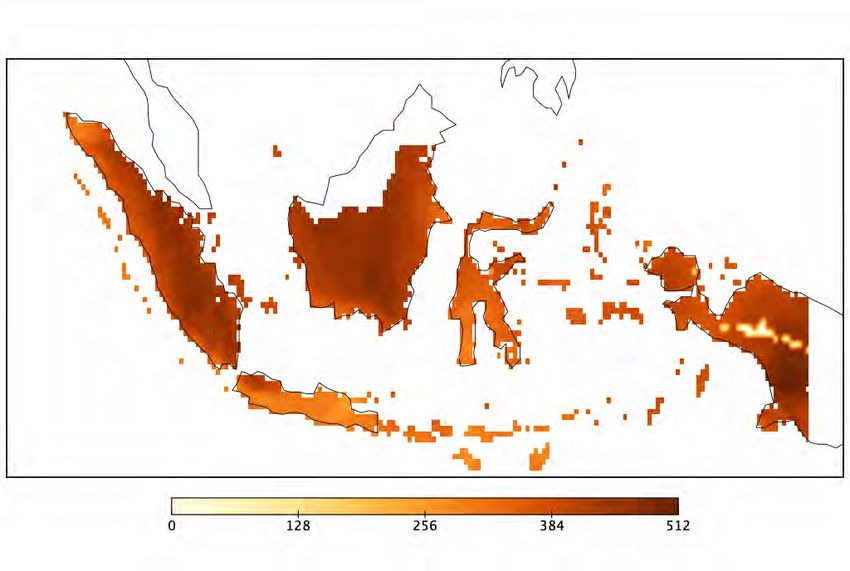
INDONESIA

COASTS
OVERVIEW
Indonesia is a densely populated archipelago of more
than 17,000 islands and 95,000 kilometres of shoreli-
nes. The country’s coast hosts important ecosystems                         Shoreline                           95,181 km
and is rich in biodiversity and natural resources which                     Length
are used for fishing, recreation, waste disposal, power
generation, water supply, sands extraction, forestry,
farming, residential and industrial purposes. The
islands of Java and Sumatra are home to most of the                         Sandy
population, including the large coastal cities of Jakarta,
Surabaya and Palembang.                                                     Coast Retreat                                           -39.7 m
                                                                            at 2050

CLIMATE CHANGE HAZARDS
Coastal hazards such as erosion, storm tide inundation and permanent       can exacerbate erosion issues and drive flooding in low lying areas
flooding, can have strong adverse impacts on coastal regions, with          along the coast. In addition, changes in rainfall patterns can further
loss of sandy shores, damage to settlements, infrastructure and ecosy-     exacerbate flooding risks for low lying coastal areas. Land subsidence
stems. Climate change can exacerbate these impacts due to rising sea       is a major concern for the capital city Jakarta, which is losing land to
levels and increasing impacts of waves and storms. Climate change          the sea and is expecting major impacts from future sea level rise.
impacts on the coastal zones of Indonesia are mainly driven by rising
sea levels and possible changes in storm intensity and direction, which

SEA LEVEL RISE                                                             EXTREME SEA LEVEL
Relative sea level rise has been observed over the past century with a     On average, one in 100 extreme sea level events are expected to rise
yearly average increase of approximately 4.97 millimetres per year         from 1.34 metres at present day to 1.55 metres by 2050 under a
since the 1990s. This high value reflects land subsidence in some parts     medium emissions scenario.
of the country. The latest IPCC projections indicate that, by 2050,
global sea levels may rise between 0.18 metres, under a low emissions
scenario, and 0.23 metres, under a high emissions scenario.

                                                              0.23 m                                                                        1.62 m
Observed and                                                               Current and
projected sea                       4.97                                   projected extreme                  1.34 m                          1.55 m
level rise at 2050            mm/year                                      sea level at 2050
                                                              0.18 m

  OBSERVED                                                                    FUTURE
 STORMS           The Indonesian coast is exposed to waves from the
                  Indian Ocean, the Pacific Ocean and internal seas. In
                                                                            STORMS           Waves and storms around the Indonesian coast are
                                                                                             expected to change in the future. However, trends and
                  general, a general trend of increasing wave height has                     patterns are quite unclear and heterogeneous given the
                  been observed at different locations.                                      size and diversity in wave climate and exposure of the
                                                                                             Indonesian archipelago. More intense tropical cyclone
                                                                                             activity is expected in response to warming ocean
                                                                                             surfaces on both the Indian Ocean and Pacific Ocean side
                                                                                             of the vast archipelago. Rising sea levels will also
                                                                                             increase the frequency of extreme sea level events, such
                                                                                             as the one in 100 year water level.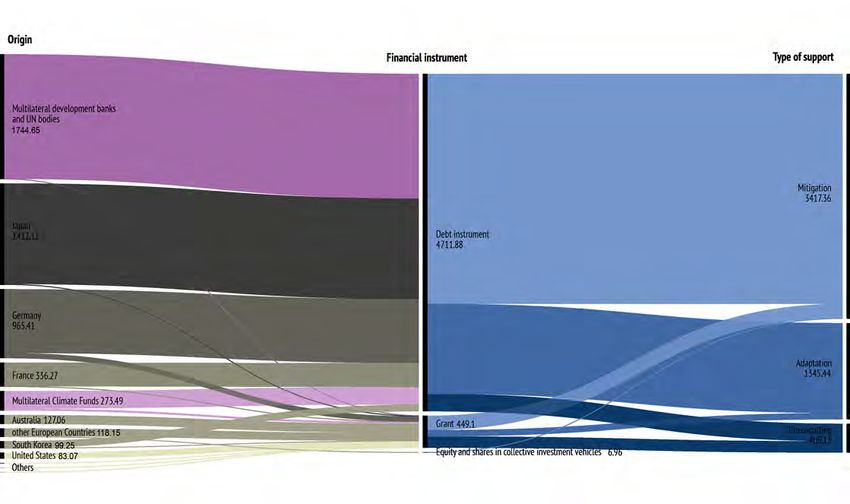
VULNERABILITY AND RISK
         Sea level rise in Indonesia is expected to impact all                                                          VULNERABLE
         areas where population is concentrated and in particu-                                          HISTORICAL     POPULATION
         lar the capital city of Jakarta, which is home to more
         than 10 million people.

         In Jakarta, the impact of sea level rise is compounded by                                    8.90 Million
         one of the highest rates of land subsidence in the
         world, which is threatening the livelihoods of poorer
         and marginalised parts of the population in particular.
         Other areas of Indonesia are expected to suffer from                                              2050
                                                                                                                                      12.00 Million
         increasing erosion which may impact economic activi-
         ties.                                                                                                                          11.00 Million

         The shoreline of the island of Bali, the main tourist destination in                                                         11.00 Million
         Indonesia, is subject to severe coastal erosion. In addition, densely
         populated parts of Java and Sumatra are exposed to sea level rise risk.
         Under a medium emissions scenario the population exposed to the
         one in 100 annual coastal flood level is expected to increase from 8.9                                                        16.00 Million
                                                                                                           2100
         million to 11 million by 2050.
                                                                                                                                        14.00 Million

                                                                                                                                      13.00 Million

                           INFLUENCE OF SEA LEVEL RISE
                           ON EXTREME SEA LEVEL                                              + Wave set up refers to the accumulation of water near
                                                                                             the shore due to the presence of breaking waves.
         Present and future sea level rise are a consequence of
         carbon induced global warming causing melting ice                                   + Storm surge is an occasional increase in sea level driven
         and ocean expansion due to heat accumulation.                                       by shoreward wind-driven water circulation and atmo-
                                                                                             spheric pressure.
         The extreme sea levels reported here are based on the 100-year storm
         surge + wave set up + sea level rise + high tide indicators. The first two           + High tide is usually the highest tide reached in a given
         parameters (storm surge + wave set up) are based on the 100-year                    location based on tide records.
         value for the event; sea level rise is its projected value at 2050; and
         high tide is the absolute value of the highest tide calculated for a
         given locality, which won’t be influenced by climate change.

                                                                                                                                                 Wave set up
                                                                                                                                                         Storm surge
         Wave set up                                                                                                                             Storm surge
Storm surge
        Storm surge
          Lowest  tide

            Mean sea level                                                  Extreme     Mean sea level
                                                                                                                                                 Sea levelSea
                                                                                                                                                           riselevel rise
Sea levelSea
          riselevel rise                                                    sea level
                                            0m elevation (AHD)                                                         0m elevation (AHD)
Hig tide Hig tide                                                                       Lowest tide                                                   Hig tide Hig tide

         Present sea levels have risen globally by approximately 20 centime-            Future sea level rise is a projection based on different global
         tres over the past century.                                                    warming scenarios, at approximately 100 centimetres by the end of
                                                                                        2100, with consequent inundation during extreme sea level events.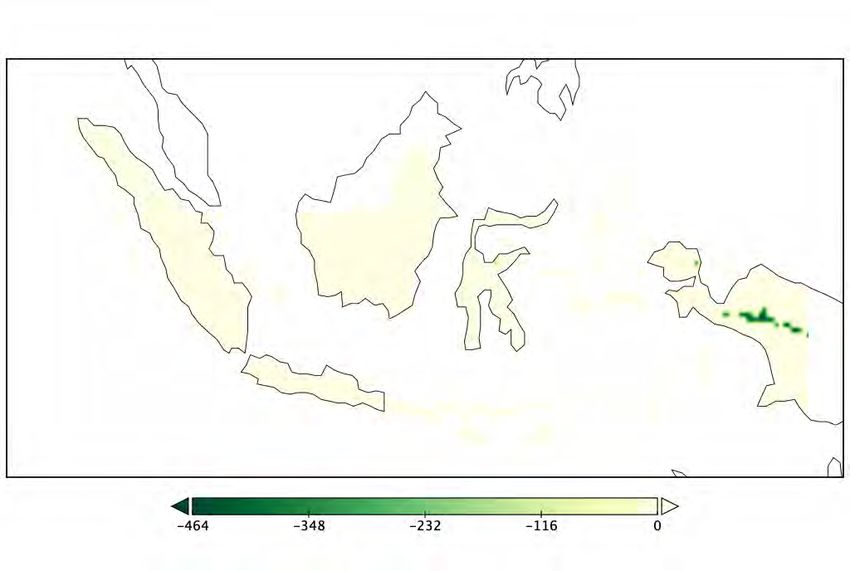
INDONESIA

WATER
OVERVIEW
Indonesia has abundant water resources, however they
are unevenly distributed throughout the archipelago.                        Renewable internal                  2,019
Rain measurement data for the country indicates that                        freshwater resources             billion m3
it has abundant rainfall, though in certain areas occa-
sional water shortages or droughts take place.

When combining groundwater and surface runoff,
Indonesia has a potential average water availability of                     Renewable internal                 7,628
about 2,100 millimetres per year. Significant impacts                        freshwater resources                     m3

of land-use changes and environmental degradation                           per capita
are now believed to have changed the natural carbon,
nutrient and water cycles.                                                 Even though Indonesia is a humid tropical country with high annual
                                                                           average rainfall, the archipelago has to cope with several water-rela-
                                                                           ted problems, such as rising water demand, lack of upland/upstream
                                                                           land management, erosion-related degradation, population growth,
                                                                           inefficient irrigation water management, extreme climatic change and
                                                                           over-pumping of groundwater.

CLIMATE CHANGE HAZARDS
Climate change can affect water resources through increasing tempe-        compared to the previous century, particularly during dry seasons
ratures, higher rates of evapotranspiration and altered rainfall           which are becoming longer. Furthermore, the current trend in seaso-
patterns. This leads to changes in the water cycle, including decrease     nal rainfall changes also implies a proportional reduction in monthly
of snow and ice coverage, alterations of surface runoff and groundwa-      discharge for Java’s major rivers. Significant decline in rainfall has
ter storage, as well as drought and flood occurrence. In Java, Indone-      threatened Indonesia's water resources due to depletion of forest
sia’s most populated island, rainfall has seen a marked decrease           resources and global climate change.

KEY POINT RUNOFF
                                                                                                                                     +31.6%
Deterioration of watersheds damages the environment and leads to           2050
negative consequences downstream, including massive sedimenta-                        Changes in
tion of reservoirs, and possibly a change in the runoff pattern, leading              annual runoff
to higher peak flows and reduced dry season flows on the archipelago.                   % of change
This effect will possibly be aggravated by the impacts of climate                                                                    -11.3%
change.

At a country scale, an average change in surface runoff by approxima-
tely -11% and +32% is expected respectively under low and medium                                                                     +35.0%
emissions scenarios for the 2045-2055 period compared to                   2050
2015-2025.                                                                            Runoff increase
                                                                                      % of area
If temperatures rise by 1.5°C, 2°C or 4°C, 17%, 33.4% or 43% of the
country will likely experience an increase in runoff, while 3%, 6.4% or                                                              +9.0%
17% of the surface of the country will likely experience a decrease in
runoff, respectively.
KEY POINT DROUGHTS
                                                                                                                                    +1.9%
The Indonesian climate is naturally variable from year to year and, at
times, drought may occur. Most recorded droughts can be related to
                                                                          2050     Severe drought
“warm” El Niño episodes: in these cases, the normal patterns of                    likelihood increase
tropical precipitation and atmospheric circulation become disrupted                % of change
and rainfall is reduced over Indonesia, Malaysia, and northern Austra-                                                              +3.6%
lia. A similar correlation is found when a strong Indian summer
monsoon generates easterly wind that eventually causes drought in
Java–Sumatra. The droughts are most notable in the period from
August to December, resulting in a late and reduced onset of the rainy                                                              +9.0%
season. According to recent studies, Indonesia will experience drier
conditions during the boreal summer due to the effect of the global
                                                                          2050     Hydrological
warming. Impacts include the potential for wide-spread forest fires                 drought frequency
over the archipelago, particularly in Sumatra and Borneo.                          % of change
                                                                                                                                    +7.0%

KEY POINT GROUNDWATER
The average annual rainfall in Indonesia is of 2,700 millimetres: of
                                                                                                                                    +25.4%
which, only an average of 278 millimetres (10%) infiltrates into           2050     Groundwater
groundwater. The most relevant groundwater basins can be found in                  Recharge
the north of Java and Sumatra, and in the south of Kalimantan and                  % of change
Sulawesi. Deep groundwater is overexploited in most urbanized areas.
Low coverage or poor performance of water supply companies, combi-
                                                                                                                                    -11.9%
ned with lack of permit enforcement, leads to many industries and
housing estates using deep groundwater. The deep aquifers from            saltwater intrusion, associated with sea level rise, and overexploita-
which groundwater is drawn are usually not replenished and, as a          tion of groundwater may increment in the next decades, leading to a
consequence, they are gradually depleted. This causes rapid               further depletion of the basins. At the country level, a -12%, +2.5% and
drawdown of the groundwater table and land subsidence. Serious            +25% change of the annual groundwater recharge for the period
impacts are felt in north Jakarta, Bandung, and Semarang. Coastal         2045-2055 compared to the timeframe 2015-2025 is expected
groundwater may be susceptible to changes in salinity because of          respectively under under low, medium and high emissions scenarios.

KEY POINT FLOODS                                                          POPULATION AFFECTED BY RIVER FLOODS
With a climate characterized by high rainfall, frequent intense storms     TODAY                                                        86,859
and high runoff, floods are a natural phenomenon in Indonesia. Their
impacts are, however, gradually increasing due to settlement and                                                                          people
economic development in flood-prone areas.                                  2050 SSP3                                                  250,046
Flooding has become a major problem in Indonesia, particularly in                                                                         people
Java where a large and expanding population combined with past             2050 SSP5                                                   219,103
lapses in spatial planning and land management has permitted
                                                                                                                                          people
substantial development in flood-prone areas.

Between 1970 and 2011, 3,980 flood events in Indonesia damaged an          precipitation (more than 50 millimetres of rain) is expected, with 0.26
estimated 1.1 million hectares of cropland and 65,000 kilometres of       days under a low emissions scenario and 0.41 days under a medium
roads. By 2050 a slight increase in the number of days with intense       emissions scenario.

RISK INDICATORS
The water stress index summarises current and future water related
vulnerabilities and risks at the global level. Scores are based on the
ratio of total water withdrawals, including agriculture, industrial and
human consumption, to available renewable surface and groundwa-
ter supplies.

WATER STRESS
Indonesia's water stress level is considered medium-high for the
recent past (1960-2014 average), and it is expected to increase in the
near future (2030-2050) based on climate change projections.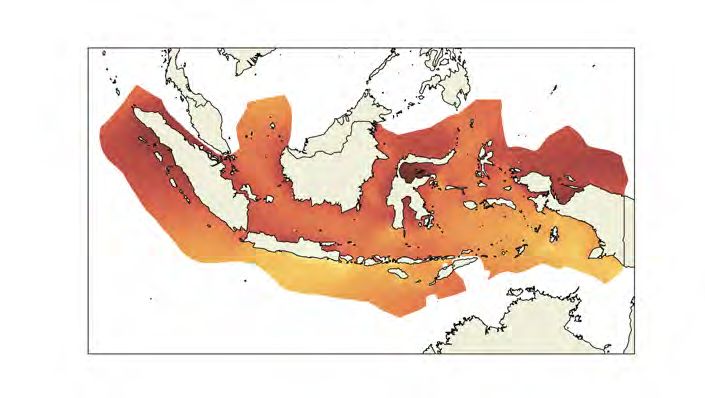
INDONESIA

AGRICULTURE
OVERVIEW
Indonesia is one of the world's largest producers and
exporters of agricultural products, supplying important
commodities such as palm oil, natural rubber, cocoa,
coffee, rice, and spices to the rest of the world.
                                                                               240.9 Mt                                   30.3 Mt
Large plantations dedicated to export cover about 15% of the total             Oli Palm                                     Maize
agricultural area. However, the majority of farmers are smallholders
operating on less than one hectare. The country is a net importer of
grains, horticulture and livestock produce. Wetlands play a very impor-
tant role in food production, including rice and secondary crops                                     59.2 Mt
(maize, cassava, soybean, sweet potatoes, peanut).                                                    Rice

Besides food crops, Indonesia also produces a large number of peren-
nial crops, including rubber, coconut, palm oil, coffee, cocoa, and tea,       29.5 Mt                                    16.1 Mt
which are currently exported.                                                 Sugarcane                                   Cassava

Added Value of Agricultu-              Share of Agriculture                   Agricultural                           Area Equipped
 re, Forestry and Fishing            Value added in Total GDP                    land                                 for Irrigation

                                2000                                   2000                           2000

          67,446                                 17.1 %                         36,000                                      5,500
         USD Million                                                          Thousand HA                               Thousand HA

                                 2018                                  2018                           2018

          129,595                                 13 %                          51,300                                      6,722
         USD Million                                                          Thousand HA                               Thousand HA

EXPECTED IMPACTS
ON AGRICULTURE PRODUCTIVITY                                                                                                 Rising
                                                                                                                      temperatures
                                                                                     Changes in
Rising temperatures, reduction in average annual precipitation, and                  precipitation
intensification of extreme events such as heat waves and drought,                     patterns
affect production variability with a tendency towards yield                                                                  Increased
reduction for many cultivated species, accompanied by a probable                                                      frequency of dry
decrease in food quality. Crops respond to increases in temperatures                                                spells and drought   Temperature
with changes in duration of the growing season, early appearance of                                                                        variability
phenological phases and potential shifts of cultivation areas toward                                   Increasing intensity of
higher latitudes and altitudes for better growing conditions. Howe-                                    extreme weather events
ver, impacts vary significantly depending on the geographical area
and specific crops in question.
CROP PRODUCTIVITY 5.2 2.4 (-4.6)% 5.4 -6.1 (-8.1)%
Crop productivity refers to the harvested yield of a crop per unit of
land area. It is strongly influenced by climate and other environmental 3.1 (-6.1)% -5.7 (-9.3)%
and management factors. Rice Maize
tons / ha tons / ha
Climate change is expected to have an impact on the productivity of
several major crops, although this may in part be offset by the fertili- 68.2 -5.3 (-5.5)% 22.9 1.7 (-8.2)%
zing effect of higher CO₂.
-7.6 (-7.8)% 4.9 (na)%
Impacts are estimated using a range of model projections based on Sugarcane Cassava
tons / ha tons / ha
low to high emission scenarios and reported as percentage changes
between the 30-year average around the historical period and the
30-year average around 2050. Productivity change with (without) the CO₂ fertilization effect.
2050
Estimates assume sufficient water and nutrient supplies, and
do not include impacts of pests, diseases, or extreme events.
CHANGE IN RICE CHANGE IN MAIZE
_ = + _ = +
Rice production in the highlands is expected to see higher future sing temperatures, and in particular when water availability is low
yields compared to the lowlands. Furthermore, lowlands along the during El Niño events. Over half of medicinal plant species may lose
coasts may also be affected by sea level rise. Sugarcane productivity up to 80% of their growing areas due to climate change. Habitat losses
may suffer from increasing temperatures, as cool winters are needed will be aggravated by deforestation and sea level rise. Climate change
to facilitate sucrose storage. Sugarcane production is extremely vulne- will affect palm oil production severely, especially after 2050. Accor-
rable to climate change and extreme climate events, such as drought, ding to recent studies, palm oil production may decrease from 10% to
heat, and flooding. Maize production may also be affected by increa- 41% if temperatures rise from 1 to 4°C.
ADAPTATION IN AGRICULTURE AND WATER RESOURCES
Climate change may have some positive effects on some of the most through September. A substantial increase in water demand (45-55%)
widely used crops. However, higher temperatures will generally is foreseen to support irrigation needs. More than 50% of irrigated
require an increase in irrigation demand due to higher plant evapo- areas have damaged irrigation infrastructure. Adaptive strategies and
transpiration. Total rainfall is expected to increase by an average of appropriate water management will become increasingly necessary to
10% from April through June, but decrease by 10 to 25% from July ensure stability and availability of food.
CHANGE IN WATER DEMAND
_ = +
Agriculture
Water Demand +52.1%
% of change
+45.9%
2050
Coping with climate risks will require a substantial impro-
vement in water infrastructure and adaptation practices,
such as crop varieties that enhance water-use efficiency, to
limit stress on freshwater resources.INDONESIA
FORESTS
FORESTS IN INDONESIA
Tropical Indonesian rainforests are, by extension, the 1990
third largest in the world and nearly half of which are
primary forests. Furthermore, the total area of mangro-
ve forest in Indonesia is estimated at about 3.2 million
hectares, amounting to 20% of the world's mangrove 119 Mln ha 94 Tons/ha
forest area. Million hectares Tons of Carbon per hectare
Forested area Carbon stock
Unfortunately, the rate of primary forest loss due to
deforestation is one of the highest in the tropics. 2020
FORESTED AREA AND CARBON STORAGE
Although forests still cover half of Indonesia there has been a sharp 92 Mln ha 104 Tons/ha
Million hectares Tons of Carbon per hectare
decline inrecent decades. Indonesian forests are among the most
carbon-dense in the world, mainly due to the presence of mangrove Forested area Carbon stock
forests. Unfortunately deforestation is reducing this stock and could
affect government emission reduction policies.
2050
FOREST PRODUCTIVITY Productivity anomaly
Tons of Carbon per
+1.38
Forest productivity or Net Primary Production is the net carbon captu- hectare per year
+0.92
red by plants. It is the difference between the carbon gained by Gross
Primary Production - net photosynthesis measured at the ecosystem
scale - and carbon released by plants' respiration. It is expressed per
unit land area.
Marked increase expected throughout the archipela-
go, particularly under a medium emissions scenario
+ Fertilizing effect of increasing atmospheric CO₂ and nitrogen
deposition
+ Rising temperatures promote productivity
No areas with an expected decrease in forest primary
production
+ Increasing risk of drought stress due to modifications in the
water regime reduces productivity
KEY SPECIES
REDUCTION REDUCTION
STYRAX PALAQUIUM
UNDER Suitable habitats of Styrax sumatrana are
likely to be reduced under future climate
Palaquium species biomass will decrease
significantly
CLIMATE scenarios
CHANGE REDUCTION
DIPTEROCARP
VULNERABILITY
MANGROVES
Dipterocarpus species biomass will Rapid sea level rise will threaten coastal
decrease significantly Mangrove forests significantlyFIRES IN INDONESIA WHERE DO FIRES OCCUR?
Fire is a structural ecological process that provides several types of
ecosystem services and impacts on socio-ecological systems,
including human health, carbon budgets, and climate change. Changes Peatland fires, which mainly occur on the
in global fire activity are influenced by multiple factors such as island of Sumatra, are a cause of major
land-cover change, policies, and climatic conditions. Fire also releases concern due to the large amount of emissions
large quantities of greenhouse gases into the atmosphere, contribu- released.
ting to a vicious cycle.
Over the last two decades, the total forest area affected by fires was
approximately 3.37 million hectares.
BURNING EMITTING
3.37 MILLION HECTARES 139 TERAGRAMMES OF
CARBON PER YEAR Most affected areas are Central
and West Kalimantan, South
Sumatra, Riau and Jambi
provinces.
FOREST FIRE EMISSIONS
CONTRIBUTED TO
COSTING
42% OF TOTAL FIRE RELATED 16.1 BILLION USD IN DAMAGES
CARBON EMISSIONS AND LOSSES (2015 FIRE SEASON)
VARIATION OF SPECIFIC
FUTURE BURNED AREA FIRE INDICATORS
Under a low emission scenario, models project that the total burned
area might decrease. Although, in some localized areas in Central and +297%
Southern Papua, burned area might increase affecting lowland % of change 2070-2100
reainforests and freshwater swamp forests. Extreme fire danger +209%
days per year, East
Central areas of Kalimantan and Sulawesi might also experience a Kalimantan
slight increase in burned area. Under a medium emissions
scenario, burned area projections might project a similar
distribution, although Papua will be less affected. +275%
% of change 2070-2100
Extreme fire danger +230%
days per year, East
2050 Sumatra
Burned Area -7,080
km² per year
-5,437
FUTURE FIRE EMISSIONS
Fire emissions follow a similar spatial pattern as burned area. Papua,
Kalimantan and Sulawesi show greater projected changes over both
low and medium emissions scenarios.
Decrease in burned areas for a low emissions scenario
2050
Increase in burned areas for a low emissions scenario Fire Carbon emission -21.03
+ Slight increase in terms of fire season length over Sumatra and Java Teragrams of Carbon per
year
-13.4INDONESIA
URBAN
OVERVIEW
In 2020, slightly more than half of the population 2020
(56.5%) lived in urban areas, which represents a steep
increase from 14.5% in 1960. By 2050, this rate is 154,188,546
expected to reach 73%. Population in
Urban Areas
Urbanization in Indonesia mainly concerns the island 2050 234 104 967
of Java, and few other coastal urban areas. Less than
20% of the urban population lives in the capital Jakar-
ta, and another 20% live in the 20 major cities with 1
to 5 milion inhabitants. Therefore the majority of Indo-
nesians lives in minor urban centres with less than Graphs refer to data provided by United Nations, Department of
300,000 inhabitants. Economic and Social Affairs, Population Division (2018). World Urbani-
zation
Although built up areas cover 1.6% of Indonesia, on the
island of Java the figure is 12.8%. 2020
56.6%
Urbanization
Rate
2050 72.8%
OVERVIEW OF KEY +41.9%
CLIMATE IMPACTS IN URBAN AREAS
2050
Cooling
Degree Days +17.0%
Climate change impacts on Indonesian cities are connected mainly to % of change
sea level rise and rising temperatures. +10.9%
HEATWAVES AND HEAT STRESS
Observations for the 1960 to 2003 period show an increase in the +97.9%
number of hot days and warm nights. In the city of Bandung, almost 2050
Heatwave
50% of the survey respondents indicated that they had experienced frequency +59.5%
% of change
difficulties during their commuting or at work due to hot weather.
+33.6%
Under a high emissions scenario, heat-related mortality for elderly
people in the Jakarta metropolitan area will increase by 12 to 15 times
in the 2050s. +7,933%
2050 Heatwave +911%
duration
% of time
+328%HEAT AND AIR POLLUTION
High levels of air pollution further exacerbate the impacts of heatwa- 2017
Population exposed
ves, in particular in urban areas. According to WHO data, almost the 95.6%
entire population of Indonesia is exposed to high air pollution levels. to air pollution
COASTAL FLOODING
75% of Indonesian cities are situated close to the coast. Approxima- 2050 0.23 m
tely 175 million people, amounting to almost 70% of the total popula-
tion, are living in 42 cities and 182 districts found within 50 kilome-
tres of the coast.
Projected 0.18 m
Under a future prospective of sea level rise and land subsidence,
impacts for the three major coastal cities (Jakarta, Surabaya and sea level rise
Semaran) are expected to rise up to 1 billion, 38.3 million and 0,38 0.77 m
million USD respectively. In Jakarta the number of persons affected 2100
would be 318,000, in Surabaya 751,000 and in Semarang 334,000
persons.
0.38 m
FLOODING
Larger urban areas like Jakarta are vulnerable to river flooding, due to
reduced drainage and storage capacity of inland watercourses and
urban drainage clogged by solid waste and sediments, which adds up +35%
to reduced drainage due to sea level rise and land subsidence. Indone- 2050 Runoff
sian coastal cities are flooded regularly. In 2007, Jakarta experienced
a severe flood that submerged parts of the city under 5 metres of
increase +18%
% of area
water, killing 46 people.
+9%
In 2020, flooding in the city also left 66 people dead and displaced
more than 36,000. By 2055 the number of Indonesians exposed to
river flooding will increase by 75%, and by 73% for those exposed to
coastal hazards. In both cases, the increase is a result of both popula-
tion growth and climate change bringing more intense precipitation
events, rising sea levels and storm surges.
SURFACE SEALING Heavy precipitation in cities is problematic due to the high level of sealed surfaces. Soil sealing
increases run off and reduces the amount of water absorbed by soil. Where there are large amoun-
AND FLOODS ts of impervious ground cover, short duration extreme rainfall events can lead to increased
flooding, even resulting in flash floods.
2010 % of urban population
GROUND WATER ABSTRACTION AND SUBSIDENCE Population 30.6%
Land subsidence makes global sea level rise worse by increasing the living in slums
amount of flood prone areas and salt water intrusion into coastal
aquifers. In Jakarta the current rate of subsidence is the fastest in the
region compared to other megacities, and estimated to be as high as
% of total population
11 centimetres per year.
Urban population
2018
Low income urban dwellers are the most vulnerable, as they are living in areas 3.8%
largely concentrated in urban peripheries, with little and low quality where elevation is
infrastructure.
below 5 metersINDONESIA
HEALTH
OVERVIEW
Indonesia has a tropical climate with a monsoonal wet ria and dengue (especially during the rainy seasons),
season and a dry season. Topography is extremely water-borne diseases such as diarrhoea, and respira-
varied, ranging from sea and coastal systems to peat tory diseases. An increase in the incidence of severe
swamps and montane forests. More frequent and respiratory problems due to increase in the frequency
severe heatwaves, floods, and droughts will increase and spread of wildfires is also expected.
the incidences of vector-borne diseases such as mala-
HEAT RELATED MORTALITY
Rapid industrialisation and a high population density render Indone-
sia vulnerable to the likely effects of climate change. Climate variabi- Heat-related mortality
% change with respect to 2000-2004
lity and climate change are already exacerbating many of the disaster
risks that the country faces.
Heat-related deaths in the elderly (65+ years) are projected to increa-
se to 53 deaths per 100,000 by 2080 under a high emissions scenario, 2018
and 8 deaths per 100,000 under a low emissions scenario - compared
to a baseline of less than 1 death per 100,000 annually from 1961 to +180%
1990. In 2018, there was a 180% increase in heat-related deaths in
Indonesia compared to the 2000 to 2004 baseline, one of the highest
increases in the world.
IMPACTS ON LABOUR Impact on total labour
% change with respect to 1986-2005 baseline
Labour is directly affected by changes in environmental conditions.
Warming affects both the number of hours worked (labour supply) and
on the productivity of workers during their working hours (labour
productivity). Both labour supply and productivity are projected to
decrease under future climate change in most parts of the world, and 2050
particularly in tropical regions.
Parts of sub-Saharan Africa, south Asia, and southeast Asia are at
highest risk under future warming scenarios. Future climate change
will reduce global total labour in the low-exposure sectors by 18
percentage points and by24.8 percentage points in the high-exposure -13.1%
sectors under a 3.0°C warming scenario
Future warming is projected to significantly affect workers in
high-exposure sectors in Indonesia. Total labour in Indonesia is -22.0%
expected to decline by 13.1% under a low emissions scenario, and by 2080
22% under a medium emissions scenario.CLIMATE CHANGE AND DENGUE
Dengue has spread throughout the tropical world over the past 60
years and now affects over half the world’s population. Globally, vecto- Dengue suitability
rial capacity for both dengue vectors (A. aegypti and A. albopictus) has % of population at risk
been rising steadily since the 1980s, with nine of the ten highest years
occurring since 2000.
Climatic stressors are one important driver of the current distribution 85.6%
and incidence of dengue. Climate change is likely to expand the 2050
geographical distribution and suitability of several vector-borne
human infectious diseases including dengue. The risk of dengue 86.9%
transmission is increased by warming climates, as the growth and
development of mosquitoes are significantly influenced by temperatu-
re, precipitation, and humidity.
CLIMATE CHANGE AND ZIKA
Zika virus has spread to at least 49 countries and territories since 2013.
Climate change impacts on transmission suitability risk have increased
Zika suitability
% of population at risk
over the years and future warming over 1.3 billion additional people
could face suitable transmission temperatures for Zika by 2050.
84.3%
DENGUE AND ZIKA: POPULATION AT RISK 2050
The mean relative vectorial capacity for dengue fever transmission is
projected to increase under both high and low emissions scenarios.
81.8%
Under a medium emissions scenario, 86.9% of the population will be
at risk of transmission-suitable mean temperature for dengue by 2050,
whereas 85.6% will be at risk under a high emissions scenario. In the
case of Zika, 81.8% of the population will be at risk by 2050 under a
medium emissions scenario, whereas 84.3% will be at risk under a high
emissions scenario.
CLIMATE CHANGE AND MALARIA
As temperatures rise and water becomes increasingly contaminated,
malaria, dengue and cholera are expected to increase. By 2050 more Malaria suitability
than 98% of the Indonesian population will be at risk of malaria under % of population at risk
a low and high emissions scenario – amounting to more than 300
million people.
98.0%
2050
POLLUTION AND PREMATURE MORTALITY
Air pollution is likely to increase the incidence of respiratory diseases
and infections, as well as skin and eye irritations. 29% of deaths from
ischemic heart disease, stroke, lung cancer, chronic obstructive pulmo-
nary disease, and acute lower respiratory infections in Indonesia can
be attributed to household air pollution.INDONESIA
ENERGY
ENERGY SYSTEM IN A NUTSHELL ENERGY SUPPLY
Indonesia is rich in energy resources. It is the world’s The current (2019) energy mix of total primary energy supply in
fourth-largest coal producer and first exporter (455 Indonesia is strongly dominated by fossil fuels (33.5% oil, 17% natural
gas, 24% coal, for a total of 74.5% of total primary energy supply).
million tonnes in 2019), and it also exports natural gas Renewables account for 25.5% with wind and solar claiming over 10%
and biofuels (of which Indonesia is the world’s largest of total total primary energy supply, biofuels 14.5%, while hydropower
producer - mainly biodiesel from palm oil). However, is negligible. Wind and solar underwent a 13-fold expansion since
internally the use of energy is moderate, and Indonesia 1990. The country imports oil, but is otherwise is more than self-suffi-
manages to keep its energy intensity at very low levels. cient.
0.071 5.8%
ktoe/US$
Energy AC Share in
intensity electricity
consumption
CLIMATE CHANGE TODAY
EXTREME EVENTS - FLOODS AND
TYPHOONS
Typhoons and the ensuing flooding have
affected the operation of power plants by:
soaking coal and making it impossible to
burn, preventing carriers from delivering
fuel, damaging power grids and causing
outages.
EXTREME EVENTS -HEAT AND
DROUGHTS ENERGY DEMAND
Drought and heatwaves affected the cooling In Indonesia, energy is mainly used for transport (34.8% of final
potential of power plants and hence their demand in 2018), industry (37.5%, including 5.4% share of total
efficiency. demand for non-energy use) and residential (22.4%), followed by
commercial use (3.9%) and agriculture (1.2%). Air conditioning’s
contribution to residential electricity demand was 5.8% in 2017.FUTURE ENERGY DEMAND
Indonesia has a tropical climate; hence only cooling needs are of
relevance. This is projected to result in an increase in electricity
demand of 1,454 PJ (or 404 million KWh) by 2050 under a medium
Net change in 2050
+ 403.97
emissions scenario. Air conditioning units are expected to increase energy demand due to
exponentially from 12 million units in 2016 to 236 million units in changes in HDD/CDD
2050. Billion KWh
COOLING NEEDS COOLING DEGREE DAYS 0 512
Marked increases in cooling degree days
are expected all over the country particu-
larly in the interior of the largest islands
(Borneo, Sumatra and New Guinea), and in
the area of Jakarta.
HEATING NEEDS HEATING DEGREE DAYS -464 0
Heating needs anomalies are practically
of no relevance. Nominally they affect
only the mountain peaks in New Guinea
which are hardly inhabited.
FUTURE EXPECTED IMPACTS
ENERGY SUPPLY OF CLIMATE CHANGE
The future configuration of the Indonesian energy mix is likely to be The main concern is for the increased frequency of extreme events,
determined by the evolution of energy policies and hence is outside in particular for coastal infrastructure, and the impact of droughts on
the scope of this report. There appear to be no long-term plans for the thermal efficiency of coal power plants.
decarbonization, and the recently planned investments in new coal
capacity point to a prevalence, in the coming decades, of vulnerabili- In a perspective of increasing cooling demand, severe stress for the
ties related to fossil fuels. electricity system may result, particularly in the more densely
populated and economically advanced islands.
-2.25%
Change in 2050
Hydropower generation -1.83%
% of changeINDONESIA
ECONOMY
OVERVIEW
Indonesia ranks 17th in terms of GDP among G20 coun-
tries. Indonesia was hit less severely by the COVID 19
pandemic compared to other G20 countries, recording 2.79/4.4%
a decline in real GDP of 2.1% in 2020 and recovering in 2050
2021 with growth in real GDP of 4.3%.
0.61/2%
IMPACTS ON GDP GDP Loss
Climate change will have an effect on the growth rate and overall % change w.r.t baseline
economic performance of the country. GDP is predicted to decline
under both low and high emissions scenarios.
7.51/13.27%
By mid century, costs could reach between 18 and 41 billion EUR (or 2100
2% - 4.4% of GDP) under low and high emissions scenarios, respecti-
vely. By the end of the century costs are predicted to become even
more severe: Indonesia could stand to lose up to 13.3% of GDP, or 123
billion EUR under a high emissions scenario.
1.92/7.98%
SECTORAL ECONOMIC IMPACTS
IMPACTS ON INDUSTRY AND INFRASTRUCTURE IMPACTS ON FORESTRY AND FISHERY
Indonesia is an archipelagic state made up of 17,480 islands, accordin- Indonesia is the world’s largest archipelagic state, and its surrounding
gly, flooding caused by sea level rise poses serious threats. Many waters are among the most fertile fishing areas in the world. The
significant infrastructures and economic assets, as well as a large fishing sector is thus an important contributor in terms of food securi-
share of the population (50-60%), are located in coastal areas. ty and employment to the country.
IMPACTS ON AGRICULTURE Indonesia is the second largest fish producer in the world, in 2017
fishery related exports totalled approximately 3 billion EUR and
Agriculture is a key component of the Indonesian economy, contribu- fishing activity contributed 2.56% to the country's GDP.
ting 12.8% to GDP (2018 data), and employing almost a third of the
labour force. Climate change can exert differentiated impacts on
Indonesian crop production. Climate change is projected to adversely affect fish stock and
consequently catches. Indonesia is predicted to experience some
It is predicted that by the mid century the economic value of corn and of the largest reductions in fish stocks around the world with a
rainfed rice may increase, but this will be cancelled out by substantial reduction in maximum catch potential of 23% by mid century.
losses to irrigated rice which makes up a much larger share of overall
agricultural output.
Therefore, by mid century climate change is expected to result in a 4
billion EUR reduction under a medium emissions in the overall value
of agricultural output. An additional 117 million EUR in damages is
expected to occur in the agricultural sector as a result of coastal
flooding by mid century.98.6
2050
SEA LEVEL RISE DAMAGES
In the absence of any adaptation measures, sea level rise is predicted
to increase the risks of coastal flooding and result in extensive econo-
mic losses. By mid century these costs are estimated to be 12 to 66.1
billion EUR and 98.6 billion EUR in terms of expected damages to 66.1
assets under low and high emissions scenarios, respectively. Sea Level Rise
Expected annual damages
By the end of the century, the losses are projected to be between 125.4 Billion Euro
billion and 167 billion EUR under a low emissions scenario and 213.9
billion EUR under a high emissions scenario. Regional analysis shows
213.9
that the majority of economic losses from sea level rise are likely to 2100
occur in Jakarta.
125.4
58.6
2050
RIVER FLOODING DAMAGES
Fluvial flooding will also cause damage and economic losses. Annual
damages are projected to be 26.4 billion EUR under a low emissions
scenario and 58.6 billion EUR under a high emissions scenario by Riverine 26.4
2050. Flooding
Expected annual damages
By the end of the century costs are projected to rise to 53.9 billion EUR Billion Euro
under a low emissions scenario and reach 200.1 billion EUR under a
high emissions scenario. 200.1
2100
53.9
IMPACTS ON ENERGY
Small island tourism is one of the most popular activities for tourists
As with all other economic sectors, energy supply and energy networks
in Indonesia. Due to reliance on the country's natural resources - clear
in Indonesia will undergo more intense stress from extreme events,
waters, aesthetic beauty, habitat for biodiversity - one can say with a
such as typhoons, floods and forest fires.
high degree of certainty that the sector is extremely vulnerable to the
effects of climate change and will suffer some economic losses.
Economic impacts of shifts in household and firm energy demand (see
chapter on energy) are difficult to predict and will mostly lead to
Coral bleaching is expected to increase as sea temperatures rise,
redistribution effects. In the case of Indonesia, there is no demand for
reducing the natural beauty and attraction of coral reefs for tourists
heating of any significance, and hence the large increase in cooling
and locals alike.
demand is expected to result in a substantial increase in energy bills.
Additionally, coastal erosion and the loss of beaches poses serious
threats for coastal tourist areas, for instance Bali, where 80% of the
IMPACTS ON TOURISM population rely on tourism related industries as a source of income.
Tourism has grown considerably in Indonesia in recent years and Tourism in low-lying areas will be particularly vulnerable, where built
accounts for about 4.1% of GDP and employs 10.5% of the labour up areas are located very close to the sea with virtually no buffer zone.
force. There is a lack of estimates on the economic impacts of climate These areas could become completely inundated by waves during
change on the sector, but some qualitative inferences can be made. extreme high tides resulting in economic losses.INDONESIA
POLICY
OVERVIEW INTERNATIONAL COMMITMENTS
Indonesia is the 4th most populous country in the Indonesia ratified the Paris Agreement in 2016. In its NDC, Indonesia
world, accounting for 3.5% of global emissions. Emis- commits to decrease emissions by 26% in 2020 and by 29% in 2030,
with reference to a business as usual scenario.
sions trends are not steady, as these are highly depen-
dent on land use change and forest wildfire emissions
which can vary greatly from year to year.
CLIMATE POLICY
COMMITMENTS CHRONOLOGY
1.257 1.704
MtCO2eq MtCO2eq
2004 KYOTO PROTOCOL - 1ST PERIOD
No target
2016 PARIS AGREEMENT - 1ST NDC
26% reduction in GHG by 2020 and 29%
reduction by 2030, with reference to a specific
business-as-usual scenario
2021 PARIS AGREEMENT - NDC UPDATE
1990 GHG EMISSIONS 2018 Submitted. Commitments unchanged
INTERNATIONAL CLIMATE According to OECD DAC data, Indonesia received 5.1 billion USD in climate-related develop-
ment aid in 2017-2018. Bilateral agreements are the main sources of finance, in particular
FINANCE ASSISTANCE from Japan and Germany. Debt represents the main instrument. Mitigation accounts for the
majority of finance.SUSTAINABLE RECOVERY POLICY ADAPTATION POLICY HIGHLIGHTS
In 2020, the amount of funds dedicated to post-covid recovery was TRANSNATIONAL INITIATIVES
negligible: 150 million USD. No resources were dedicated to sustai-
nable investments according to the Global Recovery Observatory. Coral Triangle Initiative (CTI)
Others: 4.387 Billion USD CTI was launched to preserve and conserve 75,000 square kilometers
of coral reef resources from the impact of climate change and simulta-
neously strengthen food security for fisheries through an ecosystem
approach
South East Asia Network Climate Change (SEAN-CC)
The network aims to strengthen capacities of the South-East Asian
84.35 0.15 0 governments on the area of climate change to share knowledge and
billion $ billion $ billion $ experience of policy formulation and implementation
Total Spending Recovery Spending Green Spending
NATIONAL INITIATIVES
Adaptasi Perubahan Iklim dan Ketangguhan (APIK)
DOMESTIC ADAPTATION POLICY APIK integrated adaptation and disaster risk reduction into national
and subnational governance frameworks. It also built the capacity of
Indonesia mentions adaptation in its NDC. The country adopted an local communities to address climate change and weather-related
Adaptation Strategy, but no plan. Sub-national entities are designated hazards
to plan adaptation. Climate Information System of Indonesia
The national climate change information system of the national Met
service in Indonesia is the result of a cooperation between GIZ and the
Indonesian Weather, Climate and Geophysics Agency
Inclusion of Adaptation in NDCs
SUBNATIONAL INITIATIVES
Domestic Integrated Adaptation & Mitigation Policy
Climate Action Plans (CAP) in Balikpapan and Bogor
Adaptation Policy Dedicated Adaptation Strategy The 2 cities of Balikpapan and Bogor developed two CAPs based on an
integrated adaptation and mitigation approach, which takes also into
Dedicated Adaptation Plan
account other development agendas for the benefit of the wider
community
Sectoral Adaptation Plans Jakarta Coastal Defence Strategy
Subordinate
Adaptation Policies Subnational Adaptation Plans The strategy copes with flooding from the sea, a phenomenon that is
increasing in frequency because of sea level rise and soil subsidence
in Northern Jakarta
Policy not in place Active policy
ENERGY TRANSITION Energy Transition Fossil Fuels
Indonesia has achieved significant results in the process of transformation of its
energy sector and is among the top Asian countries in the overall Energy Transition 58.7 45.3
indicator. Notwithstanding many issues, in particular with forestry policy which still
persist, the level of CO2 emission per capita and of air pollution has diminished in 55.9
61.5
recent years, with positive effects not only for climate change but also for citizen
well-being. The transition pathway is also well reflected in indicators such as
Renewables. In these domains, the country has entered into a positive process of Renewables Efficiency
transformation. Nevertheless, looking at the Electrification indicator, there is still
room for improvement.
19.7 84.9
23.5 77.3
Only actively pursuing an energy transition based on decarbonization and Electrification Emissions
electrification – from policy and regulation, to health and education – will
enable countries to benefit the most from future opportunities and fight
G20 72.9
AVERAGE climate change whilst ensuring an equitable distribution of wealth. 70.8 72.9
COUNTRY
The Energy Transition indicators were developed by Enel Foundation in
cooperation with SACE, and provide a retrospective analysis based on 64.9 86.1
historical data.You can also read