Evaluating the Effect of Climate Variability on Zea Mays Productivity over Glen Research Station: South Africa
←
→
Page content transcription
If your browser does not render page correctly, please read the page content below
RESEARCH ARTICLE
 European Journal of Agriculture and Food Sciences
 www.ejfood.org

 Evaluating the Effect of Climate Variability on Zea Mays
 Productivity over Glen Research Station: South Africa
 G. Zuma-Netshiukhwi, O. M. Hlazo, and S. A. Motholo

 ABSTRACT
 Rainfall and temperature are one of the key environmental parameters that
 determines the development of a crop and livestock from one growing stage Submitted : June 01, 2021
 to maturity. Furthermore, temperature is critical beyond maturity but to Published : June 30, 2021
 post harvesting and storage. Rainfall is fundamental in the selection of
 ISSN: 2684-1827
 planting dates, cultivar selection and planting density. Whereas,
 temperature is essential for calculation of chill and heat units for DOI: 10.24018/ejfood.2021.3.3.313
 determining conducive environmental conditions for crop productivity and
 livestock well-being. In this study, Instat Plus statistical package is utilized G. Zuma-Netshiukhwi*
 to determine potential planting dates, the growing seasons, maize (Zea Agricultural Research Council, Natural
 Mays) for different planting dates from last dekad of October to 1st dekad Resources and Engineering, Glen
 of January. The growing period length vary from short (less than 100), Bloemfontein, RSA.
 medium (above 100 days) and long term (above 120 days) varieties. The (e-mail:
 correct choice of planting time and crop type in the most important decision ZumaNetshiukhwiGA@arc.agric.za)
 a farmer or a researcher can make. Taking considerations of water O. M. Hlazo
 productivity and thermal time requirement for a selected cultivar lessons Glen College of Agriculture, Glen,
 the effects of high frost risks and water shortages, which leads to soil water Bloemfontein, RSA.
 deficit and crop wilting but encourage supporting maize growth and (e-mail: omhlazo@gmail.com)
 development. The study also looks at how heat stress jeopardizes the growth S. A. Motholo
 Glen College of Agriculture, Glen,
 in crops, and further determine crop suitability whether to be early or late
 Bloemfontein, RSA.
 in season based on thermal times. A thorough analysis and interpretation
 (e-mail: andriesmotho@gmail.com)
 of log-term climate data would enable the intermediaries to understand
 valuable knowledge for improved productivity. This paper analysed a long- *Corresponding Author
 term climate (1922-2020) data analysis for Glen automatic weather station,
 to determine climate variability and climate change possibilities, calculate
 heat unit and chill units. Further, develop suitable adaptation strategies
 relating to maize crop.

 Keywords: Agriculture, climate data, decision making, rainfall trends and
 patterns, weather extremes.

 hydrometeorological hazards, since it affects a number of
 I. INTRODUCTION communities globally. Drought can lead to substantial socio-
 In recent years, the propensity of weather extremes such as economic and environmental effects [7]. For example, in
floods, heatwaves, droughts, and cyclones have instigated 1986-1987, 1991-1992 and 1997-1998 summer drought in
significant impacts on both the society and the environment southern Africa caused reduction to grain production by as
[1], [2]. Across industries, efforts are being made to initiate much as 3 million tons, predominantly under rain-fed
and implement adaptation strategies to manage climate agricultural area. Drought and extreme temperatures together
variability and change related risks and enhance preventative contributed to crop losses, widespread livestock mortality,
measures and adaptive capacity at district level [3]. water supply shortages and food insecurities [8], [9] and [10].
Nonetheless, suggested preventative and strategies lack Other drought associated to atmospheric interactions over
meticulous contextualization at local scale. Rural oceans range from typical cut-off low-pressure systems,
communities in South Africa and elsewhere in other anticyclonic conditions, and tropical, temperate troughs.
developing countries are lagging behind on proactive However, investigations by [11] and [12], explicitly relate
approaches to disaster and risks reduction and management. South Africa’s rainfall variability to the El Niño Southern
For example, the non-existent of point specific early warning Oscillation, which is an indicator of climate variability [13]–
systems, lack of reliable channels of knowledge [15]. Such occurrence is linked directly to more intense and
dissemination to these communities and weather station pro-longed drought. Thus, prompt semi-arid climate, such as
distribution across provinces is limited[4], [5]. the Free State province lead to severe dryness and becoming
 Drought episodes and heatwaves strongly associated with catastrophic in South Africa [11], [12] and [16].
the oceanic-atmospheric interactions, sea surface and El Niño Moreover, since the early 1970 the increased climate-
Southern Oscillation [6]. Drought is referred to as a natural change-induced weather variability has been witnessed
demonstration of climate variability and known as the top throughout South Africa. These are characterized by high

 DOI: http://dx.doi.org/10.24018/ejfood.2021.3.3.313 Vol 3 | Issue 3 | June 2021 110
RESEARCH ARTICLE
 European Journal of Agriculture and Food Sciences
 www.ejfood.org

inter- and intra-seasonal rainfall variability and increasing maize on clay soils during critical growth stages [31].
dryness [12], [17]. Within the South African context, have Resource poor farmers are immensely impacted by
been confirmed the variability and inconsistencies in intra- meteorological parameter since extreme weather conditions
annual, intra-seasonal, inter-annual and inter-seasonal has devastating effects on crop productivity. For example,
rainfall, drought occurrences have become more frequent, Maize (Zea mays L.) is the supreme productive food crop and
intense, persistent [18], [19], causing significant socio- a stable food in Africa and other parts of the world [35]. Zea
economic interruptions, particularly in the semi-arid areas Mays verities are the stable food of many who reside within
[18], where Free State. Over the years, based on the data the borders of the Free State province and across South
analyzed under discussion, the number of consecutive dry Africa. Reduction in productivity of these particular crops
days has been increasing together with the number of daily may result to severe food insecurity, keeping into
extreme rainfall events [19]. The scenario gives the indication consideration that other agricultural enterprises may be
that, within the fewer days more rains are recorded and thus harshly affected [36], [37]. A sowing season of up to 120 days
exacerbate water logging, crop damages, and eventually crop in the semi-arid areas, has the potential evapotranspiration
losses. According to [20], the tendency of late season rainfall which ranges from 650-950 mm October to March which is a
onset and early seasonal rainfall cessations are also summer growing season. Relating to seasonal rainfalls, it is
characteristic for most of South Africa, and such occurrences often lower than the amount of evapotranspiration and rains
are expanded by the increased rainfall variability associated are highly unevenly distributed. The annual rainfall in semi-
with climate change [15]. arid areas varies from 400-600 mm. The rainfall exceeds the
 A continuous use of weather forecasting and climate potential evapotranspiration with daily levels that can reach 8
prediction knowledge when engaged in decision making and mm day-1, with the possibility of decreasing the aridity index
agro-advisory formulation remains the integral feature [5], [38].
[14], [21], [22]. Climate variability, trends, patterns, weather Agro-climatological parameters are the key factor toward
forecast and climate prediction for better agricultural water determining, crop suitability and agricultural adaptation
resource management, tactical and operational decision strategies[24], [39]. Toward ensuring food security, the
making is of paramount importance given the occurrences of agricultural industry contribute to the production of highly
extremes [3], [5], [23], [24]. On semi-arid areas, water is nutritious and safe for consumption products and produced at
unquestionably the foremost environmental constraint [25], high yields. Adaptation of scientific and indigenous
[26]and the Glen automatic weather station is located at a knowledge has high impact toward improved yields [36].
cold semi-arid area. Moreover, adoption of local viable technologies that support
 Moreover, temperature plays significant role from improved soil productivity [40], [41], [21] by increasing the
physiological, chemical, and biological processes of plants depth, fertility, soil water content and physical properties of
[27]. From the agrometeorological perspective, the the upper soil layer [42]. Adoption and application of
occurrence of different phenological events throughout the agrometeorological knowledge and its principles contribute
growing planting season is due to the effect of temperature on to sustainable agricultural production systems that are
plant growth which can easily be elucidated using dependable [5], [43]. The grander increase in agricultural
accumulated heat units [5], [28], [29]. According to [30], produce is determined by environmental suitable agronomic
growing degree days are founded on the concept that the real practices with a consideration of climatic conditions and soil
time to attain a phenological stage is linearly related to types, and further production should be based on the
temperature in the range between base temperature and preferences of the local people rather than be only market
optimum temperature. Whereas, the heat unit concept adopts driven elsewhere.
the fact that a direct and linear relationship between growth Plants in its discrete photosynthetic metabolism vary in
and temperature is expedient for the valuation of yield water use efficiency and heat tolerance [18], [44], [45]. Maize
potential of a crop in different weather conditions. It has also varieties are the stable food in the Free State province and
been observed by many crop growth and development produced with success in this region. Publications developed
studies, an increase in temperature by 1 °C or 2 °C resulted in in 1910, indicate that the Free State province in 1909
about 20% to 25% decrease in grain yield. The effect of produced beyond 2 million bags (50 kg) of maize and had the
temperature on phenology and yield of crop plants can be largest export trade in maize of any province in the Free State
studied under field conditions through accumulated heat unit [46]. Based on the provincial statistics in 2017/18, the Free
[28], [29], [31], [32]. State produced 3990 bags (50kg) of maize [47]. Comparing
 Based on the seasonal yield predictions and observation, in maize production in 1909 and 2017, a highly significant
semi-arid areas of South Africa, maize (Zea mays) grain yield decrease is evident. Maize cropping systems remain
hardly reaches 1 ton/ha under rain-fed conditions, compared dominant within Free State mostly under rain-fed agriculture
to 5 ton/ha under controlled research station where which is one of the livelihood sources to provide food and
supplementary irrigation and proper soil fertilization is nutrition support. However, the hotter and drier conditions
provided. High variability in rainfall event and amounts with projected in the South African midlands can have a huge
high evaporative demand result to constraints in crop growth impact on crop productivity [31], [42], [48]. Climate factors
and yield decline [26], [33]. The meteorological dry spell include increase in drought frequency and temperature,
exceeding 10 days during critical crop growth stages, during occurrence of storm winds and the effects of high level of
approximate flowering and early grain filling stage affect the CO2 concentration on plant water use [49], [50]. Frost is
final yield [34] . Soil water retention differ for different soil another limiting parameter when occur unexpectedly [51].
types, maize on sandy soils is four times severely affected to However, most of studies relating to weather extremes and its

 DOI: http://dx.doi.org/10.24018/ejfood.2021.3.3.313 Vol 3 | Issue 3 | June 2021 111
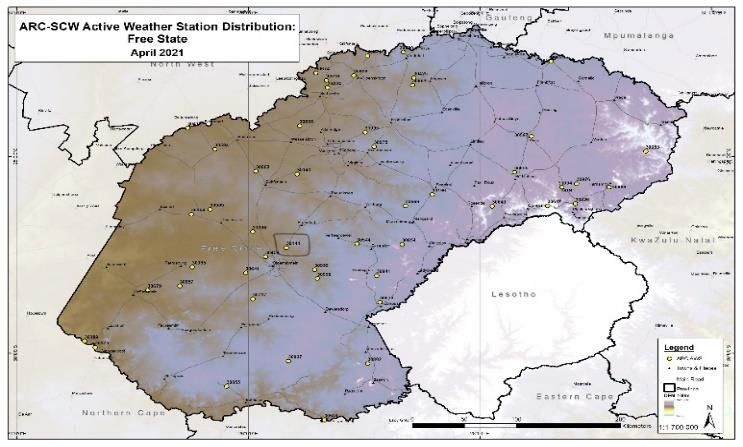
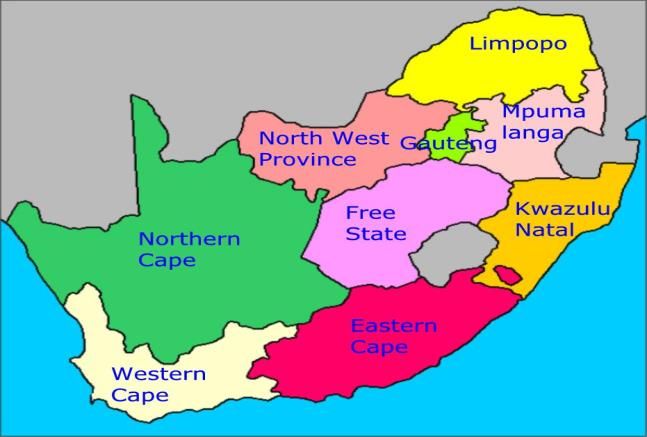
RESEARCH ARTICLE
 European Journal of Agriculture and Food Sciences
 www.ejfood.org

impact focus on broader scale, overlooking its impact at a
localized level.
 This study evaluated the latitudinal trends of rainfall,
heatwaves, drought and wet/dry spell and related disasters
prone to this area, to furnish guide on the formulation tailored
agro-advisories and context-specific adaptation strategies
suitable for the Free State. It assessed decadal climate
patterns and trends, the possibility of seasonal shifts, climate
variability, climate change and climate change adaptation
practices of farmers. Such developed knowledge plays a
crucial role for ecological and sustainable development at a
district level to maintain socio-ecological systems. This
agrometeorological generated knowledge beneficial for the
improvement of local livelihoods. Agriculture is very active
in the Free State and most locals rely on natural resources and
agriculture for income generation, this categorize them to be
highly vulnerable to climate variability and change. Thus,
encourage knowledge developers in the field of
weather/climate and agricultural scientists to develop
adaptation strategies and disseminate for timeously
implementation according to improved tactical and
operational decision making. These initiatives respond to
policy by acknowledging and achieving the Sustainable
Development Goals, particularly on reducing poverty, zero
hunger, reduced inequality and more importantly climate
action. Fig. 1. South African map and ARC-SCW weather station distribution in
 the Free State.

 II. DATA AND METHODS B. Climate Data Acquisition
A. Study Area The findings of the nature and trends of rainfall and air
 The area of the study covers the Free State province (Fig. temperature happenings was accomplished through an
1), a province that governs Bloemfontein, Thaba-Nchu and analysis of daily, monthly, and annual rainfall data from Glen
Botshabelo which falls under Mangaung Metro weather station long-term climate data. Agrometeorological
Municipalities and another prominent town in the region. weather station data plays a critical role in identifying and
Free State province is located between the latitudes 26.6°S tracking trends and patterns of the extent of floods, drought,
and 30.7°S of the equator and the distances 24.3°E and heat waves and cold spells. The climate data was sourced
29.8°E of the Greenwich meridian. The regional topography from the Agricultural Research Council-Natural Resource
in the north-eastern and eastern parts of the Free State Management & Agricultural Engineering (ARC-NRE) in
province is multifaceted, with low altitudes of 1.800 m. The South Africa. Long-term climate data over the period 1922-
Glen automatic weather station is located in Motheo District 2020 data analysis for Glen automatic weather station.
and identifies as 30144 station number, it is situated at an Analysis determined and developed suitable adaptation
elevation of 1,395 m above the sea level. The province is strategies relating to agronomic, phenological and
administratively divided into five districts which are, Motheo physiological data necessary for crop modelling, operational
district, Xhariep district, Fezile Dabi district, Lejweleputswa evaluation, and statistical analysis.
district and Thabo Mofutsanyane district (Fig. 1). According
 C. Climate Data Analysis
to the long-term climatic data indicate that, the area has
monthly mean sunshine hours of about 319.5, 296.5 and The long-term rainfall and temperature data recorded from
296.3 in November, December, and January, respectively, the 1922 to 2020 were obtained from Glen climatic station in
annual sunshine hours and annual average rainfall of about Free State, which is maintained and monitored by ARC-NRE.
3312.3 and 559 mm, respectively. The region gets the lowest The data were manually and thoroughly checked for any
July rainfall and the highest January rainfall with the coldest errors, outliers and temporal inconsistency using Microsoft
months being June and July. Excel and INSTAT Plus 3.036. Microsoft Excel was utilized
 to determine the statistical relationship, such as, averages,
 correlations, regressions, and deviances. The moving
 averages (MA) was used to indicate the values below and
 above the trend line. INSTAT V3.036 was used for data
 sorting, validation and grouping for analysis. INSTAT
 (3.036) statistical software [52] was also used for
 agronomical characterization of the rainfall. This
 characterization consisted of determining the timing of the
 onset date and cessation of rains, length of rainy season, total

 DOI: http://dx.doi.org/10.24018/ejfood.2021.3.3.313 Vol 3 | Issue 3 | June 2021 112
RESEARCH ARTICLE
 European Journal of Agriculture and Food Sciences
 www.ejfood.org

seasonal rainfall, and probability of dry spells. Rainfall daily climatological months. During spring to summer months, wet
data were analyzed to quantify consecutive dry (a day with spell is prevalent in this region.
rainfall < 1 mm) and wet days (a day with rainfall ≥ 1 mm, a
very heavy day with rainfall (≥ 20 mm) the total number of
 Annual Rainfall Variation Calculated from 1922-
rainfall days, MaxTmax (monthly air temperature maximum
 2020
from daily values) and MinTmin (monthly minimum air 1000
temperature from daily values) and were integrated into
monthly and annual data for further analysis. In this study, 800

 Annual Rainfal (mm)
dry spells are well-defined as periods of 10, 20, and 30 days
 600
or more with less than 1 mm rain that can consequence to the
initial stage of meteorological drought. Microsoft Excel was 400
used to compute the normal regression statistics, trend
analysis and significance of these trends. 200

 D. Glen Area Soil Classification 0

 1982
 1922
 1928
 1934
 1940
 1946
 1952
 1958
 1964
 1970
 1976

 1988
 1994
 2000
 2006
 2012
 2018
 The distribution of South Africa’s soils is mapped as land
types of 1:250 000. A land type is a map unit with uniform Years
macro-climate, typical terrain morphology and a Fig. 2. Mean annual rainfall for weather station within Glen experimental
characteristic soil distribution pattern in the landscape [53]. farm.
In the Free State, the factors which have played a dominant
role in soil formation are parental material and climate. Glen The mean annual rainfall in the station ranged from
is a farm of approximately 4600 ha in size; it is divided into 315,1 mm in 1992 to 1021, 3 mm in 1988 and 1029,5 in 1943.
various land-use practices, for crop production, animal The difference between the highest and lowest recorded mean
production, natural veld, and cultivated pastures. The farm annual rainfall was 714.4 mm. Approximately about 16.33%
has multiple soil types suitable for the land use practices. On of years received recorded mean annual rainfall of below
the pasture camps are four classified soil types which are: 400 mm. Years that ranged between 400 mm and 600 mm
 1) Bonheim form (Melanic A horizon up to about 40 cm mean annual rainfall was recorded at 59,18% with 25,51%
with some Vertic properties, Pedocutanic B horizon, years that recorded mean annual rainfall of above 600 mm.
Unspecified/Saprolite (has been laying for a long-time Most interestingly, one in fifty years the mean annual average
weathering). was recorded above 1000 mm and six in 98 years the mean
 2) Swartland form (Orthic A horizon from 0 to about annual rainfall recorded above 800 mm. Some of these
20 cm, Pedocutanic B horizon from about 20 to 40 cm, rainfall deviations are entirely linked to El Niño Southern
Saprolite from about 40 to 120 cm). Oscillation events and some associate with hydro-
 3) Glenrosa form (Orthic A horizon, Lithocutanic B meteorological extremes. The moving average (MA) was
horizon, the depths of the horizons are not confirmed yet). On utilized to indicate the data trend more clearly and to
the cultivated pasture fields. highlight the values which are above and below the trends
 4) Valsrivier form (Orthic A horizon, Pedocutanic B (Fig. 2), whereby the filtering effects depends on N and 2
horizon, unconsolidated material without signs of wetness years of MA was used. Moving average is expressed as
horizon, depths of horizons not yet confirmed). follows:
 The crop production fields were classified as Hutton form
(Orthic A horizon, Red Apedal B horizon, depths of horizons MA=1/ ∑
 =1
not yet confirmed). Various cops have been successfully
planted on these fields under dry land and supplementary where
irrigation. Dt: is the actual value at time;
 N: is the number of periods in the Mas.
 B. Monthly Rainfall Trend
 III. RESULTS AND DISCUSSIONS Monthly rainfall trends-cycles demonstrate a distinctive
A. Annual Rainfall Trends steady decrease from January to March, April to May; June
 The Free State province has a moderate annual, seasonal, to July and a steady increase from September thereon as the
and monthly rainfall variability and differ across and within yearly cycles approach the spring-summer season (Fig. 3 and
the different climatic regions. The eastern part of the Free 4). This trend-cycle is unique for this region and also show
State has a high annual, seasonal, and monthly variability the monthly mean less than 90 mm. January to February the
comparing to the western part of the province. Rainfall varies only months with the highest mean rainfall above 80 mm and
greatly from the eastern to the western, this is also influenced June to July, the least recorded months. The moving average
by the dissimilarities in the landscape. This weather station indicate September, October to November above the trend
shows that some years had highest mean annual rainfall of line. Additionally, Fig. 3 and 4 show the mean monthly rain
above 1000 mm other years had below 400 mm (Fig. 2). The days, indicating January to March with highest rainy days and
high variability in inter-seasonal and intra-seasonal, indicate June, July and August have the lowest rain days. Noticeably,
the exposure of this station to dry spells, mostly during the scarcity of rainfall during autumn to winter months
spring, autumn and winter season most especially during the reveals and expose this region to be prone to prolonged dry
 spells and drought events between rainfall onset and cessation

 DOI: http://dx.doi.org/10.24018/ejfood.2021.3.3.313 Vol 3 | Issue 3 | June 2021 113
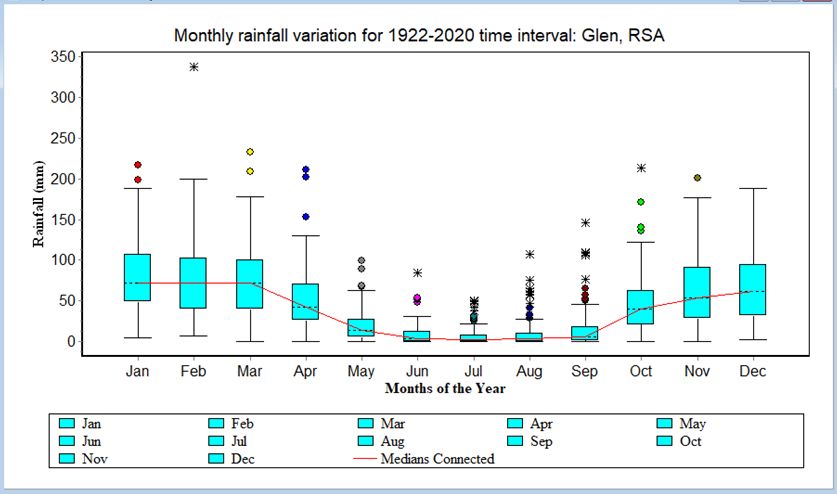
RESEARCH ARTICLE
 European Journal of Agriculture and Food Sciences
 www.ejfood.org

in this region. months for this region, unlike the scenario observed in
 Rainfall cycles and trends are evidently inconsistent January and February. The rainfall in other years during
resulting to climate variability and even climate change as March and April ranged from 0 mm to over 210 mm, in
confirmed by other studies conducted from other November from 0mm to over 200 mm and in December
climatological zones within South Africa [28]. Nevertheless, ranged from 2 mm to over 180 mm. The daily rainfall assures
the trends are skewed to toward even drier conditions from no rain occurrence in April 1932, March 1943, 1953, 2011
April to August. and March 2017 received 3mm, which is irrelevant for
 agricultural purposes. Unmistakably, the rainy season start in
 about December month to early April (Fig. 3 and Fig. 4). The
 90 83 81 flood occurrences are predisposed January, February, and
 80 76 March (Table 1, Fig. 3 and 4). For example, annual rainfall
 66 68 inconsistencies, 377.8mm of rains that occurred within 50
 70
 Mean monthlu rainfall & rainy days

 60 52
 rain days were observed in 1927 and the highest amount of
 47 rains occurred within 73 days which amounted of 578.1 mm
 50
 in 1929.
 40
 The representation of wet, dry, and normal rainfall years is
 30 20 18 indicated in Table I, show the scenarios and the selection of
 20 11
 10 10 10 7 9 8 8 9 worst and best years. Year 1992 being the driest, normal year
 10 4 6
 2 2 2 3 seen in 1964 and the wettest years in 1943 and 1988. Based
 0 on the representation in Table I and Fig. 3 and Fig. 4 rainfall
 onset occur from October to April which for summer planting
 season.
 Rainfall Months of the Year
 However, rainfall onset was delayed in other years, for
 Rain days example, 2015 and 1948 due to prolonged dry spell and
 2 per. Mov. Avg. (Rainfall) drought events. The onset of rains defined as the first
 Fig. 3. Mean monthly rainfall (trend-cycles) and mean rain days for Glen occasion after when the rainfall accumulated over the
 98 year’s data.
 previous 10 days is at least 25 mm and no dry spells of more
 than 9 days in the following 20 days was used as a successful
 The resulting boxplots in Fig. 4, indicate the minimum
 planting date, adapted from [54] On the other hand, the end
values of 0mm observed in March, April, November, and
 of the rainy season was obtained by looking for the last day
December. Thus, show the occurrence of oddities and the
 on which the cumulative 25 mm over 10 days occurred.
possibilities that other years recorded no rains in these rainy

 Fig. 4. Monthly rainfall variation for Glen Weather Station for 98 years.

 TABLE I. MONTHLY RAINFALL FROM 9 SPECIAL YEARS SHOWING EXTREME AND NORMAL YEARS
 Month
 Year Jan Feb Mar Apr May Jun Jul Aug Sep Oct Nov Dec All
 1992 18,8 8,3 23,6 22,9 0,0 0,0 0,0 22,3 0,0 30,1 161,0 28,1 315
 1945 62,0 74,6 75,9 12,4 4,6 0,0 3,8 0,0 0,0 4,3 65,5 42,6 346
 2015 49,5 79,2 85,3 21,1 16,8 24,6 11,2 0,3 7,1 27,7 26,2 2,0 351
 1948 102,2 51,8 232,8 47,0 17,1 0,0 0,0 0,0 0,0 37,6 15,8 2,8 507
 1964 18,0 46,6 88,7 25,2 4,9 51,0 0,0 2,0 6,0 94,1 99,8 74,2 511
 1959 66,6 61,8 31,9 69,5 34,0 0,6 24,7 0,0 0,0 53,6 68,7 107,2 519
 1981 188,1 199,9 72,1 26,5 30,6 12,7 0,0 107,2 39,5 22,4 44,5 171,6 915
 1988 40,7 337,8 178,0 111,7 12,5 18,1 2,0 0,0 44,5 135,3 41,2 99,5 1021
 1943 71,4 68,9 0,0 270,9 88,8 0,0 49,0 61,5 1,8 121,3 171,9 123,4 1030
 All 617 929 788 607 209 107 91 193 99 527 695 651 5514

 DOI: http://dx.doi.org/10.24018/ejfood.2021.3.3.313 Vol 3 | Issue 3 | June 2021 114
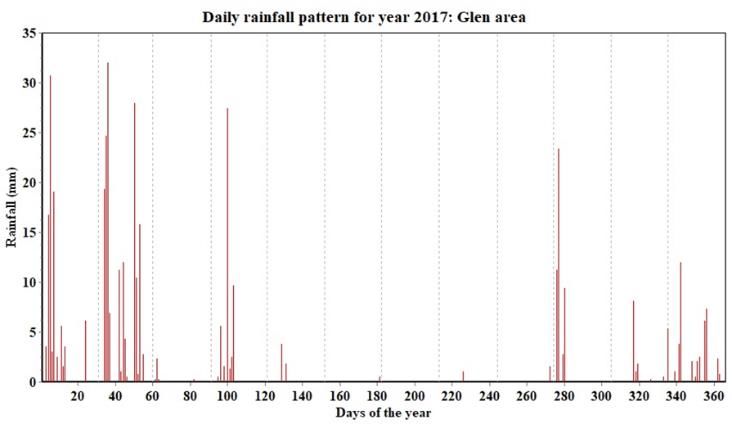
RESEARCH ARTICLE
 European Journal of Agriculture and Food Sciences
 www.ejfood.org

C. Annual Number of Rainy Days y = 0,1336x - 192,12
 Th Glen weather station, total number of rainfall days per 110 R² = 0,0512
annum proved to be highly inconstant. The station
experienced a steady increase in annuall rainfall days from

 Number of rainy days
1964 to 2020. A sharp increase as the outliers are observed 90
from 1957 to 1963, indicate the La Niña year , which explains
the above-average rainfallexperienced in this region (Fig. 5
 70
and Fig. 7). The other outliers are observed in 2000, 2001 and
2002, which are confirmed to be LaNiña years [55]). Year
1961 recorded the highest number of rainy days of 121 and 50
1930 at the lowest of 36 days. The region experienced the
upward trend in total annul rainfall days with the R2 of 0.0512
which indicate the stead increase rainy days (Fig. 5). 30
 1920 1940
 1980 1960
 2000 2020
Interestingly, this upward trend is supported by a steady Year
increase in the number of rainfall days. These occurrrences Fig. 5. Trends in the total number of rainy days per annum for Glen weather
indicate extreme rainfall annual variability (Fig. 2, Fig. 5 and station.
Fig. 7). Furthermore, Fig. 7, show March rainfall variability
for all the years and the sum of rainy days. Year 1982 and 1100
1987 amounted to 67 rainy days with the in between years 1000 1002
 951 955
recorded below 67. Year 2013 had 54 rain days and 2015 and 900 874
2016 with 55 rainfall days per annum, these years was 800
 Number of rainy days
 761
 700
associated with an El Niño event, which further confirms the 680
 600 596
annual variabilty in rainfall days and the influences of ENSO 500
phases on the total rainfall days in this region. 400 391
 Total monthly rainfall days was calculated and indicate 300
 261
monthly rainfall variability (Fig. 6). January month sow the 200 210
 166 196
highest number of rainy days which amounted to 1002, with 100
July month recorded 166. The summer months from
November to March show a higher number of rainy days
which ranged from 761 to 1002 and the winter months ranged Months of the Year
from 166 to 391. Thus serve to confirm climate variability Fig. 6. Trends in the total number of monthly rainfall days for Glen weather
and the long dry spells that occur during the winter season in station.
this region.

 Fig. 7. Trends in total annual number of rainfall days and sum of annual rainfall.

 meteorological drought event within a season. During this
D. Dry Spell Length Analysis
 season and based on the consecutive dry days, agricultural
 Consecutive dry days of 1 to 10 days indicate is an drought and meteorological drought are a regular event of dry
indication of a weak dry spell period; a medium-strength dry and cold season (Fig. 8 and Fig. 9). Up to about 90
spell between 11 and 20 and above 21 days is categorized as consecutive dry days can be observed in the Free State (Fig.
a strong dry spell. Consecutive dry days over the period of 31 8), and in some parts of the province even more numbers can
days, as observed in Glen weather station (Fig. 8), signify be observed.
prolonged dry spell periods which agricultural and

 DOI: http://dx.doi.org/10.24018/ejfood.2021.3.3.313 Vol 3 | Issue 3 | June 2021 115
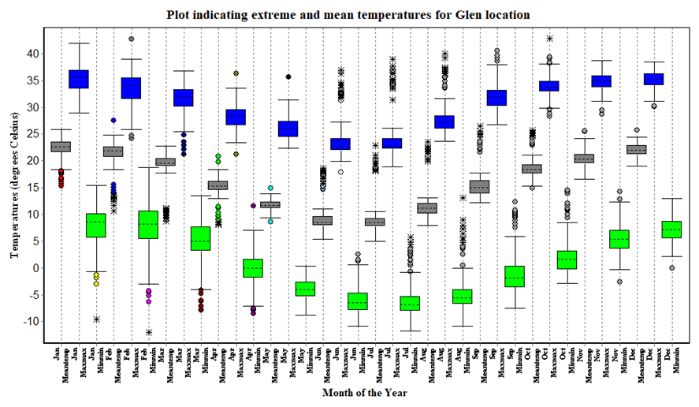
RESEARCH ARTICLE
 European Journal of Agriculture and Food Sciences
 www.ejfood.org

 Some years experienced early rainfall onset starting from E. Temperature Data Analysis
mid-October and late onset experienced late December to Field experiences and climate studies has provided
early January. Dry years displayed annual rainfall far below scientific evidence of the Earth progressively getting warmer
average annual rainfall in year 1922, 2007, 2015 to mention [14]. The province is situated inland of South Africa. It is
a few and observed data show drought occurrence typically warm, with extreme heat in summer and extremely
intensifying in the last thirty years. During 2018/19 planting cold temperatures during autumn to winter seasons in winter
season, prolonged dry spell, which last for up to 28 days had (Fig. 9 and Fig. 10). More extreme intra-day, intra-seasonal
the severe effects in this region. For example, rainfall onset and inter-seasonal air temperature variations were observed.
was delayed to early February, which resulted farmers to The province is characterised by warm to sizzling summers,
plant short season cultivars. The average rainfall received for heatwave, wind storms, wildfires and winters are severely
December 2018 was 0.70 mm and the maximum temperature cold with occurrencnce of black forst. Fig. 10 displayed a
ranged from 30 ºC to 40 ºC, which lead to higher slight downward trend on minimum temperature. The
evapotranspiration rate. Another example, severe drought decrease in night air temperatures and a significant increase
event in 2015/2016 and 2018/2019 resulted to severe impact in day-time air temperatures specify distictive air temperature
on crop production, animal husbandry and human health. variations in this region, and thus contribute to low soil
Prolonged dry spells or drought events in rain-fed production regime temperature and the low specific heat capacity of the
consequent to crop failure and food insecurity. soil. Daily air temperature variations with decreased wet days
 An example of longer length dry spell periods is seen in and mean annual rainfall, consequence to dry spells and
year 2017, March received only 3mm and such occurrence drought.
impeded crop growth and development under rain-fed crops, In this region, January to November the minimum
which led to crop failure. It is apparent this location temperatures could drop below zero. January to March and
experience rainfall inconsistencies which lead to severe October have minimum temperatures ranged from -5 °C and
impact on agricultural productivity in the absence of weather 0 °C. During the coldest months June, July and August
forecast and climate prediction for informed decision making. minimum temperatures can drop to below -10 °C. The highest
 The largest daily extreme was seen in 1976 and 1988 and maximum temperatures are distinct between September and
both amounted to about 96mm. Other extremes recorded March, but only January recorded the highest maximum
above 80mm per day were obesrved in 1960, 1996, 1998 and above 40 °C. The highest recorded maximum temperature
2006 which recorded 86.9 mm. 85 mm, 83 mm and 80.9 mm, was 42 °C (Fig. 9 and Fig. 10).
respectively. Just about 23 in 86years had a value over 60 mm Temperature is one of the most important climatic
which counts of only 26.7%. Just over half years had a value parameters as it is a determinant of plant and animal growth
of more than 40 mm which count to about 70%. and survival. Moreover, crops, livestock, stored products,
 This region indicate 80% probability of receiving packaging of products, pests and diseases are all affected by
67.04 mm. The annual maximum exceeded 67.04 mm on one the temperature conditions. Temperature is a primary factor
year in 5, simple meaning the the five-year return period. The affecting the rate of plant development. High air temperature
maximum daily was less than 50.5 mm in 50% of the years reduces the growth of shoots which affect root growth.
and less than 35.04 mm was received in less than 20% of the Understanding of temperatures assure identification of
years. The model estimate that the best sowing date is the 31 critical temperatures which are the limits that cause distinct
October for early planting in good rainfall years. Mid- but sub-lethal responses, for example the shedding of tomato
November, late-November, early December, early plant at below 5 °C, the fastest growth of maize roots and
December, first and last week of January are the best planting shoots at 30 °C, temperatures of -2 °C injured the leaves of
dates provided crop type and cultivars are taken into unhardened winter wheat plants and -4 °C was lethal. Plant
considerations. growth and development are entirely related to critical
 temperature values from germination to the fall of seasonal
 temperature, rainfall amount, soil water balance, day length
 patterns and their interactive effects.

 Fig. 8. Daily rainfall distribution and dry spell lengths indication for year 2017.

 DOI: http://dx.doi.org/10.24018/ejfood.2021.3.3.313 Vol 3 | Issue 3 | June 2021 116
RESEARCH ARTICLE
 European Journal of Agriculture and Food Sciences
 www.ejfood.org

 Fig. 9. Monthly extreme average temperatures pattern for Glen location.

 32 90 Kc coefficient approach integrates crop characteristics and
 30 averaged effects of evaporation from the soil. The Kc values
 28 80
 for initial, crop development, mid-season, and late stages crop
 26
 24 y = -0,0228x + 26,124 70 development, ranged from 0.40-6., 0.70-0.80,1.1-1.21 and
 22 R² = 0,0003 0.50-0.66 (b).
 60
Temperature (C°)

 20
 Rainfall (mm)

 18
 50
 16 800 6
 14
 40 700
 12

 Maize crop yield (tons/ha)
 y = -0,2903x + 10,451 5
 10 R² = 0,0313 30 600
 8 4
 6 500
 Seasonal rainfall (mm)

 20
 4
 400 3
 2 10
 0 300
 -2 0 2
 Jan Feb Mar Apr May Jun Jul Aug Sep Oct Nov Dec
 200
 Months of the Year 1
 Rainfall 100
 Maximum Temperature 0 0
 Minimum Temperature
 Linear (Maximum Temperature)
 Fig. 10. Monthly maximum, minimum temperatures and rainfall for Glen
 station. Planting season
 Seasonal Rains Maize Yield

F. Maize Crop Production Fig. 11. Graph indicating maize crop yield for Glen Farm Experiment.
 The average maize yield for Glen Experimental Farm from
 The planting dates were selected based on the rainfall
2006 to 2020 was 3.78 tons ha-1. The seasonal yield ranged
 probabilities for the region, 14-day weather forecast and
from 1.98 7tons ha-1 to 5.44 7tons ha-1. The highest maize
 regional climate prediction, whether the predicted rains
yield was achieved 2006, 2008, 2013 and 2020. The trend
 would be above-normal, normal, or below normal. The
indicates a slightly and insignificant increase in crop yield
 planting dates were identified from, last October dekad 3rd,
with R2 of 0.0043. The Free State average maize yield was
 2nd November, last December dekad and 1 st January dekad.
recorded at 3.8 tons ha-1. (Fig. 11). An indication of maize
 During the planting season were dry spells were observed
yield pattern and seasonal rainfall trends shown in Fig. 11.
 supplementary irrigation was established to avoid crop failure
The crop yield pattern indicates, the correlation between
 and improve soil water content. Planting season 2011/12 and
seasonal rainfall and maize crop yield. During the drier
 2015/16 was the most affected, the seasonal rains ranged
season the yield was lower comparing the seasons that
 from 257.7 mm and 259,1 mm, this planting season was
obtained higher seasonal rainfall (Fig. 11). Maize production
 associated with drought events in the province. Field
is economically viable if the production exceeds
 management measures are critical mostly during drought
3.6 7 tons ha-1. The yield average obtained from this study
 events to retain soil water content and minimize the rate of
indicate the average yield for this region is within the
 evapotranspiration toward optimizing the turgidity of crops.
expected amount. The crop coefficient (Kc) as the ratio of
crop evapotranspiration (ETC) over Evaporation (ETo). The

 DOI: http://dx.doi.org/10.24018/ejfood.2021.3.3.313 Vol 3 | Issue 3 | June 2021 117
RESEARCH ARTICLE
 European Journal of Agriculture and Food Sciences
 www.ejfood.org

 100 IV. CONCLUSIONS
 Crop Canopy (%)
 80
 The study area is located in a semi-arid Agroclimatological
 Zone with the annual rainfall of 559 mm. The highest rains
 60 occur in January with the lowest rains in July and the coldest
 months being June and July. The study area constitutes of
 40
 three soil types, namely, Bonheim, Swartland, Glenrosa and
 20 Valsrivier which are under pasture camps and under crop
 production Hutton soil form.
 0 The climate data indicate the highest mean annual rainfall
 0 10 20 30 40 50 60 70 80 90 100 110
 amounted to 102,3mm in 1988 and 1029,5mm in 1943 with
 Days After Planting
 (a)
 the lowest at 315,1mm in1992. The high variability in inter-
 1,4 seasonal and intra-seasonal, indicate the exposure to dry
 spells, in spring, autumn and winter season. This region
 1,2 experiences wet spell in spring and summer month.
 1 One in fifty years an annual average was recorded above
 0,8
 1000mm and six in eight years at 800 mm. The rainy season
 starts late December to early April and floods are susceptible
 Kc

 0,6 from January to March. Sequential planting may start as early
 0,4 as October to April for summer crops. January had the highest
 number of rainy days comparing to other months. Prolonged
 0,2
 dry spells of more than 31 days were observed at Glen
 0 automatic weather stations. The largest daily extreme was
 0 10 20 30 40 50 60 70 80 90 100 110 120
 Days After Planting seen in 1976 and 1988 and both amounted to about 96mm.
 (b) The region is characterised with more extreme intra-day,
 Fig. 12. Crop canopy (a) and crop coefficient (b) in different crop growth intra-seasonal and inter-seasonal air temperature variations.
 stages of maize. Findings in the study indicated that, maize yield average
 was about 3.78 tons ha-1. The suitable planting dates were
 The results indicated the highest crop canopy was about identified from, last October decade 3rd, 2nd November, last
80% obtained at 80 days after planting (Fig. 12(a), with a leaf December decade and 1st January decade. The maize growing
area index of 4.8 for maize late planted cultivar under rain- seasonal rainfall ranged from 257.7 mm and 745.5 mm, with
fed. The best planting dates were observed to be in mid- the crop coefficient Kc ranging from 0.5 to 1.28. Comparing
November, mid-December, and most preferable early to other studies, Kc can vary from one region to another.
January to minimize the occurrence of prolonged dry spells These Kc variations are influenced by environmental
and increase planting density for economically viable yield. conditions, variety selection and crop developmental stages.
Degree days are critical for determining the length of the Furthermore, agrometeorological parameters result to Kc
season and the suitable planting dates to improve the yields. variation, elevated air temperature, water vapour pressure
 Understanding of rainfall and air temperature trends and its deficit during the growing season that trigger leaf stomatal
features is essential for planning as well as formulating closure which impeded the plant from full potential
strategies for area-specific adaptation. This study also transpiration.
contributed on the implementation of United Nation’s We recommend that the crop producers incorporate
Sustainable Development Goals (SDGs) and developed weather forecast, climate prediction, climate smart
recommendations that could be implemented when knowledge and technologies, preventative measures and
formulating local adaptation strategies toward the early warning systems minimize the extent of risk. This study
improvement of the environment and the livelihood of the area was selected because of the active crop production and
societies. Timely dissemination of knowledge on adaptation other agricultural enterprises. However, special training on
strategies could guide the communities to take necessary agrometeorological applications should be arranged for the
preventative measures and minimize disasters. For example, local farmers and extension intermediaries within the region.
decrease in the number of rainfall days, lead to shorter Dynamic trends and characteristics of both rainfall and air
planting season, and lack of water and thus infringe the right temperature regimes for this region must be understood from
to clean water for agricultural production. But increasing in context-specific perspectives to address challenges brought
time and night temperature, could affect crop growth and by climate variability and change to improve agricultural
physiology, to alleviate poverty water storage, irrigation and produce and food security.
adoption of climate smart agriculture are the preeminent
recommendations. Poverty alleviation programmes in the
Free State are grounded on selling the final products to the ACKNOWLEDGMENT
community as fresh maize on the cob, dry maize for livestock
feed and selling dry maize to the millers for maize meal. All The National Research Foundation financially supported
these final maize products are sold for generation income. this research.

 DOI: http://dx.doi.org/10.24018/ejfood.2021.3.3.313 Vol 3 | Issue 3 | June 2021 118
RESEARCH ARTICLE
European Journal of Agriculture and Food Sciences
www.ejfood.org

 REFERENCES and Agriculture, vol. 100, no. 14, Nov. 2020, doi:
 10.1002/jsfa.9346.
 [1] J. E. Bell et al., “Changes in extreme events and the potential [22] M.C. Thomson and S.J. Mason, Climate information for public
 impacts on human health,” Journal of the Air & Waste health action. Routledge Studies in Environment and Health.
 Management Association, vol. 68, no. 4, Apr. 2018, doi: Routledge Studies in Environment and HealthRoutledge. Studies
 10.1080/10962247.2017.1401017. in Environment and Health, 2019.
 [2] S. Hales, “Impacts on health of climate extremes,” Climate Change [23] K. Stigter, “Agrometeorological Services under a Changing
 and Human Health: Risks and Responses, pp. 79–102, 2003. Climate: Old Wine in New Bags,” Bulletin, vol. 57, no. 2, 2008.
 [3] G. Zuma-Netshiukhwi and S. Mphandeli, “The capabilities of [24] J. M. Antle, J. W. Jones, and C. E. Rosenzweig, “Next generation
 interdisciplinary approach to strengthening farmers’ resilience to agricultural system data, models and knowledge products:
 climate variability and change,” International Journal of Research Introduction,” Agricultural Systems, vol. 155, Jul. 2017, doi:
 in Agriculture and Forestry, vol. 6, pp. 18–25, 2019. 10.1016/j.agsy.2016.09.003.
 [4] N.M. Sujakhu, S. Ranjitkar, J. He, D. Schimdt-Vogt, Y. Su, and J. [25] C. Leclerc and G. Coppens d’Eeckenbrugge, “Social Organization
 Xu, “Assessing the Livelihood Vulnerability of Rural Indigenous of Crop Genetic Diversity. The G × E × S Interaction Model,”
 Households to Climate Changes in Central Nepal, Himalaya,” Diversity, vol. 4, no. 1, Dec. 2011, doi: 10.3390/d4010001.
 Sustaainability MDPI, vol. 11, no. 10, pp. 1–18, May 2019. [26] H. Jordaan et al., “Determining the water footprints of selected
 [5] G. Zuma-Netshiukhwi, “The Use of Operational Weather and field and forage crops, and derived products in South Africa.,”
 Climate Information in Farmer Decision Making, Exemplified for Bloemfontein, Sep. 2019.
 the South-Western Free State, South Africa,” 2012. [27] S. L. Falasca, A. C. Ulberich, and E. Ulberich, “Developing an
 [6] B. Lyon, “Southern Africa Summer Drought and Heat Waves: agro-climatic zoning model to determine potential production
 Observations and Coupled Model Behavior,” Journal of Climate, areas for castor bean (Ricinus communis L.),” Industrial Crops
 vol. 22, no. 22, Nov. 2009, doi: 10.1175/2009JCLI3101.1. and Products, vol. 40, Nov. 2012, doi:
 [7] I. R. Orimoloye, O. O. Ololade, and J. A. Belle, “Satellite-based 10.1016/j.indcrop.2012.02.044.
 application in drought disaster assessment using terra MOD13Q1 [28] M. Ndlovu, A. D. Clulow, M. J. Savage, L. Nhamo, J. Magidi, and
 data across free state province, South Africa,” Journal of T. Mabhaudhi, “An Assessment of the Impacts of Climate
 Environmental Management, vol. 285, May 2021, doi: Variability and Change in KwaZulu-Natal Province, South
 10.1016/j.jenvman.2021.112112. Africa,” Atmosphere, vol. 12, no. 4, Mar. 2021, doi:
 [8] M. Sivakumar, “Climate prediction and agriculture: current status 10.3390/atmos12040427.
 and future challenges,” Climate Research, vol. 33, Dec. 2006, doi: [29] P. C. Tharaga, W. Tesfuhuney, G. M. Coetzer, and M. J. Savage,
 10.3354/cr033003. “Transpiration rates of rain-fed sweet cherry ( Prunus avium L.)
 [9] J. Malherbe, B. Dieppos, P. Maluleke, M. Van Stander, and D.I. using sap flow under warm temperate conditions,” Acta
 Pillay, “South African droughts and decadal variability,” Natural Horticulturae, no. 1300, Dec. 2020, doi:
 Harzards, vol. 80, pp. 657–681, 2016. 10.17660/ActaHortic.2020.1300.1.
 [10] C. Vogel, I. Koch, and K. van Zyl, “‘A Persistent Truth’— [30] J. L. Monteith, “Climatic variation and the growth of crops,”
 Reflections on Drought Risk Management in Southern Africa,” Quarterly Journal of the Royal Meteorological Society, vol. 107,
 Weather, Climate, and Society, vol. 2, no. 1, Jan. 2010, doi: no. 454, Jul. 2007, doi: 10.1002/qj.49710745402.
 10.1175/2009WCAS1017.1. [31] L. T. Evans and R. A. Fischer, “Yield Potential: Its Definition,
 [11] K. Wehrli, B. P. Guillod, M. Hauser, M. Leclair, and S. I. Measurement, and Significance,” Crop Science, vol. 39, no. 6,
 Seneviratne, “Identifying Key Driving Processes of Major Recent Nov. 1999, doi: 10.2135/cropsci1999.3961544x.
 Heat Waves,” Journal of Geophysical Research: Atmospheres, [32] S. Mpandeli et al., “Assessing climate change and adaptive
 vol. 124, no. 22, Nov. 2019, doi: 10.1029/2019JD030635. capacity at local scale using observed and remotely sensed data,”
 [12] M. Rouault, S. sen Roy, and R. C. Balling, “The diurnal cycle of Weather and Climate Extremes, vol. 26, Dec. 2019, doi:
 rainfall in South Africa in the austral summer,” International 10.1016/j.wace.2019.100240.
 Journal of Climatology, vol. 33, no. 3, Mar. 2013, doi: [33] A. Jordaan, Y. T. Bahta, and B. Phatudi-Mphahlele, “Ecological
 10.1002/joc.3451. vulnerability indicators to drought: Case of communal farmers in
 [13] R. Mahmood, S. Jia, and W. Zhu, “Analysis of climate variability, Eastern Cape, South Africa,” Jàmbá: Journal of Disaster Risk
 trends, and prediction in the most active parts of the Lake Chad Studies, vol. 11, no. 1, Jan. 2019, doi: 10.4102/jamba.v11i1.591.
 basin, Africa,” Scientific Reports, vol. 9, no. 1, Dec. 2019, doi: [34] J. Barron, J. Rockström, F. Gichuki, and N. Hatibu, “Dry spell
 10.1038/s41598-019-42811-9. analysis and maize yields for two semi-arid locations in east
 [14] F. Engelbrecht et al., “Projections of rapidly rising surface Africa,” Agricultural and Forest Meteorology, vol. 117, no. 1–2,
 temperatures over Africa under low mitigation,” Environmental Jun. 2003, doi: 10.1016/S0168-1923(03)00037-6.
 Research Letters, vol. 10, no. 8, Aug. 2015, doi: 10.1088/1748- [35] F. F. Teixeira and C. T. Guimarães, “Maize Genetic Resources
 9326/10/8/085004. and Pre-Breeding,” in Wild Germplasm for Genetic Improvement
 [15] S. M. Munson, R. H. Webb, J. Belnap, J. Andrew Hubbard, D. E. in Crop Plants, Elsevier, 2021. doi: 10.1016/B978-0-12-822137-
 Swann, and S. Rutman, “Forecasting climate change impacts to 2.00005-9.
 plant community composition in the S onoran [36] M. D. Baumann, “Agrobiodiversity’s caring material practices as
 D esert region,” Global Change Biology, vol. 18, no. a symbolic frame for environmental governance in Colombia’s
 3, Mar. 2012, doi: 10.1111/j.1365-2486.2011.02598.x. southern Tolima,” Geoforum, Jan. 2021, doi:
 [16] C. Y. Wright et al., “Major climate change-induced risks to human 10.1016/j.geoforum.2021.01.002.
 health in South Africa,” Environmental Research, vol. 196, May [37] K. S. Zimmerer et al., “The biodiversity of food and agriculture
 2021, doi: 10.1016/j.envres.2021.110973. (Agrobiodiversity) in the anthropocene: Research advances and
 [17] A. C. Kruger and M. P. Nxumalo, “Historical rainfall trends in conceptual framework,” Anthropocene, vol. 25, Mar. 2019, doi:
 South Africa: 1921–2015,” Water SA, vol. 43, no. 2, Apr. 2017, 10.1016/j.ancene.2019.100192.
 doi: 10.4314/wsa.v43i2.12. [38] X. Wang, D. Jiang, and X. Lang, “Future changes in Aridity Index
 [18] M. MA et al., “In situ measurements of winter wheat diurnal at two and four degrees of global warming above preindustrial
 changes in photosynthesis and environmental factors reveal new levels,” International Journal of Climatology, vol. 41, no. 1, Jan.
 insight into photosynthesis improvement by super-high-yield 2021, doi: 10.1002/joc.6620.
 cultivation,” Journal of Integrative Agriculture, vol. 20, no. 2, Feb. [39] L. Bakker, W. van der Werf, P. Tittonell, K. A. G. Wyckhuys, and
 2021, doi: 10.1016/S2095-3119(20)63554-7. F. J. J. A. Bianchi, “Neonicotinoids in global agriculture: evidence
 [19] G. Maure et al., “The southern African climate under 1.5 ◦C and 2 for a new pesticide treadmill?,” Ecology and Society, vol. 25, no.
 ◦C of global warming as simulated by CORDEX regional climate 3, 2020, doi: 10.5751/ES-11814-250326.
 models,” Environmental Research Lettters, vol. 13, pp. 1–9, Feb. [40] O. I. Ojo, G.M. Ochieng, and F.A.O. Otieno, Assessment of water
 2017. logging and salinity problems in South Africa: an overview of Vaal
 [20] N. MacKellar, M. Nem, and C. Jack, “Observed and modelled harts irrigation scheme. Water and, vol. 153. Water and Society,
 trends in rainfall and temperature for South Africa: 1960–2010.,” 2011.
 South African Journal, vol. 110, pp. 1–13, 2014. [41] S. J. Sacolo and S. H. Mkhandi, “Assessment of the potential of
 [21] M. Shepherd, J. A. Turner, B. Small, and D. Wheeler, “Priorities rainwater harvesting for maize production in the Lubombo
 for science to overcome hurdles thwarting the full promise of the plateau,” Physics and Chemistry of the Earth, Parts A/B/C, Sep.
 ‘digital agriculture’ revolution,” Journal of the Science of Food 2020, doi: 10.1016/j.pce.2020.102935.

 DOI: http://dx.doi.org/10.24018/ejfood.2021.3.3.313 Vol 3 | Issue 3 | June 2021 119
RESEARCH ARTICLE
European Journal of Agriculture and Food Sciences
www.ejfood.org

 [42] K. E. Giller, R. Hijbeek, J. A. Andersson, and J. Sumberg, January/February 2021, Issue 50. Zuma-Netshiukhwi, Gugulethu, 2020.
 “Regenerative Agriculture: An agronomic perspective,” Outlook The importance of agrometeorological knowledge in agriculture.
 on Agriculture, vol. 50, no. 1, Mar. 2021, doi: https://www.agriorbit.com/the-importance-of-agrometeorological-
 10.1177/0030727021998063. knowledge-in-agriculture. Zuma-Netshiukhwi, G and Mpandeli, S.,
 [43] D. A. Mortensen, J. F. Egan, B. D. Maxwell, M. R. Ryan, and R. 2019. The capabilities of Interdisciplinary Approach to Strengthening
 G. Smith, “Navigating a Critical Juncture for Sustainable Weed Farmers’ Resilience to Climate Variability and Change. International
 Management,” BioScience, vol. 62, no. 1, Jan. 2012, doi: Journal of Research in Agriculture and Forestry, Volume 6, Issue 6, pp
 10.1525/bio.2012.62.1.12. 11-15. Zuma-Netshiukhwi, G., 2018. The Importance of
 [44] S. Hartzell, M. S. Bartlett, and A. Porporato, “Unified Agrometeorological Services and Extension. Afgriland May/June Issue.
 representation of the C3, C4, and CAM photosynthetic pathways Zuma-Netshiukhwi, Gugulethu. 2017. Use of Operational Weather
 with the Photo3 model,” Ecological Modelling, vol. 384, Sep. and Climate Information in Farmer Decision. Lambert Academic
 2018, doi: 10.1016/j.ecolmodel.2018.06.012. Publishing. Her research interests are agrometeorological matters,
 [45] M. S. Bartlett, G. Vico, and A. Porporato, “Coupled carbon and climate variability and change, indigenous knowledge systems on
 water fluxes in CAM photosynthesis: modeling quantification of weather forecasting, climate predictions.
 water use efficiency and productivity,” Plant and Soil, vol. 383, Dr. G. Zuma-Netshiukhwi is a Professional Natural Scientist affiliated
 no. 1–2, Oct. 2014, doi: 10.1007/s11104-014-2064-2. with South African Council for Natural Scientific Professions. She is a
 [46] E.J. MacMillan, “The production of maize in the province of the member of the International Society for Agricultural Meteorology. She
 Free State.,” Transval Agricultural Journal, vol. 9, no. 33, pp. 14– was awarded a Certificate of Excellence in Reviewing by the Asian
 17, 1910. Journal of Agricultural Extension, Economics & Sociology in recognition
 [47] Department of Agricultural and Rural Development, “Free State of an outstanding contribution to the quality of the journal.
 Province State of Readiness,”
 https://static.pmg.org.za/171017freestate.pdf. pmg.org.za, Cape
 Town, Oct. 17, 2017. Accessed: Jun. 16, 2021. [Online]. Hlazo O. M. was born in Umtata in the Eastern Cape
 Available: https://static.pmg.org.za/171017freestate.pdf. province, South Africa on the 15 August.
 [48] M. C. Rutherford, L. W. Powrie, and L. B. Husted, “Plant diversity B.Sc. Hons. in Soil Science and Soil Physics, at the
 consequences of a herbivore-driven biome switch from Grassland University of the Free State, 2016; B.Sc. Environmental
 to Nama-Karoo shrub steppe in South Africa,” Applied Vegetation Geography, at the University of the Free State, 2015;
 Science, vol. 15, no. 1, Feb. 2012, doi: 10.1111/j.1654- Grain Grading Course Certificate, 2017.
 109X.2011.01160.x. He is currently a Lecturer since 2017 to date, lecturing
 [49] W. J. Bond and G. F. Midgley, “Carbon dioxide and the uneasy Soil Science and Land use planning at Glen College of Agriculture in
 interactions of trees and savannah grasses,” Philosophical Bloemfontein. He worked as a Field and Laboratory Assistant for Soil
 Transactions of the Royal Society B: Biological Sciences, vol. 367, Science at the University of the Free State, 2016.
 no. 1588, Feb. 2012, doi: 10.1098/rstb.2011.0182. He developed a mini-thesis titled, Water Use of Veld Ecotopes in
 [50] M.L. Masubelele, M.T. Hoffman, W.J. Bond, and J. Gambiza, “A Semi-Arid regions, in 2015. He contributed in the development of the
 50 year study shows grass cover has increased in shrublands of practical manual for Soil Science and a theory manual for Land Use
 semi-arid South Africa,” Journal of Arid Environments, vol. 104, Planning. He further developed a Guideline document titled, Agricultural
 pp. 43–51, 2014. Site Analysis, a Feasibility Study Document.
 [51] H. Jeong, S. Byun, D. R. Kim, and K.-S. Lee, “Frost growth Mr. O.M. Hlazo, is a potential associated member to the Soil Science
 mechanism and its behavior under ultra-low temperature Society of South Africa and to South African Council for Natural
 conditions,” International Journal of Heat and Mass Transfer, vol. Scientific Professions.
 169, Apr. 2021, doi: 10.1016/j.ijheatmasstransfer.2021.120941.
 [52] R. Stern, D. Rijks, I. Dale, and J. Knock, “Instat Climate Guide.”
 University of Reading, England, 2006. Motholo S. A. was born in the Free State Province,
 [53] Land Survey Staff, “Land type survey of South Africa,” ARC South Africa on the 9th of December.
 Library. 2004. B-Tech Degree in agricultural management at the
 [54] M. A. Tadross, B. C. Hewitson, and M. T. Usman, “The Central University of the Free State, 2011. He
 Interannual Variability of the Onset of the Maize Growing Season obtained a National diploma in Plant Production at
 over South Africa and Zimbabwe,” Journal of Climate, vol. 18, no. Glen college of agriculture 2006, Advance Maize
 16, Aug. 2005, doi: 10.1175/JCLI3423.1. Production and Marketing certificate, 2007; Advance
 [55] J. Null and CCM, “El Niño and La Niña Years and Intensities,” Wheat Production and Marketing Certificate, 2008;
 https://ggweather.com/enso/oni.htm, Mar. 2021. Advance Sunflower Production and Marketing
 Certificate, 2008.
 He is currently a Lecturer since 2007 to date, lecturing Agronomy,
 Zuma-Netshiukhwi G. was born in Balgown, Fruits and Vegetable production courses at Glen College of Agriculture
 KwaZulu-Natal province, South Africa on the 10th Bloemfontein. He worked as a Farm Manager at Denmar Dairies Farms
 October. in the Eastern Free State, 2016.
 PhD in Agrometeorology, University of the Free He contributed in the development of Tropical and Sub-Tropical Fruit
 State, 2012; Advanced Project Management Production manuals for theory and practical. He further compiled and
 Course, University of Leeds, 2021; Drought Risk developed Agronomic Grain Crops manuals for theory and practical, and
 Reduction in Water Resource Certificate, Cap-Net Vegetables Production manuals for theory and practical for college
 Virtual Campus, 2016; Higher Diploma in education.
 Agricultural Research and Development with Mr S. A. Motholo is affiliated as an associate member for South
 University of Wageningen in partnership with the African Council for Natural Scientific Professions.
Agricultural Research Council (ARC), 2005; M.Sc. in Agrometeorology,
University of the Free State, 2004; B.Sc. Agric. University of the Free
State, 2001 in Bloemfontein.
 She is currently a Researcher since 2014, specializing in the
agrometeorology discipline working for Agricultural Research Council in
Pretoria. She provided service as a Specialist in Agrometeorology:
Applications South African Weather Services in 2013-2014. During the
same period, she was an Assistant Lecturer at the University of the Free
State. She served as a Junior Researcher at ARC from 2005 to 2012. In
2004 she served as a Training Mananger, for Dihwai Food and
Agricultural Services.
 She has contributed in following latest publications: Zuma-
Netshiukhwi, Gugulethu, 2021. Weathering the Climate. Climate
variability and change-what is the difference? Harvest SA,

 DOI: http://dx.doi.org/10.24018/ejfood.2021.3.3.313 Vol 3 | Issue 3 | June 2021 120
You can also read