CANADA G20 CLIMATE RISK ATLAS - Impacts, policy, economics - CMCC Foundation
←
→
Page content transcription
If your browser does not render page correctly, please read the page content below
G20 CLIMATE RISK ATLAS
Impacts, policy, economics

CANADA                                                                                                                                With the scientific
                                                                                                                                       contribution of
                                                                                                                                      Enel Foundation

How to read the Atlas: graphs, colours and scenarios.
The maps used in this Atlas are taken from The World Bank Official Boundaries -
(accessed on May 28, 2021). For the section Energy, the maps are based on Panoply Data Viewer
Each sector of this Atlas contains data and information on various climate scenarios.
When reported in graphs, the colour black indicates data and information referring to the current state, the past or the baseline.
When the authors refer to RCP (Representative Concentration Pathways), the 3 colours used across the factsheet refer to 3 scenarios, which are 3
different development options with different levels of greenhouse gas emissions, respectively low emissions (green), medium emissions (orange), and
high emissions (red). The same colour code is used when RCPs are associated with Shared Socioeconomic Pathways (SSP).
In some cases, the authors refer to global warming scenarios. In these cases, the 3 colours used refer to a temperature rise of 1.5°C (green), 2°C (dark
green), and 4°C (red).
When the authors refer exclusively to Shared Socioeconomic Pathways - SSPs (Population affected by river floods in the section: “Water"), data related to
SSP3 - that encompasses, among other things, slow economic growth, material-intensive consumption, and persisting or worsening inequalities – are
reported in a lighter shade; SSP5 – which refers to social and economic development that is coupled with an energy-intensive lifestyle and the abundant
exploitation of fossil fuel resources – is shown using a middle shade of the colour, whereas data related to the present conditions are represented in a
dark shade.
Further details on scenarios, methodologies, and the full list of references are available at: www.g20climaterisks.org
                                                                                                                      Concept and graphic design by element6.eu
CANADA

CLIMATE
OVERVIEW                                                                TEMPERATURE PROJECTIONS
Climates and temperatures across Canada vary from                       Under a low emissions scenario projected temperature variations will
region to region due to its great latitudinal distribu-                 remain contained under +2.5°C, both by 2050 and 2100.
                                                                        Under a high emissions scenario, with no reduction in GHG emissions,
tion. Winters can be harsh in many parts of the country,                much greater temperature anomalies are expected by both 2050 and
particularly in the interior provinces, which experience                2100.
a continental climate. In non-coastal regions, snow can
cover the ground for almost six months a year, while in
parts of the north snow can persist year-round. Coastal                                                                              +9.8°C
areas have a temperate climate. Much of Northern                                TEMPERATURE                                          +5.0°C
Canada is covered in ice and permafrost.                                        ANOMALY                                              +2.5°C

TEMPERATURE                                                                                                       +4.5°C
The temperature regime in Canada is highly heterogeneous. Coastal                                                 +3.3°C
areas are usually cooler than inland areas, where temperatures during                                             +2.2°C
the summer have in some cases exceeded 40°C. In contrast, the
northern part often experiences temperatures below 0°C.
                                                                                            +0.8°C

MEAN                         -22                                11
                                                                         -0.8°C
TEMPERATURE                        Celsius degrees / Over 1991-2020

                                                                         1985               2014                  2050                  2100

                                                                        Historical Period

                                                                        EXPECTED VARIATION
                                                                        FOR TEMPERATURE AT 2050
                                                                        The indicators show variations in selected temperature characteristi-
                                                                        cs for a thirty-year period centred on 2050 (2036-2065) with respect
                                                                        to the reference period 1985-2014.

TEMPERATURE TREND                                                                   +4.1°C                  +2.6°C                     +6.1°C
Temperature anomalies over the last 60                         max
years with respect to the annual mean of                     3.5 °C                   +3.1°C                  +1.9°C                        +4.4°C
-6°C in Canada during the 1961-1990
period                                                                              +2.6°C                  +1.6°C                     +3.6°C
 1961                                                                   Annual Mean            Max Temperature           Min Temperature
                                                                        Temperature            of warmest month          of coldest month

                                                              2020
 -2.2 °C
 min
PRECIPITATION PRECIPITATION PROJECTIONS
Humid air masses from the Pacific interact with mountains to cause Precipitation trends show a clear tendency to increase
large quantities of rain on the west coast and mountain areas. Several following all scenarios with a large variability among
sites along the British Columbia coast receive high annual quantities the involved models. Increases in precipitation are
of precipitation in summer. accentuated under a high emissions scenario, with an +32.4%
On the interior plains and the North there is little precipitation. Spring increase of around 30% expected +13.9%
and summer are wetter than winter. Ontario and Quebec have more by the end of the century. +8.7%
rainfall than the interior plains because the air masses pick up water
vapour from the Great Lakes. The Atlantic provinces are wetter than
the provinces of Central Canada and mostly influenced by cyclones. PRECIPITATION +9.6%
In general, rainfall on Canada’s east coast is inferior to that of the west ANOMALY +9.7%
coast because of the prevailing offshore wind.
+7.5%
+2.1%
MEAN 95 4,571
-2.9%
PRECIPITATION mm/year / Over 1991-2020
1985 2014 2050 2100
Historical Period
EXPECTED VARIATION
FOR PRECIPITATION AT 2050
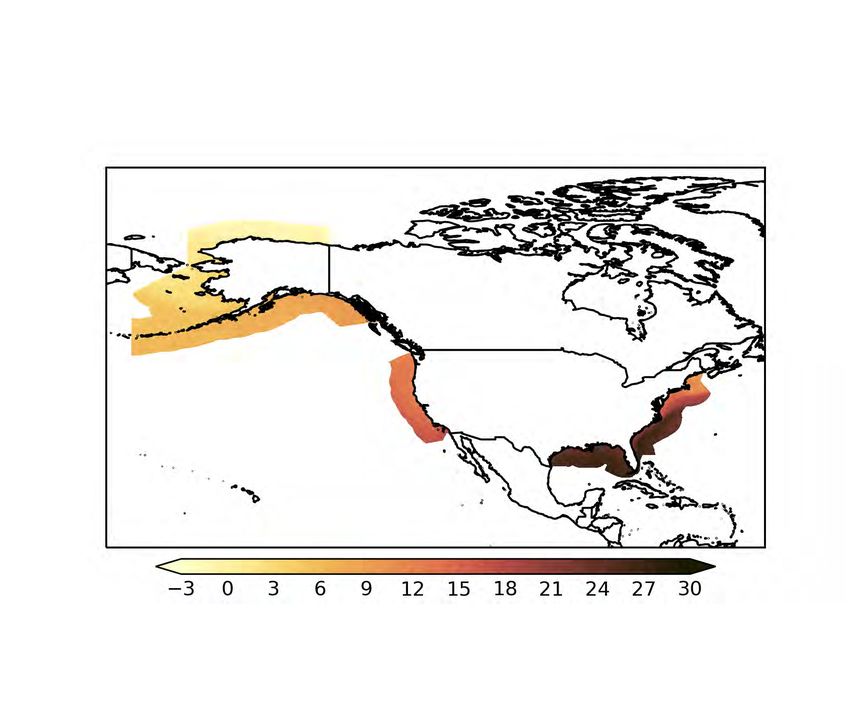
The indicators show variations in selected precipitation characteristi-
PRECIPITATION TREND cs for a thirty-year period centred on 2050 (2036-2065) with respect
Precipiation anomalies over the last 60 to the reference period 1985-2014.
years with respect to the annual mean of max
475 mm/year in Canada during the +16%
1961-1990 period +12.1% +11.4% +6.5%
1961 +9.4% +8.8% +5.6%
+8.6% +8.0% +5.6%
Annual total Precipitation of Precipitation of
precipitation wettest month warmest quarter
-11% 2020
min
+29% +14% +1,306% +9%
+13% +8% +181% +1%
VARIATION OF SPECIFIC +11% +7% +63% +0%
CLIMATE INDICATORS Agricultural drought Hydrological drought Heatwave Runoff
proportion of time proportion of time duration increase
Climate indicators variation showing % of time % of time % of time % of area
impacts of climate change on sectors such
as agriculture, health and water. Analysis +62% +11% +83% +45%
considers 3 threshold average temperatu-
re increase: +1.5°C, +2°C, +4°C. +31% +6% +27% +27%
+23% +11% +14% +14%
Agricultural Hydrological Heatwave Runoff
drought frequency drought frequency frequency decrease
% of change % of change % of change % of area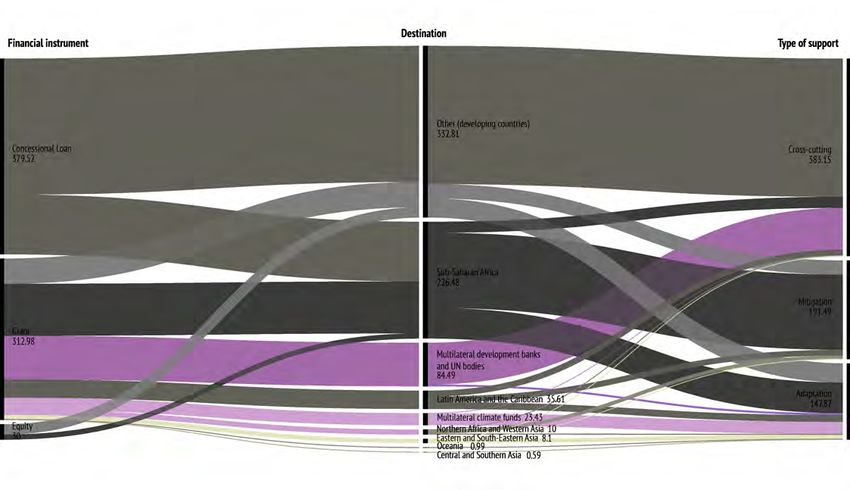
CANADA

OCEAN
OCEAN IN CANADA                                                        FUTURE PROJECTIONS
Canada’s marine exclusive economic zone (EEZ) is                       Projected annual changes within the marine EEZ for the two most
characterized by polar to temperate coastal waters,                    significant marine indicators of climate change: sea surface water
which host a large variety of ecosystems such as coral                 temperatures and pH.
reefs, eelgrass and kelp beds. In particular, coastal                  Seawater temperature changes are in line
systems can be divided into three main areas, namely                   with the definitions of each scenario, with
Arctic, Atlantic and Pacific marine regions.                            maximum values close to +4°C under a high
                                                                       emissions scenario in 2100.                            +4.3 °C
                                                                                                                              +2.1 °C
                                                                                                                              +1.2 °C
CURRENT CLIMATE CONDITIONS
Mean sea surface temperature reflects the different climate regimes,
from the cold waters in the polar northern coasts to the temperate             SEA SURFACE             +1.5 °C
areas in the Atlantic and Pacific.                                              TEMPERATURE             +1.2 °C
                                                                               ANOMALY
                                                                                                       +1.1 °C

                                                                                          0.1 °C

                                                                        -0.3 °C

 -3                                          18          MEAN           1950                 2014         2050                   2100

SEA SURFACE TEMPERATURE
Celsius degrees / Over 1991-2020

 0                                          0.5        TREND
                                                                        0.06

                                                                                          -0.02

                                                                                                         -0.12
                                                                               SEA SURFACE
                                                                               pH ANOMALY                -0.15
                                                                                                         -0.19

                                                                       Seawater surface pH becomes more acidic in              -0.13
                                                                       all scenarios, closely reflecting rising                 -0.24
                                                                       atmospheric CO₂ concentrations, and only a
                                                                                                                               -0.46
Surface temperature trends indicate a general warming of 0.2°C per     low emissions scenario leads to a stable
decade in all marine areas, with increased gains in the southeastern   condition by 2100.
regions.
ECOSYSTEM
INDICATORS AT 2050
Regional changes in key marine ecosystem indica-
tors under projected future scenarios by mid-cen-
tury (2036-2065) with respect to present climate
conditions (1985-2014).                                                      Arctic                  Atlantic                   Pacific

                                                                                       +1.22 °C                 +1.82 °C                 +2.35 °C
Temperature regulates the metabolism of marine
organisms determining which habitats remain                                  -0.29°C    +0.89 °C     7.48°C     +1.75 °C     10.64°C     +1.83 °C
suitable. Excessive warming will likely push
ecosystems beyond tolerance thresholds.                                                +0.79 °C                 +1.59 °C                 +2 °C

                                                                                       -0.2                     -0.18                    -0.17
pH represents the acid/base status of marine
waters, where a decreasing pH reflects the                                     8.09                     8.1                     8.07
                                                                                        -0.16                   -0.14                    -0.13
acidification of the ocean due to increased
absorption of atmospheric CO₂.                                                         -0.13                    -0.11                    -0.1

Oxygen is fundamental to sustain marine life and                                       -2.37 %                  -3.66 %                  -4.53 %
its reduction can have a large impact on coastal                             368.55     -1.21 %      309.34     -2.87 %      287.77      -3.45 %
ecosystem services including fisheries and                                    mmol/m3                mmol/m3                  mmol/m3
aquaculture.                                                                           -0.83 %                  -2.4 %                   -3.17 %

Chlorophyll is an indicator of the biomass                                             -5.7 %                   -10.21 %                 -6.72 %
available at the base of the marine food web                                  0.26      -4.94 %       0.48      -3.12 %        0.48      -5.25 %
supporting all ecosystem productivity.                                        mg/m3                  mg/m3                    mg/m3

                                                                                       -14.07 %                 -17.29 %                 -8.61 %

FISH CATCH POTENTIAL                                                            ANALYSIS DETAILS
Fish catch potential is an estimate of the maximum fish catch achie-             All datasets were analysed using only data from within the
vable given the marine resources available over a sustained period. It          marine EEZ and therefore excluding overseas territories,
is linked to the concept of maximum sustainable yield, meaning the              detached islands and any disputed or joint territories with
maximum amount of fish that can be extracted from a system without               other nations. In the assessment of current climate conditions,
causing a collapse in fish populations.                                          seawater surface tempererature data was obtained using
                                                                                satellite observations distributed in the framework of ESA
It is a characteristic of the natural system, which is substantially            Climate Change Initiative.
different from realized catch, and a direct result of the fishery policy in
place.                                                                          Future projections of marine indicators are represented by the
                                                                                combined analysis of results from 15 different Earth System
                                                                                models participating in the Coupled Model Intercomparison
                                                                                Project Phase 6 (CMIP6). These models include new and better
                                                               0.0%
Fish catch                     2050                                             representations of physical and biogeochemical processes,
                                                                                compared to previous IPCC assessment reports.
percentage
change                                                                          Fish catch potential data was obtained using the FAO's techni-
                                                               -1.6%            cal report and refers to the best and worst case climate scena-
                                                                                rios from the Fifth IPCC Assessment Report. These mean
                                                                                estimates are subject to substantial uncertainties as discussed
                                                                                in the original work.
CANADA

COASTS
OVERVIEW
With approximately 265,000 kilometres of shoreline,
Canada has the longest coastline in the world. It ranges
from resistant bedrock to gravel, sand, and mud. Perma-                       Shoreline                        265,523 km
frost (perennially frozen ground) is a significant com-                        Length
ponent of much of the northern coastline. The coast is
the focus of major economic activity, with most of the
coastal population concentrated in the city of Vancou-
ver, on the west coast, and smaller coastal populations                       Sandy
on the east coast around Quebec City, Halifax and St
Johns.                                                                        Coast Retreat                                          -25.8 m
                                                                              at 2050

CLIMATE CHANGE HAZARDS
Coastal hazards such as erosion, storm tide inundation and permanent         beaches and flood unprotected low lying areas. Increasing temperatu-
flooding, can have strong adverse impacts on coastal regions, with            res may also lead to rising land levels due gravitational adjustments
loss of sandy shores, damage to settlements, infrastructure and ecosy-       in parts of the country covered in permanent or semipermanent ice
stems. Climate change can exacerbate these impacts due to rising sea         frost. Some parts of Canada will also experience increasing exposure
levels and increasing impacts of waves and storms. With a range of           to extreme weather (on the west coast) or extra-tropical hurricanes
shoreline types, Canada's coastal zones have varying sensitivities to        (on the Atlantic Coast).
projected future climates. Rising sea levels will increasingly erode

SEA LEVEL RISE                                                               EXTREME SEA LEVEL
Relative sea level rise has been observed over the past century around       On average, one in 100 extreme sea level events are expected to rise
the coast of Canada, with a yearly average increase of approximately         from 2.82 metres at present day to 3.09 metres by 2050 under a
1.82 millimetres per year since the 1990s. The latest IPCC projections       medium emissions scenario.
indicate that, by 2050, global sea levels may rise between 0.18 metres,
under a low emissions scenario, and 0.23 metres, under a high
emissions scenario.

                                                               0.23 m                                                                        3.16 m
Observed and                                                                 Current and
projected sea                         1.81                                   projected extreme                 2.82 m                          3.09 m
level rise at 2050            mm/year                                        sea level at 2050
                                                               0.18 m

  OBSERVED                                                                      FUTURE
 STORMS           Canada’s coasts are exposed to both the Atlantic and
                  Pacific wave climates. Atlantic hurricanes commonly
                                                                              STORMS           The impacts of climate change on storms and waves are
                                                                                               quite uncertain. In general, models suggest that warmer
                  reach Canada’s coasts during the summer season, and                          sea temperatures will cause more intense hurricanes on
                  large pacific storms, particularly in winter, drive storm                     Canada's Atlantic coast, with a poleward shift of the
                  surges and shoreline impacts on the Pacific coast, which,                     areas affected. Changes in storms affecting Canada's
                  on average, experiences larger waves than the Atlantic                       pacific coast are also quite uncertain, with a possible
                  coast.                                                                       decrease in the size of waves.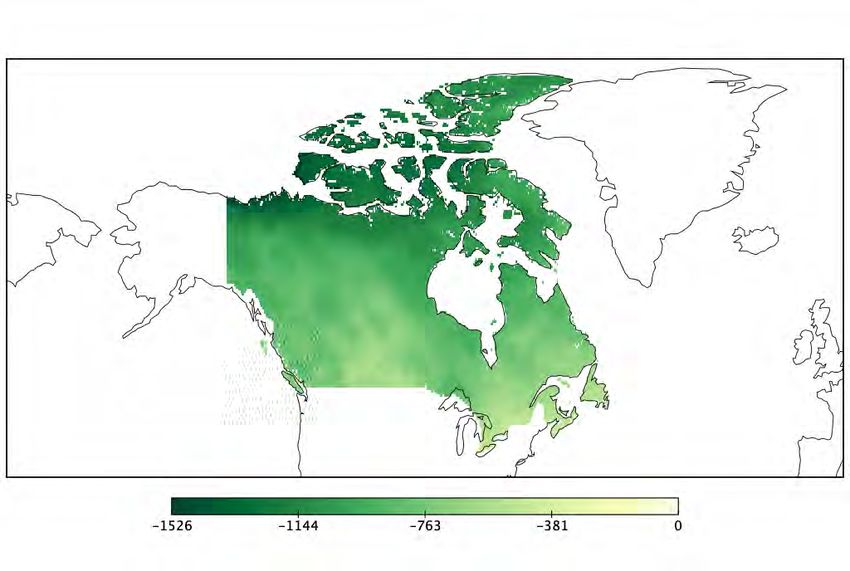
VULNERABILITY AND RISK
         Most of the coastal population in Canada is concentra-                                                         VULNERABLE
         ted in Vancouver, on the West Coast, and a few cities on                                        HISTORICAL     POPULATION
         the east coast including Quebec City, Halifax and St
         Johns. Smaller coastal towns and communities are
         exposed to the impacts of storms and sea level rise
         around the country. In Vancouver, parts of the city’s low                                    0.33 Million
         lying areas are already impacted by storm surges,
         effects which may be exacerbated by future sea level
         rise.
                                                                                                                                      0.35 Million
                                                                                                           2050
         The risks posed by relative sea-level change vary across Canada and                                                            0.35 Million
         are concentrated in populated areas. Sea level rise and and storm
         surges could cost Canada in the range 53.7 and 108.7 billion USD, with
         significant variations in costs and impacts across coastal provinces.                                                         0.35 Million

         Some provinces, such as Newfoundland and Labrador, may experience
         marginal impacts, whereas others such as British Columbia could be
                                                                                                                                      0.40 Million
         burdened with the highest costs. Under a medium emissions scenario,                               2100
         the population exposed to the annual coastal flood level is expected to
         increase from 330,000 to 350,000 people by 2050.                                                                               0.38 Million

                                                                                                                                      0.37 Million

                           INFLUENCE OF SEA LEVEL RISE
                           ON EXTREME SEA LEVEL                                              + Wave set up refers to the accumulation of water near
                                                                                             the shore due to the presence of breaking waves.
         Present and future sea level rise are a consequence of
         carbon induced global warming causing melting ice                                   + Storm surge is an occasional increase in sea level driven
         and ocean expansion due to heat accumulation.                                       by shoreward wind-driven water circulation and atmo-
                                                                                             spheric pressure.
         The extreme sea levels reported here are based on the 100-year storm
         surge + wave set up + sea level rise + high tide indicators. The first two           + High tide is usually the highest tide reached in a given
         parameters (storm surge + wave set up) are based on the 100-year                    location based on tide records.
         value for the event; sea level rise is its projected value at 2050; and
         high tide is the absolute value of the highest tide calculated for a
         given locality, which won’t be influenced by climate change.

                                                                                                                                                 Wave set up
                                                                                                                                                         Storm surge
         Wave set up                                                                                                                             Storm surge
Storm surge
        Storm surge
          Lowest  tide

            Mean sea level                                                  Extreme     Mean sea level
                                                                                                                                                 Sea levelSea
                                                                                                                                                           riselevel rise
Sea levelSea
          riselevel rise                                                    sea level
                                            0m elevation (AHD)                                                         0m elevation (AHD)
Hig tide Hig tide                                                                       Lowest tide                                                   Hig tide Hig tide

         Present sea levels have risen globally by approximately 20 centime-            Future sea level rise is a projection based on different global
         tres over the past century.                                                    warming scenarios, at approximately 100 centimetres by the end of
                                                                                        2100, with consequent inundation during extreme sea level events.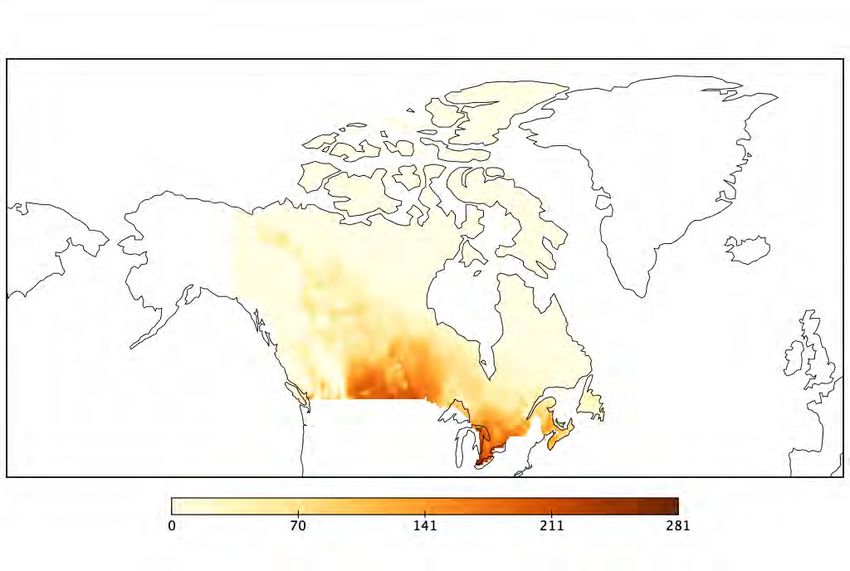
CANADA

WATER
OVERVIEW
Canada's fresh water supply is stored in rivers and
lakes, which account for almost 12% of the total area                      Renewable internal                   2,850
of the country, as well as groundwater, ice, and snow.                     freshwater resources              billion m3

Although the annual discharge of Canadian rivers
amounts to 7% of the world's renewable water supply,
aggregate measures show that approximately 60%
drains in the north, where less Canadians live.                            Renewable internal                 77,985
                                                                           freshwater resources                      m3

In fact, 85% of the population live within 300 kilome-                     per capita
tres of the Canada-USA border and many populated
areas have restricted water supplies. Water availability                  Even in the Great Lakes basin, the world's largest freshwater lake
is a major concern when considering water manage-                         system, some off-lake areas in southern Ontario experience periodic
ment in Canada.                                                           and even chronic water shortage, and groundwater "mining" takes
                                                                          place, whereby more water is taken out of the aquifer than is being
                                                                          recharged.

CLIMATE CHANGE HAZARDS
Climate change can affect water resources through increasing tempe-       shortages (droughts), excesses (floods) and associated water quality
ratures, higher rates of evapotranspiration and altered rainfall          issues, depending on the season. Since 1948, snowfall has increased
patterns. This leads to changes in the water cycle, including decrease    in the north, and decreased in southwestern Canada, whereas glacial
of snow and ice coverage, alterations of surface runoff and groundwa-     retreat has been widespread since the late 1800s in Western Canada
ter storage, as well as drought and flood occurrence. Climate change       and since the 1920s in the Arctic, with faster rates of retreat over the
impacts on water resources in Canada vary regionally including            past 50 years.

KEY POINT RUNOFF
                                                                                                                                      +7.3%
Runoff is a key indicator for evaluating changes in surface water. At     2050
the national level, changes in surface runoff are varied, with signifi-                Changes in
cant declines occurring at 11% of localities and significant increases                 annual runoff
at 4% of localities for the 1967-1996 period, with most decreases                     % of change
concentrated in southern Canada.                                                                                                      +25.2%
In general, an increase in surface runoff is expected across Canada. At
a country scale, an average increase in surface runoff by approxima-
tely 25% and 7% is expected respectively under a low and high                                                                         +45.0%
emissions scenarios for the 2045-2055 period, compared to                 2050
2015-2025.                                                                           Runoff increase
                                                                                     % of area
If temperatures rise by 1.5°C, 2°C or 4°C, 14%, 26.7% or 45.0% of the
area of the country will likely experience an increase in runoff, while                                                               +14.0%
0%, 0.9% and 9% of the surface of the country will likely experience a
respective decrease in runoff.
KEY POINT DROUGHTS
                                                                                                                                 +4.6%
For the Canadian boreal zone as a whole, several regions experienced
significant drying between 1951 and 2010, but there were also some
                                                                           2050     Severe drought
areas with significant wetting. The Prairies is the one with the                     likelihood increase
greatest frequency of drought in the country: due to a severe drought               % of change
that occurred in 2017, crops were affected with poor germination,                                                                +3.7%
stunted growth and early maturation. Drought resulted in poor pastu-
re production and unreliable water supplies. In 2021 severe droughts
have impacted numerous areas of southwestern Canada.
                                                                                                                                  +11.0%
With expected increases in average temperature across all seasons
according to climate models, drought risk is expected to increase in
                                                                           2050     Hydrological
many regions of the country. Current climate models suggest that the                drought frequency
southern Canadian Prairies and the interior of British Columbia will be             % of change
at a higher risk of drought in the future and as temperatures rise, the                                                           +6.0%
threat of drought will increase across many regions of Canada.

KEY POINT GROUNDWATER                                                                                                            +14.7%
The amount and availability of surface water influences groundwater.        2050     Groundwater
At the same time, groundwater plays an important role in sustaining                 Recharge
base flow for many Canadian rivers. There are marked regional                        % of change
differences in groundwater recharge estimates across the Canadian                                                                +2.7%
landmass, with the potential for recharge concentrated on the wast
and west coasts, where rainfall is also more prevalent.

Groundwater recharge is directly influenced by the amount of future         +2.7%, +12.4% and +14.7% change of the annual groundwater rechar-
rainfall, which is expected to decrease mainly in western Canada.          ge for the period 2045-2055 compared to the timeframe 2015-2025
Saline intrusion from sea level rise is expected to threaten groundwa-     is expected respectively under low, medium and high emissions
ter reserves near the coast in numerous areas. At the country level, a     scenarios.

KEY POINT FLOODS                                                           POPULATION AFFECTED BY RIVER FLOODS
Flash floods can be extremely dangerous and several notable events
have occurred in Canada. In the spring of 2013, flooding affected the        TODAY                                                    17,806
southern quarter of the state of Alberta, including the city of Calgary.                                                               people
As many as 100,000 people had to be evacuated from the area when
the Bow River watershed experienced above-average spring runoff             2050 SSP3                                                55,895
and rainfall, with four people drowning. In Calgary alone, 3,000                                                                       people
buildings were flooded with infrastructure severely damaged.
                                                                            2050 SSP5                                                87,729
Severe thunderstorms over the prairies have produced some of the                                                                       people
highest rainfall rates and largest local floods in Canada (such as in
Calgary, Edmonton and Lethbridge, and Alberta in 2014). Canada may         frequent winter thaw. Changes in the population exposed to floods
experience an increase in the risk of flooding in many regions in           are expected, with an increase from around 18,000 in the present day
winter due to less ice cover, more precipitation events, and more          to 56,000 under SSP3 and 88,000 under SSP5 by 2050.

RISK INDICATORS
The water stress index summarises current and future water related
vulnerabilities and risks at the global level. Scores are based on the
ratio of total water withdrawals, including agriculture, industrial and
human consumption, to available renewable surface and groundwa-
ter supplies.

WATER STRESS
Canada's water stress level is considered low for the recent past
(1960-2014 average), but it is expected to increase in the near future
(2030-2050) based on climate change projections.
CANADA

AGRICULTURE
OVERVIEW
Canada is one of the largest agricultural producers and
exporters in the world. As with other developed
nations, the proportion of the population employed
and economic contribution of this sector compared to
national GDP fell considerably over the 20th century.                          32.2 Mt                                    13.9 Mt
However, it still remains an important part of the                              Wheat                                       Maize
economy.
Canada is among the top global producers for canola, oats, milling                                   20.3 Mt
wheat, flaxseed, dry peas, lentils, and maple syrup, among others. One                                Rapeseed
in eight Canadians works in the agriculture and agri-food sector,
which employs over 2 million people between farms, processing
plants, boardrooms, laboratories and beyond. A wide range of agricul-
tural practices are used in Canada, from the sprawling wheat fields of           7.4 Mt                                     0.4 Mt
the prairies to the summer produce of the Okanagan valley. Only a
small fraction (7%) of Canada's land area is suitable for farming; most        Soybeans                                    Apples
of which is found in Western Canada.

Added Value of Agricultu-              Share of Agriculture                   Agricultural                           Area Equipped
 re, Forestry and Fishing            Value added in Total GDP                    land                                 for Irrigation

                                2000                                   2000                           2000

          22,476                                 1.9 %                          41,138                                      1,145
         USD Million                                                          Thousand HA                               Thousand HA

                                2018                                   2018                            2018

          31,293                                 1.9 %                          38,857                                      1,378
         USD Million                                                          Thousand HA                               Thousand HA

EXPECTED IMPACTS
ON AGRICULTURE PRODUCTIVITY                                                                                                 Rising
                                                                                                                      temperatures
                                                                                     Changes in
Rising temperatures, reduction in average annual precipitation, and                  precipitation
intensification of extreme events such as heat waves and drought,                     patterns
affect production variability with a tendency towards yield                                                                  Increased
reduction for many cultivated species, accompanied by a probable                                                      frequency of dry
decrease in food quality. Crops respond to increases in temperatures                                                spells and drought   Temperature
with changes in duration of the growing season, early appearance of                                                                        variability
phenological phases and potential shifts of cultivation areas toward                                   Increasing intensity of
higher latitudes and altitudes for better growing conditions. Howe-                                    extreme weather events
ver, impacts vary significantly depending on the geographical area
and specific crops in question.
CROP PRODUCTIVITY 3.3 6.9 (0.2)% 2.2 30.9 (18)%
Crop productivity refers to the harvested yield of a crop per unit of
land area. It is strongly influenced by climate and other environmental 8 (-2.1)% 37.2 (na)%
and management factors. Wheat Rapeseed
tons / ha tons / ha
Climate change is expected to have an impact on the productivity of
several major crops, although this may in part be offset by the fertili- 9.5 12.9 (9)% 2.8 36.3 (28.2)%
zing effect of higher CO₂.
14.6 (6)% 46.7 (25)%
Impacts are estimated using a range of model projections based on Maize Soybeans
tons / ha tons / ha
low to high emission scenarios and reported as percentage changes
between the 30-year average around the historical period and the
30-year average around 2050. Productivity change with (without) the CO₂ fertilization effect.
2050
Estimates assume sufficient water and nutrient supplies, and
do not include impacts of pests, diseases, or extreme events.
CHANGE IN WHEAT CHANGE IN MAIZE
_ = + _ = +
Longer frost-free seasons, increases in growing degree days, and even Rapeseed, soybean, maize and even wheat production are expected to
increased atmospheric CO₂ can, in theory, lead to better crop yields undergo increases in productivity under future scenarios. However,
and productivity. However, an increase in climate variability and the these benefits may decline with warming above 2.5 °C. Spring wheat
frequency of extreme events would adversely affect the agricultural may replace winter wheat throughout most of the prairies and soybe-
industry. More pronounced summer droughts may limit a growth in an may replace canola in southern areas.
productivity in Canada's prairie provinces.
ADAPTATION IN AGRICULTURE AND WATER RESOURCES
Canada’s agricultural regions will likely see both drier summers and Climate change may induce an increase of 25 to 30% of water require-
increased winter and spring precipitation. Projections show that ments for crops. Semi-arid regions may require supplemental irriga-
although much of southern Canada will be drier overall in the summer, tion during summers. Although availability of water supplies is
it could also face an increase in short-lived but very intense rainfall extremely consistent and covers agricultural needs, irrigation
events. Farmers may have to deal with both too much water during development can cause increases in relevant energy costs and lead to
the seeding season and too little water during the growing season. further emissions by the agricultural sector.
CHANGE IN WATER DEMAND
_ = +
Agriculture
Water Demand +25.7%
% of change
+29.4%
2050
The use of high-efficiency irrigation systems can effectively
reduce additional energy demand and costs for pumping
and distribution of water in agriculture.CANADA
FORESTS
FORESTS IN CANADA
Canada is one of the most forested countries in the 1990
world and Canadian forests contain huge economic,
cultural, and environmental value.
Boreal hardwood forests are largely distributed, and 348 Mln ha 210 Tons/ha
over 40% of primary forests are still intact, acting as a Million hectares Tons of Carbon per hectare
very precious source of biodiversity. Forested area Carbon stock
2020
FORESTED AREA AND CARBON STORAGE
Nearly 40% of Canada is covered in forests with a stable trend B2 over
recent decades. Canadian forests store an enormous amount of carbon
in living systems and soil, playing a key role in the country's emissions 347 Mln ha 208 Tons/ha
balance. According to the Canadian Forest Service, although managed Million hectares Tons of Carbon per hectare
forests used to act as a crucial carbon sink, recent natural disturbances Forested area Carbon stock
have reversed this condition making them a carbon source: releasing
more carbon than they accumulate on a yearly basis.
2050
FOREST PRODUCTIVITY Productivity anomaly
Tons of Carbon per
+0.56
Forest productivity, or Net Primary Production, is the net carbon hectare per year
captu- red by plants. It is the difference between the carbon gained +0.45
by Gross Primary Production - net photosynthesis measured at the
ecosystem scale - and carbon released by plants' respiration. It is
expressed per unit land area.
Weak increase expected in most of the country. Strong
in the northwest.
+ Fertilizing effect of increasing atmospheric CO₂
+ Melting permafrost
+ Lengthening of growing period
Decrease expected on the northern boundary of the
distribution ranges (Nunavut), and in large areas of
residual boreal primary forest.
+ Spread of dangerous insect outbreaks
KEY SPECIES
SHIFTING DECREASING PRODUCTION
BOREAL CONIFERS
UNDER Boreal forests are moving northwards too
fast
Strong decrease in biomass production of
dominant boreal species (mid to late
CLIMATE successional conifers)
CHANGE DIEBACK
ASPEN
INCREASING
COLONIZER SPECIES
Increased aspen dieback in the Prairies Increasing abundance of colonizer
temperate speciesFIRES IN CANADA WHERE DO FIRES OCCUR?
Fire is a structural ecological process that provides several types of Lightning-caused fires are more
ecosystem services and impacts on socio-ecological systems, common in British Columbia,
including human health, carbon budgets, and climate change. Changes Fire occurrence is mainly Ontario and Alberta.
in global fire activity are influenced by multiple factors such as human-caused in high popula-
land-cover change, policies, and climatic conditions. Fire also releases tion density areas such as
large quantities of greenhouse gases into the atmosphere, contribu- central and eastern Ontario,
ting to a vicious cycle. south-western Quebec, as well
as central-southern British
During the last two decades, the total forest area affected by fire Columbia.
was approximately 41.8 million hectares.
BURNING EMITTING
41.8 MILLION HECTARES OF 56.7 TERAGRAMMES OF
FOREST CARBON PER YEAR
The most affected areas are
the Taiga plains and the Taiga
Shield down through the
FOREST FIRE EMISSIONS
CONTRIBUTED TO
COSTING Boreal eco-zones.
90% OF TOTAL FIRE RELATED 417 MILLION USD IN ANNUAL
CARBON EMISSIONS SUPPRESSION COSTS
(1970-2009)
VARIATION OF SPECIFIC
FUTURE BURNED AREA FIRE INDICATORS
Under a low emissions scenario, models project a generalized
increase in burned area over the Artic tundra and mid boreal forests
and prairies. This trend is emphasized under a medium emissions % of change 2090
scenario, particularly over boreal plains and the western shield. Crown fire days in +47%
Burned areas may decrease in some taiga forest areas around Hudson Eastern Canada
bay and in eastern regions. +9%
% of change 2090
2050 Crown fire days in +45%
Burned Area +1,238 Western Canada
km² per year
+24%
+943
+58%
% of change 2041-2070
Average annual fire
suppression cost
+39%
FUTURE FIRE EMISSIONS
Fire emissions follow a similar spatial pattern to burned area with
important changes over eastern and western parts of the country
under both low and medium emissions scenarios.
Decrease in burned areas for a low emissions scenario 2050
Fire Carbon emission +44.2
Teragrams of Carbon per
Increase in burned areas for a low emissions scenario year
+ Prolonged fire season due to rising temperatures and fuel dryness
+33.9
+ Increase in the proportion of days with unmanageable fires across
northern and eastern boreal forests.CANADA
URBAN
OVERVIEW
A 20% growth in Canada's population is expected by 2020
2050, with the country becoming increasingly more
urbanized. 30,670,064
Population in
Over half the urban population live in cities with more Urban Areas
than 1 million residents, whereas 25% live in cities 2050 39,233,850
with fewer than 300,000. The number of big cities and
percentage of urban populations residing there are not
projected to change much by 2035.
Built up areas cover 0.16% of Canada (15,717.89 Graphs refer to data provided by United Nations, Department of
Economic and Social Affairs, Population Division (2018). World Urbani-
square kilometers). zation
2020
81.6%
Urbanization
Rate
OVERVIEW OF KEY 2050
87.3%
CLIMATE IMPACTS IN URBAN AREAS
With climate change, Canadian cities will face more frequent and
intense heat events; increased incidences of poor air quality;
short-duration, high-intensity rainfall events; wind storms;
wildland-urban interface fires; coastal erosion; storm surge flooding;
and decreased water quality.
+970.7%
HEATWAVES AND HEAT STRESS 2050
Cooling
Degree Days +248.1%
Cities are subject to higher temperatures because of the Urban Heat
% of change
Island (UHI) effect. Built up areas absorb solar radiation during the day
and release the heat at night, warming the surrounding air. This is a +135.4%
result of several factors including reduced natural landscapes,
building material properties, urban geometry and waste heat. Canada
is warming at twice the rate of global mean temperature increase. +82.7%
From 1948-2016 the mean annual temperature increased by 1.7°C for 2100
Heatwave
all of Canada, and 2.3°C for the northern portion of the country. frequency +26.5%
% of change
Hot days (max temp > 30°C) are uncommon north of 60º latitude, but +14.0%
have increased annually by about 1-3 days at several stations in
southern Canada from 1948-2016. Hot nights (min temp > 22°C) have
increased at a few stations in southern Ontario and Quebec.
+1,306%
Future scenarios of +1.5°C, +2°C and +4°C mean temperature increse 2050 Heatwave +181%
indicate that the frequency and duration of heatwaves will increase duration
for the entire country. This will lead to an increase in the number of % of time
cooling degree days. +63%HEAT, HEALTH AND AIR POLLUTION
Heat related health impacts from increasing air temperatures in urban 2017
Population exposed
areas are furthermore accentuated by air pollution. Wildfires, which 0%
are projected to increase in frequency, contribute to lower air quality to air pollution
at the wildland–urban interface. Particulates (especially PM2.5) from
wildfire smoke can affect air quality and health across great distances.
COASTAL FLOODING 2050 0.23 m
Canada has the most extensive coastline in the world, fronting on the
Atlantic, Arctic and Pacific Oceans. Coastal communities in Canada are
facing risks including damage to coastal infrastructure, property, and
people from inundation, saltwater intrusion and coastal erosion due 0.18 m
to sea level rise and storm surges. Projected
sea level rise
The different landscapes and climates of the west coast, north coast 0.77 m
and east coast regions influence their relative vulnerability to sea 2100
level rise and coastal flooding. Changes in sea-level will vary signifi-
cantly in the future, and in the areas where sea levels are rising, the
frequency and magnitude of storm-surge flooding will increase.
0.38 m
EXTREME PRECIPITATION EVENTS
The amount of precipitation varies widely across Canada, decreasing
from south to north. Recent trends show that annual mean precipita-
tion is increasing, on average, with larger percentage increases in +45%
northern Canada. 2050 Runoff
Annual precipitation and winter precipitation are projected to increa-
increase +27%
% of area
se accross the country in the 21st century, with larger percentage
changes in northern Canada. Summer precipitation is projected to +14%
decrease in southern Canada.
SURFACE SEALING Heavy precipitation in cities is problematic due to the high level of sealed surfaces. Soil sealing
increases run off and reduces the amount of water absorbed by soil. Where there are large amoun-
AND FLOODS ts of impervious ground cover, short duration extreme rainfall events can lead to increased
flooding, even resulting in flash floods.CANADA
HEALTH
OVERVIEW
Due to its large landmass, the climate-related impacts increasing rapidly, and at the same time, the health and
on the wellbeing of Canadians varies widely from social systems necessary to mitigate these impacts are
region to region. Future climate change is likely to often unable to meet the needs of those most vulne-
increase many health risks, including that of infectious rable to climate-related health hazards.
diseases. The impacts of climate change on health are
HEAT RELATED MORTALITY
Climate change related health risks in Canada include direct and
indirect illnesses and deaths related to poor air quality, water and Heat-related mortality
% change with respect to 2000-2004
food borne contamination, changing patterns of diseases spread by
animals, ticks and insects. Extreme weather events, including extreme
heat events and urban heat islands due to the increase in temperature
extremes and the risk of heat-related illness, will increase while
exacerbating cardiovascular disease, diabetes, and respiratory disea- 2018
ses. Still, cold exposure in some places will be reduced. Under a high
emissions scenario, heatwave-related excess deaths will increase by +58%
455% in Canada.
Under a medium emissions scenario, the increases in heatwave-rela-
ted excess mortality will be around 293%. In 2018, there was a 58%
increase in heat-related deaths in Canada compared to a 2000 to
2004 baseline. 38.5% of heat-related mortality during 1991 to 2015
can be attributed to human-induced climate change.
IMPACTS ON LABOUR Impact on total labour
Labour is directly affected by changes in environmental conditions. % change with respect to 1986-2005 baseline
Warming affects both the number of hours worked (labour supply) and
on the productivity of workers during their working hours (labour
productivity). Both labour supply and productivity are projected to
decrease under future climate change in most parts of the world, and 2050
particularly in tropical regions.
Parts of sub-Saharan Africa, south Asia, and southeast Asia are at
highest risk under future warming scenarios. Future climate change
will reduce global total labour in the low-exposure sectors by 18
percentage points and by24.8 percentage points in the high-exposure +0.2%
sectors under a 3.0°C warming scenario
Canada is one of the few countries projected to experience positive
+0.4%
impacts on labour productivity due to climate change. In Canada, 2080
there was a 4.4% gain in potential hours of labour in the agriculture
and construction sectors in 2019, compared to a 1990s baseline. Total
labour in Canada is expected to increase by 0.22% under a low
emissions scenario and by 0.36% under a medium emissions scenario.CLIMATE CHANGE AND DENGUE
Dengue has spread throughout the tropical world over the past 60
years and now affects over half the world’s population. Globally, vecto- Dengue suitability
rial capacity for both dengue vectors (A. aegypti and A. albopictus) has % of population at risk
been rising steadily since the 1980s, with nine of the ten highest years
occurring since 2000.
Climatic stressors are one important driver of the current distribution 88.4%
and incidence of dengue. Climate change is likely to expand the 2050
geographical distribution and suitability of several vector-borne
human infectious diseases including dengue. The risk of dengue 71.5%
transmission is increased by warming climates, as the growth and
development of mosquitoes are significantly influenced by temperatu-
re, precipitation, and humidity.
CLIMATE CHANGE AND ZIKA
Zika virus has spread to at least 49 countries and territories since 2013.
Climate change impacts on transmission suitability risk have increased Zika suitability
over the years and future warming over 1.3 billion additional people % of population at risk
could face suitable transmission temperatures for Zika by 2050.
56.9%
DENGUE AND ZIKA: POPULATION AT RISK 2050
Canada is currently at low risk of dengue and Zika transmissions.
Climate change is likely to have both direct and indirect impacts on the 27%
burden of West Nile fever, dengue, chickungunya fever, malaria,
leishmaniasis, tick-borne encephalitis, Lyme borreliosis, Crimean
Congo haemorrhagic fever, spotted fever rickettsioses, yellow fever,
Zika, and Rift Valley fever. However, these risks will increase due to
future climate change.
Warming temperatures due to climate change are improving the
suitability conditions for the spread of ticks that carry Lyme disease in
Canada. Under a low-emissions future, additional cases of Lyme disea-
se will increase to around 8,500 annually by mid-century compared to
about 600 cases per year.
CLIMATE CHANGE AND MALARIA Malaria suitability
Cases of Malaria are rare in Canada; however, climate change will likely % of population at risk
increase the occurrence of temperature conditions suitable for malaria
transmission. 6.4% of the Canadian population will be at risk of malaria
under a low emissions scenario in 2050, whereas 12.5% will be at risk 12.5%
under a high emissions scenario. 2050
POLLUTION AND PREMATURE MORTALITY
6.4%
In 2019, 14,600 premature deaths were associated with ambient air
pollution exposure in 2015.CANADA
ENERGY
ENERGY SYSTEM IN A NUTSHELL ENERGY SUPPLY
With over 75% of electricity generated from non-emit- Canada’s total primary energy supply energy mix is dominated by
ting sources the Canadian electricity system has one of natural gas and oil (both 35% in 2019), followed by hydropower
(nearly 11%, and historically a steady and major contributor). Nuclear
the lowest carbon contents in the world, although is also relevant (8% of total primary energy supply in 2019). Coal use
fossil fuels dominate the overall energy mix. is declining, accounting for only 5% in 2019. Renewable sources,
including hydro, account for 16% of total energy supply in Canada.
In 2019 a carbon tax of was introduced, with plans to
increase it gradually. Canada is one of the top world
energy producers, with the highest energy supply per
capita. Most fossil fuels produced are exported.
0.17 5.2%
ktoe/US$
Energy AC Share in
intensity electricity consumption
CLIMATE CHANGE TODAY
HYDROPOWER
Changes in temperatures and rainfall have
impacted surface water levels in Canada,
which can have a direct impact on the
capacity of hydroelectric power generation.
STORMS
Severe storms, hurricanes and floods have
caused major power outages and substantial
damage to energy infrastructure, for example
Post Tropical Storm Arthur in 2014, the USA
Canada ice storm of 2013 and the 2013 flash
flood in Toronto.
VULNERABILITY
ENERGY DEMAND
The energy infrastructure in Canada is Energy demand in Canada is driven mainly by transport (33%), the
ageing and a large proportion will need majority of which for road transport, followed by residential (22%) and
replacement or updating by 2050. Much of tertiary (13%). The agricultural and forestry sector demand is negligi-
the infrastructure is highly vulnerable to ble. Industry is also responsible for most of the non-energy use of fuels
climate risks, as it was designed based on (9%). Air conditioning accounts for approximately 10% of final residen-
outdated weather-related assumptions. tial electricity consumption.FUTURE ENERGY DEMAND
In Canada, hotter summers will increase peak demand, particularly in
large cities due to the urban heat island effect. Increasing energy Net change in 2050
demand in the USA could also result in an increase in Canadian - 78.10
electricity exports.
energy demand due to
Overall, total energy demand is projected to decrease, as the decrease changes in HDD/CDD
in heating needs more than outweighs the increase in cooling needs, Billion KWh
resulting in a net decrease in energy demand slightly in excess of 281
PJ (78 billion KWh) by 2050 under a medium emissions scenario.
COOLING NEEDS COOLING DEGREE DAYS 0 281
Cooling needs will increase summer
demand in many regions. The effects will
be most severe in the south eastern and
Prairie regions, while northern regions
remain mostly unchanged.
The increase in cooling needs is expected
to be less than the decrease in heating
needs across the country, resulting in a
net decline in energy demand.
HEATING NEEDS HEATING DEGREE DAYS -1,526 0
Heating needs are expected to decline
drastically all over the country and in
particular in the northern regions, outwei-
ghing the increases in summer cooling
needs expected in the south, along the
border with the USA.
FUTURE
ENERGY SUPPLY
The future configuration of the Canadian energy mix is likely to be and achieve net-zero emissions by 2050, it is likely to result in a
determined by the evolution of climate mitigation policies and hence reduction in the relevance of fossil fuels and their vulnerabilities,
is outside the scope of this report. However, given that Canada has while carbon-free sources and their vulnerabilities will prevail.
established targets to reduce CO₂ emissions by 30% of 2005 levels
EXPECTED IMPACTS
-6.41%
OF CLIMATE CHANGE
Change in 2050 Studies do not agree about the future of hydropower generation in
Hydropower generation -5.79% Canada. They range from average production gains of 7.1% under a
% of change low emissions scenario and 4.4% under a high emissions scenario, to
decreases by -5.8% and 6.5% under the same two scenarios.CANADA
ECONOMY
OVERVIEW
Canada ranks 11th in terms of GDP in the G20 group.
The COVID 19 crisis impacted the economy, which regi-
stered a 5.4% decline in real GDP in 2020. 0.31/-4.4%
2050
IMPACTS ON GDP
Climate change will have an effect on the growth rate and overall 0.08/-3.24%
systematic economic performance of the country. In the short term and
for moderate levels of warming the overall economic impacts of
climate change may be slightly positive for Canada. GDP Change
% change w.r.t baseline
By mid century, a low emissions scenario is indeed associated with a
33 billion euro loss, but also to possible benefits of 0.8 billion EUR.
The high emissions scenario is associated with a loss of 45 billion
EUR, but also to potential gains of 3 billion EUR.
-7.71/-13.08%
2100
By the end of the century, impacts are expected to be unambiguously
negative with losses ranging from 18 billion to 49 billion EUR under a
low emissions scenario and rising to between 79 billion to 133 billion
EUR under a high emissions scenario.
-1.68/-4.76%
SECTORAL ECONOMIC IMPACTS
IMPACTS ON INDUSTRY AND INFRASTRUCTURE crop and animal production of 11.67 billion CAD (7.7 billion EUR), this
Canada’s extensive coastline spreads across three marine coasts and is a substantial gain.
covers 243,000 kilometers. A large majority of the population lives
near coastal areas (one in six living within 20 kilometers of a marine Despite these positive predictions, extreme weather events of recent
coast) leaving them vulnerable to sea level rise and extreme weather years (2010-2016) in the Canadian Prairies, including flooding,
events. Climate change is expected to increase the pre-existing risks drought and wildfire have been some of the most damaging natural
of flooding and storms. disasters in Canadian history. The 2016 wildfire in Fort McMurray,
Alberta cost almost 4 billion CAD (2.65 billion EUR). Climate models
predict an increased risk of these events in the future.
IMPACTS ON AGRICULTURE
Resource-based industries such as mining, agriculture, forestry, fishing Additionally, drastic economic impacts at a community level can be
and hunting are a relatively small contributors to Canadian GDP masked by these aggregate analyses. Certain communities are highly
(2.1%). However, they remain an important component of foreign trade dependent on natural resources for their income and costs will be
and support Canadian wealth. Being a “cold” country, the economic much larger for these groups, for instance in Aboriginal and Arctic
impacts of climate change in the agricultural sector are estimated to communities, where the subsistence economy makes up between
be slightly positive for Canada. one-quarter and one-half of their total economy.
Under a medium emissions scenario, Canadian prairie agriculture Overall, climate change will bring both benefits and risks to Canadian
(where over 80% of Canada’s agricultural land is located) could gain agriculture. Achieving the projected benefits will depend on the
between 1.14 billion CAD (0.76 billion EUR) and 1.63 billion CAD extent to which farmers adapt and its effectiveness.
(1.08 billion EUR) annually. Relative to the annual value of the Praries’44.2/64.4
2050
SEA LEVEL RISE DAMAGES
Under the current level of coastal protection, by mid century, sea-level
rise and coastal flooding may cost the country 5.8 - 17.9 billion EUR
and 44.2 billion EUR in terms of expected damage to assets in the low
and high emissions scenarios, respectively. 5.8/17.9
By the end of the century, expected losses can increase to between
Sea Level Rise
Expected annual damages
47.4 billion and 64.4 billion EUR under a low emissions scenario and Billion Euro
to 246.9 billion EUR under a high emissions scenario.
246.9
2100
47.4
10.1
2050
RIVER FLOODING DAMAGES
River flooding is projected to result in significant annual damages. By
mid century these are estimated to be 8.8 billion EUR under a low
emissions scenario and 10.1 billion EUR under a high emissions scena- Riverine 8.8
rio. Flooding
Expected annual damages
By the end of the century, damages are projected to be 14.5 billion Billion Euro
EUR under a low emissions scenario and 26.8 billion EUR under a high
emissions scenario. 26.8
2100
14.5
IMPACTS ON FORESTRY AND FISHERY
Forestry is another important sector in Canada which makes up
1.7% of national GDP, or 17 billion EUR and where 10% of the hydropower generation from extremely low water levels in the Great
world's forest cover resides. Climate change is predicted to Lakes and St. Lawrence watershed could reach 1.9 billion EUR. Severe
increase the risks of wildfires, affecting timber supply and increa- weather such as ice storms and coastal storm surges threaten energy
sing costs of fire management. Climate change could cost Canada infrastructure in Canada, particularly in Charlottetown, PEI, and parts
between 25 billion CAD (16.6 billion EUR) under a low emissions of Nova Scotia. A large amount of energy infrastructure is outdated
scenario and 276 billion CAD (183 billion EUR) under a high and will need replacing by 2050 as it was constructed based on older
emissions scenario by 2080 due to reduced timber quantities. weather related assumptions.
IMPACTS ON ENERGY IMPACTS ON TOURISM
Changes in water availability will affect the capacity of hydropower No exact figures are available for the economic impact on the
generation in Canada, and could lead to substantial economic losses. Canadian tourism sector as a whole. However, the overall impact is
Economic impacts of shifts in household and firm energy demand (see expected to be positive for Canada, where higher temperatures might
chapter on energy) are difficult to predict and will mostly lead to extend the summer season. However, a high emissions scenario could
redistribution effects. In the case of Canada, an overall decrease in eliminate over half of the Canadian ski season by the end of the
energy bills is expected due to the heavily reduced heating needs, century, resulting in the loss of over 420 million CAD (278.8 million
which is expected to largely exceed any increase in cooling needs. EUR). The 5 billion CAD (3.3 billion EUR) winter tourism industry is
By 2050, under a worst case climate scenario, the potential losses to also likely to be impacted severely.CANADA
POLICY
OVERVIEW INTERNATIONAL COMMITMENTS
Canada is the 2nd largest country in the world, with a In its 2021 NDC update, Canada strengthened its emissions reduction
population density of 3.9 people per square kilometre. target from a 30% reduction below 2005 levels by 2030 to at least
40-45%.
It accounts for 1.6% of global emissions and in 2018
registered one of the highest rates of GHG emissions
per capita. CLIMATE POLICY
COMMITMENTS CHRONOLOGY
545 740
MtCO2eq MtCO2eq 2002 KYOTO PROTOCOL - 1ST PERIOD
6% in yearly average reduction of GHG over the
four year period 2008-2012, with respect to
1990 levels
2016 PARIS AGREEMENT - 1ST NDC
30% GHG reduction by 2030, with respect to
2005 levels
2021 PARIS AGREEMENT - NDC UPDATE
Between 40% and 45% GHG reduction by 2030,
1990 GHG EMISSIONS 2019 with respect to 2005 levels
INTERNATIONAL CLIMATE The 4th Biennial Report shows that Canada provided 722.54 million USD in climate-specific
development aid in 2017 and 2018, mainly targeting sub-Saharan Africa. More than half of
FINANCE ASSISTANCE which provided in the form of bilateral concessional loans and equity.SUSTAINABLE RECOVERY POLICY ADAPTATION POLICY HIGHLIGHTS
According to the Global Recovery Observatory, in 2020 the proportion TRANSNATIONAL INITIATIVES
of green spending out of total recovery spending was 75%, 60% of
which was allocated to clean energy infrastructure investments. International Upper Great Lakes Study (IUGLS)
Others: 4.387 Billion USD IUGLS was established to improve to outflow regulation of Lake
Superior to better address changing needs and the impacts of future
climate on water flows, water levels, and associated resources
Canada-US agreement on weather and climate
collaboration
The MoU between Canada and US facilitates bilateral cooperation on
249.6 27.25 20.31 activities that promote improved meteorological hydrological and
billion $ billion $ billion $ environmental forecasts and information
Total Spending Recovery Spending Green Spending
NATIONAL INITIATIVES
CCGP
DOMESTIC ADAPTATION POLICY The Earth Science Sector’s Climate Change Geoscience Program
(CCGP) develops geoscience information to help land-use planners,
The Pan-Canadian Framework on Clean Growth and Climate Change industry and regulators to mitigate the climate risks in northern
includes actions to advance climate change adaptation and build resource development
resilience to climate impacts. In December 2020, Canada's federal
government announced its commitment to developing Canada's Climate Lens
first-ever national adaptation strategy (NAS). The Climate Lens is an assessment framework developed to help
decision-makers understand the climate risks with the design,
construction and operation of large infrastructure projects in Canada
Inclusion of Adaptation in NDCs
Integrated Adaptation & Mitigation Policy
SUBNATIONAL INITIATIVES
Domestic
Adaptation Policy
Atlantic Climate Adaptation Solutions (ACASA)
Dedicated Adaptation Strategy ACASA is a partnership among the provincial governments and
Dedicated Adaptation Plan regional stakeholders including NGO, tribal governments, and industry
to jointly address regional climate change impacts
Sectoral Adaptation Plans First Nation Adapt Program
Subordinate The program prioritizes First Nation communities most impacted by
Adaptation Policies Subnational Adaptation Plans climate change (sea level rise, flooding, forest fires, drought, fisheries
and winter road failures), by providing funds to assess the impacts on
infrastructures and to reduce disaster risk
Policy not in place Active policy
ENERGY TRANSITION Energy Transition Fossil Fuels
Canada shows an Energy Transition index about 5 points above the G20 average: this 58.7 45.3
is mainly due to an outstanding performance in Renewables penetration (more than
twice the average). Emissions, Efficiency and Fossil Fuels indicators also contribute 48.1
63.2
to the transition, being slightly above or below the average.
On the contrary, looking at the Electrification indicator, there is still room for impro- Renewables Efficiency
vement: the ongoing digitalization of the grids could spark energy consumption
patterns in both residential and transport sectors.
19.7 84.9
46.0 84.5
Only actively pursuing an energy transition based on decarbonization and Electrification Emissions
electrification – from policy and regulation, to health and education – will
enable countries to benefit the most from future opportunities and fight
G20 72.9
AVERAGE climate change whilst ensuring an equitable distribution of wealth. 70.8 72.9
COUNTRY
The Energy Transition indicators were developed by Enel Foundation in
cooperation with SACE, and provide a retrospective analysis based on 63.4 73.9
historical data.You can also read