Clean Air in Maryland 2020 - Maryland Department of the ...

Page created by Yvonne Chapman
 
CONTINUE READING
Clean Air in Maryland 2020 - Maryland Department of the ...
Clean Air
   in
Maryland
    2020
Clean Air in Maryland 2020 - Maryland Department of the ...
Maryland Department of the Environment
Air and Radiation Administration
1800 Washington Boulevard
Baltimore, Maryland 21230
https://mde.maryland.gov/programs/Air

                    2
Clean Air in Maryland 2020 - Maryland Department of the ...
3
Clean Air in Maryland 2020 - Maryland Department of the ...
Clean air highlights
Maryland’s air quality continues to improve. Emissions of air pollutants continue to
decrease because of Maryland and federal regulations, improvements in technology and
good operating practices from businesses. These impacts are experienced within the state and
extend throughout the northeastern states.
For nearly 30 years, Maryland’s air quality has dramatically improved.             Since 2010, particle levels throughout the state of Maryland have met
Air quality policies and regulations have lowered levels of six common             both the daily and annual air quality standards. These levels continue
pollutants — particles, ozone, lead, carbon monoxide, nitrogen dioxide,            to trend downward each year, with 2019 levels being the lowest ever re-
and sulfur dioxide — as well as numerous toxic pollutants. Reductions              corded. Particle levels in Maryland are at levels below what the scientific
of these harmful pollutants have brought dramatic improvements in the              and environmental community are considering for a new, more pro-
quality of the air that we breathe. Public health is better protected. These       tective national particle standard. Reductions in particle pollution are
improvements in our air quality have allowed Maryland to meet most of              strongly linked to lower mortality rates, improvements in lung growth
the national air quality standards set to protect public health and the en-        and development in children and lower risk for chronic lung disease in
vironment.                                                                         adults. Improvements in particle pollution have largely been attributed
                                                                                   to reductions in SO2 and NOx from power plants and other industrial
Beyond these achievements, Maryland continues the progress towards re-
                                                                                   sources.
alizing attainment of the most pervasive air pollutant, ground-level ozone
or smog. In recent years, Maryland has achieved the federal 2008 ozone             Maryland’s environment continues to benefit from reduced NOx emis-
standard and is moving closer towards achieving the more stringent 2015            sions from power plants and other large industrial sources. Reducing
ozone standard. In 2019, Maryland recorded the second-fewest number of             NOx emissions not only helps reduce ozone and fine particle air pollu-
bad ozone days ever recorded in a year. The key impediment that affects            tion but also helps reduce nitrogen deposition to the Chesapeake Bay
Maryland’s ability to achieve this standard is nitrogen oxide (NOx) emis-          and regional haze. About one-third of the nitrogen pollution in the bay
sions, which are both produced locally and transported into Maryland               comes from airborne nitrogen deposition.
from other states.
                                                                                   Transportation programs and policies designed to reduce NOx emis-
NOx pollution is emitted from vehicle exhaust, and the burning of fos-             sions, like the Maryland Clean Car Program and the Tier 2 and 3
sil fuels, especially from electric power plants. The combustion of coal at        Vehicle and Fuel Standards, have resulted in significant air quality ben-
electric generating plants and industrial facilities produces a large por-         efits, including the mitigation of greenhouse gas (GHG) emissions that
tion of NOx pollution as well as another pollutant, sulfur dioxide (SO2).          contribute to climate change.
Thanks to regulatory efforts, particularly the Maryland Healthy Air Act
                                                                                   The state continues to be a leader in addressing climate change. With
and Maryland’s 2015 NOx regulation for coal-fired power plants, NOx and
                                                                                   3,100 miles of tidal shoreline, many of which include sensitive ecosys-
SO2 emissions from coal combustion have been reduced by 90% and 95%,
                                                                                   tems, Maryland is disproportionately vulnerable to sea-level rise, one
respectively, since 2002.
                                                                                   of the major consequences of climate change. In response, the state has
The vast majority of Maryland has consistently measured SO2 concentra-             adopted the Greenhouse Gas Emission Reduction Act (GGRA) and
tions below the 2010 SO2 standard, however a portion of Baltimore and              MDE, working with the Maryland Climate Change Commission, has
Anne Arundel counties is currently designated as nonattainment for the             developed a framework to address the issue. MDE is preparing a final
standard. Despite the nonattainment designation, the area has consistently         plan to reduce GHG emissions by at least 40% by 2030 compared to a
measured SO2 concentrations far below the standard and is likely to be             2006 baseline.
re-designated as attainment. To ensure compliance with the standard the
                                                                                   In addition to regulating emissions from specific sources, Maryland is
Maryland Department of the Environment (MDE) has placed additional
                                                                                   also engaged in several legal actions designed to reduce air pollution
SO2 limitations on emissions in the area.
                                                                                   from other states and to strengthen federal policies that are critical to
Another area in Western Maryland, near a recently closed paper mill, is            support our efforts. For more information about air quality in Maryland:
expected to be designated as attainment for the SO2 standard. With this            https://mde.maryland.gov/air
final designation, all of Maryland should comply with the health benefits
of the SO2 standard.

                                                                               4
Clean Air in Maryland 2020 - Maryland Department of the ...
Concentrations of Harmful Pollutants Continue to Decline
While ozone air pollution is a persistent problem in Maryland, all other air pollutants are below federal standards and concentrations continue to drop
across the state. Ozone levels also continue to get lower and lower each year. The following chart illustrates the concentrations of air pollutants relative to
the current National Ambient Air Quality Standard (NAAQS) for Maryland.
 60%

 40%

 20%

                                                                                                                                                                                                                                                               NITROGEN                           DIOXIDE                       (NO2)                    ANNUAL                        16%            (FROM                    2008)
    0                     Current Standard

                                                                                                                                                                                                                                                               NITROGEN                           DIOXIDE                       (NO2)                    1-HOUR                        8%          (FROM                  2009)
-20%

                                                                                                                                                                                                                                                                                                                                       OZONE                    (O3)                   21%
-40%

                                                                                                                                                                                                                                                                                      PARTICLES                              ( P M 2.5)                  ANNUAL                        53%
-60%
                                                                                                                                                                                                                                                                                    PARTICLES                            ( P M 2.5)                24-HOUR                             51%
-80%
                                                                                                                                                                                                                                                                      SULFUR                      DIOXIDE                       (SO2)                    1-HOUR                        88%

-100%

                          2002 2003 2004 2005 2006 2007 2008 2009 2010 2011 2012 2013 2014 2015 2016 2017 2018 2019
                                                                                                                                                               2019 data are preliminary

The Levels of Air Toxics Have Been Significantly Reduced
Hazardous air pollutants (sometimes called air toxics) are those known to cause cancer and other serious health impacts. Over the last 25 years, Maryland
has generally cut concentrations of air toxics by 50%. Examples of the progress Maryland has seen are shown with the four toxic air pollutants below: 1,3
Butadiene, Benzene, Ethylbenzene, and Toluene. All four compounds show more than a 50% reduction in concentration. 1,3 Butadiene, a compound mostly
associated with vehicle exhaust, has been essentially eliminated in recent years. While there is work to be done on other compounds, generally a downward
trend continues and MDE is committed to further reducing toxic air pollution.

                          0.20                                                                                                                                                                                                            0.8

                          0.18                                               1,3 Butadiene                                                                                                                                                0.7
                                                                                                                                                                                                                                                                                                         Benzene
                          0.16
                                                                                                                                                                                                                                          0.6
                          0.14
                                                                                                                                                                                                                    Annual Median (ppb)

                                                                                                                                                                                                                                          0.5
                          0.12
    Annual Median (ppb)

                          0.10                                                                                                                                                                                                            0.4

                          0.08
                                                                                                                                                                                                                                          0.3

                          0.06
                                                                                                                                                                                                                                          0.2
                          0.04

                          0.02                                                                                                                                                                                                            0.1

                          0.00
                                                                                                                                                                                                                                          0.0
                                 1995
                                        1996
                                               1997
                                                      1998
                                                             1999
                                                                    2000
                                                                           2001
                                                                                  2002
                                                                                         2003
                                                                                                2004
                                                                                                       2005
                                                                                                              2006
                                                                                                                     2007
                                                                                                                            2008
                                                                                                                                   2009
                                                                                                                                          2010
                                                                                                                                                 2011
                                                                                                                                                        2012
                                                                                                                                                               2013
                                                                                                                                                                      2014
                                                                                                                                                                             2015
                                                                                                                                                                                    2016
                                                                                                                                                                                           2017
                                                                                                                                                                                                  2018
                                                                                                                                                                                                         2019

                                                                                                                                                                                                                                                1995
                                                                                                                                                                                                                                                       1996
                                                                                                                                                                                                                                                              1997
                                                                                                                                                                                                                                                                     1998
                                                                                                                                                                                                                                                                            1999
                                                                                                                                                                                                                                                                                   2000
                                                                                                                                                                                                                                                                                          2001
                                                                                                                                                                                                                                                                                                 2002
                                                                                                                                                                                                                                                                                                        2003
                                                                                                                                                                                                                                                                                                               2004
                                                                                                                                                                                                                                                                                                                      2005
                                                                                                                                                                                                                                                                                                                             2006
                                                                                                                                                                                                                                                                                                                                    2007
                                                                                                                                                                                                                                                                                                                                           2008
                                                                                                                                                                                                                                                                                                                                                  2009
                                                                                                                                                                                                                                                                                                                                                         2010
                                                                                                                                                                                                                                                                                                                                                                2011
                                                                                                                                                                                                                                                                                                                                                                       2012
                                                                                                                                                                                                                                                                                                                                                                              2013
                                                                                                                                                                                                                                                                                                                                                                                     2014
                                                                                                                                                                                                                                                                                                                                                                                            2015
                                                                                                                                                                                                                                                                                                                                                                                                   2016
                                                                                                                                                                                                                                                                                                                                                                                                          2017
                                                                                                                                                                                                                                                                                                                                                                                                                 2018
                                                                                                                                                                                                                                                                                                                                                                                                                        2019

                                                                    HU-Beltsville                               Essex                               Old Town                                                                                                                       HU-Beltsville                              Essex                              Old Town

                                                                             Ethylbenzene                                                                                                                                                                                                                  Toluene
                          0.30                                                                                                                                                                                                            1.8

                                                                                                                                                                                                                                          1.6

                          0.25
                                                                                                                                                                                                                                          1.4

                          0.20                                                                                                                                                                                                            1.2
                                                                                                                                                                                                                    Annual Median (ppb)
    Annual Median (ppb)

                                                                                                                                                                                                                                          1.0

                          0.15
                                                                                                                                                                                                                                          0.8

                          0.10                                                                                                                                                                                                            0.6

                                                                                                                                                                                                                                          0.4

                          0.05
                                                                                                                                                                                                                                          0.2

                          0.00                                                                                                                                                                                                            0.0
                                                                                                                                                                                                                                                1995
                                                                                                                                                                                                                                                       1996
                                                                                                                                                                                                                                                              1997
                                                                                                                                                                                                                                                                     1998
                                                                                                                                                                                                                                                                            1999
                                                                                                                                                                                                                                                                                   2000
                                                                                                                                                                                                                                                                                          2001
                                                                                                                                                                                                                                                                                                 2002
                                                                                                                                                                                                                                                                                                        2003
                                                                                                                                                                                                                                                                                                               2004
                                                                                                                                                                                                                                                                                                                      2005
                                                                                                                                                                                                                                                                                                                             2006
                                                                                                                                                                                                                                                                                                                                    2007
                                                                                                                                                                                                                                                                                                                                           2008
                                                                                                                                                                                                                                                                                                                                                  2009
                                                                                                                                                                                                                                                                                                                                                         2010
                                                                                                                                                                                                                                                                                                                                                                2011
                                                                                                                                                                                                                                                                                                                                                                       2012
                                                                                                                                                                                                                                                                                                                                                                              2013
                                                                                                                                                                                                                                                                                                                                                                                     2014
                                                                                                                                                                                                                                                                                                                                                                                            2015
                                                                                                                                                                                                                                                                                                                                                                                                   2016
                                                                                                                                                                                                                                                                                                                                                                                                          2017
                                                                                                                                                                                                                                                                                                                                                                                                                 2018
                                                                                                                                                                                                                                                                                                                                                                                                                        2019
                                 1995
                                        1996
                                               1997
                                                      1998
                                                             1999
                                                                    2000
                                                                           2001
                                                                                  2002
                                                                                         2003
                                                                                                2004
                                                                                                       2005
                                                                                                              2006
                                                                                                                     2007
                                                                                                                            2008
                                                                                                                                   2009
                                                                                                                                          2010
                                                                                                                                                 2011
                                                                                                                                                        2012
                                                                                                                                                               2013
                                                                                                                                                                      2014
                                                                                                                                                                             2015
                                                                                                                                                                                    2016
                                                                                                                                                                                           2017
                                                                                                                                                                                                  2018
                                                                                                                                                                                                         2019

                                                                HU-Beltsville                                 Essex                              Old Town                                                                                                                          HU-Beltsville                              Essex                              Old Town

                                                                                                                                                                                                                5
Clean Air in Maryland 2020 - Maryland Department of the ...
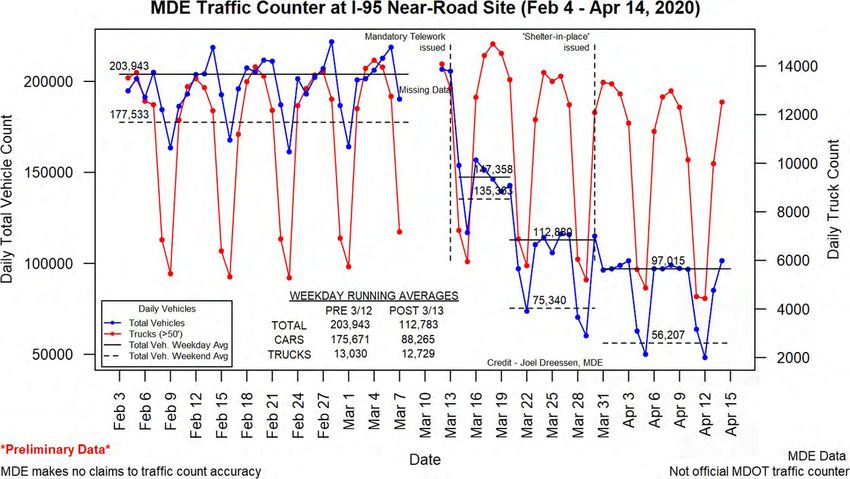
Severe, Multi-day Ozone Episodes Are Fewer, Sporadic and Briefer
The 2019 ozone season continued the trend of cleaner air across the state. In
2019, Maryland air quality monitors recorded ozone concentrations great-
er than the NAAQS of 70 parts per billion (ppb) on just 14 days. The only
year that experienced fewer ozone days than 2019 was 2014, when there were             2019
only 11 days with ozone concentrations above the NAAQS. Historically, on
most days when high levels of ozone occurred, numerous air quality monitors
throughout the state would record unhealthy ozone pollution. As air quality
continues to improve, the concentration of pollution, geographic scope and
duration of ozone episodes have been dramatically reduced. In 2019, half of
the 14 days that ozone exceeded the NAAQS involved just one or two of the 20
ozone monitors located in Maryland. This indicates that those ozone exceed-
ances were only occurring in a small area and that the majority of the state was
observing ozone concentrations in the moderate or good range.

Variations in weather conditions play an important role in determining ozone
                                                                                       2015
concentrations. Precipitation across Maryland saw a unique split between the
first half and second half of the 2019 ozone season. The first half of the sea-
son experienced above average rainfall with ozone transport patterns most-
ly unfavorable for high ozone concentrations. The first day where ozone in
Maryland climbed above the NAAQS was not until June 26, setting a record as
the latest initial ozone exceedance day by more than a month. High ozone pat-
terns became more common during the second half of the season as weather
conditions began to dry out. The total number of days during the ozone sea-
son when the maximum temperature reached or exceeded 90oF at Baltimore/
Washington International Thurgood Marshall Airport was 59, nearly double               2010
the typical average. However, despite temperatures well above average across
the state, a near-record low number of days above the ozone NAAQS occurred.

The maps to the right illustrate the improving ozone air quality over the past
19 years. In 2000, the dark reds and purples indicate pervasive high ozone con-
centrations throughout Maryland. Improvements occurred as federal and state
policies were implemented to reduce ozone forming emissions. The areas in
yellow and orange above the ozone NAAQS continue to shrink, illustrating the
continued success of these programs. These maps also demonstrate a large re-
duction in the health risk from ozone as both ozone concentrations and spatial
exposure have been greatly reduced.                                                    2005

   Meets Standard Exceeds Standard

           110

                                                                                       2000

                                                                                   6
Clean Air in Maryland 2020 - Maryland Department of the ...
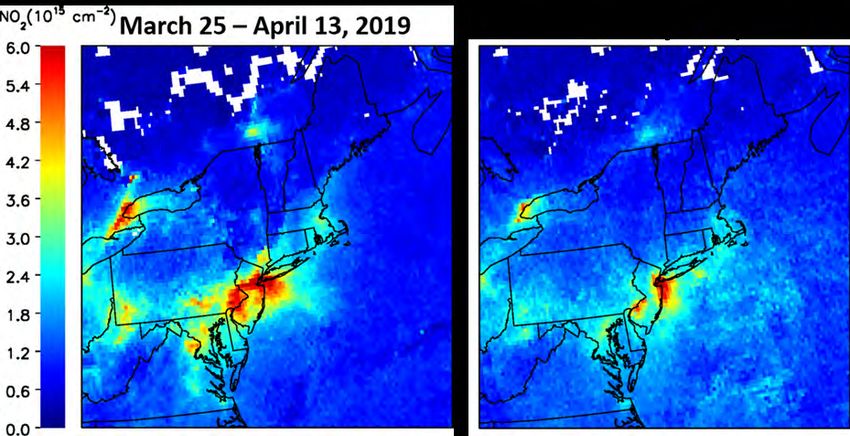
NOx Reductions from Coal-Fired                                                   Observing Air Quality with Satellites
Power Plants                                                                     A modern approach to studying air pollution is with the use of satellite im-

Coal-fired power plants have significantly reduced NOx emissions over the        agery. Satellites are now used to track pollution moving across the country

past 20 years. Federal pollution trading programs and state driven NOx re-       from one state to another. MDE has been collaborating with the scientific

duction programs have resulted in reduced average NOx emissions during           community for more than 20 years in an effort to address the state’s air qual-

the ozone season. Beginning in 2009, Maryland’s Healthy Air Act imposed          ity concerns. Most recently, MDE has been collaborating with the National

strict annual and ozone season NOx, SO2, and mercury emission limits on          Aeronautics and Space Administration (NASA) to determine how new

Maryland’s largest power plants.                                                 satellites can be used to understand, track, and pinpoint air quality issues.
                                                                                 The Tropospheric Ozone Monitoring Instrument (TROPOMI) has been
Maryland’s 2015 NOx regulation for coal-fired power plants built upon            the latest in a series of satellites that are revolutionizing the way regulatory
the Maryland Healthy Air Act by requiring power plants to minimize               agencies monitor air quality. TROPOMI gives the best satellite resolution
NOx emissions every day of the ozone season by optimizing and operat-            to date of nitrogen dioxide, a key ozone precursor, allowing researchers to
ing existing pollution control equipment and by lowering emission rates to       visualize air pollution in great detail, sometimes even identifying individual
achieve increasingly stringent standards by 2020. During the 2020 ozone          polluting facilities.
season, coal-fired power plants will need to be controlled by state-of-the-art
Selective Catalytic Reduction (SCR) control technology, convert to cleaner       As an example of how satellites are currently assisting state agencies such as

natural gas or meet stringent system-wide NOx emission limits equivalent to      MDE, below is a snapshot of the eastern United States on July 1, 2019, the

those achieved by SCR controls on all units.                                     day before a widespread ozone event on July 2, 2019, in the Mid-Atlantic
                                                                                 region. The satellite image clearly shows long range transport of NO₂ (red/
Since the 2015 rule was implemented, Maryland’s coal-fired power plants          warm colors in the image) from the Midwest towards the East Coast con-
have recorded their lowest NOx emissions ever. As more electricity is gener-     tributed to the high-ozone event.
ated by renewable energy sources or by using cleaner fuels like natural gas,
dependence on coal-fired generation will decrease.

Municipal Waste Combustors
On December 6, 2018, MDE adopted updated regulations for munici-
pal waste combustors. These new regulations require that Maryland’s two
large incinerators (Wheelabrator Baltimore, Inc. and Montgomery County
Resource Recovery Facility) meet stringent NOx emission rates, which
will result in the reduction of approximately 200 tons of NOx emissions
each year. These regulations were developed to address federal Clean Air
Act (CAA) statutes that require Maryland to update Reasonably Available
Control Technology (RACT) regulations.
                                                                                 One current limitation of these satellites is that only one picture of an area
As part of the regulatory requirements, Wheelabrator was required to de-         per day is taken, giving a “snapshot” in time. While informative, this snap-
velop a feasibility analysis of new control technologies that could further      shot misses daily pollutant and emissions variability. NASA is now preparing
reduce NOx emissions. Wheelabrator submitted the analysis to MDE on              for the 2022 launch of the Tropospheric Emissions: Monitoring Pollution
December 27, 2019, for review and consideration of potential new NOx             (TEMPO) satellite. TEMPO will provide unsurpassed, daylight coverage of
emission limits for the facility.                                                pollution in the atmosphere. Current satellites such as TROPOMI are polar
                                                                                 orbiting, meaning they track over the North Pole and South Pole 24 times
                                                                                 a day while the earth rotates beneath them. By contrast, TEMPO will be a
                                                                                 geostationary satellite that will remain stationary in relation to a fixed point
                                                                                 on the surface, allowing pollution to be tracked hour by hour.

                                                                            7
Clean Air in Maryland 2020 - Maryland Department of the ...
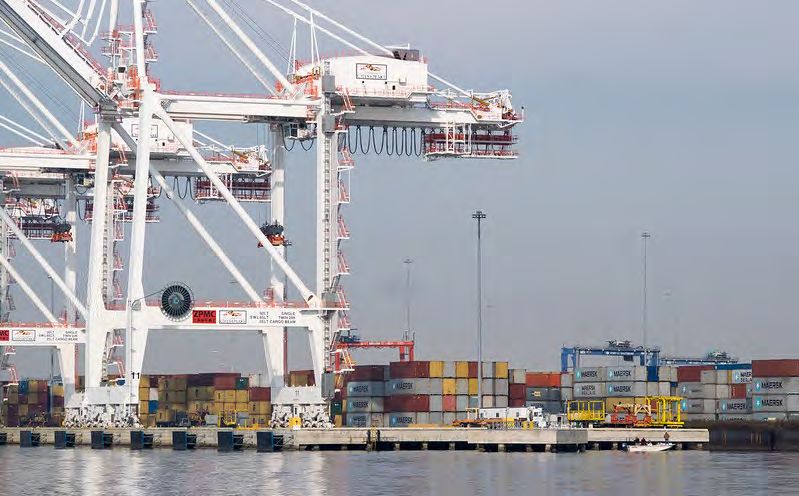
Clean Air and Transportation

Cars today and the fuels that power them are significantly cleaner than they   The gasoline used in our vehicles has also changed and is providing signif-
were just a decade ago. However, there are more vehicles on Maryland roads     icant air quality benefits. Reformulated gasoline (RFG) is used in much of
now, and those numbers will continue to increase. We are also now driving      Maryland. RFG is blended to burn more cleanly than conventional gasoline
more miles commuting to work and for recreation than we have in the past.      and to reduce smog-forming and toxic pollutants in the air we breathe. RFG
With the growth in the number of vehicles on the road and reductions from      also reduced the amount of benzene in gasoline. In 2017, the sulfur level in
power plant emissions, pollution from mobile sources are now the largest       gasoline was also lowered. This sulfur reduction is important because it will
contributing source category to Maryland’s ozone and climate change prob-      make emissions control systems, like the catalytic converter, more effective
lems. Despite these challenges, Maryland has been at the forefront in regu-    and allow the development and use of more advanced emissions controls.
lating ozone-forming and toxic pollutants from vehicles and fuels and will
continue to drive down emissions from this category.                           Mobile Source Related Federal Rollbacks
Changes to the vehicles we drive and the fuels that power them have had a      Recent federal vehicle rules introduced by the EPA and the National
significant impact on reducing ozone, GHGs and toxic emissions. In 2007,       Highway Traffic Safety Administration, known as the Safer Affordable Fuel-
MDE adopted regulations implementing the California Clean Car emis-            Efficient (SAFE) Vehicle Rule, will result in a weakening of existing auto
sions standards for new vehicles that dramatically lowered the amount of       emission standards adopted by previous administrations. Along with re-
emissions coming from the tailpipe as the fleet turns over. Adopting the       ducing the stringency of GHG emission standards for vehicles, EPA sought
California program reduced tailpipe emissions from our cars more than the      to remove California’s, and the other states that have adopted California’s
existing federal standards at that time. This program also was the first to    Low Emission Vehicle (LEV) Program, authority to enforce GHG emis-
reduce GHG emissions while improving fuel economy. Additionally, MDE           sion standards as well as the Zero Emission Vehicle (ZEV) standards. EPA’s
worked with other state and regional stakeholders to get the federal govern-   Final Rule intends to withdraw the waiver EPA granted to California and
ment to adopt national fuel economy standards that mirrored California’s,      the other states that have opted into the California program to enforce
providing further reductions in harmful pollutants. The federal government     provisions of California’s LEV Program that relate to GHG emissions and
has recently finalized a rule to rollback these new car emission standards.    the ZEV Program. Removing Maryland’s ability to enforce these programs
MDE will continue to fight to maintain these important health and envi-        drastically impacts our efforts to transition to a cleaner, zero, or near-zero
ronmental benefits.                                                            emission transportation sector. California, Maryland and other states have

                                                                               8
Clean Air in Maryland 2020 - Maryland Department of the ...
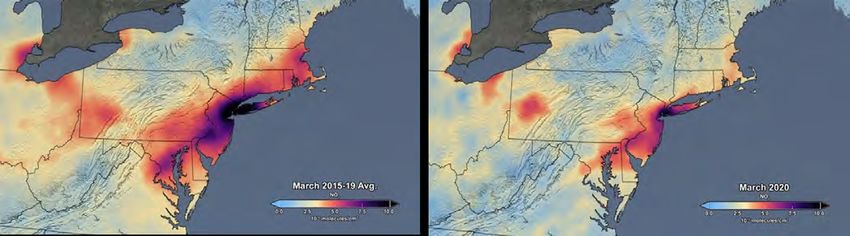
challenged EPA over the rollback of previously adopted standards and its
                                                                                 Idle Free Maryland
authority to revoke the California waiver. Numerous states have recently
                                                                                 Since 2018, MDE has run its Idle Free MD program, a partnership between
begun efforts to adopt California’s Clean Car Standards, including adopting
                                                                                 the state, the private sector and Maryland schools. The program is designed
the ZEV standards. Once all of these states have adopted the rules, the total
                                                                                 to reduce unnecessary idling of vehicles. MDE is working with individual
number of states with California’s emission standards will rise to 16, as well
                                                                                 schools, many of which are Green Schools, to assist in implementing their
as Washington D.C.
                                                                                 own idle reduction strategies. Green Schools is a program administered
The Volkswagen Mitigation Plan                                                   by the Maryland Association for Environmental and Outdoor Education
                                                                                 (MAEOE) that empowers youth, communities and schools to evaluate and
As a result of Volkswagen violating the CAA by installing software designed
                                                                                 improve their efforts in environmental sustainability. In addition to working
to defeat vehicle emissions standards, numerous legal settlements required
                                                                                 with Maryland schools, MDE has been actively working with the Maryland
the automaker to buy back or modify affected vehicles and mitigate pollution
                                                                                 Motor Truck Association (MMTA) through education and outreach to driv-
through investments that support ZEV technology. Under Maryland’s por-
                                                                                 ers in implementing idle reduction strategies.
tion of the settlement agreement, Maryland is eligible to authorize spending
of $75.7 million for specifically defined mitigation projects to remediate the   Program resources are available to help spread the word about the health,
excess NOx emissions. Maryland’s mitigation plan places priority on electric     economic and environmental benefits of reducing vehicle idling. The cam-
vehicle charging infrastructure and the replacement of older, dirty diesel en-   paign includes a toolkit with a variety of products, including fact sheets,
gines with new, cleaner technologies. Electric buses and heavy-duty equip-       social media materials, pledge sheets, posters, policies and other material.
ment such as trucks, boats and locomotives are also potential projects that      For more information and the toolkit: https://mde.maryland.gov/programs/
are eligible for funding. Maryland’s first phase of the program funds electric   Air/MobileSources/idlefreeMD/Pages/index.aspx.
and propane school buses. MDE hopes to have all mitigation effort awards
announced by the end of summer 2020.

Port of Baltimore Inter-Agency Partnership
The Maryland Department of Transportation (MDOT), the Maryland Port
Administration (MDOT-MPA) and MDE continue to work on efforts to
reduce emissions and increase energy efficiency at and around the Port
of Baltimore. MDOT-MPA received a $1.8 million EPA Diesel Emission
Reduction Act (DERA) grant to continue with the replacement of dray
trucks, cargo handling equipment, and cranes.

To date, more than $19 million has been invested into diesel emission re-
duction activities at the port. These projects will reduce thousands of tons
of air pollutants including NOx, fine particles, hydrocarbons and carbon
monoxide. These projects result in significant reductions in GHG emissions,
primarily carbon dioxide (CO2) and black carbon. Part of the Volkswagen
mitigation funding will be used for port projects.

The partnership continues to engage with community groups, give tours
to community members, invite private port tenants to the workgroup’s
meetings, and participate in the Baltimore Port Alliance Environmental
Committee’s compliance assistance efforts.

                                                                             9
Clean Air in Maryland 2020 - Maryland Department of the ...
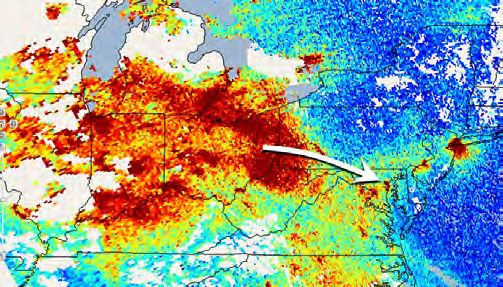
Legal Efforts to Address
     Transported Air Pollution

For many years, Maryland has been actively engaged in numerous efforts            Maryland has also petitioned the Ozone Transport Commission (OTC) un-
to reduce the amount of air pollution crossing into our communities from          der Section 184(c) of the CAA in an attempt to further address regional
neighboring states. Up to 70% of ozone and fine particle air pollution in         transported air pollution. Under Section 184(c), any state within the Ozone
Maryland originates in an upwind state. Cooperative efforts through region-       Transport Region (OTR) may petition the OTC to develop recommenda-
al planning organizations, support and participation in the development of        tions for additional control measures to be applied within all or a part of
national rules addressing transported pollution and leading by example            the OTR. Section 184 of the CAA itself established a single transport region
have helped to reduce transported pollution, but more regional efforts are        for ozone—the OTR— covering portions of the northeast and mid-Atlan-
required for Maryland to meet our clean air goals. After exhausting coop-         tic. Maryland completed an analysis of excess emissions from Pennsylvania
erative means to achieve clean air, Maryland has engaged in several legal         coal-fired power plants in 2017 and 2018 and concluded that Pennsylvania
actions designed to reduce air pollution from other states and to strengthen      air quality rules still allow excess NOx emissions on a daily basis, up to an
federal policies that are critical to support our efforts.                        excess of 47 tons per day.

One of the tools in the CAA for addressing transported pollution is Section       In 2016, EPA finalized an update to the Cross-State Air Pollution Rule
126. Section 126 gives a state the authority to ask EPA to set emissions limits   (CSAPR) which is intended to reduce summertime NOx emissions from
for specific sources of air pollution in other states that significantly affect   power plants in 22 states in the eastern U.S. and reduce air quality impacts
the air quality in the petitioning state. In 2016, Maryland submitted a 126       of ozone pollution that crosses state lines. Maryland joined with many
petition to EPA requesting that it require 19 power plants with 36 generation     other East Coast states and sued EPA over a related rule called the CSAPR
units in five upwind states to run their already installed pollution control      Closeout. This case has already been heard by the courts. In general, the
technology. EPA denied Maryland’s 126 petition, and on October 15, 2018,          courts have ruled on two key issues: that the CSAPR rule did not fully ad-
Maryland sued EPA in the United States Court of Appeals. Maryland’s 126           dress transport and that the CSAPR Closeout rule could not be used by
petition clearly demonstrates that there are large, immediately available and     upwind states as a complete transport remedy. EPA has been required to fix
cost-effective NOx emissions reductions that can be achieved by requiring         the issues identified by the courts as being illegal.
upwind power plant units to run their pollution controls effectively every
day during the summer ozone season.

                                                                              10
Addressing Climate Change
   in Maryland

Greenhouse Gas Reduction Efforts                                                  increased economic output in the state by 2030, and the creation of more
                                                                                  than 11,000 jobs as a result of these proposals.
Maryland is facing significant challenges in dealing with climate change.
As a state, we are lowering our GHG emissions and working on building             The draft 2020 GGRA Plan uses various strategies, programs, and initiatives
the capacity to adapt to the consequences that climate change has already         that the state is developing and implementing to meet the emissions reduc-
caused. Maryland is proud to be a leader in the effort to tackle global climate   tion and economic benefit goals. Some of these strategies are already being
change issues. Our state leadership has passed two laws that require aggres-      fully implemented, while others are in an earlier phase of the implementa-
sive action on stemming climate change. The most current law, passed in           tion process. The suite of programs covers multiple sectors, including elec-
2016, reauthorized the GGRA. Through this law, MDE is in the process of           tricity, transportation, agriculture, forestry, buildings, waste management,
finalizing a detailed and comprehensive plan to reduce our GHG emissions          and additional non-specific sectors. The plan also includes many partner-
by a minimum of 40% from 2006 levels by 2030 while positively impacting           ships with key stakeholders like the private sector, underserved communi-
the state’s economy and creating jobs. The draft plan also begins to establish    ties, state universities, and the Port of Baltimore.
a road map for the state to achieve much deeper reductions, or carbon neu-
                                                                                  The key programs included in the 2020 plan will build off of previous plans.
trality, by the 2050 timeframe.
                                                                                  Maryland’s actual GHG emissions in 2017, which brought favorable weath-
In 2019 and early 2020, MDE drafted and submitted a comprehensive, econ-          er (less demand for electricity to heat and cool buildings) indicate that we
omy-wide plan to dramatically reduce emissions of GHGs that contribute            are meeting our GHG reduction goals. These results are encouraging but
to climate change. The plan will set Maryland on an ambitious path and            continued progress is necessary to ensure we maintain reductions to 2030.
serve as a model for how the nation can respond to climate change while
                                                                                  The core programs in previous plans, along with recommended new pro-
also supporting economic growth. The draft plan incorporates a compre-
                                                                                  grams, voluntary and nontraditional programs, outreach efforts to build
hensive set of more than 100 measures designed to reduce GHG emissions,
                                                                                  public awareness and promote voluntary action, and new technologies, will
including investments in energy efficiency and clean and renewable energy
                                                                                  all contribute to the state’s goal of reducing GHG emissions by 40% by 2030.
solutions, widespread adoption of electric vehicles, and improved manage-
                                                                                  Programs of note include a Clean and Renewable Energy Standard which re-
ment of farms and forests. The draft plan also supports new industries and
                                                                                  quires that an increasingly larger share of Maryland’s electricity be generat-
technologies by encouraging investment in the energy and transportation
                                                                                  ed by zero– and low–carbon resources, expanding the Regional Greenhouse
sectors. MDE estimates that the plan will drive as much as $11.54 billion in

                                                                             11
Gas Initiative (RGGI) cap and invest program, public transit expansion,                                                 require that an increasingly large share of Maryland’s electricity be gener-
    promoting and incentivizing cleaner cars through the ZEV mandate. Also,                                                 ated by zero – and low-carbon resources. Maryland is a member of RGGI,
    continuing to support EmPOWER Maryland which reduces electricity                                                        where emissions from the energy sector are reduced over time and auction
    consumption, passing regulations to phase out the most harmful hydroflu-                                                proceeds fund various state and local programs which promote energy effi-
    orocarbons (HFCs) in foam products and refrigeration equipment, as well                                                 ciency, renewable energy, bill assistance, or other consumer benefits.
    as several important nature-based programs that remove carbon from the
                                                                                                                            Energy Efficiency: Maryland’s EmPOWER Energy Efficiency Program
    atmosphere and sequester it in trees and soil.
                                                                                                                            charges utility customers a monthly fee that is used to fund programs like
                                        
                                     
                                                                                                                            lighting and appliance rebates for homeowners, energy efficiency services
            120                                                                                                             for industrial facilities, home energy assessments, among other incentives.
                                                                    Historic     Goals
                                                                                                                            Maryland’s Weatherization Assistance Program helps eligible low-in-
                              2006 Baseline
            100                                                                                                             come households with the installation of energy conservation materials.
                                                  2011
                                                                2014                                                        Maryland’s energy efficiency resource standard targets 2.9% average in-
               80
                                                                                                                            cremental electric savings per year through 2018. Maryland’s GGRA draft
                                                                                    25 by 20
                                                                                                                            plan proposes to incentivize increased deployment of efficient electric heat
(MMTCO₂e)

               60                         Final 2017 Emissions
                                                                                                                 40 by 30   pumps to heat homes in Maryland. In June 2019, Governor Hogan signed
                                                                                                                            an executive order directing two agencies to develop an initiative to reduce
               40
                                                                                                                            energy consumption in state buildings by 10% by 2029.

               20                                                                                                           Transportation: Maryland is a member of the Transportation Climate
                                                                                                                            Initiative (TCI), a regional effort of 11 Northeast and Mid-Atlantic states
                   0                                                                                                        and Washington, D.C. working to reduce GHG emissions from the region’s
                    2005                      2010                  2015            2020       2025               2030
                                                                                                                            transportation sector. Maryland continues to cooperate with the other
                                                                                                                            TCI states to develop a regional cap-and-invest program for transporta-
    MDE will submit a report in 2022 describing the state’s progress toward
                                                                                                                            tion fuels building from the successful cap-and-invest program for energy
    achieving both the currently mandated GHG reductions, and the long-
                                                                                                                            already being implemented through RGGI. Maryland is also a member of
    term goals as defined by the most up-to-date science regarding emissions
                                                                                                                            the multi-state ZEV Task Force that has a goal of having 60,000 ZEVs on
    reductions needed by 2050 to avoid the most dangerous impacts of climate
                                                                                                                            the road by 2020 and 300,000 ZEVs on the road by 2025. To help develop
    change.
                                                                                                                            the market for ZEV/electric vehicles, Maryland offers the Maryland Excise
                                                  
                                    Maryland Historical Inventory                                                           Tax Credit of up to $3,000 and a rebate of up to 40% for electric vehicle
                    100
                                                                                                                            infrastructure through the Maryland Electric Vehicle Supply Equipment
                         80                                                                     Reference
                                                                                                (no new effort)
                                                                                                                            Rebate. The Maryland Clean Cars Program, discussed above, also achieves
                                                       25% below 2006                                                       significant GHG emission reductions.
                                                       Emissions
            (MMT CO₂e)

                         60

                                                                40% below 2006                                              Resilience: The CoastSmart Communities Program assists Maryland’s
                                                                Emissions                             GGRA Dra� Plan
                         40
                                                                                                                            coastal communities to address short- and long-term coastal hazards, such

                         20
                                                                                                                            as sea level rise, by providing technical assistance and training opportu-
                                                                                                                            nities, along with financial assistance through the Community Resilience
                          0                                                                                                 Grant Program. In 2018, Maryland launched the Climate Leadership
                           2000                 2010                 2020            2030      2040              2050
                                                                                                                            Academy to provide climate training and support to state and local gov-
                                                                                                                            ernment officials, citizens, the private sector, and nonprofits.
    Even as Maryland moves ahead with actions to reduce GHGs, some conse-
    quences of climate change are already under way and will get worse in the                                               Climate Finance: The Maryland Energy Administration’s Energy Finance
    future. Maryland is simultaneously working to adapt to climate impacts                                                  Initiative is a collection of programs, financing tools, and other resourc-
    through adaptation and resiliency programs.More detail on some of the                                                   es that help fill the funding needs of clean energy projects. For example,
    key strategies included in the draft plan are described below.                                                          the Solar Canopy Grant Program combines Maryland’s RPS goal for solar
                                                                                                                            with the state’s ongoing support of electric vehicle infrastructure. This pro-
    Energy: Maryland passed the Clean Energy Jobs Act (CEJA) in May 2019,
                                                                                                                            gram aims to capture the unrealized potential of existing parking facilities
    which sets a 50% renewable portfolio standard (RPS) by 2030. CEJA carves
                                                                                                                            by installing solar photovoltaics while still allowing parking services to be
    out 14.5% of this target for solar development and mandates 1.2 GW of
                                                                                                                            offered.
    offshore wind solicitations. Governor Hogan is looking to propose legisla-
    tion next year to put Maryland on a path of 100% clean electricity by 2040                                              Natural and Working Lands: Maryland established the Maryland Healthy
    through the Clean and Renewable Energy Standard. This initiative would                                                  Soils Program to increase biological activity and carbon sequestration

                                                                                                                            12
in the state’s soils by promoting practices based on emerging soil science,
through incentives, research, education, technical assistance, and financial
assistance for farmers. Maryland is using sustainable forestry management
practices to capture carbon in public and private Maryland forests. These
programs aim to improve sustainable forest management on about 30,000
acres of private land annually and on all state-owned resource lands and to
ensure all state forest lands will be third-party certified as sustainably man-
aged.

Just Transition: MDE and the Regional Economic Studies Institute of
Towson University evaluated the economic dislocations resulting from po-
tential carbon mitigation strategies in the state, including direct impacts to
fossil-fuel-reliant workers, fiscal impacts resulting from industry changes at
the local level, and other related disparities associated with the state’s ef-
forts to reduce GHG emissions. To meet objectives set in the state’s 40 by 30
plan, MDE requested strategies for transitioning impacted fossil-fuel-reliant
workers and mitigating other economic dislocations associated with GHG
reduction efforts.

Short-Lived Climate Pollutants: The increased use of natural gas in homes
and businesses, as well as the increased demand for air conditioning and
refrigeration globally, has been linked to rising emissions of highly potent
GHGs. As a result, Maryland has initiated regulatory efforts to reduce leak-
ing methane emissions from the natural gas industry, the distribution sector
and landfills, and to ban certain highly potent HFCs. Working in collabora-
tion with the United States Climate Alliance, the business community, and
environmental advocates, Maryland may adopt regulations to curb methane
and HFC emissions by the end of the year. When the new rules are in place,
MDE estimates a potential reduction of up to 40% of the currently report-
ed methane emissions in the natural gas transmission and storage segment
and up to a 25% reduction of HFC emissions. Furthermore, Maryland has
begun discussions with stakeholders and utility companies and municipal
solid waste landfill operators to begin the process to adopt GHG mitigation
strategies for leaking pipes and landfill gas.

                                                                              13
OnGoing Air Quality
       & Climate Change Research

For more than 30 years, MDE and the University of Maryland College Park           change. The goal of the research is to help inform policy makers working on
(UMCP) have worked in partnership to conduct policy-relevant research             efforts to further improve air quality and to reduce GHGs. The analyses are
on air quality and climate change. This partnership has often involved            still in a very early stage of development and it is not possible to draw defin-
collaboration with other partners like NASA, the National Institute of            itive conclusions at this time, but the data is extremely interesting.
Standards and Technology (NIST), the National Oceanic and Atmospheric
                                                                                  Through April 14th, the following observation could be made: traffic is
Administration (NOAA), and other universities like Howard University and
                                                                                  way down. In particular, car traffic is dramatically down with only about
the University of Maryland Baltimore County. This collaborative research
                                                                                  half as many light-duty vehicles on I-95. Numbers of semi-truck and large
effort has led to some of Maryland’s and the nation’s most successful efforts
                                                                                  diesel vehicle traffic has persisted, with a slower delayed drop compared to
to reduce air pollution and protect public health.
                                                                                  light-duty vehicles. Satellite data collected by NASA indicates that air pollu-
During the summer of 2018, the Ozone Water-Land Environmental                     tion levels are likely lower than normal. Traffic data and other measurement
Transition Study (OWLETS-2) measurement campaign took place. This                 data suggest that GHG emissions are also lower than normal. Overall elec-
was an intensive collaborative effort to study air quality in and around the      tricity usage in the U.S. is down by only about 7% from seasonally adjusted
northern Chesapeake Bay. MDE and scientists from NASA, NOAA, and                  expected rates (New York Times, page B3, 10 April 2020).
several local universities took air quality measurements from various loca-
                                                                                  The initial and primary analyses of traffic data uses MDE’s roadside monitor-
tions in and around the bay. These measurements provided a much needed
                                                                                  ing station located at the I-95 rest stop between Baltimore and Washington,
three-dimensional view of air pollution over and surrounding the bay and
                                                                                  D.C. The unofficial traffic counts are obtained through a remote sensing in-
has helped scientists better understand how pollutant levels are affected by
                                                                                  strument and are generally consistent with MDOT data. Official statewide
the land-water interface.
                                                                                  analysis from MDOT is under development.
Most recently, in March and April of 2020, MDE has been collaborating
                                                                                  As shown in the figure below, light duty gasoline vehicle traffic (cars and
with UMCP, NASA, NIST, and NOAA with support from MDOT and the
                                                                                  passenger trucks) has dropped dramatically, by at least 50%. Traffic counts
Maryland Department of Natural Resources to learn how reduced traffic
                                                                                  show two clear phases associated with Maryland policies on mandatory
and other changes linked to social distancing during the COVID-19 pan-
                                                                                  telework and shelter-in-place. Over that same time period, truck traffic had
demic are affecting pollutants that contribute to poor air quality and climate
                                                                                  an initial, minor increase for a week. Truck numbers have been dropping

                                                                             14
since then, but by only a smaller percentage. The data also provides a clear opportunity to measure the influence of both gasoline and diesel vehicles on air
quality and climate change at the I-95 site.

The satellite data is also extremely interesting and is a powerful tool to analyze air quality and climate change. NASA works closely with UMCP and MDE on
satellite data analysis. UMCP has been using the OMI (the Ozone Monitoring Instrument) and TROPOMI satellites to look at changes in column nitrogen
dioxide (NO2). These data are directly related to ozone air pollution and are also a good indicator for changes in emissions of combustion sources (power
plants and vehicles). The preliminary data shown below, shows maps of NO2 acquired before and after the COVID-19 pandemic.

                 Average Tropospheric Column NO2 for March 25 – April 13, 2019 (left) and 2020 (right) as Observed by TROPOMI
                                               Data Are Only Used When Cloud Cover is Less Than 30%

                                                                                                                   Credit – Tim Canty, UMCP

                                                                            15
In addition, NASA, one of our federal partners is also analyzing satellite data. The figures below compare measurements of tropospheric NO2 obtained by
the NASA OMI tool in the Mid-Atlantic during March of 2015 to 2019 and in March 2020. Further information about these two figures is available at https://
svs.gsfc.nasa.gov/4810.

The maps below were recently released by NASA and indicate the dramatic reduction in pollution related to fossil fuel combustion. To determine the exact
amount of the reduction related to reduced activity due to the pandemic will require numerical simulations, but these preliminary results provide a sugges-
tion of what the air quality and climate change benefit could be expected if half the light-duty vehicle fleet were replaced by electric cars.

                                          NASA Observations of NO2 Showing Major Decreases in March 2020

NIST operates a network of high precision GHG monitors on towers in the Baltimore Maryland/Washington, DC area. MDE is working with NIST to use
the observations and numerical models to quantify the reduction in emissions due to reduced consumption of fossil fuels driven by the response to the
pandemic.

MDE plans to continue collaborating with its partners to learn as much as it can from this unintended experiment. Future efforts include the analysis of
additional pollutants (NO2, black carbon, ozone, etc.) and GHG trends by MDE and UMCP utilizing MDE’s I-95 roadside site. In coordination with MDOT
additional traffic count data will be analyzed and UMCP measurements of CO2 and methane from the I-95 rest stop site will be made. In addition, UMCP
will also begin flying its research aircraft to measure changes in air pollution and GHGs before and after the pandemic. UMCP is also measuring GHGs, in-
cluding short-lived pollutants, at its on-campus site. MDE and UMCP will also continue to collaborate with NASA and NIST. NASA is focused on collection
and analysis of satellite data and NIST scientists are operating an array of GHG instruments on towers throughout Maryland and the District of Columbia
to quantify the change in emissions of CO2 and methane.

                                                                                16
You can also read